Yucca Mountain climate: Past, present, and future
|
|
|
- Mae Flynn
- 5 years ago
- Views:
Transcription
.")
1 Publications (YM) Yucca Mountain 2007 Yucca Mountain climate: Past, present, and future Saxon E. Sharpe Desert Research Institute, Follow this and additional works at: Part of the Climate Commons, and the Meteorology Commons Repository Citation Sharpe, S. E. (2007). Yucca Mountain climate: Past, present, and future. Available at: This Presentation is brought to you for free and open access by the Yucca Mountain at Digital It has been accepted for inclusion in Publications (YM) by an authorized administrator of Digital For more information, please contact

2 Yucca Mountain Climate: Past, Present, and Future Saxon E. Sharpe Desert Research Institute
3 Why Evaluation of modern climate is necessary to relate climatic events to near-surface processes such as infiltration, runoff, and evapotranspiration. Modern climate information also aids in environmental analyses of repository design facilities and atmospheric dispersion models. Evaluation of past climate regimes, particularly temperature and precipitation, is needed to assess the relation of past climate to past hydrologic conditions. Estimates of potential future climate and hydrology are needed to evaluate repository performance.
4
5

6 Sharpe, S.E., 2007 Using modern through mid- Pleistocene climate proxy data to bound future variations in infiltration at Yucca Mountain, Nevada in Levich, R.A., and Stuckless, J.S., eds., The Geology and Climatology of Yucca Mountain and Vicinity, Southern Nevada and California: Geological Society of America Memoir 199, p. XXX XXX
7 #1 Climate is sequential; the past is the key to the future. Interglacial (Modern) Intermediate Intermediate/ Monsoon Glacial

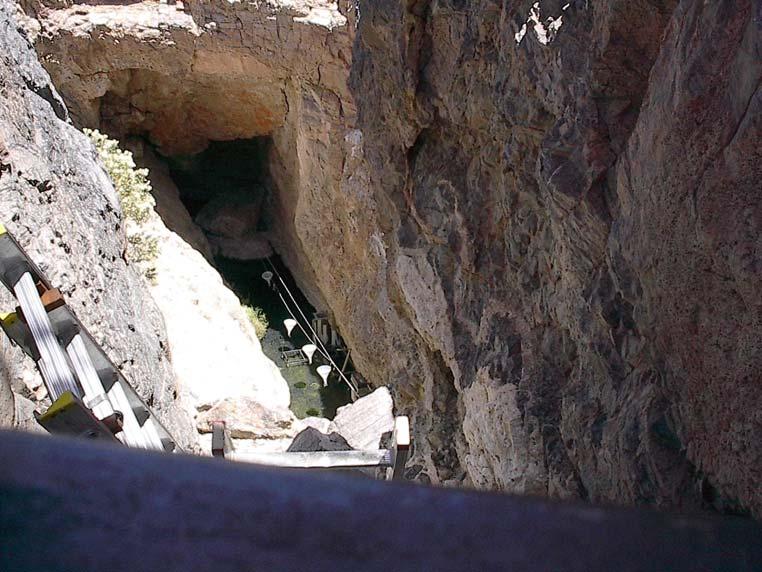
8 Devils Hole, Nevada

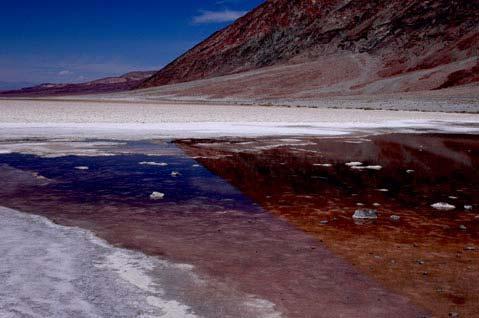
9 Death Valley, California

10 Owens Lake, California


11 Local Records Springs and wetlands Packrat Middens
12 #1 Climate is sequential, the past is the key to the future. Interglacial (Modern) Intermediate Intermediate/ Monsoon Glacial a) Landwehr et al b) Smith et al c) Jannik et al d) Lowenstein et al e) Ku et al f) Prokopenko et al g) Petit et al. 1999
13 Long-Term Climate: The Last 500,000 Years Encompassed higher, sometimes much higher, effective moisture relative to today. Greater effective moisture can mean increased precipitation or decreased temperature or both. During past glacial periods, mean annual temperature may have been as much as 10 to 15 C cooler than present temperatures, with mean annual precipitation as much as times present precipitation. Precipitation was often higher and/or temperature lower in the past because tropical moisture-laden air was coupled with colder air masses over the YM area. Infiltration was commonly higher relative to today because water is stored more readily during periods of greater effective moisture.


14 Eccentricity: changes the annual total radiation received at the top of the earth s atmosphere. ~100,000 yr cycle Obliquity: changes the seasonal and latitudinal distribution of insolation at the top of the earth s atmosphere. ~40,000 yr cycle Precession: change the seasonal and latitudinal distribution of insolation at the top of the earth s atmosphere, but not the total insolation. ~ 22,000 yr cycle


15 Precession and Eccentricity for the last 500,000 Years
16 #2 Relation exists between the timing of long-term climate change and orbital parameters. Chronology: Devils Hole and Orbital Parameters


17 # 3 Characteristics of late Quaternary glacial and interglacial climates differ from each other in a systematic way.


18 Future Climate and Orbital Parameters
19 Modern Meteorological Station Temperature and Precipitation Washington Owens Lake California Spokane Rosalia St. John Beowawe Elko Nevada Chewelah Utah Delta Browning Simpson Montana Lake Yellowstone Wyoming Paleoenvironmental data from Owens Lake, packrat middens, Death Valley, and Las Vegas Valley marsh deposits are used to calibrate magnitude EXPLANATION Meteorological Stations Yucca Mountain Yucca Mountain Regional Meteorological Stations Arizona Nogales New Mexico Hobbs
20 Approach Used Close match between Devils Hole and calculated orbital parameters provides the rationale for past climate being the key to future climate The nature of future climate is based both on the nature of past climate and the assumption of cyclicity The nature of future climate is based on the sequencing and characteristics of past climate Past and future climate may be represented using 4 major climates states

21 DRI s Western Regional Climate Center Yucca Team Met Kelly Redmond, Greg McCurdy, Heather Angeloff, Michelle Breckner


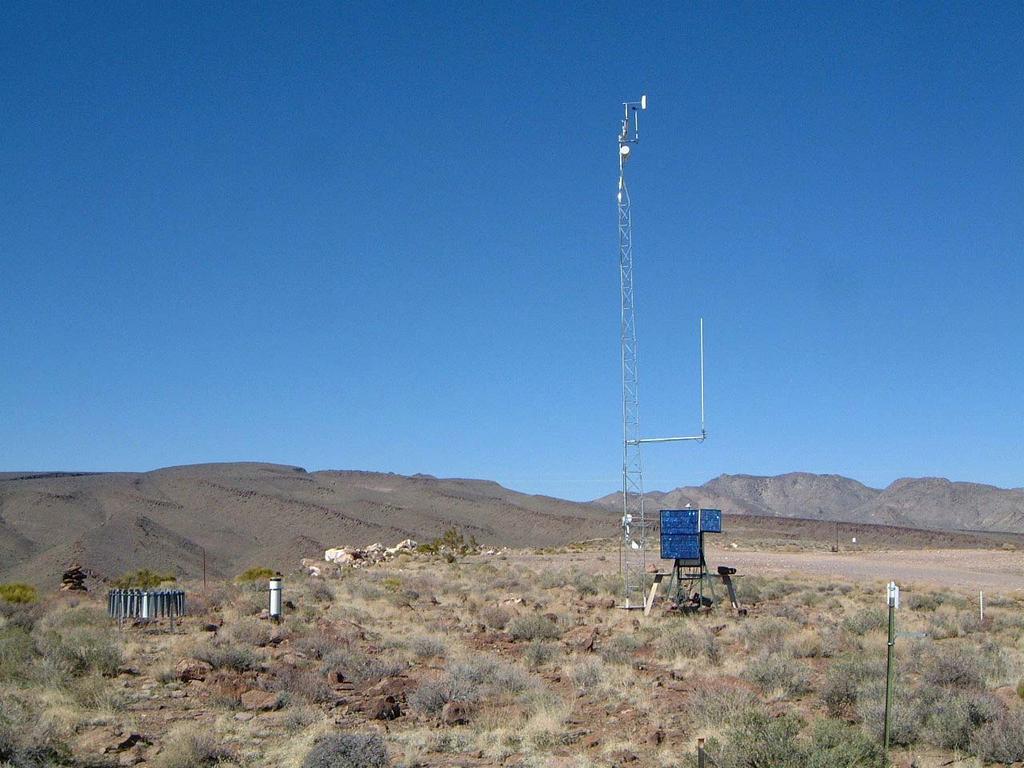
22 Yucca Mountain Stations

23 DTN Source for Station Data
24 Back to: NTS-60 (YMP 1) Nevada NOTE: To print data frame (right side), click on right frame before printing. Daily Summary Daily Summary (with Wind Chill and Heat Index) Daily Summary Time Series Monthly Summary Monthly Summary (w/ Et data) Time Series Graph Wind Rose Graph and Tables Wind Stability/Wind Rose Graph and Tables Hourly Frequency Distribution/Histogram Data Lister Data Inventory (Monthly Graphic) Station Metadata BOLD, Red indicates some data available for month and year Jan Feb Mar Apr May Jun Jul Aug Sep Oct Nov Dec 2005 Jan Feb Mar Apr May Jun Jul Aug Sep Oct Nov Dec 2004 Jan Feb Mar Apr May Jun Jul Aug Sep Oct Nov Dec 2003 Jan Feb Mar Apr May Jun Jul Aug Sep Oct Nov Dec 2002 Jan Feb Mar Apr May Jun Jul Aug Sep Oct Nov Dec 2001 Jan Feb Mar Apr May Jun Jul Aug Sep Oct Nov Dec 2000 Jan Feb Mar Apr May Jun Jul Aug Sep Oct Nov Dec 1999 Jan Feb Mar Apr May Jun Jul Aug Sep Oct Nov Dec 1998 Jan Feb Mar Apr May Jun Jul Aug Sep Oct Nov Dec 1988 Jan Feb Mar Apr May Jun Jul Aug Sep Oct Nov Dec 1987 Jan Feb Mar Apr May Jun Jul Aug Sep Oct Nov Dec 1986 Jan Feb Mar Apr May Jun Jul Aug Sep Oct Nov Dec 1985 Jan Feb Mar Apr May Jun Jul Aug Sep Oct Nov Dec Western Regional Climate Center,


25 YMP 1 View to West YMP 2 View to South View to East View to North
26 Back to: NTS-60 (YMP 1) Nevada NOTE: To print data frame (right side), click on right frame before printing. Daily Summary Daily Summary (with Wind Chill and Heat Index) Daily Summary Time Series Monthly Summary Monthly Summary (w/ Et data) Time Series Graph Wind Rose Graph and Tables Wind Stability/Wind Rose Graph and Tables Hourly Frequency Distribution/Histogram Data Lister Data Inventory (Monthly Graphic) Station Metadata BOLD, Red indicates some data available for month and year Jan Feb Mar Apr May Jun Jul Aug Sep Oct Nov Dec 2005 Jan Feb Mar Apr May Jun Jul Aug Sep Oct Nov Dec 2004 Jan Feb Mar Apr May Jun Jul Aug Sep Oct Nov Dec 2003 Jan Feb Mar Apr May Jun Jul Aug Sep Oct Nov Dec 2002 Jan Feb Mar Apr May Jun Jul Aug Sep Oct Nov Dec 2001 Jan Feb Mar Apr May Jun Jul Aug Sep Oct Nov Dec 2000 Jan Feb Mar Apr May Jun Jul Aug Sep Oct Nov Dec 1999 Jan Feb Mar Apr May Jun Jul Aug Sep Oct Nov Dec 1998 Jan Feb Mar Apr May Jun Jul Aug Sep Oct Nov Dec 1988 Jan Feb Mar Apr May Jun Jul Aug Sep Oct Nov Dec 1987 Jan Feb Mar Apr May Jun Jul Aug Sep Oct Nov Dec 1986 Jan Feb Mar Apr May Jun Jul Aug Sep Oct Nov Dec 1985 Jan Feb Mar Apr May Jun Jul Aug Sep Oct Nov Dec Western Regional Climate Center,
27
28 Day of Month Day of Year Total Solar Radiation Wind Average mph Vert. direction Maximum mph Temperature Mean Maximum Minimum Humidity Mean Maximum Minimum Dew Point Wet Bulb Barometric Pressure Total Precipitation Total Penman ET
29 Back to: NTS-60 (YMP 1) Nevada NOTE: To print data frame (right side), click on right frame before printing. Daily Summary Daily Summary (with Wind Chill and Heat Index) Daily Summary Time Series Monthly Summary Monthly Summary (w/ Et data) Time Series Graph Wind Rose Graph and Tables Wind Stability/Wind Rose Graph and Tables Hourly Frequency Distribution/Histogram Data Lister Data Inventory (Monthly Graphic) Station Metadata BOLD, Red indicates some data available for month and year Jan Feb Mar Apr May Jun Jul Aug Sep Oct Nov Dec 2005 Jan Feb Mar Apr May Jun Jul Aug Sep Oct Nov Dec 2004 Jan Feb Mar Apr May Jun Jul Aug Sep Oct Nov Dec 2003 Jan Feb Mar Apr May Jun Jul Aug Sep Oct Nov Dec 2002 Jan Feb Mar Apr May Jun Jul Aug Sep Oct Nov Dec 2001 Jan Feb Mar Apr May Jun Jul Aug Sep Oct Nov Dec 2000 Jan Feb Mar Apr May Jun Jul Aug Sep Oct Nov Dec 1999 Jan Feb Mar Apr May Jun Jul Aug Sep Oct Nov Dec 1998 Jan Feb Mar Apr May Jun Jul Aug Sep Oct Nov Dec 1988 Jan Feb Mar Apr May Jun Jul Aug Sep Oct Nov Dec 1987 Jan Feb Mar Apr May Jun Jul Aug Sep Oct Nov Dec 1986 Jan Feb Mar Apr May Jun Jul Aug Sep Oct Nov Dec 1985 Jan Feb Mar Apr May Jun Jul Aug Sep Oct Nov Dec Western Regional Climate Center,

30 Time Series Graph YMP 1 Precipitation July 9-17, products available including: Temperature Precipitation Wind speed Wind direction Wind gusts Dew point temp Solar radiation Barometric pressure July 1, July 1, 2001
31 Back to: NTS-60 (YMP 1) Nevada NOTE: To print data frame (right side), click on right frame before printing. Daily Summary Daily Summary (with Wind Chill and Heat Index) Daily Summary Time Series Monthly Summary Monthly Summary (w/ Et data) Time Series Graph Wind Rose Graph and Tables Wind Stability/Wind Rose Graph and Tables Hourly Frequency Distribution/Histogram Data Lister Data Inventory (Monthly Graphic) Station Metadata BOLD, Red indicates some data available for month and year Jan Feb Mar Apr May Jun Jul Aug Sep Oct Nov Dec 2005 Jan Feb Mar Apr May Jun Jul Aug Sep Oct Nov Dec 2004 Jan Feb Mar Apr May Jun Jul Aug Sep Oct Nov Dec 2003 Jan Feb Mar Apr May Jun Jul Aug Sep Oct Nov Dec 2002 Jan Feb Mar Apr May Jun Jul Aug Sep Oct Nov Dec 2001 Jan Feb Mar Apr May Jun Jul Aug Sep Oct Nov Dec 2000 Jan Feb Mar Apr May Jun Jul Aug Sep Oct Nov Dec 1999 Jan Feb Mar Apr May Jun Jul Aug Sep Oct Nov Dec 1998 Jan Feb Mar Apr May Jun Jul Aug Sep Oct Nov Dec 1988 Jan Feb Mar Apr May Jun Jul Aug Sep Oct Nov Dec 1987 Jan Feb Mar Apr May Jun Jul Aug Sep Oct Nov Dec 1986 Jan Feb Mar Apr May Jun Jul Aug Sep Oct Nov Dec 1985 Jan Feb Mar Apr May Jun Jul Aug Sep Oct Nov Dec Western Regional Climate Center,
32 Wind Rose Diagrams Night Period of record Jan 1986 through Dec 2005
33 NTS-60 (YMP 1) Nevada - Wind Frequency Table (percentage) Latitude : 36 50' 34" N Longitude : ' 50" W Elevation : 3750 ft. Start Date : Jan. 1, 1986 End Date : Dec. 31, 2005 # of Days : 7305 of 7305 # obs : poss : of Sub Interval Windows Start End Month Jan. Dec. Day Hour (Greater than or equal to initial interval value and Less than ending interval value.) Range (m/s) N NNE NE ENE E ESE SE SSE S SSW SW WSW W WNW NW NNW Total Total(%) Calm (<1.3) 6.6 Ave Speed
34 NTS-60 (YMP 1) Nevada - Hourly Wind Statistics Table Latitude : 36 50' 34" N Longitude : ' 50" W Elevation : 3750 ft. Start Date : Jan. 1, 1986 End Date : Dec. 31, 2005 # of Days : 7305 of 7305 # obs : poss : of Time - Time of Day (L.S.T.) Speed - Average (Scalar) Speed in m/s U-Vel - East-West Velocity, Positive to East V-Vel - North-South Velocity, Positive to North Res Spd - Vector Average (resultant) Speed in m/s Res Dir - Vector Average (resultant) Direction Dir Con - Directional Constancy (Res Spd/Speed) Num Spd - Number of Wind Speed Observations Num Dir - Number of Wind Direction Observations Sub Interval Windows Start End Month Jan. Dec. Day Hour Time Speed U-Vel V-Vel Res Spd Res Dir Dir Con Num Spd Num Dir ALL
35 YMP 2 Period of record: July a.m. through 7 a.m. Period of record: July a.m. through 5 p.m. Period of record: July p.m. through 1 a.m.
36 Back to: NTS-60 (YMP 1) Nevada NOTE: To print data frame (right side), click on right frame before printing. Daily Summary Daily Summary (with Wind Chill and Heat Index) Daily Summary Time Series Monthly Summary Monthly Summary (w/ Et data) Time Series Graph Wind Rose Graph and Tables Wind Stability/Wind Rose Graph and Tables Hourly Frequency Distribution/Histogram Data Lister Data Inventory (Monthly Graphic) Station Metadata BOLD, Red indicates some data available for month and year Jan Feb Mar Apr May Jun Jul Aug Sep Oct Nov Dec 2005 Jan Feb Mar Apr May Jun Jul Aug Sep Oct Nov Dec 2004 Jan Feb Mar Apr May Jun Jul Aug Sep Oct Nov Dec 2003 Jan Feb Mar Apr May Jun Jul Aug Sep Oct Nov Dec 2002 Jan Feb Mar Apr May Jun Jul Aug Sep Oct Nov Dec 2001 Jan Feb Mar Apr May Jun Jul Aug Sep Oct Nov Dec 2000 Jan Feb Mar Apr May Jun Jul Aug Sep Oct Nov Dec 1999 Jan Feb Mar Apr May Jun Jul Aug Sep Oct Nov Dec 1998 Jan Feb Mar Apr May Jun Jul Aug Sep Oct Nov Dec 1988 Jan Feb Mar Apr May Jun Jul Aug Sep Oct Nov Dec 1987 Jan Feb Mar Apr May Jun Jul Aug Sep Oct Nov Dec 1986 Jan Feb Mar Apr May Jun Jul Aug Sep Oct Nov Dec 1985 Jan Feb Mar Apr May Jun Jul Aug Sep Oct Nov Dec Western Regional Climate Center,
37 YMP 1 Stability Class A Extremely Unstable January July Evening to morning Mid-morning Night to daylight Late night Afternoon Day to early evening
38 YMP 1 Stability Class D Neutral Evening to morning Mid-morning Night to daylight Late night Afternoon Day to early evening January Class D - Neutral July Class D - Neutral
39 Modern met This software extends climate histories beyond the timeframes currently available in qualified reports without time-consuming number crunching Climate summaries generated may be used to evaluate environmental analyses of repository design facilities, and update input data to atmospheric dispersion and emergency planning models
APPENDIX G-7 METEROLOGICAL DATA
 APPENDIX G-7 METEROLOGICAL DATA METEOROLOGICAL DATA FOR AIR AND NOISE SAMPLING DAYS AT MMR Monthly Normals and Extremes for Honolulu International Airport Table G7-1 MMR RAWS Station Hourly Data Tables
The Climate of Payne County
 The Climate of Payne County Payne County is part of the Central Great Plains in the west, encompassing some of the best agricultural land in Oklahoma. Payne County is also part of the Crosstimbers in the
The Climate of Murray County
 The Climate of Murray County Murray County is part of the Crosstimbers. This region is a transition between prairies and the mountains of southeastern Oklahoma. Average annual precipitation ranges from
The Climate of Marshall County
 The Climate of Marshall County Marshall County is part of the Crosstimbers. This region is a transition region from the Central Great Plains to the more irregular terrain of southeastern Oklahoma. Average
The Climate of Texas County
 The Climate of Texas County Texas County is part of the Western High Plains in the north and west and the Southwestern Tablelands in the east. The Western High Plains are characterized by abundant cropland
The Climate of Bryan County
 The Climate of Bryan County Bryan County is part of the Crosstimbers throughout most of the county. The extreme eastern portions of Bryan County are part of the Cypress Swamp and Forest. Average annual
The Climate of Kiowa County
 The Climate of Kiowa County Kiowa County is part of the Central Great Plains, encompassing some of the best agricultural land in Oklahoma. Average annual precipitation ranges from about 24 inches in northwestern
The Climate of Haskell County
 The Climate of Haskell County Haskell County is part of the Hardwood Forest. The Hardwood Forest is characterized by its irregular landscape and the largest lake in Oklahoma, Lake Eufaula. Average annual
The Climate of Seminole County
 The Climate of Seminole County Seminole County is part of the Crosstimbers. This region is a transition region from the Central Great Plains to the more irregular terrain of southeastern Oklahoma. Average
The Climate of Pontotoc County
 The Climate of Pontotoc County Pontotoc County is part of the Crosstimbers. This region is a transition region from the Central Great Plains to the more irregular terrain of southeast Oklahoma. Average
The Climate of Grady County
 The Climate of Grady County Grady County is part of the Central Great Plains, encompassing some of the best agricultural land in Oklahoma. Average annual precipitation ranges from about 33 inches in northern
LOCAL CLIMATOLOGICAL DATA Monthly Summary July 2013
 Deg. Days Precip Ty Precip Wind Solar Hu- Adj. to Sea Level mid- ity Avg Res Res Peak Minute 1 fog 2 hvy fog 3 thunder 4 ice plt 5 hail 6 glaze 7 duststm 8 smk, hz 9 blw snw 1 2 3 4A 4B 5 6 7 8 9 12 14
LOCAL CLIMATOLOGICAL DATA Monthly Summary September 2016
 Deg. Days Precip Ty Precip Wind Solar Hu- Adj. to Sea Level mid- ity Avg Res Res Peak 2 Minute 1 fog 2 hvy fog 3 thunder 4 ice plt 5 hail 6 glaze 7 duststm 8 smk, hz 9 blw snw 1 2 3 4A 4B 5 6 7 8 9 11
LOCAL CLIMATOLOGICAL DATA Monthly Summary November 2006
 Deg. Days Precip Ty Precip Wind Sun Hu- Adj. to Sea Level mid- ity Avg Res Res Peak Minute 1 fog 2 hvy fog 3 thunder 4 ice plt 5 hail 6 glaze 7 duststm 8 smk, hz 9 blw snw 1 2 3 4A 4B 5 6 7 8 9 12 14 15
Sierra Weather and Climate Update
 Sierra Weather and Climate Update 2014-15 Kelly Redmond Western Regional Climate Center Desert Research Institute Reno Nevada Yosemite Hydroclimate Workshop Yosemite Valley, 2015 October 8-9 Percent of
Weather History on the Bishop Paiute Reservation
 Weather History on the Bishop Paiute Reservation -211 For additional information contact Toni Richards, Air Quality Specialist 76 873 784 toni.richards@bishoppaiute.org Updated 2//214 3:14 PM Weather History
5.0 WHAT IS THE FUTURE ( ) WEATHER EXPECTED TO BE?
 WEATHER EXPECTED TO BE?") 5.0 WHAT IS THE FUTURE (2040-2049) WEATHER EXPECTED TO BE? This chapter presents some illustrative results for one station, Pearson Airport, extracted from the hour-by-hour simulations of the future period
5.0 WHAT IS THE FUTURE (2040-2049) WEATHER EXPECTED TO BE? This chapter presents some illustrative results for one station, Pearson Airport, extracted from the hour-by-hour simulations of the future period
Weather Station: WH_500_Series. Battery Voltage
 Battery Voltage 12.800 12.795 12.790 Voltage 12.785 12.780 12.775 12.770 Apr 2015 8 Wed 15 Wed 22 Wed 1 Fri Time Page 1 Date Batt Volt Min 4/1/2015 12.77 4/2/2015 12.78 4/3/2015 12.80 4/4/2015 12.79 4/5/2015
Chiang Rai Province CC Threat overview AAS1109 Mekong ARCC
 Chiang Rai Province CC Threat overview AAS1109 Mekong ARCC This threat overview relies on projections of future climate change in the Mekong Basin for the period 2045-2069 compared to a baseline of 1980-2005.
WIND DATA REPORT. Vinalhaven
 WIND DATA REPORT Vinalhaven April 1, 2004 June 30, 2004 Prepared for Fox Islands Electric Cooperative By Melissa L. Ray Anthony L. Rogers April 4, 2005 Renewable Energy Research Laboratory 160 Governors
2003 Water Year Wrap-Up and Look Ahead
 2003 Water Year Wrap-Up and Look Ahead Nolan Doesken Colorado Climate Center Prepared by Odie Bliss http://ccc.atmos.colostate.edu Colorado Average Annual Precipitation Map South Platte Average Precipitation
WIND DATA REPORT. Vinalhaven
 WIND DATA REPORT Vinalhaven July 1, 2004 September 30, 2004 Prepared for Fox Islands Electric Cooperative By Melissa L. Ray Anthony L. Rogers April 4, 2005 Renewable Energy Research Laboratory 160 Governors
UWM Field Station meteorological data
 University of Wisconsin Milwaukee UWM Digital Commons Field Station Bulletins UWM Field Station Spring 992 UWM Field Station meteorological data James W. Popp University of Wisconsin - Milwaukee Follow
Colorado s 2003 Moisture Outlook
 Colorado s 2003 Moisture Outlook Nolan Doesken and Roger Pielke, Sr. Colorado Climate Center Prepared by Tara Green and Odie Bliss http://climate.atmos.colostate.edu How we got into this drought! Fort
CAMARGO RANCH, llc. CRAIG BUFORD BufordResources.com
 CAMARGO RANCH, llc 2897 +/- acre Wheat & Cattle Farm Mangum, greer county, oklahoma CRAIG BUFORD 405-833-9499 BufordResources.com 4101 Perimeter Center Dr., Suite 107 Oklahoma City, OK 73112 405.833.9499
Format of CLIGEN weather station statistics input files. for CLIGEN versions as of 6/2001 (D.C. Flanagan).
.") Format of CLIGEN weather station statistics input files for CLIGEN versions 4.1-5.1 as of 6/2001 (D.C. Flanagan). updated 12/11/2008 - Jim Frankenberger These files are also known as CLIGEN state files
Format of CLIGEN weather station statistics input files for CLIGEN versions 4.1-5.1 as of 6/2001 (D.C. Flanagan). updated 12/11/2008 - Jim Frankenberger These files are also known as CLIGEN state files
A High Elevation Climate Monitoring Network
 A High Elevation Climate Monitoring Network Kelly T. Redmond Western Regional Climate Center Desert Research Institute Reno Nevada AGU San Francisco WRCC / OSU Nevada Precip-Elevation Distribution 100%
Monthly Long Range Weather Commentary Issued: APRIL 18, 2017 Steven A. Root, CCM, Chief Analytics Officer, Sr. VP,
 Monthly Long Range Weather Commentary Issued: APRIL 18, 2017 Steven A. Root, CCM, Chief Analytics Officer, Sr. VP, sroot@weatherbank.com MARCH 2017 Climate Highlights The Month in Review The average contiguous
What is the difference between Weather and Climate?
 What is the difference between Weather and Climate? Objective Many people are confused about the difference between weather and climate. This makes understanding the difference between weather forecasts
Variability of Reference Evapotranspiration Across Nebraska
 Know how. Know now. EC733 Variability of Reference Evapotranspiration Across Nebraska Suat Irmak, Extension Soil and Water Resources and Irrigation Specialist Kari E. Skaggs, Research Associate, Biological
A Synoptic Climatology of Heavy Precipitation Events in California
 A Synoptic Climatology of Heavy Precipitation Events in California Alan Haynes Hydrometeorological Analysis and Support (HAS) Forecaster National Weather Service California-Nevada River Forecast Center
Webinar and Weekly Summary February 15th, 2011
 Webinar and Weekly Summary February 15th, 2011 -Assessment of current water conditions - Precipitation Forecast - Recommendations for Drought Monitor Upper Colorado Normal Precipitation Upper Colorado
Case Study Las Vegas, Nevada By: Susan Farkas Chika Nakazawa Simona Tamutyte Zhi-ya Wu AAE/AAL 330 Design with Climate
 Case Study Las Vegas, Nevada By: Susan Farkas Chika Nakazawa Simona Tamutyte Zhi-ya Wu AAE/AAL 330 Design with Climate Professor Alfredo Fernandez-Gonzalez School of Architecture University of Nevada,
Global Climates. Name Date
 Global Climates Name Date No investigation of the atmosphere is complete without examining the global distribution of the major atmospheric elements and the impact that humans have on weather and climate.
2016 Meteorology Summary
 2016 Meteorology Summary New Jersey Department of Environmental Protection AIR POLLUTION AND METEOROLOGY Meteorology plays an important role in the distribution of pollution throughout the troposphere,
2003 Moisture Outlook
 2003 Moisture Outlook Nolan Doesken and Roger Pielke, Sr. Colorado Climate Center Prepared by Tara Green and Odie Bliss http://climate.atmos.colostate.edu Through 1999 Through 1999 Fort Collins Total Water
Climatography of the United States No
 Climate Division: AK 5 NWS Call Sign: ANC Month (1) Min (2) Month(1) Extremes Lowest (2) Temperature ( F) Lowest Month(1) Degree s (1) Base Temp 65 Heating Cooling 90 Number of s (3) Jan 22.2 9.3 15.8
Regents Earth Science Unit 7: Water Cycle and Climate
 Regents Earth Science Unit 7: Water Cycle and Climate Name Section Coastal and Continental Temperature Ranges Lab # Introduction: There are large variations in average monthly temperatures among cities
Climatography of the United States No
 Climate Division: CA 5 NWS Call Sign: Elevation: 6 Feet Lat: 37 Month (1) Min (2) Month(1) Extremes Lowest (2) Temperature ( F) Lowest Month(1) Degree s (1) Base Temp 65 Heating Cooling 1 Number of s (3)
Climatography of the United States No
 Climate Division: CA 4 NWS Call Sign: Elevation: 2 Feet Lat: 37 Month (1) Min (2) Month(1) Extremes Lowest (2) Temperature ( F) Lowest Month(1) Degree s (1) Base Temp 65 Heating Cooling 1 Number of s (3)
Climatography of the United States No
 Climate Division: CA 4 NWS Call Sign: Elevation: 13 Feet Lat: 36 Month (1) Min (2) Month(1) Extremes Lowest (2) Temperature ( F) Lowest Month(1) Degree s (1) Base Temp 65 Heating Cooling 1 Number of s
Climatography of the United States No
 Climate Division: CA 5 NWS Call Sign: Elevation: 1,14 Feet Lat: 36 Month (1) Min (2) Month(1) Extremes Lowest (2) Temperature ( F) Lowest Month(1) Degree s (1) Base Temp 65 Heating Cooling 1 Number of
Drought in Southeast Colorado
 Drought in Southeast Colorado Nolan Doesken and Roger Pielke, Sr. Colorado Climate Center Prepared by Tara Green and Odie Bliss http://climate.atmos.colostate.edu 1 Historical Perspective on Drought Tourism
SASKATOON STATION
 Day Max Max 1981-1 Temperature Degree-days Precipitation Min Min 1981-1 Mean Mean 1981-1 Growing Heating Cooling Weighing Gauge base 18 base 18 base Comments Preliminary DECEMBER 17 Snow-on- Ground 9h
Climatography of the United States No
 Climate Division: CA 6 NWS Call Sign: LAX Elevation: 1 Feet Lat: 33 Month (1) Min (2) Month(1) Extremes Lowest (2) Temperature ( F) Lowest Month(1) Degree s (1) Base Temp 65 Heating Cooling 1 Number of
Climatography of the United States No
 Climate Division: CA 6 NWS Call Sign: TOA Elevation: 11 Feet Lat: 33 2W Temperature ( F) Month (1) Min (2) Month(1) Extremes Lowest (2) Lowest Month(1) Degree s (1) Base Temp 65 Heating Cooling 1 Number
GAMINGRE 8/1/ of 7
 FYE 09/30/92 JULY 92 0.00 254,550.00 0.00 0 0 0 0 0 0 0 0 0 254,550.00 0.00 0.00 0.00 0.00 254,550.00 AUG 10,616,710.31 5,299.95 845,656.83 84,565.68 61,084.86 23,480.82 339,734.73 135,893.89 67,946.95
The Climate of Oregon Climate Zone 4 Northern Cascades
 /05 E55 Unbound issue No. 9/ is Does not circulate Special Report 916 May 1993 The Climate of Oregon Climate Zone 4 Property of OREGON STATE UNIVERSITY Library Serials Corvallis, OR 97331-4503 Agricultural
Table of Contents. Page
 Eighteen Years (1990 2007) of Climatological Data on NMSU s Corona Range and Livestock Research Center Research Report 761 L. Allen Torell, Kirk C. McDaniel, Shad Cox, Suman Majumdar 1 Agricultural Experiment
SHADOW - Main Result. windpro CUMULTATIEVE EFFECTEN SLAGSCHADUW HERENTALS. EDF Luminus Markiesstraat Brussel
 SHADOW - Main Result Assumptions for shadow calculations Maximum distance for influence Calculate only when more than 20 % of sun is covered by the blade Please look in WTG table Minimum sun height over
Climatography of the United States No
 Climate Division: CA 4 NWS Call Sign: Month (1) Min (2) Month(1) Extremes Lowest (2) Temperature ( F) Lowest Month(1) Degree s (1) Base Temp 65 Heating Cooling 100 Number of s (3) Jan 55.6 39.3 47.5 77
Climatography of the United States No
 Climate Division: CA 1 NWS Call Sign: Month (1) Min (2) Month(1) Extremes Lowest (2) Temperature ( F) Lowest Month(1) Degree s (1) Base Temp 65 Heating Cooling 100 Number of s (3) Jan 57.9 38.9 48.4 85
Climatography of the United States No
 Climate Division: CA 5 NWS Call Sign: Month (1) Min (2) Month(1) Extremes Lowest (2) Temperature ( F) Lowest Month(1) Degree s (1) Base Temp 65 Heating Cooling 100 Number of s (3) Jan 56.6 36.5 46.6 81
Climatography of the United States No
 Climate Division: CA 5 NWS Call Sign: Month (1) Min (2) Month(1) Extremes Lowest (2) Temperature ( F) Lowest Month(1) Degree s (1) Base Temp 65 Heating Cooling 100 Number of s (3) Jan 44.8 25.4 35.1 72
Climatography of the United States No
 Climate Division: CA 4 NWS Call Sign: Month (1) Min (2) Month(1) Extremes Lowest (2) Temperature ( F) Lowest Month(1) Degree s (1) Base Temp 65 Heating Cooling 100 Number of s (3) Jan 49.4 37.5 43.5 73
Introduction to Climate ~ Part I ~
 2015/11/16 TCC Seminar JMA Introduction to Climate ~ Part I ~ Shuhei MAEDA (MRI/JMA) Climate Research Department Meteorological Research Institute (MRI/JMA) 1 Outline of the lecture 1. Climate System (
Climatography of the United States No
 Climate Division: CA 6 NWS Call Sign: Month (1) Min (2) Month(1) Extremes Lowest (2) Temperature ( F) Lowest Month(1) Degree s (1) Base Temp 65 Heating Cooling 100 Number of s (3) Jan 69.4 46.6 58.0 92
Climatography of the United States No
 Climate Division: CA 4 NWS Call Sign: Month (1) Min (2) Month(1) Extremes Lowest (2) Temperature ( F) Lowest Month(1) Degree s (1) Base Temp 65 Heating Cooling 1 Number of s (3) Jan 58.5 38.8 48.7 79 1962
Climatography of the United States No
 Climate Division: CA 6 NWS Call Sign: Month (1) Min (2) Month(1) Extremes Lowest (2) Temperature ( F) Lowest Month(1) Degree s (1) Base Temp 65 Heating Cooling 1 Number of s (3) Jan 67.5 42. 54.8 92 1971
Climatography of the United States No
 Climate Division: CA 1 NWS Call Sign: Month (1) Min (2) Month(1) Extremes Lowest (2) Temperature ( F) Lowest Month(1) Degree s (1) Base Temp 65 Heating Cooling 1 Number of s (3) Jan 57.8 39.5 48.7 85 1962
CAVE CLIMATE COMPARISON ACTIVITY BETWEEN THE SURFACE AND THE CAVERN
 CAVE CLIMATE COMPARISON ACTIVITY BETWEEN THE SURFACE AND THE CAVERN Created by Ray Bowers For the Virtual Center for the Environment (VCE) A part of the Institute of Natural Resources Analysis and Management
Champaign-Urbana 2001 Annual Weather Summary
 Champaign-Urbana 2001 Annual Weather Summary ILLINOIS STATE WATER SURVEY 2204 Griffith Dr. Champaign, IL 61820 wxobsrvr@sws.uiuc.edu Maria Peters, Weather Observer January: After a cold and snowy December,
Atmospheric circulation analysis for seasonal forecasting
 Training Seminar on Application of Seasonal Forecast GPV Data to Seasonal Forecast Products 18 21 January 2011 Tokyo, Japan Atmospheric circulation analysis for seasonal forecasting Shotaro Tanaka Climate
Presentation Overview. Southwestern Climate: Past, present and future. Global Energy Balance. What is climate?
 Southwestern Climate: Past, present and future Mike Crimmins Climate Science Extension Specialist Dept. of Soil, Water, & Env. Science & Arizona Cooperative Extension The University of Arizona Presentation
DEPARTMENT OF EARTH & CLIMATE SCIENCES Name SAN FRANCISCO STATE UNIVERSITY Nov 29, ERTH 360 Test #2 200 pts
 DEPARTMENT OF EARTH & CLIMATE SCIENCES Name SAN FRANCISCO STATE UNIVERSITY Nov 29, 2018 ERTH 360 Test #2 200 pts Each question is worth 4 points. Indicate your BEST CHOICE for each question on the Scantron
Life Cycle of Convective Systems over Western Colombia
 Life Cycle of Convective Systems over Western Colombia Meiry Sakamoto Uiversidade de São Paulo, São Paulo, Brazil Colombia Life Cycle of Convective Systems over Western Colombia Convective System (CS)
Climatography of the United States No
 Climate Division: ND 8 NWS Call Sign: BIS Month (1) Min (2) Month(1) Extremes Lowest (2) Temperature ( F) Lowest Month(1) Degree s (1) Base Temp 65 Heating Cooling 100 Number of s (3) Jan 21.1 -.6 10.2
Climatography of the United States No
 Climate Division: TN 1 NWS Call Sign: Month (1) Min (2) Month(1) Extremes Lowest (2) Temperature ( F) Lowest Month(1) Degree s (1) Base Temp 65 Heating Cooling 100 Number of s (3) Jan 47.6 24.9 36.3 81
Climatography of the United States No
 Climate Division: CA 5 NWS Call Sign: FAT Month (1) Min (2) Month(1) Extremes Lowest (2) Temperature ( F) Lowest Month(1) Degree s (1) Base Temp 65 Heating Cooling 1 Number of s (3) Jan 53.6 38.4 46. 78
Climatography of the United States No
 Climate Division: CA 6 NWS Call Sign: 1L2 N Lon: 118 3W Month (1) Min (2) Month(1) Extremes Lowest (2) Temperature ( F) Lowest Month(1) Degree s (1) Base Temp 65 Heating Cooling 1 Number of s (3) Jan 63.7
Climatography of the United States No
 Climate Division: CA 5 NWS Call Sign: BFL Month (1) Min (2) Month(1) Extremes Lowest (2) Temperature ( F) Lowest Month(1) Degree s (1) Base Temp 65 Heating Cooling 1 Number of s (3) Jan 56.3 39.3 47.8
Climatography of the United States No
 No. 2 1971-2 Asheville, North Carolina 2881 COOP ID: 46175 Climate Division: CA 6 NWS Call Sign: 3L3 Elevation: 1 Feet Lat: 33 Month (1) Min (2) Month(1) Extremes Lowest (2) Temperature ( F) Lowest Month(1)
Climatography of the United States No
 No. 2 1971-2 Asheville, North Carolina 2881 COOP ID: 42713 Climate Division: CA 7 NWS Call Sign: Elevation: -3 Feet Lat: 32 Month (1) Min (2) Month(1) Extremes Lowest (2) Temperature ( F) Lowest Month(1)
Climate Variability in South Asia
 Climate Variability in South Asia V. Niranjan, M. Dinesh Kumar, and Nitin Bassi Institute for Resource Analysis and Policy Contents Introduction Rainfall variability in South Asia Temporal variability
Climatography of the United States No
 Climate Division: TN 3 NWS Call Sign: BNA Month (1) Min (2) Month(1) Extremes Lowest (2) Temperature ( F) Lowest Month(1) Degree s (1) Base Temp 65 Heating Cooling 100 Number of s (3) Jan 45.6 27.9 36.8
Local Ctimatotogical Data Summary White Hall, Illinois
 SWS Miscellaneous Publication 98-5 STATE OF ILLINOIS DEPARTMENT OF ENERGY AND NATURAL RESOURCES Local Ctimatotogical Data Summary White Hall, Illinois 1901-1990 by Audrey A. Bryan and Wayne Armstrong Illinois
Chapter 3. Materials and Methods
 Chapter 3 Materials and Methods CHAPTER3 MATERIALS AND METHODS The present study aims to identify the role of climatic factors in the dispersal of air pollutants released into the atmosphere at some important
Monthly Long Range Weather Commentary Issued: APRIL 1, 2015 Steven A. Root, CCM, President/CEO
 Monthly Long Range Weather Commentary Issued: APRIL 1, 2015 Steven A. Root, CCM, President/CEO sroot@weatherbank.com FEBRUARY 2015 Climate Highlights The Month in Review The February contiguous U.S. temperature
Natural Event Documentation
 ADDENDUM Natural Event Documentation Corcoran, Oildale and Bakersfield, California September 22, 2006 San Joaquin Valley Unified Air Pollution Control District May 23, 2007 Natural Event Documentation
Climatography of the United States No
 Month (1) Min (2) Month(1) Extremes Lowest (2) Temperature ( F) Lowest Month(1) Degree s (1) Base Temp 65 Heating Cooling 100 Number of s (3) Jan 63.9 39.3 51.6 86 1976 16 56.6 1986 20 1976 2 47.5 1973
TILT, DAYLIGHT AND SEASONS WORKSHEET
 TILT, DAYLIGHT AND SEASONS WORKSHEET Activity Description: Students will use a data table to make a graph for the length of day and average high temperature in Utah. They will then answer questions based
Climatography of the United States No
 Temperature ( F) Month (1) Min (2) Month(1) Extremes Lowest (2) Lowest Month(1) Degree s (1) Base Temp 65 Heating Cooling 100 Number of s (3) Jan 32.8 21.7 27.3 62 1918 1 35.8 1983-24 1950 29 10.5 1979
Weather and Climate of the Rogue Valley By Gregory V. Jones, Ph.D., Southern Oregon University
 Weather and Climate of the Rogue Valley By Gregory V. Jones, Ph.D., Southern Oregon University The Rogue Valley region is one of many intermountain valley areas along the west coast of the United States.
Site Description: Tower Site
 Resource Summary for Fort Collins Site Final Report Colorado Anemometer Loan Program Monitoring Period: /0/00 11/03/007 Report Date: January 1, 00 Site Description: The site is located adjacent to the
Climatography of the United States No
 No. 2 1971-2 Asheville, North Carolina 2881 COOP ID: 46646 Climate Division: CA 4 NWS Call Sign: 8W Month (1) Min (2) Month(1) Extremes Lowest (2) Temperature ( F) Lowest Month(1) Degree s (1) Base Temp
Climatography of the United States No
 No. 2 1971-2 Asheville, North Carolina 2881 COOP ID: 4792 Climate Division: CA 6 NWS Call Sign: Month (1) Min (2) Month(1) Extremes Lowest (2) Temperature ( F) Lowest Month(1) Degree s (1) Base Temp 65
Technical Note: Hydrology of the Lake Chilwa wetland, Malawi
 Technical Note: Hydrology of the Lake Chilwa wetland, Malawi Matthew McCartney June 27 Description Lake Chilwa is located in the Southern region of Malawi on the country s eastern boarder with Mozambique
BIOMETEOROLOGICAL BASIS FOR TOURISM.
 Developments in Tourism Climatology A. Matzarakis, C. R. de Freitas, D. Scott, 7 BOMETEOROLOGCAL BASS FOR TOURSM Ksenija Zaninović 1 and Andreas Matzarakis 1 Meteorological and Hydrological Service of
Climatography of the United States No
 Climate Division: CA 6 NWS Call Sign: Month (1) Min (2) Month(1) Extremes Lowest (2) Temperature ( F) Lowest Month(1) Degree s (1) Base Temp 65 Heating Cooling 100 Number of s (3) Jan 51.5 35.0 43.3 80
Climatography of the United States No
 Climate Division: CA 5 NWS Call Sign: Month (1) Min (2) Month(1) Extremes Lowest (2) Temperature ( F) Lowest Month(1) Degree s (1) Base Temp 65 Heating Cooling 100 Number of s (3) 59.3 31.5 45.4 80 1976
Climatography of the United States No
 Climate Division: CA 7 NWS Call Sign: Month (1) Min (2) Month(1) Extremes Lowest (2) Temperature ( F) Lowest Month(1) Degree s (1) Base Temp 65 Heating Cooling 100 Number of s (3) 44.5 29.3 36.9 69 1951
Climatography of the United States No
 Climate Division: CA 2 NWS Call Sign: Month (1) Min (2) Month(1) Extremes Lowest (2) Temperature ( F) Lowest Month(1) Degree s (1) Base Temp 65 Heating Cooling 100 Number of s (3) 53.3 37.1 45.2 77 1962
Climatography of the United States No
 Climate Division: CA 2 NWS Call Sign: Month (1) Min (2) Month(1) Extremes Lowest (2) Temperature ( F) Lowest Month(1) Degree s (1) Base Temp 65 Heating Cooling 100 Number of s (3) 53.3 31.8 42.6 74+ 1975
Climatography of the United States No
 Climate Division: CA 2 NWS Call Sign: Month (1) Min (2) Month(1) Extremes Lowest (2) Temperature ( F) Lowest Month(1) Degree s (1) Base Temp 65 Heating Cooling 100 Number of s (3) 53.7 32.7 43.2 79 1962
Climatography of the United States No
 Climate Division: CA 6 NWS Call Sign: Month (1) Min (2) Month(1) Extremes Lowest (2) Temperature ( F) Lowest Month(1) Degree s (1) Base Temp 65 Heating Cooling 100 Number of s (3) 68.5 45.7 57.1 90 1971
Climatography of the United States No
 Climate Division: CA 7 NWS Call Sign: Month (1) Min (2) Month(1) Extremes Lowest (2) Temperature ( F) Lowest Month(1) Degree s (1) Base Temp 65 Heating Cooling 100 Number of s (3) 56.0 35.7 45.9 83 1975
Climatography of the United States No
 Climate Division: CA 7 NWS Call Sign: Month (1) Min (2) Month(1) Extremes Lowest (2) Temperature ( F) Lowest Month(1) Degree s (1) Base Temp 65 Heating Cooling 1 Number of s (3) 64.8 45.4 55.1 85 1971
Climatography of the United States No
 Climate Division: CA 7 NWS Call Sign: Month (1) Min (2) Month(1) Extremes Lowest (2) Temperature ( F) Lowest Month(1) Degree s (1) Base Temp 65 Heating Cooling 1 Number of s (3) 65.5 38.7 52.1 87 1962
Climatography of the United States No
 Climate Division: CA 7 NWS Call Sign: Month (1) Min (2) Month(1) Extremes Lowest (2) Temperature ( F) Lowest Month(1) Degree s (1) Base Temp 65 Heating Cooling 100 Number of s (3) 58.8 34.3 46.6 81+ 1948
Climatography of the United States No
 Climate Division: CA 7 NWS Call Sign: Month (1) Min (2) Month(1) Extremes Lowest (2) Temperature ( F) Lowest Month(1) Degree s (1) Base Temp 65 Heating Cooling 100 Number of s (3) 70.4 44.2 57.3 95 1971