United Nations Mine Action Service South Sudan IMSMA Monthly Report-November 2017
|
|
|
- Mary Rodgers
- 5 years ago
- Views:
Transcription
1 EOD BAC Sub Surface BAC Surface Battle Area Released Cancelled Manual Mine Clearance Mechanical Mine Clearance Mine Detection Dogs (MDD) Mined Area Released Cancelled NTS Total Area Released 1. Summary of the contamination and progress: Table 1.1: Contamination: Open Hazard: Type of Hazard Dangerous Area Ammunition Dump Battlefield Confrontation Area Minefield Previous Ambush Area Stockpile LIS SHA UXO Spot Total Running Total Closed Hazard: Type of Hazard Dangerous Area Ammunition Dump Battlefield Confrontation Area Minefield Previous Ambush Area Stockpile LIS SHA UXO Spot Total November Year ,130 1,200 Running Total , ,792 14,785 Table 1.2: Area Released (sqm): Period November , , , , , ,130,804 Year ,045 2,727,419 5,093,240 7,827, , , ,487 1,372,041 1,969,565 11,169,310 Running Total 2,859,585 20,796,816 38,298,992 61,955,393 1,201,474 8,302,975 23,303,579 4,716,277 37,524,305 1,087,186,650 1,186,666,347 Table 1.3: Devices Destroyed: Period AP AT UXO SAA November ,923 Year , ,040 Running Total 31,835 5, ,263 3,383,779 Table 1.4: Casualties: Period Killed Men Women Boys Girls Not Specified Injured Total Men Women Boys Girls Not Specified November Year Running Total ,366 1, ,302 3,596 4,962 Table 1.5: MRE: Total Total Period Boys Girls Men Women Total November 12,559 11,260 8,589 8,888 41,296 Year ,454 86,834 62,879 66, ,184 Running Total 1,194, , , ,866 3,514,334 Table 1.6: Road Opened (km): Period Road Assessed Road Verified Road Opened November Year Running Total 23,810 5,894 29,704 - Page 1/18 -
2 Table 1.7: EDD Search Operations: Period Baggage Building Open Area Vehicles Other Personnel Cargo November 11, ,727 1, ,077 Year ,016` ,024 36, ,913 Running Total 206,365 1, ,399 43, ,913 Table 1.8: Safety Briefing to UNMISS Staff: Period Men Women Total November Year , ,835 Running Total 6,268 1,587 7,892 Contacts: 1. Richard BOULTER (Richardbo@unops.org) 2. Tim Lardner (TimL@unops.org) - Page 2/18 -
3 EOD BAC Sub Surface BAC Surface Battle Area Released Cancelled Manual Mine Clearance Mechanical Mine Clearance Mine Detection Dogs (MDD) Mined Area Released Cancelled NTS Total Area Released 2. Detailed Report on Mine Action Activities in Sudan Table 2.1: Area Released by year: Year A B C D E F G H I J K L , , , , , , , , , , , , ,295 5,161,955 5,437, , , ,160, ,597, ,001 2,202,814 3,014, ,620, , ,193 2,226, ,241, , ,821 4,509,565 5,453, ,844, , ,066 3,133, ,587, ,902 1,329,853 2,966,421 4,307, , ,267 2,230, ,498 3,637, ,746, ,691, ,183 1,344,536 2,078,996 3,426, , ,707 1,956, ,227 3,848,884 35,461,437 42,737, , ,807 4,472,122 5,171,602 62, ,123 2,051, ,548 2,623, ,673 8,437, ,915 1,686,715 1,164,132 2,857,762 31, ,277 3,331, ,891 4,199,828 21,785,160 28,842, ,700,186 2,162, ,111 5,778, , ,586 3,371, ,767 4,331,369 16,993,833 27,103, ,600 1,866,318 3,698,331 5,570,249 96, ,538 2,148, ,076 2,715,960 1,037,552 9,323, ,766 2,174,080 2,218,297 4,481, , ,428 4,205, ,413 5,125,915 4,384,038 13,991, ,210 4,805,119 3,155,024 7,962,353 71, ,879 1,890, ,897 2,647,121 17,166,302 27,775, ,045 2,727,419 5,093,240 7,827, , , ,487 1,372,041 1,969,565 11,169,310 Total 2,859,585 20,796,816 38,298,992 61,955,393 1,201,474 8,302,975 23,303,579 4,716,277 37,524,305 1,087,186,650 1,186,666,347 - Page 3/18 -
4 Total Year 2017 November EOD Period BAC Sub Surface BAC Surface Battle Area Released Cancelled Manual Mine Clearance Mechanical Mine Clearance Mine Detection Dogs (MDD) Mined Area Released Cancelled NTS Total Area Released Table 2.2: Area Released by State: State West Bahr El Ghazal West Equatoria Upper Nile Lakes North Bahr El Ghazal Warrap East Equatoria Unity 8 276, , , ,883 Jonglei , , ,398 Central Equatoria , , , , ,748 Total , , , , , ,130,804 West Bahr El Ghazal , , ,020 West Equatoria Upper Nile 17 27,973 14,330 42, , , ,829 Lakes , , ,831 25,133 38,604 North Bahr El Ghazal , ,070 Warrap East Equatoria Unity , ,416 1,291, , , ,806 78,000 1,785,862 Jonglei 6 124, , , , ,069 1,147,762 1,437,990 Central Equatoria 6,979 1,945,920 3,550,787 5,503, , , , ,315 6,568,355 Total 7,045 2,727,419 5,093,240 7,827, , , ,487 1,372,041 1,969,565 11,169,310 West Bahr El Ghazal 2,522, ,644 2,823,908 6,233, , , , ,772 1,130, ,954, ,319,078 West Equatoria 281 1,448, ,044 2,088, ,520 92,200 1,075,297 69,059 1,344, ,470 3,794,360 Upper Nile 881 1,970,735 8,756,645 10,728, , ,047 1,088, ,519 3,024,136 7,905,779 21,658,176 Lakes , ,006 1,203,095 28,834 99,652 75,450 16, ,016 1,032,653 2,455,764 North Bahr El Ghazal 4, , , , ,734 24, ,292 1,507,209 2,275,003 Warrap , , , ,065,104 13,197,080 East Equatoria 86,092 3,616,486 2,854,744 6,557, ,174 1,317,841 6,292, ,294 8,742,878 28,127,967 43,428,167 Unity 81 1,949,920 1,510,138 3,460, , , ,345 1,031,683 13,875,638 18,367,460 Jonglei 3, ,660 1,187,733 1,956, , ,782 63, ,790 6,550,660 8,939,984 Central Equatoria 241,375 9,610,321 19,003,091 28,854, ,111 4,960,207 14,131,093 2,188,668 21,571,079 38,805,409 89,231,274 Total 2,859,585 20,796,816 38,298,992 61,955,393 1,201,474 8,302,975 23,303,579 4,716,277 37,524,305 1,087,186,650 1,186,666,347 - Page 4/18 -
5 Organizations Month EOD BAC Sub Surface BAC Surface Total BAC TS Cancelled Manual Mechanical MDD Total Mined Area NTS Cancelled Area Released Table 2.3: Area Released by Organization Year 2017 Mine Advisory Group 20 1,256,741 8,070 1,264, , , , ,402,807 Jan , , ,882 Feb , , ,736 Mar , , ,514 Apr , , ,945 May ,331 8,070 44, ,279 Jun , , ,348 Jul , , , , ,415 Aug , , ,745 Sep , , ,316 Oct , , ,684 Nov , , ,943 MECHEM , ,313 Mar Apr , ,195 May Jun Nov Danish Church Aid 6, , , , ,288 Jan-17 3, , ,525 Feb-17 1, , ,734 Mar Apr May ,422 Jun , , ,128 Jul , , ,026 Sep Oct Nov G4S ,951 4,480,585 5,366, , , ,296 1,049,701 7,170,545 Jan , , , , , ,508 Feb , ,488 1,062, , ,438 14,994 1,080,018 Mar ,692 2,097,810 2,141, ,071 15, , ,555 3,081,091 Apr ,227 34,675 73, , , ,726 89, ,529 - Page 5/18 -
6 May ,681 1,070,147 1,357, , , , ,581,512 Jun ,210 74, , , , ,054 25, ,540 Jul , , ,431 Aug , , ,008 Sep , , ,315 Oct , , ,729 Nov , , ,864 Danish Demining Group Jan Feb Mar Apr May Jun Jul Aug Sep Oct Nov TDI , ,585 1,189, , , , ,069 1,745,357 Jan ,400 62,800 71, , , ,247 45, ,749 Feb ,187 67, , , , , ,222 Mar ,815 50,450 54, , ,380 24, ,658 Apr ,960 7,200 32, ,960 4, ,077 May ,946 57,970 97, ,524 30, ,526 Jun ,863 42,538 48, , ,410 57, ,167 Jul ,200 2, , ,670 42, ,320 Aug , , , ,283 22, ,603 Sep ,328 44,957 51, ,285 Oct ,800 5,430 39, ,337 Nov , , , ,413 Total 7,045 2,727,419 5,093,240 7,827, , , ,487 1,372,041 1,969,565 11,169,310 - Page 6/18 -


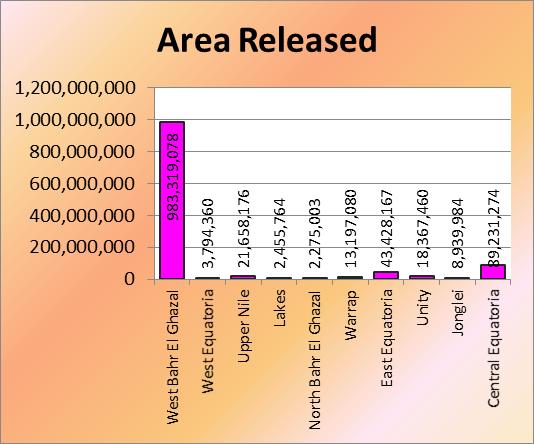
7 Chart 2.1: Area Released - Page 7/18 -
8 Total Year 2017 November Table 2.4: Devices Destroyed by year: Year AP AT UXO SAA ,955 37, ,535 6, , , , ,531 1, ,719 31, , , , , , , , , , , , , , , , , , , , , , , , , , ,040 Total 31,835 5, ,263 3,383,779 Table 2.5: Devices Destroyed by State: Period State AP AT UXO SAA West Bahr El Ghazal West Equatoria Upper Nile Lakes North Bahr El Ghazal Warrap East Equatoria Unity Jonglei Central Equatoria Total ,923 West Bahr El Ghazal 0 0 1, West Equatoria Upper Nile 1 7 7,328 23,548 Lakes ,055 North Bahr El Ghazal ,648 Warrap East Equatoria 0 1 2, Unity 0 6 3,506 26,475 Jonglei ,475 18,894 Central Equatoria , ,534 Total , ,040 West Bahr El Ghazal , ,303 West Equatoria ,764 9,548 Upper Nile 5,221 1,014 51, ,859 Lakes ,928 18,193 North Bahr El Ghazal 8 6 6,313 20,547 Warrap ,930 32,483 East Equatoria 3, , ,295 Unity , ,363 Jonglei 4, , ,815 Central Equatoria 16,979 2, ,773 1,367,373 Total 31,835 5, ,263 3,383,779 - Page 8/18 -
9 Table 2.6: Devices Destroyed by Organization Year 2017 Org/Month AP AT UXO SAA Mine Advisory Group , Jan Feb Mar Apr May Jun Jul Aug Sep Oct Nov MECHEM Mar Apr May Jun Nov Danish Church Aid ,771 10,653 Jan Feb ,970 Mar ,548 Apr ,029 May Jun Jul Oct Nov G4S , ,628 Jan ,348 Feb ,912 18,071 Mar ,480 Apr , ,992 May ,551 Jun ,195 Jul ,151 16,528 Aug Sep Oct Nov Danish Demining Group ,686 Jan Feb Mar Apr May Jun Jul Aug Sep Oct Nov TDI , ,956 Jan Page 9/18 -
10 Feb ,391 Mar Apr ,567 May ,838 Jun Jul Aug Sep Oct Nov Total , ,040 - Page 10/18 -


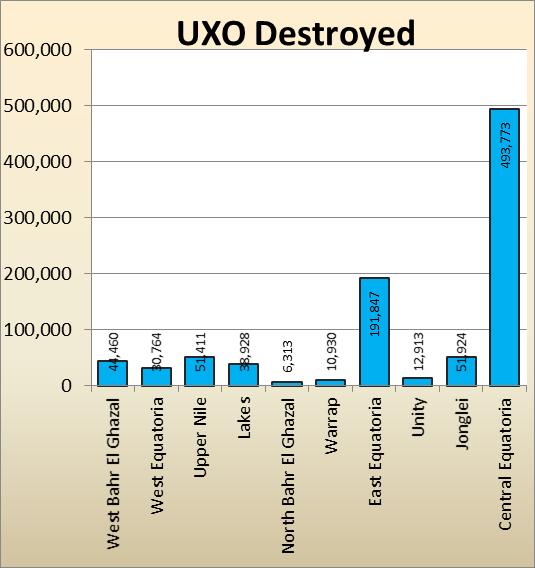
11 Chart 2.2: Devices Destroyed - Page 11/18 -
12 Total Year 2017 November Table 2.7: Casualties by States: Per. Killed State Men Women Boys Girls Not Specified Total Men Women Boys Girls Not Specified Total Total West Bahr El Ghazal West Equatoria Upper Nile Lakes North Bahr El Ghazal Warrap East Equatoria Unity Jonglei Central Equatoria Total West Bahr El Ghazal West Equatoria Upper Nile Lakes North Bahr El Ghazal Warrap East Equatoria Unity Jonglei Central Equatoria Total West Bahr El Ghazal ,149 West Equatoria Upper Nile ,223 1,500 Lakes North Bahr El Ghazal Warrap East Equatoria Unity Jonglei Central Equatoria Total ,366 1, ,302 3,596 4,962 Table 2.8: Casualties by Year: Year Killed Injured Men Women Boys Girls Not Specified Total Men Women Boys Girls Not Specified Total Total Total Injured - Page 12/18 -
13 Injured Killed Chart 2.3: Casualties Landmine/ERW Accidents ,400 1,200 1, West Bahr El Ghazal West Equatoria 1, Landmine/ERW Accidents Upper Nile Lakes North Bahr El Ghazal Warrap Accident Killed Injured East Equatoria Unity Jonglei Central Equatoria Killed 28% Boys 21% Girls 5% Injured 72% Women 11% Men 63% - Page 13/18 -
14 Total Year 2017 November Table 2.9: MRE by State Period State Boys Girls Men Women Total Table 2.10: MRE by Year West Bahr El Ghazal West Equatoria Upper Nile Lakes North Bahr El Ghazal Warrap East Equatoria Unity ,545 Jonglei ,687 Out side Central Equatoria 4,462 3,958 3,394 3,132 14,946 Total 12,559 11,260 8,589 8,888 41,296 West Bahr El Ghazal 3,793 3,616 2,583 2,418 12,410 West Equatoria Upper Nile 24,334 22, ,539 Lakes ,182 North Bahr El Ghazal Warrap East Equatoria , ,944 Unity 17,220 14,987 9,315 11,323 52,845 Jonglei 9,735 7,825 5,253 5,377 28,190 Out side Central Equatoria 36,612 33,547 29,473 28, ,010 Total 96,454 86,834 62,879 66, ,184 West Bahr El Ghazal 68,689 30,676 27,369 24, ,745 West Equatoria 58,596 43,827 39,925 26, ,013 Upper Nile 204, , , , ,797 Lakes 19,808 15,779 12,862 9,042 57,491 North Bahr El Ghazal 11,518 7,969 5,214 7,087 31,788 Warrap 19,135 11,269 15,309 10,258 55,971 East Equatoria 242, , ,763 90, ,659 Unity 111,573 89,069 79,014 80, ,649 Jonglei 162, , , , ,731 Out side 28,420 22,113 53,148 38, ,140 Central Equatoria 267, , , , ,350 Total 1,194, , , ,866 3,514,334 Year Boys Girls Men Women Total ,897 1,774 13, , ,037 17,955 85,698 26, , ,814 42, ,502 40, , , ,429 87,811 80, , ,739 73,017 64,455 55, , ,114 45,380 33,702 26, , ,538 51,173 26,781 21, , ,885 85,420 48,391 49, , ,197 58,628 56,021 54, , ,892 45,214 33,390 34, , , ,563 98, , , , ,426 71,558 79, , ,454 86,834 62,879 66, ,184 Total 1,194, , , ,866 3,514,334 - Page 14/18 -
15 Table 2.11: MRE by Organization Year 2017 Org/Month Boys Girls Men Women Total Mine Advisory Group 12,532 12,173 9,729 10,633 45,067 Jan ,096 Feb ,171 Mar ,599 Apr ,301 May-17 1,099 1, ,071 4,299 Jun-17 1,310 1, ,089 4,615 Jul-17 1,569 1,614 1,142 1,232 5,557 Aug-17 1,454 1,459 1,093 1,276 5,282 Sep ,013 3,817 Oct Nov MECHEM May Jun Nov Media Theatre Team 13,659 12,253 3,575 5,519 35,006 Jan ,252 Feb ,243 Mar-17 1,439 1, ,222 Apr-17 1,430 1, ,315 May-17 1,527 1, ,831 Jun-17 1,572 1, ,747 Jul-17 1,615 1, ,902 Aug ,009 Sep-17 1, ,633 Oct Nov Danish Church Aid 13,415 12,896 10,840 10,984 48,135 Jan ,899 Feb-17 1,234 1,166 1,138 1,159 4,697 Mar-17 2,203 2,163 1,564 1,590 7,520 Apr-17 1,181 1,638 1,002 1,607 5,428 May-17 2,627 1,854 2,052 1,329 7,862 Jun-17 2,454 2,186 2,036 1,534 8,210 Jul ,116 2,855 Aug Sep ,017 Oct Nov G4S 32,050 26,973 18,530 20,743 98,296 Jan-17 1,285 1, ,385 Feb-17 1,790 1, ,027 5,051 Mar-17 2,033 1,853 1,158 1,433 6,477 Apr-17 2,572 2,416 1,582 2,007 8,577 May-17 4,157 3,523 2,958 3,269 13,907 Jun-17 6,188 4,671 2,622 2,656 16,137 Jul-17 2,790 2,246 1,478 1,697 8,211 Aug-17 2,916 2,367 1,516 1,606 8,405 Sep-17 1,409 1,188 1,216 1,328 5,141 Oct Nov Danish Demining Group 14,083 13,092 7,824 12,231 47,230 - Page 15/18 -
16 Jan ,000 Feb-17 1,602 1, ,070 Mar-17 1,541 1, ,142 Apr-17 1, ,013 May ,614 Jun-17 1, ,627 Jul-17 1,565 1,655 1,071 1,862 6,153 Aug-17 2,230 2,260 1,754 2,899 9,143 Sep-17 1,376 1, ,437 5,036 Oct Nov United Nation Mine Action 0 0 2, ,835 Service Jan Feb Mar Apr May Jun Jul Aug Sep Oct Nov TDI 3,258 2,903 7,189 2,359 15,709 Jan Feb Mar ,186 Apr May Jun Jul ,471 Aug , ,452 Sep Oct Nov SLI_SS Oct Child Assistant Organistion Jan ,894 Feb ,490 Mar WOCO 4,132 3, ,321 10,470 Jan-17 1,107 1, ,028 Feb Mar Apr Jun Jul Aug ,266 Sep Oct Nov Community in Need Aid ,128 (CINA) Oct Total 96,454 86,834 62,879 66, ,184 - Page 16/18 -
17 West Bahr El Ghazal West Equatoria Upper Nile Lakes North Bahr El Ghazal Warrap East Equatoria Unity Jonglei Out side Central Equatoria 150, ,013 57,491 31,788 55, , , , , , ,350 Chart 2.4: MRE Audiences MRE Audience by State 900, , , , , , , , , MRE Audience by Year Women Men Girls Boys 102, ,192 80,074 98,006 79,547 66, ,830 1,774 1,897 26,742 85,698 17,955 26, ,502 87,811 42, , , ,274 55,795 64,455 73,017 26,363 21,649 33,702 26,781 45,380 51,173 87,739 54,114 64,538 49,020 71, ,563 54,505 48,391 54,892 56, ,426 85,420 34,159 58,628 33,390 45, , , ,885 78,197 62,879 86,834 96,454 - Page 17/18 -
18 West Bahr El Ghazal West Equatoria Upper Nile Lakes North Bahr El Ghazal Warrap East Equatoria Unity Jonglei Central Equatoria , ,466 1,215 1,325 1,099 1,319 1,293 1,449 1,520 1,200 1,963 2,881 2,135 4,982 Table 2.12: Hazard Closed and Open by State State Closed Open Total West Bahr El Ghazal ,011 West Equatoria Upper Nile 1, ,106 Lakes North Bahr El Ghazal Warrap East Equatoria 2, ,076 Unity 1, ,293 Jonglei 1, ,548 Central Equatoria 4, ,216 Total 14, ,396 Table 2.13: Hazard Closed by Year: Year Hazard closed , , , , , , , , ,200 Total 14,785 Chart 2.5: Status of Hazard Hazard Closed Current Status of Hazard Hazard Open Closed Hazard Page 18/18 -
GAMINGRE 8/1/ of 7
 FYE 09/30/92 JULY 92 0.00 254,550.00 0.00 0 0 0 0 0 0 0 0 0 254,550.00 0.00 0.00 0.00 0.00 254,550.00 AUG 10,616,710.31 5,299.95 845,656.83 84,565.68 61,084.86 23,480.82 339,734.73 135,893.89 67,946.95
SOUTH SUDAN POLICE SERVICE
 SOUTH SUDAN POLICE SERVICE Quarterly Crime Statistics September December GOVERNMENT OF SOUTH SUDAN MINISTRY OF INTERIOR QUARTERLY CRIME STATISTICS 3 TABLE OF CONTENTS FOREWORD 6 PREFACE 7 ACRONYMS 8 INTRODUCTION
El Nino 2015 in South Sudan: Impacts and Perspectives. Raul Cumba
 El Nino 2015 in South Sudan: Impacts and Perspectives Raul Cumba El Nino 2015-2016 The El Nino Event of 2015-2016 The 2015/16 El Nino Event Officially declared in March 2015 Now approaching peak intensity
Mountain View Community Shuttle Monthly Operations Report
 Mountain View Community Shuttle Monthly Operations Report December 6, 2018 Contents Passengers per Day, Table...- 3 - Passengers per Day, Chart...- 3 - Ridership Year-To-Date...- 4 - Average Daily Ridership
Florida Courts E-Filing Authority Board. Service Desk Report March 2019
 Florida Courts E-Filing Authority Board Service Desk Report March 219 Customer Service Incidents March 219 Status January 219 February 219 March 219 Incidents Received 3,261 3,51 3,118 Incidents Worked
Average 175, , , , , , ,046 YTD Total 1,098,649 1,509,593 1,868,795 1,418, ,169 1,977,225 2,065,321
 AGRICULTURE 01-Agriculture JUL 2,944-4,465 1,783-146 102 AUG 2,753 6,497 5,321 1,233 1,678 744 1,469 SEP - 4,274 4,183 1,596 - - 238 OCT 2,694 - - 1,032 340-276 NOV 1,979-5,822 637 3,221 1,923 1,532 DEC
Average 175, , , , , , ,940 YTD Total 944,460 1,284,944 1,635,177 1,183, ,954 1,744,134 1,565,640
 AGRICULTURE 01-Agriculture JUL 2,944-4,465 1,783-146 102 AUG 2,753 6,497 5,321 1,233 1,678 744 1,469 SEP - 4,274 4,183 1,596 - - 238 OCT 2,694 - - 1,032 340-276 NOV 1,979-5,822 637 3,221 1,923 1,532 DEC
Computing & Telecommunications Services
 Computing & Telecommunications Services Monthly Report September 214 CaTS Help Desk (937) 775-4827 1-888-775-4827 25 Library Annex helpdesk@wright.edu www.wright.edu/cats/ Table of Contents HEAT Ticket
Computing & Telecommunications Services Monthly Report January CaTS Help Desk. Wright State University (937)
") January 215 Monthly Report Computing & Telecommunications Services Monthly Report January 215 CaTS Help Desk (937) 775-4827 1-888-775-4827 25 Library Annex helpdesk@wright.edu www.wright.edu/cats/ Last
January 215 Monthly Report Computing & Telecommunications Services Monthly Report January 215 CaTS Help Desk (937) 775-4827 1-888-775-4827 25 Library Annex helpdesk@wright.edu www.wright.edu/cats/ Last
UNCLASSIFIED. Environment, Safety and Health (ESH) Report
 Report") Environment, Safety and Health (ESH) Report Perfect Days On a Perfect Day nobody is hurt, we receive no community complaints, we have no security breaches, we do not breach our environmental permit conditions,
Environment, Safety and Health (ESH) Report Perfect Days On a Perfect Day nobody is hurt, we receive no community complaints, we have no security breaches, we do not breach our environmental permit conditions,
Monthly Magnetic Bulletin
 BRITISH GEOLOGICAL SURVEY Ascension Island Observatory Monthly Magnetic Bulletin March 2017 17/03/AS Crown copyright; Ordnance Survey ASCENSION ISLAND OBSERVATORY MAGNETIC DATA 1. Introduction Ascension
REPORT ON LABOUR FORECASTING FOR CONSTRUCTION
 REPORT ON LABOUR FORECASTING FOR CONSTRUCTION For: Project: XYZ Local Authority New Sample Project Contact us: Construction Skills & Whole Life Consultants Limited Dundee University Incubator James Lindsay
FEB DASHBOARD FEB JAN FEB MAR APR MAY JUN JUL AUG SEP OCT NOV DEC
 Positive Response Compliance 215 Compliant 215 Non-Compliant 216 Compliant 216 Non-Compliant 1% 87% 96% 86% 96% 88% 89% 89% 88% 86% 92% 93% 94% 96% 94% 8% 6% 4% 2% 13% 4% 14% 4% 12% 11% 11% 12% JAN MAR
CAMBODIA MINE/ERW VICTIM INFORMATION SYSTEM
 អ ជ ញ ធរម នកមព ជ ញ C.M.A.A CAMBODIA MINE/ VICTIM INFORMATION SYSTEM MONTHLY REPORT FOR JUNE 07 Background The Cambodia / Victim Information System (CMVIS) established in 99 by the Cambodian Red Cross with
Monthly Magnetic Bulletin
 BRITISH GEOLOGICAL SURVEY Jim Carrigan Observatory Prudhoe Bay Monthly Magnetic Bulletin May 2014 14/05/JC JIM CARRIGAN OBSERVATORY MAGNETIC DATA 1. Introduction Jim Carrigan observatory is the fourth
DDAS Accident Report
 DDAS Accident Report Accident details Report date: 26/07/2005 Accident number: 421 Accident time: 09:00 Accident Date: 21/09/2003 Where it occurred: Cambondo road, 2k km from Cambaixe, Malanje Province
GMFS South Sudan CFSAM Support Kit
 GMFS South Sudan CFSAM Support Kit version 1.0 October, 2011 Table of contents 1 Disclaimer... 1 2 General introduction... 1 3 South Sudan base maps and statistics... 2 3.1 Base map... 2 3.2 Agroecological
WHEN IS IT EVER GOING TO RAIN? Table of Average Annual Rainfall and Rainfall For Selected Arizona Cities
 WHEN IS IT EVER GOING TO RAIN? Table of Average Annual Rainfall and 2001-2002 Rainfall For Selected Arizona Cities Phoenix Tucson Flagstaff Avg. 2001-2002 Avg. 2001-2002 Avg. 2001-2002 October 0.7 0.0
Annual Average NYMEX Strip Comparison 7/03/2017
 Annual Average NYMEX Strip Comparison 7/03/2017 To Year to Year Oil Price Deck ($/bbl) change Year change 7/3/2017 6/1/2017 5/1/2017 4/3/2017 3/1/2017 2/1/2017-2.7% 2017 Average -10.4% 47.52 48.84 49.58
Jayalath Ekanayake Jonas Tappolet Harald Gall Abraham Bernstein. Time variance and defect prediction in software projects: additional figures
 Jayalath Ekanayake Jonas Tappolet Harald Gall Abraham Bernstein TECHNICAL REPORT No. IFI-2.4 Time variance and defect prediction in software projects: additional figures 2 University of Zurich Department
Mr. XYZ. Stock Market Trading and Investment Astrology Report. Report Duration: 12 months. Type: Both Stocks and Option. Date: Apr 12, 2011
 Mr. XYZ Stock Market Trading and Investment Astrology Report Report Duration: 12 months Type: Both Stocks and Option Date: Apr 12, 2011 KT Astrologer Website: http://www.softwareandfinance.com/magazine/astrology/kt_astrologer.php
Monthly Magnetic Bulletin
 BRITISH GEOLOGICAL SURVEY Port Stanley Observatory Monthly Magnetic Bulletin July 2011 11/07/PS Jason Islands West Falkland King George Bay Queen Charlotte Bay Weddell Island Caracass Island Saunders Island
Salem Economic Outlook
 Salem Economic Outlook November 2012 Tim Duy, PHD Prepared for the Salem City Council November 7, 2012 Roadmap US Economic Update Slow and steady Positives: Housing/monetary policy Negatives: Rest of world/fiscal
OCHA-oPt Protection of Civilians
 OCHA-oPt Protection of Civilians Summary data tables Reports to the end of October Contents 1. Overview 2. Index of summary tables 3. Methods and sources 4. Reporting completeness 5. Duplicate reports
Calculations Equation of Time. EQUATION OF TIME = apparent solar time - mean solar time
 Calculations Equation of Time APPARENT SOLAR TIME is the time that is shown on sundials. A MEAN SOLAR DAY is a constant 24 hours every day of the year. Apparent solar days are measured from noon one day
Monthly Magnetic Bulletin
 BRITISH GEOLOGICAL SURVEY Fort McMurray Observatory Monthly Magnetic Bulletin February 2016 16/02/FM Fort McMurray FORT McMURRAY OBSERVATORY MAGNETIC DATA 1. Introduction The British Geological Survey
Monthly Magnetic Bulletin
 BRITISH GEOLOGICAL SURVEY Fort McMurray Observatory Monthly Magnetic Bulletin March 2017 17/03/FM Fort McMurray FORT McMURRAY OBSERVATORY MAGNETIC DATA 1. Introduction The British Geological Survey (BGS)
ENGINE SERIAL NUMBERS
 ENGINE SERIAL NUMBERS The engine number was also the serial number of the car. Engines were numbered when they were completed, and for the most part went into a chassis within a day or so. However, some
KING EDWARD POINT OBSERVATORY MAGNETIC DATA
 BRITISH GEOLOGICAL SURVEY King Edward d Point Observatory Monthly Magnetic Bulletin May 2018 18/05/KE King Edward Point (UK) Maps British Antarctic Survey KING EDWARD POINT OBSERVATORY MAGNETIC DATA 1.
SYSTEM BRIEF DAILY SUMMARY
 SYSTEM BRIEF DAILY SUMMARY * ANNUAL MaxTemp NEL (MWH) Hr Ending Hr Ending LOAD (PEAK HOURS 7:00 AM TO 10:00 PM MON-SAT) ENERGY (MWH) INCREMENTAL COST DAY DATE Civic TOTAL MAXIMUM @Max MINIMUM @Min FACTOR
KING EDWARD POINT OBSERVATORY MAGNETIC DATA
 BRITISH GEOLOGICAL SURVEY King Edward d Point Observatory Monthly Magnetic Bulletin September 2018 18/09/KE King Edward Point (UK) Maps British Antarctic Survey KING EDWARD POINT OBSERVATORY MAGNETIC DATA
Monthly Magnetic Bulletin
 BRITISH GEOLOGICAL SURVEY Ascension Island Observatory Monthly Magnetic Bulletin December 2008 08/12/AS Crown copyright; Ordnance Survey ASCENSION ISLAND OBSERVATORY MAGNETIC DATA 1. Introduction Ascension
KING EDWARD POINT OBSERVATORY MAGNETIC DATA
 BRITISH GEOLOGICAL SURVEY King Edward d Point Observatory Monthly Magnetic Bulletin October 2018 18/10/KE King Edward Point (UK) Maps British Antarctic Survey KING EDWARD POINT OBSERVATORY MAGNETIC DATA
Monthly Magnetic Bulletin
 BRITISH GEOLOGICAL SURVEY Port Stanley Observatory Monthly Magnetic Bulletin July 2010 10/07/PS Jason Islands a ar C West Falkland Kin gg eor ge B Port Salavador ay Weddell Island Mount Osborne So un d
H IGHWAY 3 WILDLIFE MORTALITY
 Miistakis Institute for the Rockies H IGHWAY 3 WILDLIFE MORTALITY CONTENTS Introduction 1 Methods 2 Data Limitations 3 Results 3 Discussion 8 Special points of interest: The analysis includes mortality
Scarborough Tide Gauge
 Tide Gauge Location OS: 504898E 488622N WGS84: Latitude: 54 16' 56.990"N Longitude: 00 23' 25.0279"W Instrument Valeport 740 (Druck Pressure Transducer) Benchmarks Benchmark Description TGBM = 4.18m above
SYSTEM BRIEF DAILY SUMMARY
 SYSTEM BRIEF DAILY SUMMARY * ANNUAL MaxTemp NEL (MWH) Hr Ending Hr Ending LOAD (PEAK HOURS 7:00 AM TO 10:00 PM MON-SAT) ENERGY (MWH) INCREMENTAL COST DAY DATE Civic TOTAL MAXIMUM @Max MINIMUM @Min FACTOR
ISO Lead Auditor Lean Six Sigma PMP Business Process Improvement Enterprise Risk Management IT Sales Training
 Training Calendar 2014 Public s (ISO LSS PMP BPI ERM IT Sales Training) www.excelledia.com (ISO, LSS, PMP, BPI, ERM, IT, Sales Public s) 1 Schedule Registration JANUARY FEBRUARY 2 days 26 JAN 27 JAN 3
Life Cycle of Convective Systems over Western Colombia
 Life Cycle of Convective Systems over Western Colombia Meiry Sakamoto Uiversidade de São Paulo, São Paulo, Brazil Colombia Life Cycle of Convective Systems over Western Colombia Convective System (CS)
July 2017 LOGISTICAL HARMONY
 Li s&staging(wpedestriansidewalkprot.) (4/18/through7/18/2017) July2017 101BelvidereEastFaçadeWorkPipeStaging (4/18/through7/18/2017) 101BelvidereEastFaçadeWork (through8/31/2017) Legend RampaccesstoTMCX
Did Severe Rains and Flooding in May 2015 Affect Texas Poison Center Call Patterns?
 Did Severe Rains and Flooding in May 2015 Affect Texas Poison Center Call Patterns? Mathias Forrester Epidemiologist Texas Department of State Health Services (DSHS) mathias.forrester@dshs.state.tx.us
GTR # VLTs GTR/VLT/Day %Δ:
 MARYLAND CASINOS: MONTHLY REVENUES TOTAL REVENUE, GROSS TERMINAL REVENUE, WIN/UNIT/DAY, TABLE DATA, AND MARKET SHARE CENTER FOR GAMING RESEARCH, DECEMBER 2017 Executive Summary Since its 2010 casino debut,
Monthly Magnetic Bulletin
 BRITISH GEOLOGICAL SURVEY Port Stanley Observatory Monthly Magnetic Bulletin December 2007 07/12/PS Jason Islands a ar C West Falkland Kin gg eor ge B Port Salavador ay Weddell Island Mount Osborne So
Climatography of the United States No
 Climate Division: AK 5 NWS Call Sign: ANC Month (1) Min (2) Month(1) Extremes Lowest (2) Temperature ( F) Lowest Month(1) Degree s (1) Base Temp 65 Heating Cooling 90 Number of s (3) Jan 22.2 9.3 15.8
Q3 10 Sales Tax Rate Report
 Tax Data Updates Q3 10 Sales Tax Rate Report 2010 Sabrix, Inc. All rights reserved. For more assistance, use our online resources or contact Sabrix Technical Support by opening a support request through
ISO Lead Auditor Lean Six Sigma PMP Business Process Improvement Enterprise Risk Management IT Sales Training
 Training Calendar 2014 Public s (ISO LSS PMP BPI ERM IT Sales Training) (ISO, LSS, PMP, BPI, ERM, IT, Sales Public s) 1 Schedule Registration JANUARY ) FEBRUARY 2 days 26 JAN 27 JAN 3 days 28 JAN 30 JAN
a) Name the features marked P,Q, and R b) Differentiate between a normal faulty and a reverse fault. 2. Use the diagram below to answer question (a)
 Name the features marked P,Q, and R b) Differentiate between a normal faulty and a reverse fault. 2. Use the diagram below to answer question (a)") GEOGRAPHY PAPER 312 / 1 K.C.S.E 2002 SECTION A Answer all the questions in this section 1. The diagram below represents features produced by faulting. Use it to answer questions that follow. a) Name the
GEOGRAPHY PAPER 312 / 1 K.C.S.E 2002 SECTION A Answer all the questions in this section 1. The diagram below represents features produced by faulting. Use it to answer questions that follow. a) Name the
2018 Technical Standards and Safety Authority and Ministry of Advanced Education & Skills Development Examination Schedule
 Ministry of Advanced Education & Skills Development ination Schedule Last Updated: June 7, 2018 Document Uncontrolled if Printed ination Schedule Preface: The following sets out and identifies the 2018
DEPARTMENT OF THE ARMY MILITARY SURFACE DEPLOYMENT AND DISTRIBUTION COMMAND (SDDC) 1 SOLDIER WAY SCOTT AFB, IL 62225
 1 SOLDIER WAY SCOTT AFB, IL 62225") DEPARTMENT OF THE ARMY MILITARY SURFACE DEPLOYMENT AND DISTRIBUTION COMMAND (SDDC) 1 SOLDIER WAY SCOTT AFB, IL 62225 SDDC Operations Special Requirements Branch 1 Soldier Way Scott AFB, IL 62225 April
DEPARTMENT OF THE ARMY MILITARY SURFACE DEPLOYMENT AND DISTRIBUTION COMMAND (SDDC) 1 SOLDIER WAY SCOTT AFB, IL 62225 SDDC Operations Special Requirements Branch 1 Soldier Way Scott AFB, IL 62225 April
ISO Lead Auditor Lean Six Sigma PMP Business Process Improvement Enterprise Risk Management IT Sales Training
 Training Calendar 2014 Public s (ISO LSS PMP BPI ERM IT Sales Training) (ISO, LSS, PMP, BPI, ERM, IT, Sales Public s) 1 Schedule Registration JANUARY IMS ) FEBRUARY 2 days 26 JAN 27 JAN 3 days 28 JAN 30
U.S. Outlook For October and Winter Thursday, September 19, 2013
 About This report coincides with today s release of the monthly temperature and precipitation outlooks for the U.S. from the Climate Prediction Center (CPC). U.S. CPC October and Winter Outlook The CPC
PRACTICE FOR PLACEMENT EXAM PART A
 PRACTICE FOR PLACEMENT EXAM PART A For students trying to place into: MAT 099, Intermediate Algebra MAT 000, Mathematics in Today s World MAT 00, Algebra with Trigonometry Problems - are based on Arithmetic
2019 Settlement Calendar for ASX Cash Market Products. ASX Settlement
 2019 Settlement Calendar for ASX Cash Market Products ASX Settlement Settlement Calendar for ASX Cash Market Products 1 ASX Settlement Pty Limited (ASX Settlement) operates a trade date plus two Business
SPECIMEN. Date Morning/Afternoon. A Level Geography H481/01 Physical systems Sample Question Paper. Time allowed: 1 hour 30 minutes PMT
 Oxford Cambridge and RSA A Level Geography H481/01 Physical systems Sample Question Paper Date Morning/Afternoon Time allowed: 1 hour 30 minutes You must have: the Resource Booklet the OCR 12-page Answer
Where Was Mars At Your Birth?
 Where Was Mars At Your Birth? This chart will make it easy for you to determine your Mars sign. We ve listed each of the dates that Mars enters a new sign. If you were born after June 11, 1950, when Mars
Supplementary appendix
 Supplementary appendix This appendix formed part of the original submission and has been peer reviewed. We post it as supplied by the authors. Supplement to: Lowe R, Stewart-Ibarra AM, Petrova D, et al.
BEHAVIORIAL SAFETY STORY. Why we must change the way we implement our programs?
 BEHAVIORIAL SAFETY STORY Why we must change the way we implement our programs? OBJECTIVES Compliance programs include a basic element, effectiveness. What and how to measure effectiveness or performance?
Tracking Accuracy: An Essential Step to Improve Your Forecasting Process
 Tracking Accuracy: An Essential Step to Improve Your Forecasting Process Presented by Eric Stellwagen President & Co-founder Business Forecast Systems, Inc. estellwagen@forecastpro.com Business Forecast
Chiang Rai Province CC Threat overview AAS1109 Mekong ARCC
 Chiang Rai Province CC Threat overview AAS1109 Mekong ARCC This threat overview relies on projections of future climate change in the Mekong Basin for the period 2045-2069 compared to a baseline of 1980-2005.
Safety effects of lower speed limits during winter months
 Safety effects of lower speed limits during winter months Jaakko Klang Traffic Safety Engineer Centres for Economic Development, Transport and the Environment Finland 13.9.2018 1 1. Finland 13.9.2018 2
In Centre, Online Classroom Live and Online Classroom Programme Prices
 In Centre, and Online Classroom Programme Prices In Centre Online Classroom Foundation Certificate Bookkeeping Transactions 430 325 300 Bookkeeping Controls 320 245 225 Elements of Costing 320 245 225
BRADSHAW'S RAILWAY GUIDE : accessible copies
 BRADSHAW'S RAILWAY GUIDE : accessible copies Y = copy held; YS = copy held with supplement; R = reprint held; I = incomplete copy held; F = fragile copy (not available for general public - access limited);
National Integrated Drought Information System. Southeast US Pilot for Apalachicola- Flint-Chattahoochee River Basin 20-March-2012
 National Integrated Drought Information System Southeast US Pilot for Apalachicola- Flint-Chattahoochee River Basin 20-March-2012 Current drought status from Drought Monitor http://www.drought.unl.edu/dm/monitor.html
The World Bank. Key Dates. Project Development Objectives. Components. Overall Ratings. Public Disclosure Authorized
 Public Disclosure Authorized Public Disclosure Copy AFRICA South Sudan Urban Development Global Practice IBRD/IDA Specific Investment Loan FY 2013 Seq No: 4 ARCHIVED on 11-Feb-2015 ISR18127 Implementing
CHAPTER 2 SOLUTIONS. Given: 333 houses; AWWA household average demand. a. The AWWA average household water use is 1,320 L/d
 CHAPTER 2 SOLUTIONS 2-1 Subdivision Demand Given: 333 houses; AWWA household average demand a. The AWWA average household water use is 1,320 L/d b. For the average day (333 houses)(1,320 L/d) = 439, 560
Climatography of the United States No
 Month (1) Min (2) Month(1) Extremes Lowest (2) Temperature ( F) Lowest Month(1) Degree s (1) Base Temp 65 Heating Cooling 100 Number of s (3) Jan 63.9 39.3 51.6 86 1976 16 56.6 1986 20 1976 2 47.5 1973
Climatography of the United States No
 Temperature ( F) Month (1) Min (2) Month(1) Extremes Lowest (2) Lowest Month(1) Degree s (1) Base Temp 65 Heating Cooling 100 Number of s (3) Jan 32.8 21.7 27.3 62 1918 1 35.8 1983-24 1950 29 10.5 1979
THE BUILDING SAFETY GROUP HEALTH AND SAFETY TRAINING COURSES 2018 DATES AND PRICES
 THE BUILDING SAFETY GROUP HEALTH AND SAFETY TRAINING COURSES 2018 DATES AND PRICES CONTENTS Courses we run: Accredited courses CITB Site Management Safety Training Scheme (SMSTS) CITB Site Management Safety
Jackson County 2013 Weather Data
 Jackson County 2013 Weather Data 61 Years of Weather Data Recorded at the UF/IFAS Marianna North Florida Research and Education Center Doug Mayo Jackson County Extension Director 1952-2008 Rainfall Data
Please see the attached document in relation to your Freedom of Information request.
 Our ref: 375/16 Please send me: all statistics for the last 3 years and the information to be broken down into years and months. I require national and regional statistics (UK, West Yorkshire, Leeds).
Climatography of the United States No
 Climate Division: CA 1 NWS Call Sign: Month (1) Min (2) Month(1) Extremes Lowest (2) Temperature ( F) Lowest Month(1) Degree s (1) Base Temp 65 Heating Cooling 100 Number of s (3) Jan 52.4 35.4 43.9 69
Climatography of the United States No
 Climate Division: CA 4 NWS Call Sign: Month (1) Min (2) Month(1) Extremes Lowest (2) Temperature ( F) Lowest Month(1) Degree s (1) Base Temp 65 Heating Cooling 100 Number of s (3) Jan 61.9 42.0 52.0 89
Climatography of the United States No
 Climate Division: CA 2 NWS Call Sign: Month (1) Min (2) Month(1) Extremes Lowest (2) Temperature ( F) Lowest Month(1) Degree s (1) Base Temp 65 Heating Cooling 100 Number of s (3) Jan 55.6 38.8 47.2 81
Climatography of the United States No
 Climate Division: CA 2 NWS Call Sign: Month (1) Min (2) Month(1) Extremes Lowest (2) Temperature ( F) Lowest Month(1) Degree s (1) Base Temp 65 Heating Cooling 100 Number of s (3) Jan 53.5 37.6 45.6 78
Climatography of the United States No
 Climate Division: CA 6 NWS Call Sign: Month (1) Min (2) Month(1) Extremes Lowest (2) Temperature ( F) Lowest Month(1) Degree s (1) Base Temp 65 Heating Cooling 100 Number of s (3) Jan 66.1 38.3 52.2 91
Climatography of the United States No
 Climate Division: CA 1 NWS Call Sign: Month (1) Min (2) Month(1) Extremes Lowest (2) Temperature ( F) Lowest Month(1) Degree s (1) Base Temp 65 Heating Cooling 1 Number of s (3) Jan 56.2 4.7 48.5 79 1962
Climatography of the United States No
 Climate Division: CA 1 NWS Call Sign: Month (1) Min (2) Month(1) Extremes Lowest (2) Temperature ( F) Lowest Month(1) Degree s (1) Base Temp 65 Heating Cooling 100 Number of s (3) Jan 50.2 31.2 40.7 65+
Climatography of the United States No
 Climate Division: CA 4 NWS Call Sign: Month (1) Min (2) Month(1) Extremes Lowest (2) Temperature ( F) Lowest Month(1) Degree s (1) Base Temp 65 Heating Cooling 100 Number of s (3) Jan 61.4 33.1 47.3 82+
Dummy Variables. Susan Thomas IGIDR, Bombay. 24 November, 2008
 IGIDR, Bombay 24 November, 2008 The problem of structural change Model: Y i = β 0 + β 1 X 1i + ɛ i Structural change, type 1: change in parameters in time. Y i = α 1 + β 1 X i + e 1i for period 1 Y i =
2016 Year-End Benchmark Oil and Gas Prices (Average of Previous 12 months First-Day-of-the Month [FDOM] Prices)
![2016 Year-End Benchmark Oil and Gas Prices (Average of Previous 12 months First-Day-of-the Month [FDOM] Prices)](/thumbs/85/92418365.jpg "2016 Year-End Benchmark Oil and Gas Prices (Average of Previous 12 months First-Day-of-the Month [FDOM] Prices)") Oil and Gas Benchmark Prices to Estimate Year-End Petroleum Reserves and Values Using U.S. Securities and Exchange Commission Guidelines from the Modernization of Oil and Gas Reporting Effective January
Oil and Gas Benchmark Prices to Estimate Year-End Petroleum Reserves and Values Using U.S. Securities and Exchange Commission Guidelines from the Modernization of Oil and Gas Reporting Effective January
Long-term Water Quality Monitoring in Estero Bay
 Long-term Water Quality Monitoring in Estero Bay Keith Kibbey Laboratory Director Lee County Environmental Laboratory Division of Natural Resource Management Estero Bay Monitoring Programs Three significant
Metrics Brief UNCLASS // REL USA ISAF NATO
 Metrics Brief 2007-2008 1 Kinetic Event Density Increasing Security Summary 2008 2008 24% Afghans perceive improvement, 19% perceive worsening (Sep 08 poll) FATA 2 NWFP 1 70% of kinetic events continue
Climatography of the United States No
 Climate Division: CA 4 NWS Call Sign: Month (1) Min (2) Month(1) Extremes Lowest (2) Temperature ( F) Lowest Month(1) Degree s (1) Base Temp 65 Heating Cooling 100 Number of s (3) Jan 55.6 39.3 47.5 77
Climatography of the United States No
 Climate Division: CA 5 NWS Call Sign: Month (1) Min (2) Month(1) Extremes Lowest (2) Temperature ( F) Lowest Month(1) Degree s (1) Base Temp 65 Heating Cooling 100 Number of s (3) Jan 56.6 36.5 46.6 81
Climatography of the United States No
 Climate Division: CA 5 NWS Call Sign: Month (1) Min (2) Month(1) Extremes Lowest (2) Temperature ( F) Lowest Month(1) Degree s (1) Base Temp 65 Heating Cooling 100 Number of s (3) Jan 44.8 25.4 35.1 72
Climatography of the United States No
 Climate Division: CA 1 NWS Call Sign: Month (1) Min (2) Month(1) Extremes Lowest (2) Temperature ( F) Lowest Month(1) Degree s (1) Base Temp 65 Heating Cooling 100 Number of s (3) Jan 57.9 38.9 48.4 85
Climatography of the United States No
 Climate Division: CA 4 NWS Call Sign: Month (1) Min (2) Month(1) Extremes Lowest (2) Temperature ( F) Lowest Month(1) Degree s (1) Base Temp 65 Heating Cooling 100 Number of s (3) Jan 49.4 37.5 43.5 73
Climatography of the United States No
 Climate Division: CA 6 NWS Call Sign: Month (1) Min (2) Month(1) Extremes Lowest (2) Temperature ( F) Lowest Month(1) Degree s (1) Base Temp 65 Heating Cooling 100 Number of s (3) Jan 69.4 46.6 58.0 92
Climatography of the United States No
 Climate Division: CA 6 NWS Call Sign: Month (1) Min (2) Month(1) Extremes Lowest (2) Temperature ( F) Lowest Month(1) Degree s (1) Base Temp 65 Heating Cooling 1 Number of s (3) Jan 67.5 42. 54.8 92 1971
Climatography of the United States No
 Climate Division: CA 4 NWS Call Sign: Month (1) Min (2) Month(1) Extremes Lowest (2) Temperature ( F) Lowest Month(1) Degree s (1) Base Temp 65 Heating Cooling 1 Number of s (3) Jan 58.5 38.8 48.7 79 1962
Climatography of the United States No
 Climate Division: CA 1 NWS Call Sign: Month (1) Min (2) Month(1) Extremes Lowest (2) Temperature ( F) Lowest Month(1) Degree s (1) Base Temp 65 Heating Cooling 1 Number of s (3) Jan 57.8 39.5 48.7 85 1962
Statistical Models for Rainfall with Applications to Index Insura
 Statistical Models for Rainfall with Applications to April 21, 2008 Overview The idea: Insure farmers against the risk of crop failure, like drought, instead of crop failure itself. It reduces moral hazard
Location. Datum. Survey. information. Etrometa. Step Gauge. Description. relative to Herne Bay is -2.72m. The site new level.
 Tide Gauge Location OS: 616895E 169377N WGS84: Latitude: 51 o 22.919196 N Longitude: 01 o 6.9335907 E Instrument Type Etrometa Step Gauge Benchmarks Benchmark TGBM = 5.524m above Ordnance Datum Newlyn
Reliability Education Opportunity: Reliability Analysis of Field Data
 Reliability Education Opportunity: Reliability Analysis of Field Data Vasiliy Krivtsov, PhD Sr. Staff Technical Specialist Reliability & Risk Analysis Ford Motor Company 25th Anniversary of Reliability
The Climate of Haskell County
 The Climate of Haskell County Haskell County is part of the Hardwood Forest. The Hardwood Forest is characterized by its irregular landscape and the largest lake in Oklahoma, Lake Eufaula. Average annual
How are adding integers and subtracting integers related? Work with a partner. Use integer counters to find 4 2. Remove 2 positive counters.
 . How are adding integers and subtracting integers related? ACTIVITY: Work with a partner. Use integer counters to find 4. Start with 4 positive counters. Remove positive counters. What is the total number
Tornado Hazard Risk Analysis: A Report for Rutherford County Emergency Management Agency
 Tornado Hazard Risk Analysis: A Report for Rutherford County Emergency Management Agency by Middle Tennessee State University Faculty Lisa Bloomer, Curtis Church, James Henry, Ahmad Khansari, Tom Nolan,
Climatography of the United States No
 Climate Division: ND 8 NWS Call Sign: BIS Month (1) Min (2) Month(1) Extremes Lowest (2) Temperature ( F) Lowest Month(1) Degree s (1) Base Temp 65 Heating Cooling 100 Number of s (3) Jan 21.1 -.6 10.2
Climatography of the United States No
 Climate Division: SC 7 NWS Call Sign: CHS Month (1) Min (2) Month(1) Extremes Lowest (2) Temperature ( F) Lowest Month(1) Degree s (1) Base Temp 65 Heating Cooling 100 Number of s (3) Jan 58.9 36.9 47.9
Climatography of the United States No
 Climate Division: TN 1 NWS Call Sign: Month (1) Min (2) Month(1) Extremes Lowest (2) Temperature ( F) Lowest Month(1) Degree s (1) Base Temp 65 Heating Cooling 100 Number of s (3) Jan 47.6 24.9 36.3 81