Tracking Accuracy: An Essential Step to Improve Your Forecasting Process
|
|
|
- Delilah Beatrix Hopkins
- 6 years ago
- Views:
Transcription


")
1 Tracking Accuracy: An Essential Step to Improve Your Forecasting Process Presented by Eric Stellwagen President & Co-founder Business Forecast Systems, Inc. Business Forecast Systems, Inc. 68 Leonard Street Belmont, MA USA (617)
2 On-Demand Webinars & Materials S A recording of today s Webinar will be posted next week on forecastpro.com along with the slide set (in.pdf format) All previously presented Webinars are archived and available for viewing on-demand at forecastpro.com Attendees will receive an notifying them when the recording and materials are available

3 Eric Stellwagen President, CEO & Co-founder of Business Forecast Systems, Inc. Co-author of Forecast Pro product line. More than 30 years of dedicated business forecasting experience. Served on the. board of directors of the International Institute of Forecasters for 12 years. Is currently serving on the practitioner advisory board of Foresight: The International Journal of Applied Forecasting.

4 What We ll Cover Introductions Why Track Accuracy? How Do We Measure Error? How Do We Track Accuracy? How Do We Spot Problems? Summary Q&A
5 Why Track Forecast Accuracy? To improve your forecasting process o Forecasting should be a continuous improvement process. o Improving your forecasting requires knowing what s working and what s not. To gain insight into expected performance To benchmark To spot problems early
6 How do we measure error?
7 Form of Error Measurement Tracking forecast accuracy requires measuring forecast error. Error measurements generally take one of three forms: Percentage-based measurements Unit-based measurements Relative-based measurements
8 MAPE and MAD MAPE: Mean Absolute Percent Error Tells you the average error size as a percent. MAD: Mean Absolute Deviation Tells you the average error size in units.

9 Error Measurements: MAPE The MAPE (Mean Absolute Percent Error) measures the average size of the error in percentage terms. Step 1: Calculate the absolute size of the error in each forecast period Step 2: Calculate the size of the error as a percentage of actual Step 3: Take the average percent error across periods Month Actual Forecast Absolute Error Absolute % Error % % % % MAPE 17.6%
10 Error Measurements: MAD The MAD (Mean Absolute Deviation) measures the average size of the error in units. Mean = Average of Absolute = Magnitude of (doesn t matter if it s positive or negative) Deviation = The error Step 1: Calculate the absolute size of the error in each forecast period Step 2: Take the average across periods Month Actual Forecast Absolute Error MAD 22.08
11 Error Measurement Considerations The MAPE is easy to interpret, even when you don t know a product s demand volume; however, the MAPE is scale sensitive and becomes meaningless for lowvolume data or data with zero demand periods. The MAD is a good statistic to use when analyzing a single product s forecast and you know the demand volume.
12 Measuring Error Across Products Aggregating error measurements across products can be problematic. When aggregating MAPEs, low-volume products can dominate the results. When aggregating MADs, high-volume products can dominate the results. When aggregating across products some corporations establish weighted error measurements to properly reflect the various products relative importance to the corporation. This is an excellent practice.
13 How do we track accuracy?
14 Types of Accuracy Measures Within-sample statistics (a.k.a. goodness-of-fit statistics) tell you how accurately a forecasting method tracks the historical data.
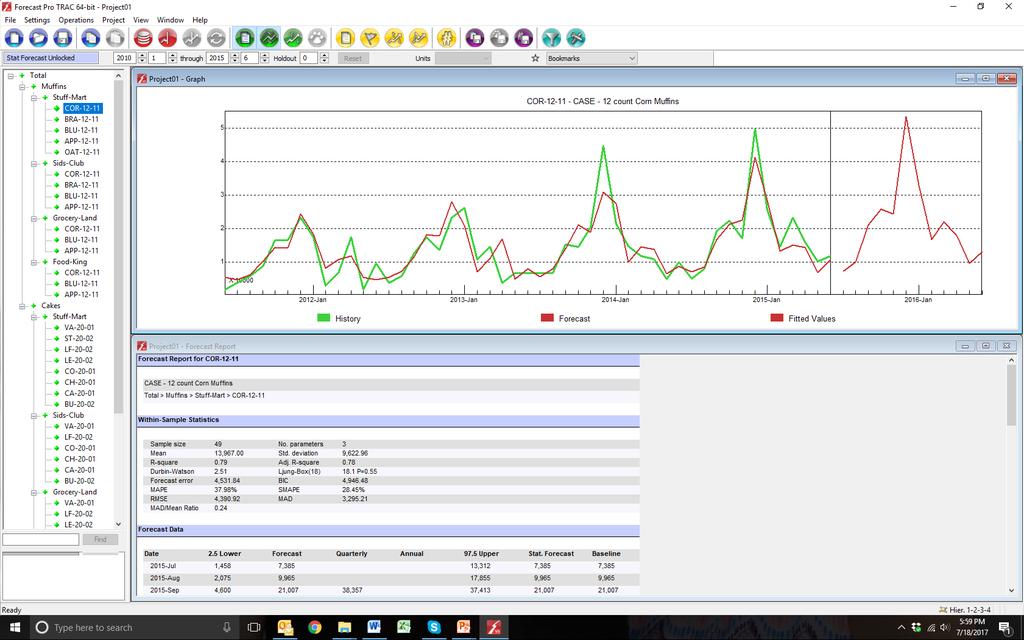
15 Within-sample Statistics
16 Within-sample Statistics Can aid the model-building process. Are NOT a good indicator of expected performance.
17 Types of Accuracy Measures Within-sample statistics (a.k.a. goodness-of-fit statistics) tell you how accurately a forecasting method tracks the historical data. Out-of-sample statistics tell you how accurately a forecasting method actually forecasted: Hold-out analysis Wait and See : Real-time tracking Out-of-sample statistics yield a better measure of expected forecast accuracy than within-sample statistics, with real-time tracking providing the best error accuracy measurements.

18 Hold-out Analysis
19 Hold-out Analysis Allows you to compare different approaches Provides insight into expected accuracy May not be able to simulate your true forecasting process
20 Real-time Tracking
21 Real-Time Tracking Tracks the actual forecast process Allows you to compare different forecasts (e.g., statistical vs. adjusted vs. salesperson s, etc.) Can be used to determine the value add (if any) of judgment Provides the most accurate insight into expected accuracy Is the strongest of all approaches
22 Building a Forecast Archive We begin with historic data through December 2016 and generate a forecast Date Jan-17 Feb-17 Mar-17 Apr-17 May-17 Jun-17 Actual Origin 2016-Dec 25,950 11,808 12,429 11,302 6,033 8,211
23 Building a Forecast Archive Once January's demand is known we generate a new forecast Date Jan-17 Feb-17 Mar-17 Apr-17 May-17 Jun-17 Jul-17 Actual 18,468 Origin 2016-Dec 25,950 11,808 12,429 11,302 6,033 8, Jan 12,697 14,114 13,535 6,837 9,726 6,780
24 Building a Forecast Archive Once February's demand is known we generate a new forecast Date Jan-17 Feb-17 Mar-17 Apr-17 May-17 Jun-17 Jul-17 Aug-17 Actual 18,468 9,720 Origin 2016-Dec 25,950 11,808 12,429 11,302 6,033 8, Jan 12,697 14,114 13,535 6,837 9,726 6, Feb 13,265 12,913 6,654 9,102 6,574 8,493
25 Building a Forecast Archive Once March's demand is known we generate a new forecast Date Jan-17 Feb-17 Mar-17 Apr-17 May-17 Jun-17 Jul-17 Aug-17 Sep-17 Actual 18,468 9,720 15,552 Origin 2016-Dec 25,950 11,808 12,429 11,302 6,033 8, Jan 12,697 14,114 13,535 6,837 9,726 6, Feb 13,265 12,913 6,654 9,102 6,574 8, Mar 9,623 4,364 6,983 4,801 6,901 14,710
26 Building a Forecast Archive Once April's demand is known we generate a new forecast Date Jan-17 Feb-17 Mar-17 Apr-17 May-17 Jun-17 Jul-17 Aug-17 Jan-17 Oct-17 Actual 18,468 9,720 15,552 10,692 Origin 2016-Dec 25,950 11,808 12,429 11,302 6,033 8, Jan 12,697 14,114 13,535 6,837 9,726 6, Feb 13,265 12,913 6,654 9,102 6,574 8, Mar 9,623 4,364 6,983 4,801 6,901 14, Apr 4,367 6,994 4,802 6,905 14,725 17,624
27 Building a Forecast Archive Once May's demand is known we generate a new forecast Date Jan-17 Feb-17 Mar-17 Apr-17 May-17 Jun-17 Jul-17 Aug-17 Jan-17 Oct-17 Nov-17 Actual 18,468 9,720 15,552 10,692 6,804 Origin 2016-Dec 25,950 11,808 12,429 11,302 6,033 8, Jan 12,697 14,114 13,535 6,837 9,726 6, Feb 13,265 12,913 6,654 9,102 6,574 8, Mar 9,623 4,364 6,983 4,801 6,901 14, Apr 4,367 6,994 4,802 6,905 14,725 17, May 6,873 4,800 6,858 14,554 17,527 15,184
28 Building a Forecast Archive Once June 2017 sales are known, we can compare the forecasts in the red box to what actually happened--this is the basis for a "waterfall" report Date Jan-17 Feb-17 Mar-17 Apr-17 May-17 Jun-17 Jul-17 Aug-17 Jan-17 Oct-17 Nov-17 Actual 18,468 9,720 15,552 10,692 6,804 7,776 Origin 2016-Dec 25,950 11,808 12,429 11,302 6,033 8, Jan 12,697 14,114 13,535 6,837 9,726 6, Feb 13,265 12,913 6,654 9,102 6,574 8, Mar 9,623 4,364 6,983 4,801 6,901 14, Apr 4,367 6,994 4,802 6,905 14,725 17, May 6,873 4,800 6,858 14,554 17,527 15,184
29 A Waterfall Report Adjusted forecast Showing forecasts Date Jan-17 Feb-17 Mar-17 Apr-17 May-17 Jun-17 Actual 18,468 9,720 15,552 10,692 6,804 7,776 Origin 2016-Dec 25,950 11,808 12,429 11,302 6,033 8, Jan 12,697 14,114 13,535 6,837 9, Feb 13,265 12,913 6,654 9, Mar 9,623 4,364 6, Apr 4,367 6, May 6,873 Lead time Series Analysis No. observations Avg. Forecast 12,129 12,811 13,373 13,778 14,061 13,474 Avg. Error 627 1,309 1,871 2,276 2,559 1,972 MAD 2,859 2,862 3,226 2,785 3,070 2,298 Avg. Perc. Error -0.1% 5.3% 12.7% 17.1% 19.6% 15.7% MAPE 23.9% 23.6% 23.5% 20.4% 25.0% 18.5% CMAPE 6.0% 6.0% 6.5% 5.3% 6.3% 5.0%
30 Relative Absolute Error MAD: Mean Absolute Deviation Tells you the average error size in units. MAPE: Mean Absolute Percent Error Tells you the average error size as a percent. RAE: Relative Absolute Error Tells you the error size relative to the error from a Naïve model (same as last period)..

31 Error Measurements: RAE The RAE (Relative Absolute Error) is the ratio of the absolute error from the current method to the absolute error from a Naïve model. A geometric mean can be used to average RAEs. Actual Forecast Actual Naive _ Forecast Month Actual Forecast Absolute Error Naïve Forecast Naïve Absolute Error GMRAE 0.77 RAE
32 FVA Stair Step Report The RAE provides an indication of the value added (or destroyed) by your current forecasting model. This concept can be extended to generate a Forecast Value Add (FVA) report Process Step Naïve Forecast Statistical Forecast Demand Planner Override Forecast Accuracy 60% FVA vs. Naïve 65% 5% FVA vs. Statistical 62% 2% -3% You can report on an individual time series, or for an aggregation of many (or all) time series. If you are doing better than a Naïve forecast, your process is adding value. If you are doing worse than a Naïve forecast, you are simply wasting time and resources. (Slide courtesy of Mike Gilliland, SAS Institute, Inc.)
33 Exception Reports
34 Exception Reports Reduce the need for manual review. Allow you to focus on the items where human attention is most needed.
35 Summary
36 Conclusions Tracking forecast accuracy allows you to improve your forecasting process, gain insight into expected performance, benchmark and spot problems quickly. All error measurement statistics have strengths and weaknesses and care should used when selecting which ones to focus on. Out-of-sample performance provides a better measure of expected forecast accuracy than within-sample performance. Exception reports are a useful tool to zero in on forecasts that need human attention.
37 Tracking Accuracy: Best Practices Establish a forecast archive and routinely track accuracy. Ideally, track every step in your forecasting process to determine what is adding/destroying value. Establish a feedback loop to allow participants to learn and improve. Monitor for changes in forecast accuracy and take action when necessary. Understand the differences among error measurements and choose appropriate metrics for the task at hand.
38 Our Next Webinar How to Boost Your Forecast Accuracy by Modeling the Impact of Promotions and Other Events October 26, 1:30 pm EDT Presented by Sarah Darin, Senior Consultant, Business Forecast Systems, Inc. Visit to sign up!
39 On-Demand Webinars & Materials S A recording of today s Webinar will be posted next week on forecastpro.com along with the slide set (in.pdf format) All previously presented Webinars are archived and available for viewing on-demand on forecastpro.com Attendees will receive an notifying them when the recording and materials are available
40 User Conference Forecast Pro User Conference 2017 October 2-4, 2017 in Boston, MA USA Designed to help you get the most out of Forecast Pro and to improve your forecasting. Is structured as an intimate event where you can make valuable connections with other Forecast Pro users (60 people max). Features tutorials, user case studies, product training, panels and networking events. More info at: forecastpro.com/userconference2017/index.html
41 Forecast Pro Software S Examples from today s Webinar used Forecast Pro To learn more about Forecast Pro: Request a live WebEx demo for your team (submit your request as a question right now) Visit Call us at
42 Training and Workshops We offer forecasting seminars, Webinars and product training workshops. On-site, and remote-based (via WebEx) classes are available. Learn more at Subscribe to our blog at theforecastpro.com
43 Questions?
44 Thank you for attending!
Four Basic Steps for Creating an Effective Demand Forecasting Process
 Four Basic Steps for Creating an Effective Demand Forecasting Process Presented by Eric Stellwagen President & Cofounder Business Forecast Systems, Inc. estellwagen@forecastpro.com Business Forecast Systems,
Effective Strategies for Forecasting a Product Hierarchy
 Effective Strategies for Forecasting a Product Hierarchy Presented by Eric Stellwagen Vice President & Cofounder Business Forecast Systems, Inc. estellwagen@forecastpro.com Business Forecast Systems, Inc.
The Ins and Outs of Using Dynamic Regression Models for Forecasting
 The Ins and Outs of Using Dynamic Regression Models for Forecasting Presented by Eric Stellwagen Vice President & Cofounder Business Forecast Systems, Inc. estellwagen@forecastpro.com Business Forecast
Computing & Telecommunications Services Monthly Report January CaTS Help Desk. Wright State University (937)
") January 215 Monthly Report Computing & Telecommunications Services Monthly Report January 215 CaTS Help Desk (937) 775-4827 1-888-775-4827 25 Library Annex helpdesk@wright.edu www.wright.edu/cats/ Last
January 215 Monthly Report Computing & Telecommunications Services Monthly Report January 215 CaTS Help Desk (937) 775-4827 1-888-775-4827 25 Library Annex helpdesk@wright.edu www.wright.edu/cats/ Last
GAMINGRE 8/1/ of 7
 FYE 09/30/92 JULY 92 0.00 254,550.00 0.00 0 0 0 0 0 0 0 0 0 254,550.00 0.00 0.00 0.00 0.00 254,550.00 AUG 10,616,710.31 5,299.95 845,656.83 84,565.68 61,084.86 23,480.82 339,734.73 135,893.89 67,946.95
WHEN IS IT EVER GOING TO RAIN? Table of Average Annual Rainfall and Rainfall For Selected Arizona Cities
 WHEN IS IT EVER GOING TO RAIN? Table of Average Annual Rainfall and 2001-2002 Rainfall For Selected Arizona Cities Phoenix Tucson Flagstaff Avg. 2001-2002 Avg. 2001-2002 Avg. 2001-2002 October 0.7 0.0
Computing & Telecommunications Services
 Computing & Telecommunications Services Monthly Report September 214 CaTS Help Desk (937) 775-4827 1-888-775-4827 25 Library Annex helpdesk@wright.edu www.wright.edu/cats/ Table of Contents HEAT Ticket
Getting the Most out of Statistical Forecasting!
 Getting the Most out of Statistical Forecasting! Author: Ryan Rickard, Senior Consultant Published: September 2017 About SCMO 2 Founded in 2001, SCMO2 Specializes in High-End Supply Chain Consulting Work
REPORT ON LABOUR FORECASTING FOR CONSTRUCTION
 REPORT ON LABOUR FORECASTING FOR CONSTRUCTION For: Project: XYZ Local Authority New Sample Project Contact us: Construction Skills & Whole Life Consultants Limited Dundee University Incubator James Lindsay
Forecasting. Copyright 2015 Pearson Education, Inc.
 5 Forecasting To accompany Quantitative Analysis for Management, Twelfth Edition, by Render, Stair, Hanna and Hale Power Point slides created by Jeff Heyl Copyright 2015 Pearson Education, Inc. LEARNING
YACT (Yet Another Climate Tool)? The SPI Explorer
? The SPI Explorer") YACT (Yet Another Climate Tool)? The SPI Explorer Mike Crimmins Assoc. Professor/Extension Specialist Dept. of Soil, Water, & Environmental Science The University of Arizona Yes, another climate tool for
YACT (Yet Another Climate Tool)? The SPI Explorer Mike Crimmins Assoc. Professor/Extension Specialist Dept. of Soil, Water, & Environmental Science The University of Arizona Yes, another climate tool for
Technical note on seasonal adjustment for M0
 Technical note on seasonal adjustment for M0 July 1, 2013 Contents 1 M0 2 2 Steps in the seasonal adjustment procedure 3 2.1 Pre-adjustment analysis............................... 3 2.2 Seasonal adjustment.................................
Multivariate Regression Model Results
 Updated: August, 0 Page of Multivariate Regression Model Results 4 5 6 7 8 This exhibit provides the results of the load model forecast discussed in Schedule. Included is the forecast of short term system
FEB DASHBOARD FEB JAN FEB MAR APR MAY JUN JUL AUG SEP OCT NOV DEC
 Positive Response Compliance 215 Compliant 215 Non-Compliant 216 Compliant 216 Non-Compliant 1% 87% 96% 86% 96% 88% 89% 89% 88% 86% 92% 93% 94% 96% 94% 8% 6% 4% 2% 13% 4% 14% 4% 12% 11% 11% 12% JAN MAR
2019 Settlement Calendar for ASX Cash Market Products. ASX Settlement
 2019 Settlement Calendar for ASX Cash Market Products ASX Settlement Settlement Calendar for ASX Cash Market Products 1 ASX Settlement Pty Limited (ASX Settlement) operates a trade date plus two Business
Lesson Adaptation Activity: Analyzing and Interpreting Data
 Lesson Adaptation Activity: Analyzing and Interpreting Data Related MA STE Framework Standard: 3-ESS2-1. Use graphs and tables of local weather data to describe and predict typical weather during a particular
SYSTEM BRIEF DAILY SUMMARY
 SYSTEM BRIEF DAILY SUMMARY * ANNUAL MaxTemp NEL (MWH) Hr Ending Hr Ending LOAD (PEAK HOURS 7:00 AM TO 10:00 PM MON-SAT) ENERGY (MWH) INCREMENTAL COST DAY DATE Civic TOTAL MAXIMUM @Max MINIMUM @Min FACTOR
BUSI 460 Suggested Answers to Selected Review and Discussion Questions Lesson 7
 BUSI 460 Suggested Answers to Selected Review and Discussion Questions Lesson 7 1. The definitions follow: (a) Time series: Time series data, also known as a data series, consists of observations on a
SYSTEM BRIEF DAILY SUMMARY
 SYSTEM BRIEF DAILY SUMMARY * ANNUAL MaxTemp NEL (MWH) Hr Ending Hr Ending LOAD (PEAK HOURS 7:00 AM TO 10:00 PM MON-SAT) ENERGY (MWH) INCREMENTAL COST DAY DATE Civic TOTAL MAXIMUM @Max MINIMUM @Min FACTOR
Improve Forecasts: Use Defect Signals
 Improve Forecasts: Use Defect Signals Paul Below paul.below@qsm.com Quantitative Software Management, Inc. Introduction Large development and integration project testing phases can extend over many months
ACCA Interactive Timetable
 ACCA Interactive Timetable 2018 Professional Version 7.1 Information last updated 15th May 2018 Please note: Information and dates in this timetable are subject to change. A better way of learning that
STATISTICAL FORECASTING and SEASONALITY (M. E. Ippolito; )
") STATISTICAL FORECASTING and SEASONALITY (M. E. Ippolito; 10-6-13) PART I OVERVIEW The following discussion expands upon exponential smoothing and seasonality as presented in Chapter 11, Forecasting, in
STATISTICAL FORECASTING and SEASONALITY (M. E. Ippolito; 10-6-13) PART I OVERVIEW The following discussion expands upon exponential smoothing and seasonality as presented in Chapter 11, Forecasting, in
ISO Lead Auditor Lean Six Sigma PMP Business Process Improvement Enterprise Risk Management IT Sales Training
 Training Calendar 2014 Public s (ISO LSS PMP BPI ERM IT Sales Training) www.excelledia.com (ISO, LSS, PMP, BPI, ERM, IT, Sales Public s) 1 Schedule Registration JANUARY FEBRUARY 2 days 26 JAN 27 JAN 3
Published by ASX Settlement Pty Limited A.B.N Settlement Calendar for ASX Cash Market Products
 Published by Pty Limited A.B.N. 49 008 504 532 2012 Calendar for Cash Market Products Calendar for Cash Market Products¹ Pty Limited ( ) operates a trade date plus three Business (T+3) settlement discipline
ACCA Interactive Timetable & Fees
 ACCA Interactive Timetable & Fees 2018/19 Professional Version 2.1 Information last updated uary 2019 Please note: Information and dates in this timetable are subject to change. A better way of learning
ACCA Interactive Timetable
 ACCA Interactive Timetable 2018 Professional information last updated 4 April 2018 v3.1 Please note: Information and dates in this timetable are subject to change. How the 4 exam sittings can work for
Florida Courts E-Filing Authority Board. Service Desk Report March 2019
 Florida Courts E-Filing Authority Board Service Desk Report March 219 Customer Service Incidents March 219 Status January 219 February 219 March 219 Incidents Received 3,261 3,51 3,118 Incidents Worked
Jackson County 2013 Weather Data
 Jackson County 2013 Weather Data 61 Years of Weather Data Recorded at the UF/IFAS Marianna North Florida Research and Education Center Doug Mayo Jackson County Extension Director 1952-2008 Rainfall Data
CIMA Dates and Prices Online Classroom Live September August 2016
 CIMA Dates and Prices Online Classroom Live September 2015 - August 2016 This document provides detail of the programmes that are being offered for the Objective Tests and Integrated Case Study Exams from
ACCA Interactive Timetable
 ACCA Interactive Timetable 2018 Professional Version 9.1 Information last updated 18 July 2018 Please note: Information and dates in this timetable are subject to change. A better way of learning that
ACCA Interactive Timetable
 ACCA Interactive Timetable 2018 Professional Version 3.1 Information last updated 1st May 2018 Book Please online note: atinformation and dates in this timetable are subject Or to change. call -enrol A
ACCA Interactive Timetable & Fees
 ACCA Interactive Timetable & Fees 2018/19 Professional Version 2.1 Information last updated 01 November 2018 Please note: Information and dates in this timetable are subject to change. A better way of
2018 Annual Review of Availability Assessment Hours
 2018 Annual Review of Availability Assessment Hours Amber Motley Manager, Short Term Forecasting Clyde Loutan Principal, Renewable Energy Integration Karl Meeusen Senior Advisor, Infrastructure & Regulatory
NASA Products to Enhance Energy Utility Load Forecasting
 NASA Products to Enhance Energy Utility Load Forecasting Erica Zell, Battelle zelle@battelle.org, Arlington, VA ESIP 2010 Summer Meeting, Knoxville, TN, July 20-23 Project Overview Funded by the NASA Applied
ISO Lead Auditor Lean Six Sigma PMP Business Process Improvement Enterprise Risk Management IT Sales Training
 Training Calendar 2014 Public s (ISO LSS PMP BPI ERM IT Sales Training) (ISO, LSS, PMP, BPI, ERM, IT, Sales Public s) 1 Schedule Registration JANUARY ) FEBRUARY 2 days 26 JAN 27 JAN 3 days 28 JAN 30 JAN
ACCA Interactive Timetable
 ACCA Interactive Timetable 2018 Professional information last updated uary 2018 v4 Please note: Information and dates in this timetable are subject to change. How the 4 exam sittings can work for you ACCA
ISO Lead Auditor Lean Six Sigma PMP Business Process Improvement Enterprise Risk Management IT Sales Training
 Training Calendar 2014 Public s (ISO LSS PMP BPI ERM IT Sales Training) (ISO, LSS, PMP, BPI, ERM, IT, Sales Public s) 1 Schedule Registration JANUARY IMS ) FEBRUARY 2 days 26 JAN 27 JAN 3 days 28 JAN 30
Summary of Seasonal Normal Review Investigations CWV Review
 Summary of Seasonal Normal Review Investigations CWV Review DESC 31 st March 2009 1 Contents Stage 1: The Composite Weather Variable (CWV) An Introduction / background Understanding of calculation Stage
Jackson County 2018 Weather Data 67 Years of Weather Data Recorded at the UF/IFAS Marianna North Florida Research and Education Center
 Jackson County 2018 Weather Data 67 Years of Weather Data Recorded at the UF/IFAS Marianna North Florida Research and Education Center Doug Mayo Jackson County Extension Director 1952-2008 Rainfall Data
Sales Analysis User Manual
 Sales Analysis User Manual Confidential Information This document contains proprietary and valuable, confidential trade secret information of APPX Software, Inc., Richmond, Virginia Notice of Authorship
Life Cycle of Convective Systems over Western Colombia
 Life Cycle of Convective Systems over Western Colombia Meiry Sakamoto Uiversidade de São Paulo, São Paulo, Brazil Colombia Life Cycle of Convective Systems over Western Colombia Convective System (CS)
GTR # VLTs GTR/VLT/Day %Δ:
 MARYLAND CASINOS: MONTHLY REVENUES TOTAL REVENUE, GROSS TERMINAL REVENUE, WIN/UNIT/DAY, TABLE DATA, AND MARKET SHARE CENTER FOR GAMING RESEARCH, DECEMBER 2017 Executive Summary Since its 2010 casino debut,
DAILY QUESTIONS 28 TH JUNE 18 REASONING - CALENDAR
 DAILY QUESTIONS 28 TH JUNE 18 REASONING - CALENDAR LEAP AND NON-LEAP YEAR *A non-leap year has 365 days whereas a leap year has 366 days. (as February has 29 days). *Every year which is divisible by 4
2017 Settlement Calendar for ASX Cash Market Products ASX SETTLEMENT
 2017 Settlement Calendar for ASX Cash Market Products ASX SETTLEMENT Settlement Calendar for ASX Cash Market Products 1 ASX Settlement Pty Limited (ASX Settlement) operates a trade date plus two Business
Determine the trend for time series data
 Extra Online Questions Determine the trend for time series data Covers AS 90641 (Statistics and Modelling 3.1) Scholarship Statistics and Modelling Chapter 1 Essent ial exam notes Time series 1. The value
ACCA Interactive Timetable
 ACCA Interactive Timetable 2018 Professional Version 5.1 Information last updated 2nd May 2018 Please note: Information and dates in this timetable are subject to change. A better way of learning that
Lecture Prepared By: Mohammad Kamrul Arefin Lecturer, School of Business, North South University
 Lecture 15 20 Prepared By: Mohammad Kamrul Arefin Lecturer, School of Business, North South University Modeling for Time Series Forecasting Forecasting is a necessary input to planning, whether in business,
Mountain View Community Shuttle Monthly Operations Report
 Mountain View Community Shuttle Monthly Operations Report December 6, 2018 Contents Passengers per Day, Table...- 3 - Passengers per Day, Chart...- 3 - Ridership Year-To-Date...- 4 - Average Daily Ridership
Dates and Prices ICAEW - Manchester In Centre Programme Prices
 Dates and Prices ICAEW - Manchester - 2019 In Centre Programme Prices Certificate Level GBP ( ) Intensive Accounting 690 Assurance 615 Law 615 Business, Technology and Finance 615 Mangement Information
Winter Season Resource Adequacy Analysis Status Report
 Winter Season Resource Adequacy Analysis Status Report Tom Falin Director Resource Adequacy Planning Markets & Reliability Committee October 26, 2017 Winter Risk Winter Season Resource Adequacy and Capacity
2016 Year-End Benchmark Oil and Gas Prices (Average of Previous 12 months First-Day-of-the Month [FDOM] Prices)
![2016 Year-End Benchmark Oil and Gas Prices (Average of Previous 12 months First-Day-of-the Month [FDOM] Prices)](/thumbs/85/92418365.jpg "2016 Year-End Benchmark Oil and Gas Prices (Average of Previous 12 months First-Day-of-the Month [FDOM] Prices)") Oil and Gas Benchmark Prices to Estimate Year-End Petroleum Reserves and Values Using U.S. Securities and Exchange Commission Guidelines from the Modernization of Oil and Gas Reporting Effective January
Oil and Gas Benchmark Prices to Estimate Year-End Petroleum Reserves and Values Using U.S. Securities and Exchange Commission Guidelines from the Modernization of Oil and Gas Reporting Effective January
How Accurate is My Forecast?
 How Accurate is My Forecast? Tao Hong, PhD Utilities Business Unit, SAS 15 May 2012 PLEASE STAND BY Today s event will begin at 11:00am EDT The audio portion of the presentation will be heard through your
ACCA Interactive Timetable & Fees
 ACCA Interactive Timetable & Fees 2018/19 Professional Version 1.1 Information last updated tember 2018 Please note: Information and dates in this timetable are subject to change. A better way of learning
ENGINE SERIAL NUMBERS
 ENGINE SERIAL NUMBERS The engine number was also the serial number of the car. Engines were numbered when they were completed, and for the most part went into a chassis within a day or so. However, some
ACCA Interactive Timetable & Fees
 ACCA Interactive Timetable & Fees 2018/19 Professional Version 1.1 Information last updated tember 2018 Please note: Information and dates in this timetable are subject to change. A better way of learning
Suan Sunandha Rajabhat University
 Forecasting Exchange Rate between Thai Baht and the US Dollar Using Time Series Analysis Kunya Bowornchockchai Suan Sunandha Rajabhat University INTRODUCTION The objective of this research is to forecast
ACCA Interactive Timetable & Fees
 ACCA Interactive Timetable & Fees 2018/19 Professional London Version 1.1 Information last updated 3 October 2018 Please note: Information and dates in this timetable are subject to change. A better way
CIMA Professional
 CIMA Professional 201819 Manchester Interactive Timetable Version 3.1 Information last updated 12/10/18 Please note: Information and dates in this timetable are subject to change. A better way of learning
ACCA Interactive Timetable & Fees
 ACCA Interactive Timetable & Fees 2018/19 Professional Version 1.1 Information last updated tember 2018 Please note: Information and dates in this timetable are subject to change. A better way of learning
CIMA Professional
 CIMA Professional 201819 Birmingham Interactive Timetable Version 3.1 Information last updated 12/10/18 Please note: Information and dates in this timetable are subject to change. A better way of learning
ACCA Interactive Timetable & Fees
 ACCA Interactive Timetable & Fees 2018 Professional Version 4.1 Information last updated 11th September 2018 Please note: Information and dates in this timetable are subject to change. A better way of
FVA Analysis and Forecastability
 FVA Analysis and Forecastability Michael Gilliland, CFPIM Product Marketing Manager - Forecasting SAS About SAS World s largest private software company $2.43 billion revenue in 2010 50,000 customer sites
ACCA Interactive Timetable
 ACCA Interactive Timetable 2018 Professional information last updated uary 2018 v4.1 Please note: Information and dates in this timetable are subject to change. How the 4 exam sittings can work for you
Location. Datum. Survey. information. Etrometa. Step Gauge. Description. relative to Herne Bay is -2.72m. The site new level.
 Tide Gauge Location OS: 616895E 169377N WGS84: Latitude: 51 o 22.919196 N Longitude: 01 o 6.9335907 E Instrument Type Etrometa Step Gauge Benchmarks Benchmark TGBM = 5.524m above Ordnance Datum Newlyn
ACCA Interactive Timetable & Fees
 ACCA Interactive Timetable & Fees 2018/19 Professional Milton Keynes Version 1.1 Information last updated tember 2018 Please note: Information and dates in this timetable are subject to change. A better
ACCA Interactive Timetable & Fees
 ACCA Interactive Timetable & Fees 2018/19 Professional Version 3.1 Information last updated 1st May 2018 Please note: Information and dates in this timetable are subject to change. A better way of learning
Scarborough Tide Gauge
 Tide Gauge Location OS: 504898E 488622N WGS84: Latitude: 54 16' 56.990"N Longitude: 00 23' 25.0279"W Instrument Valeport 740 (Druck Pressure Transducer) Benchmarks Benchmark Description TGBM = 4.18m above
Location. Datum. Survey. information. Etrometa. Step Gauge. Description. relative to Herne Bay is -2.72m. The site new level.
 Tide Gauge Location OS: 616895E 169377N WGS84: Latitude: 51 o 22.919196 N Longitude: 01 o 6.9335907 E Instrument Type Etrometa Step Gauge Benchmarks Benchmark TGBM = 5.524m above Ordnance Datum Newlyn
ACCA Interactive Timetable
 ACCA Interactive Timetable 2018 Professional Version 3.1 Information last updated 1st May 2018 Please note: Information and dates in this timetable are subject to change. A better way of learning that
Introduction to TIGGE and GIFS. Richard Swinbank, with thanks to members of GIFS-TIGGE WG & THORPEX IPO
 Introduction to TIGGE and GIFS Richard Swinbank, with thanks to members of GIFS-TIGGE WG & THORPEX IPO GIFS-TIGGE/NCAR/NOAA Workshop on EPS developments, June 2012 TIGGE THORPEX Interactive Grand Global
ACCA Interactive Timetable
 ACCA Interactive Timetable 2018 Professional information last updated uary 2018 v2.1 Please note: Information and dates in this timetable are subject to change. How the 4 exam sittings can work for you
ACCA Interactive Timetable & Fees
 ACCA Interactive Timetable & Fees 2018/19 Professional Version 1.1 Information last updated tember 2018 Please note: Information and dates in this timetable are subject to change. A better way of learning
Astrophysics. Paul Hertz Director, Astrophysics Division Science Mission
 National Aeronautics and Space Administration Astrophysics R&A Update from the NASA Town Hall Meeting AAS 231st Meeting Washington, DC January 10, 2018 www.nasa.gov Paul Hertz Director, Astrophysics Division
2013 GROWTH INCENTIVES PROGRAM FAQS
 GROWTH INCENTIVES PROGRAM FAQS IBO eligibility for the Growth Incentives Program is at the discretion of Amway and is based on conduct that demonstrates high ethical and business standards aligned with
PRACTICE FOR PLACEMENT EXAM PART A
 PRACTICE FOR PLACEMENT EXAM PART A For students trying to place into: MAT 099, Intermediate Algebra MAT 000, Mathematics in Today s World MAT 00, Algebra with Trigonometry Problems - are based on Arithmetic
CIMA Professional 2018
 CIMA Professional 2018 Interactive Timetable Version 16.25 Information last updated 06/08/18 Please note: Information and dates in this timetable are subject to change. A better way of learning that s
TMC Monthly Operational Summary
 TMC Monthly Operational Summary March Bureau of Transportation Systems Management & Operations (TSMO) NH Department of Transportation s Mission Transportation excellence enhancing the quality of life in
CIMA Professional 2018
 CIMA Professional 2018 Newcastle Interactive Timetable Version 10.20 Information last updated 12/06/18 Please note: Information and dates in this timetable are subject to change. A better way of learning
An alternative to Red-Yellow-Green Board Reports
 Tuesday, December 12 Session A9/B9 An alternative to Red-Yellow-Green Board Reports Dan Watson, MBA Valerie Craig, RN, MSN, MAOM Richard Scoville, PhD Objectives Describe how MHS transitioned to a systems-based
Time Series Analysis
 Time Series Analysis A time series is a sequence of observations made: 1) over a continuous time interval, 2) of successive measurements across that interval, 3) using equal spacing between consecutive
Jackson County 2014 Weather Data
 Jackson County 2014 Weather Data 62 Years of Weather Data Recorded at the UF/IFAS Marianna North Florida Research and Education Center Doug Mayo Jackson County Extension Director 1952-2008 Rainfall Data
MEASURING FORECASTER PERFORMANCE IN A COLLABORATIVE SETTING WITH FIELD SALES, CUSTOMERS OR SUPPLIER PARTNERS
 MEASURING FORECASTER PERFORMANCE IN A COLLABORATIVE SETTING WITH FIELD SALES, CUSTOMERS OR SUPPLIER PARTNERS Hans Levenbach, Ph.D. Preview: Measuring performance of forecasters is a complex task, especially
THE BUILDING SAFETY GROUP HEALTH AND SAFETY TRAINING COURSES 2018 DATES AND PRICES
 THE BUILDING SAFETY GROUP HEALTH AND SAFETY TRAINING COURSES 2018 DATES AND PRICES CONTENTS Courses we run: Accredited courses CITB Site Management Safety Training Scheme (SMSTS) CITB Site Management Safety
Chiang Rai Province CC Threat overview AAS1109 Mekong ARCC
 Chiang Rai Province CC Threat overview AAS1109 Mekong ARCC This threat overview relies on projections of future climate change in the Mekong Basin for the period 2045-2069 compared to a baseline of 1980-2005.
3. If a forecast is too high when compared to an actual outcome, will that forecast error be positive or negative?
 1. Does a moving average forecast become more or less responsive to changes in a data series when more data points are included in the average? 2. Does an exponential smoothing forecast become more or
Technical note on seasonal adjustment for Capital goods imports
 Technical note on seasonal adjustment for Capital goods imports July 1, 2013 Contents 1 Capital goods imports 2 1.1 Additive versus multiplicative seasonality..................... 2 2 Steps in the seasonal
Jayalath Ekanayake Jonas Tappolet Harald Gall Abraham Bernstein. Time variance and defect prediction in software projects: additional figures
 Jayalath Ekanayake Jonas Tappolet Harald Gall Abraham Bernstein TECHNICAL REPORT No. IFI-2.4 Time variance and defect prediction in software projects: additional figures 2 University of Zurich Department
Fall & Winter Weather Hazards. Presented by: Fort Rucker Weather Operations
 Fall & Winter Weather Hazards Presented by: Fort Rucker Weather Operations Products & Services FRWXOPS Provides: Weather Briefings Resource Protection Observing PMSV Climatology Seasonal Weather Briefings
Webinar and Weekly Summary February 15th, 2011
 Webinar and Weekly Summary February 15th, 2011 -Assessment of current water conditions - Precipitation Forecast - Recommendations for Drought Monitor Upper Colorado Normal Precipitation Upper Colorado
The World Bank Indonesia National Slum Upgrading Project (P154782)
") Public Disclosure Authorized EAST ASIA AND PACIFIC Indonesia Social, Urban, Rural and Resilience Global Practice Global Practice IBRD/IDA Investment Project Financing FY 2017 Seq No: 4 ARCHIVED on 04-Apr-2018
Public Disclosure Authorized EAST ASIA AND PACIFIC Indonesia Social, Urban, Rural and Resilience Global Practice Global Practice IBRD/IDA Investment Project Financing FY 2017 Seq No: 4 ARCHIVED on 04-Apr-2018
ACCA Interactive Timetable
 ACCA Interactive Timetable 2018 Professional Version 6.1 Information last updated 6th June 2018 Please note: Information and dates in this timetable are subject to change. A better way of learning that
Forecasting 101: The Anatomy of a Forecast. Calendar of Events. Case Study: Brooks Sports. In Search of "Forecastability" Forecast Pro Tips and Tricks
 To avoid having this newsletter filtered as bulk mail, please add newsletter@forecastpro.com to your contact list If you are having trouble viewing this email, click here to view it in a web browser. Subscribe
Problem 4.1, HR7E Forecasting R. Saltzman. b) Forecast for Oct. 12 using 3-week weighted moving average with weights.1,.3,.6: 372.
 Forecast for Oct. 12 using 3-week weighted moving average with weights.1,.3,.6: 372.") Problem 4.1, HR7E Forecasting R. Saltzman Part c Week Pints ES Forecast Aug. 31 360 360 Sept. 7 389 360 Sept. 14 410 365.8 Sept. 21 381 374.64 Sept. 28 368 375.91 Oct. 5 374 374.33 Oct. 12? 374.26 a) Forecast
Problem 4.1, HR7E Forecasting R. Saltzman Part c Week Pints ES Forecast Aug. 31 360 360 Sept. 7 389 360 Sept. 14 410 365.8 Sept. 21 381 374.64 Sept. 28 368 375.91 Oct. 5 374 374.33 Oct. 12? 374.26 a) Forecast
P7.7 A CLIMATOLOGICAL STUDY OF CLOUD TO GROUND LIGHTNING STRIKES IN THE VICINITY OF KENNEDY SPACE CENTER, FLORIDA
 P7.7 A CLIMATOLOGICAL STUDY OF CLOUD TO GROUND LIGHTNING STRIKES IN THE VICINITY OF KENNEDY SPACE CENTER, FLORIDA K. Lee Burns* Raytheon, Huntsville, Alabama Ryan K. Decker NASA, Marshall Space Flight
ACCA Interactive Timetable
 ACCA Interactive Timetable 2018 Professional Version 3.1 Information last updated 1st May 2018 Please note: Information and dates in this timetable are subject to change. A better way of learning that
DROUGHT INDICES BEING USED FOR THE GREATER HORN OF AFRICA (GHA)
") DROUGHT INDICES BEING USED FOR THE GREATER HORN OF AFRICA (GHA) Christopher Oludhe IGAD Climate Prediction and Applications Centre (ICPAC) Inter-Regional Workshop on Indices and Early Warning Systems for
DROUGHT INDICES BEING USED FOR THE GREATER HORN OF AFRICA (GHA) Christopher Oludhe IGAD Climate Prediction and Applications Centre (ICPAC) Inter-Regional Workshop on Indices and Early Warning Systems for
Operations Management
 Operations Management Chapter 4 Forecasting PowerPoint presentation to accompany Heizer/Render Principles of Operations Management, 7e Operations Management, 9e 2008 Prentice Hall, Inc. 4 1 Outline Global
Extreme Temperature Protocol in Middlesex-London
 Clean Air Partnership Webinar March 17, 2009 Extreme Temperature Protocol in Middlesex-London Presented by Iqbal Kalsi, MBA, CPHI(C), CCEP iqbal.kalsi@mlhu.on.ca 1 History Informal monitoring, tracking
Climate Change and Water Supply Research. Drought Response Workshop October 8, 2013
 Climate Change and Water Supply Research Drought Response Workshop October 8, 2013 DWR Photo Oroville Reservoir, 2009 Talk Overview Expectations History Atmospheric Rivers and Water Supply Current Research
Final Report. COMET Partner's Project. University of Texas at San Antonio
 Final Report COMET Partner's Project University: Name of University Researcher Preparing Report: University of Texas at San Antonio Dr. Hongjie Xie National Weather Service Office: Name of National Weather