Design of Experiments
|
|
|
- Horace Moore
- 5 years ago
- Views:
Transcription

1 6s ANALYZE 6s IMPROVE Chapter 2-4 Design of Experiments 2-4-1
2 Definition Design of Experiments (DOE) DOE is a systematic approach to investigation of a system or process. A series of structured tests are designed in which planned changes are made to the input variables of a process or system. The effects of these changes on a pre-defined output are then assessed

3 Experiments The term experiment is defined as the systematic procedure carried out under controlled conditions in order to discover an unknown effect, to test or establish a hypothesis, or to illustrate a known effect. When analyzing a process, experiments are often used to evaluate which process inputs have a significant impact on the process output, and what the target level of those inputs should be to achieve a desired result (output)
4 Hypothesis Sometimes when we test hypotheses we have more than two samples. Three different lengths of heat treating are evaluated for hardness. Is one length better than the others? To test this using conventional methods would involve several null hypotheses: H H H : x : x : x x x x For large number of alternatives this would be a tedious process
5 Analysis of Variance Analysis of Variance is a widely used statistical technique that partitions the total variability in our data into components of variability that are used to test hypotheses. In One-way ANOVA, we wish to test the hypothesis: against: H 0 : 1 = 2 = = k H 1 : Not all population means are the same
6 Analysis of Variance In ANOVA, we compare the between-group variation with the within-group variation to assess whether there is a difference in the population means. Thus by comparing these two measures of variance (spread) with one another, we are able to detect if there are true differences among the underlying group population means.
7 ANOVA This technique is one of the most powerful of statistical methods. It provides the basis for determining whether several sample means differ significantly. The methodology is best introduced via an example
8 Example One Way ANOVA Ten service stations are rated in terms of overall quality and effectiveness. More than 20 factors are considered in computing the rating score. A sample of five ratings is made for each station and the results are shown below. The distributor wishes to determine if the stations differ significantly in the rating score or whether the variation in average scores can be attributed to chance (common cause variation.) Use a 95% confidence level. Adapted from Statistical Analysis for Administrative Decisions, by Clark and Schkade,
9 Data for Example Service Station Totals Total Mean Data Set A 2-4-9
10 Example Continued In this example the observations of quality ratings are grouped so that each service station may be viewed as a class. The classes for grouping or classifying data are sometimes called treatments. The hypothesis that is tested is as follows:
11 One Way ANOVA Table The results are typically expressed in what is called an ANOVA table
12 One Way ANOVA Calculations We perform the calculations of the SS (sums of squares) as follows: The ANOVA table is on the next page. r is number of rows and c number of columns
13 ANOVA Table Since the F Ratio (F test ) is greater than the F table value we reject the null hypothesis and state that there is a difference in treatments
14 ANOVA Practice Problem Three specimens of each of five different metals were immersed in a highly corrosive solution and their corrosion rates were measured with the following results shown on the next page. At the.01 level is there a significant difference between the corrosion rates of the metals?
15 Data Metal Corrosion Rates Aluminum Stainless Carbon Steel Enamel Coated Steel Nickel Alloy Data Set
16 ANOVA Table C = SStr = SST = SSE = Source of Variation SS df MS F P-value F crit Metals E Error Total
17 Excel
18 Excel

19 Excel
20 Practice Problem Random samples of 4 brands of tires required the following braking distances while going 30 mph. Is there a significant difference at the.1 level? Brand A Brand B Brand C Brand D
21 Two Way ANOVA Often it is desirable to test hypotheses concerning two variables. These two variables may be referred to as row effects and column effects. A similar method is used
22 Two Way ANOVA H H H H : No difference in Rows : Difference in Rows : No difference in Columns : Difference in Columns
23 Calculation Factors
24 Example Problem Let us use the example of providing quality ratings for five service stations. One question that may be asked is if there is a difference between ratings of the different service stations. A second question that could be asked, is, if there were multiple raters, is there a significant difference between raters at the.05 level. If the data were set up with rows being raters and columns being ratings we could test the following hypotheses:
25 Hypotheses H H H H : No difference in Rows : Difference in Rows : No difference in Columns : Difference in Columns
26 Data Data Set B
27 Solution
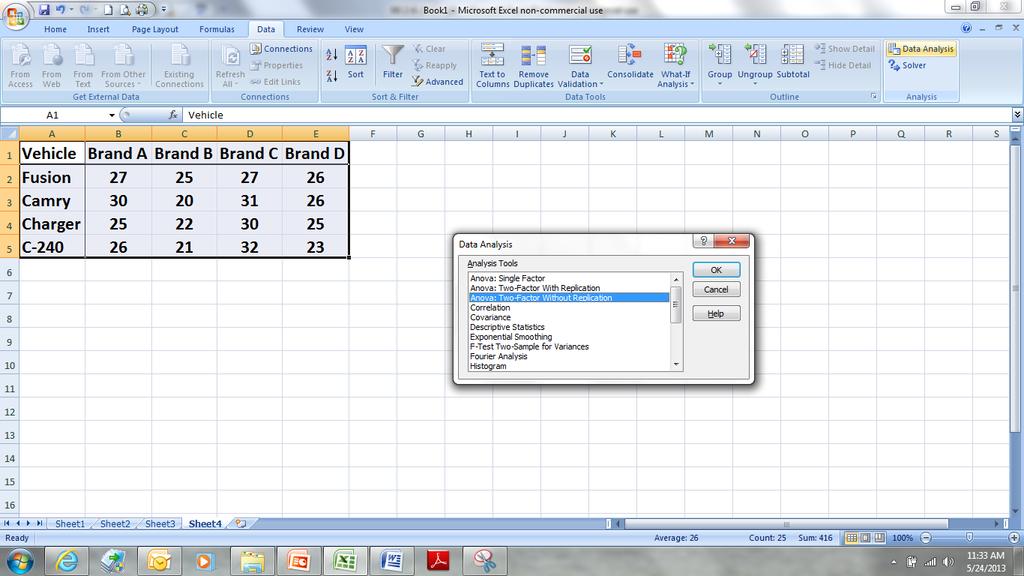
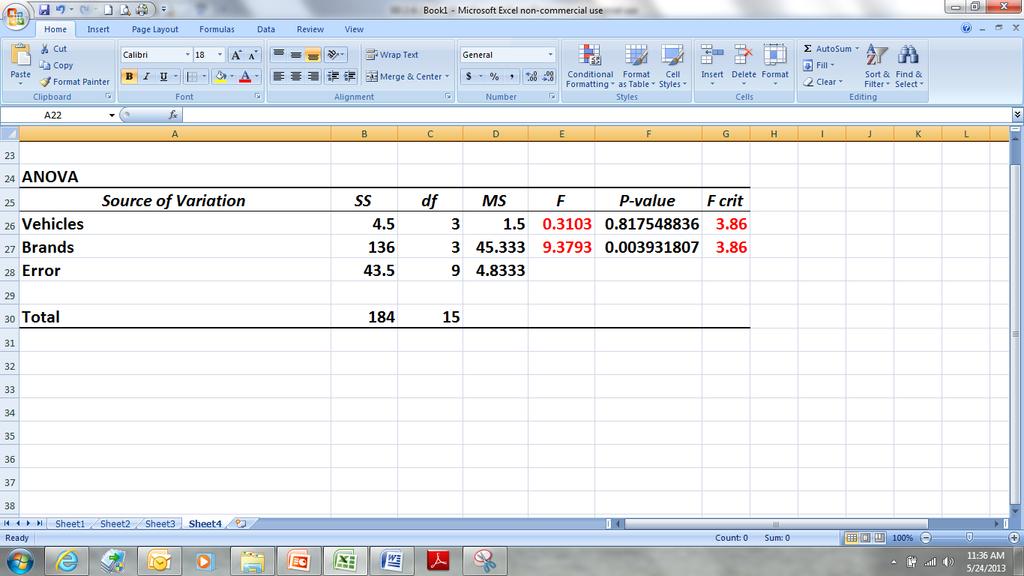
28 Practice Problem Let us look at the stopping data again, but this time note that we used four different cars. Can we say, with 95% confidence, that there is no difference between tire brands as well as no difference between vehicle types? Vehicle Brand A Brand B Brand C Brand D Fusion Camry Charger C Data Set
29 Hypotheses H H H H : No difference in Vehicles : Difference in Vehicles : No difference in Brands : Difference in Brands We will first do it manually then use Excel
30 2-4-30
31 2-4-31
32 Two Way ANOVA Replications In testing hypotheses concerning two variables, two possible models may be considered. First, in the previous model in which there was only one observation per cell, the column and row effects were assumed to be independent and additive. That is to say the service station was independent of the rater. It was assumed that the rater exercised no bias either for or against a particular station but made a completely objective rating based on what she found at the station
33 Two Way ANOVA Replications However, it is possible that there is not complete independence and the variables may interact with or on one another. In this example, the rating of service stations by raters, each rater might rate each service station several times, making it possible to test for any interaction between raters and stations. In this set up if the stations were columns and the raters rows, we might have multiple measurements within each cell. In this instance we would have the following hypotheses to test:
34 Two Way ANOVA Replications
35 Computations and Example
36 Example Data

37 ANOVA Table We reject all three null hypotheses
38 Practice Problem To find the best arrangement of instruments on a control panel, four different displays were tested by simulating an emergency condition and observing the reaction time required to correct this condition. The experiment was conducted three times. At the.01 level is there a significant difference between 1. Subjects 2. Displays 3. Interaction
39 Hypotheses
40 Data Subject A Subject B Subject C Display Display Display Data Set Display

41 Excel Application

42 No significant differences
43 Latin Squares When the experimenter wishes to study the effects of three variables on the basis of relatively few observations he may turn to the use of the Latin Square Design. The experiment is performed by arranging the levels of one factor which are denoted by the letters A, B, C, etc. into an array so that every letter appears once and only once in every row and column
44 Latin Square One Latin Square with for levels for one variable might look like this: B A C D D B A C C D B A A C D B
45 Latin Squares For example, the study group engaged in rating service stations might be concerned with another variable, the time of day when the rating was made. The group may feel that during very busy times of the day the service station operator is not able to give as good service as at other times and that this might influence the rating of the station. The letters A, B, C, and D might be used to refer to four different levels of business activity. These different levels are commonly called treatments. The size of the Latin square is determined by the number of treatments
46 Hypotheses
47 LS ANOVA Table
48 Computations
49 Example We will work this on manually. Swap the C and D to agree with the table on page

50 Solution No significant difference for rows. Significant difference for columns and treatments
51 DOE Experimental design can be used at the point of greatest leverage to reduce design costs by speeding up the design process, reducing late engineering design changes, and reducing product material and labor complexity. Designed Experiments are also powerful tools to achieve process cost savings by minimizing process variation and reducing rework, scrap, and the need for inspection
52 Review: A process is In (Statistical) Control if it is Stable or Predictable An In Control Process
53 But It Is Not Producing The Results That I Want! An In Control Process
54 If That s Not What You Want!! Then. CHANGE The PROCESS! (Using..)
55 Experimental Design (DOE) Uses Scientific Methods to Find Out: What Helps (25%) What Hurts (25%) What Has No Effect (50%)
56 Wrong Ways 1. One thing at a time Takes too long May Sub-Optimize Misses Interactions
57 Wrong Ways 2. Everything at Once Which Input Change Effected The Output Change? Pluses May Be Canceled by Minuses?
58 Using Regression in Six Sigma How Is Regression Used Here? The State Agricultural Extension Service has hired you, as a Six Sigma Black Belt to help improve a process. They desire to help soybean farmers increase the yield (in bushels per acre) from their fields based on certain easily measurable and controllable factors. We know that fertilizer sells for $4 per 100 pounds. Water costs $.18 per gallon. Lime costs $1.75 per 100 pounds. Soybeans sell for $1.42 a bushel. What would be the best combination of fertilizer, water, and lime to maximize the profit for the farmer? Use the data collected on the following page
59 Is it one thing at a time? everything at once?...a systematic pre-arrangement of combinations? Bushels per Acre Pounds Fertilizer Gallons Water Pounds Lime Bushels per Acre Pounds Fertilizer Gallons Water Pounds Lime
60 Using Regression in Six Sigma One thing at a time? No- Fertilizer, water and lime are all factors Everything at once? Yes- Fertilizer, water and lime are all factors A systematic pre-arrangement of combinations? Not really- Fertilizer, water and lime are haphazardly set To be systematic, choose and keep to levels, e.g., Fertilizer: 500 and 1500; Water: 50 and 100; Lime: 200 and
61 Using Regression and Correlation Studies in Six Sigma Useful for analyzing existing data Priority application in the Define and Measure stages, e.g., Define: Select the factors with the greatest effects on the process Measure: Identify how the greatest factors impact the process, e.g., use to develop Y=f(X1, X2, ) in SIPOC Not necessary to be systematic in pre-arranging the factors, but it is better if so
62 All Good DOEs Require the collection of data through measuring responses Involve systematic manipulation of variables or factors of interest in pre-arranged ways (called experiment designs) Require control or accounting for all other variables or factors Therefore, not all opportunities to collect or use data are good DOE s, but all DOE s are opportunities to collect and use data
63 The Right Way Design of Experiments (DOE) Test Everything in pre-arranged combinations Measure the Effects of Each and Interactions
64 Factorial Design A factorial experiment is the name commonly given to an experiment in which several factors are investigated at each of two or more levels. The information obtained by looking at experimental variables used simultaneously is more complete than that obtained from a series of single factor experiments. In factorial experiments an effect attributable to the combination of variables can be measured when this would not be possible if the variables were considered singly
65 Example-Improve Green Belt Exam Scores Brainstorming Session Results Work More Problems (Factor A) Use A Different Text (Factor B) Study in Morning or at Night (Factor C) But What Really Affects The Scores? Run Some Experiments!!!
66 Define Factors Design Considerations Problems Fewer = - More = + Design an Experiment to Include all of the Possibilities Text Present = - New = + Time Morning = + Evening = - Factors Trial (Run) Problems Text Time Run the Experiment
67 Example-Improve Green Belt Exam Scores Factors Results A B C Sum Sum Diff Avg Coeff Helps Hurts No Effect
68 Example-Improve Green Belt Exam Scores Prediction Formula: OR OR Yˆ A 1.25B 0C Estimated Test Score A 1.25B 0C Estimated Test Score A 1.25B 0C Note: Factor impacts are referenced to the mean of
69 Benefits of Experimental Design Identifies Beneficial Changes - Quickly - Inexpensively Avoids Harmful Changes Identifies Interactions
70 An example of Interaction Univ of Western Ontario Research Grapefruit Juice reacts with drugs that are largely broken down in the small intestine before they get to blood stream Result: People who take these drugs with grapefruit juice get a higher dosage than their doctors prescribed Reportedly as much as 3 times prescribed dosage!
71 Detailed DOE Course Content History of DOE and Fundamental Terminology Contingency Table Analysis One Factor Analysis- Control versus Experimental Comparisons One Way ANOVA Two Factor Analysis- Two Way ANOVA Two Way ANOVA with Replication Three or More Factors- Latin Square for Three Factors Design of Experiments or DOE (Multivariate Testing) Intent Is to Gain Understanding and Control of Process Two or More Factors Use Scientific Investigation Method Controlled Data Collection Designed Experimental Sequence All Other Factors Assumed to Be Held Constant Regression Based Analysis Prediction Equation
72 History of DOE Sir Ronald Fisher in 1920 s Agricultural origins Long use in food and drug research Strategic competitive weapon Statistical basis
73 Design of Experiments Introductive Definitions Selected terms Factor Block Treatment Level Response Replication I II III
74 DOE Terms Factor: An independent variable that may affect a response. Block: A factor used to account for variables that the experimenter wishes to avoid or separate out during analysis. Treatment: Factor levels to be examined during experimentation. Levels: Given treatment or setting for an input factor. Response: The result of a single run of an experiment at a given setting (or given combination of settings when more than one factor is involved). Replication (Replicate): Repeated run(s) of an experiment at a given setting (or given combination of settings when more than one factor is involved)
75 Contingency Table Analysis Deal with two qualitative or categorical factors Data are counts in a table with one factor in the rows and the other in the columns One pre-factor and the other an outcome, e.g., training level versus success or no success Association of two factors, e.g., time-of-day versus choice of self-, chat-, or phone-assistance TOH can be done with the Chi-Square distribution, which tests for null hypothesis of independence between the two factors
76 Contingency Table Analysis Pre-Factor and Outcome Factor Pre-Factor: Training or no training Outcome Factor: Task Success Use c 2 {alpha,(r-1)(c-1)} where df=(rows-1)(columns-1) The contribution to c 2 from SPC-XL helps indicate where major dependencies lie Note: These data are fictitious Untrained Trained Successful Not Successful
77 Hypotheses Null: There is no difference Alternative: There is a significant difference

78 Use SPC XL, Analysis Tools, Independence Test Matrix

79 SPCXL

80 Result The p value tells the story. In this case training makes a difference
81 Contingency Table- Independent and Outcome Factor 5-Step Hypothesis Test Hypothesis: = 0.05 H Independent H : 0 : 1 Dependent Test statistic: c 2 = Rejection Region: c 2 table= c 2 {alpha,(r-1)(c-1)} = c2 {.05,1} = 3.84 Interpretation: Reject H 0 Since c 2 test = > c 2 crit = c 2 table = 3.84 Conclusion: Success significantly depends on training level at 95% confidence
82 Using Contingency Table Analysis in Six Sigma Useful for analyzing whether two factors are independent or associated based on cross-tabulated counts. Priority application in the Measure or Improve stages, e.g., Measure: Test association between two categorical factors, e.g., experience-novice versus success-failure. Improve: Determine whether an improvement is statistically significant using cross-tabulated field counts Must use systematic arrangement of the factors into a cross-table of counts
83 One Factor Analysis- Matched comparison Treatments only All yields are in columns Also known as: Pre-test vs. post-test Control vs. experimental comparison within subjects Paired or correlated observations Balanced (same number of responses for each treatment) Assumption: Two responses come from same individual and the difference is approximately Normally distributed. Samples of individuals are random and independent
84 1 Factor Analysis- Matched Comparison 1) Pre-test 2) Train 3) Post-test (20 Questions) Pre-Test Post-Test Difference Mean std dev n
85 1 Factor Analysis- Matched Comparison t x post x pre s difference / n df n
86 1 Factor Analysis- Matched Comparison 5- Step Hypothesis Test Hypothesis: = 0.05 H o difference Test statistic: t = 2.71 = : x 0 H : xdifference 0 ( ) / (4.195 * sqrt(10)) Rejection Region: t table = t {alpha,n-1} = t {.05,9} = 1.83 a Interpretation: Reject H 0 Since t test = 2.71 > t crit = t table = 1.83 Conclusion: Post-test performance is significantly greater than pre-test performance at 95% confidence
87 Using 1 Factor Analysis- Matched Comparison in Six Sigma Useful for analyzing whether training or a new procedure improves time or accuracy of personnel Priority application in the Improve stage, e.g., Improve: Select a response, e.g., time or accuracy, to determine whether an improvement is statistically significant using a pre-test and post-test experimental design on a sample of personnel with a 1-tailed test of hypothesis Must use systematic pre-test versus post-test arrangement of the factors and then sample the difference scores with a 1-tailed test
88 One Factor Analysis- Control Versus Experimental Comparison Treatments only All yields are in columns Also known as: Comparing two sample means with known sample standard deviations Balanced versus unbalanced Assumption: Treatment population variances equal and approximately Normally distributed. Samples are random and independent
89 1 Factor Analysis- Control Vs. Experimental Help-Desk Assistance Time With and Without Script Control (Without Script) Experimental (With Script) Mean s 8 10 n
90 1 Factor Analysis- Control Vs. Experimental 2 2 1) ( 1) ( b a b a b b a a b a b a n n df n n s n s n n n x x t
91 1 Factor Analysis- Control Vs. Experimental 5-Step Hypothesis Test Hypothesis: = 0.05 H Test statistic: t = 6.32, df=16 o : x1 x2 Ha : x1 x2 Rejection Region: t table = t {alpha,n1+n2-2} = t {.05,16} = Interpretation: Reject H 0 Since t test = 6.32 > t crit = t table = Conclusion: Assistance time is significantly greater without a script to guide the help-desk than with the script at 95% confidence
92 Using 1 Factor Analysis- Control Vs. Experimental - in Six Sigma Useful for analyzing whether two means are the same or different. Priority application in the Measure, Analyze or Improve stages, e.g., Measure and Analyze: Compare two means, e.g., men vs. women or experience vs. novice Improve: Determine whether an improvement is statistically significant using a comparison with and without the improvement Must use systematic control versus experimental arrangement of the factors
93 Using One-Way ANOVA in Six Sigma (Calculations covered earlier) Useful for analyzing whether two or more means are all the same or some different. Priority application in the Measure, Analyze or Improve stages, e.g., Measure and Analyze: Compare multiple means, e.g., four levels of fertilizer or five days of week Improve: Determine whether multiple improvements are statistically significant Must use systematic arrangement of the factors to manipulate one factor and control, counterbalance or randomize the remaining factors
94 Linear Model for Randomized Design Alternative to ANOVA Analysis of variance produced through regression techniques Consider the single factor dyes example with three treatments from earlier Linear regression model of yields OR ˆ x x x Y ˆ x x x Y
95 Linear Model Coding Techniques For Treatments x if y value otherwise is from treatment I x if y value otherwise is from treatment II x if y value otherwise is from treatment III
96 Single Factor Exercise Exercise: Three dye formulas for a certain synthetic fiber were under consideration. The data in the following table was collected. At 0.01 significance level is there a difference between the dyes? (Assume the higher the value the better the performance.) Dyes A B C
97 Single Factor Exercise Dyes Exercise: Three dye formulas for a certain synthetic fiber were under consideration. The data in the following table was collected. At 0.01 significance level is there a difference between the dyes? (Assume the higher the value the better the performance.) A B C Avg = Avg = Avg =
98 Model of Yield Matrix y x1 x2 x
99 Regression Setup REMEMBER from earlier, we would like to have the formula referenced to the mean, SO transform the data to y - ybar ˆ x x x Y ˆ x x x Y
100 Regression Setup Create a new variable y y y Now regress the 3 dummy variables against This compares each to y y
101 Regression Table y ybar y-ybar x1 x2 x
102 Regression Setup Use all 3 dummy independent variables. Use the transformed y-ybar as the dependent variable. Force the constant to be

103 Regression Setup

104 Regression Output
105 Regression Equation Noting that x 2 is likely insignificant yˆ y 6.867x x 3 yˆ x x 3 yˆ x x
106 Regression Equation yˆ x x 3 Let x 1 1, x 2 0, x 3 0 : yˆ Let x 1 0, x 2 1, x 3 0 : yˆ Let x 1 0, x 2 0, x 3 1: yˆ
107 Comparison of EXCEL Outputs ANOVA vs. Regression What sections are the same? What s different? Why use regression instead of plain ANOVA? The regression equation is important Allows predictions Regression analysis shows where differences lie, not just that the treatments are different Coding and regression are the concepts used in factorial designs
108 Using One-Factor Experiment Using Regression in Six Sigma Useful for analyzing whether two or more means are all the same or some are different and obtaining a model Priority application in the Measure, Analyze or Improve stages, e.g., Measure and Analyze: Compare strength of multiple factors and model their effects, e.g., four levels of fertilizer or five days of week Improve: Determine whether multiple improvements are statistically significant and also predict the improvements Must use systematic arrangement of the factors to manipulate one factor and control, counterbalance or randomize the remaining factors and a dummy coding of factors in the regression analysis (our software will do this for us)
109 Using Two-Way ANOVA in Six Sigma (Calculations covered earlier) Useful for analyzing whether two factors are significant or not. Priority application in the Measure, Analyze or Improve stages, e.g., Measure and Analyze: Compare two factors, e.g., four levels of fertilizer and five levels of lime Improve: Determine whether multiple improvements developed through changing two factors are statistically significant Must use systematic arrangement of the factors to manipulate two factors and control, counterbalance or randomize the remaining factors
110 How Is a Third Factor Added? Two Way ANOVA with interaction Also known as replication Latin Squares Factorial Designs 2 or more factors
111 Using Two-Way ANOVA With Replication in Six Sigma (Calculations covered earlier) Useful for analyzing whether two factors and their interaction are significant. Priority application in the Measure, Analyze or Improve stages, e.g., Measure and Analyze: Investigate effects of two factors, e.g., experience of customer representative and complexity of call Improve: Determine whether two improvements and their interaction are statistically significant Must use systematic arrangement of the factors to manipulate two factors and control, counterbalance or randomize the remaining factors all while replicating the experiment
112 Using Three-Factor ANOVA with Latin Squares in Six Sigma Useful for efficiently analyzing whether three factors have main effects Priority application in the Measure or Analyze stages, e.g., Measure and Analyze: Compare multiple means, e.g., four levels of fertilizer, four levels of water and four levels of lime Must use systematic arrangement of the three factors to manipulate all three factors while controlling the remaining factors Can not analyze interaction with any variant of Latin Square design
113 Factorial Designs Framework Deal simultaneously with qualitative and quantitative factors Change individual factors while observing combinations of others Allows blocking and randomization Allows replication
114 Factorial Designs Framework Allows linear mathematical models Coding based on a binomial counting scheme Easy to set up and carry out Simple to analyze and interpret Simple to explain to others
115 Two-level Factorial Designs Full factorial design (2 k ) k is the number of factors and can be 2 or greater Each factor has two levels Responses at every level Random order of runs Yields listed in binomial order but yield data is actually captured randomly
116 Two-level Factorial Designs Things Not studied in this course Extensive study of fractional factorial designs Only one level for any factor(s) Incomplete Designs (Missing responses)
117 Two-level Factorial Designs for Two Factors 2 2 design for two factors at two levels each x2 High Conceptually has a total of four responses One for each factor at each level Low Low High x
118 Two-level Factorial Designs for Three Factors 2 3 design for three factors at two levels each Conceptually has a total of eight responses One for each factor at each level x2 x3 x
119 2 2 Full Factorial Design Statistical Analysis Runs Factor A Factor B Yield 1 low low 55 2 high low 70 3 low high 65 4 high high
120 2 2 Full Factorial Example Factor A Average Yields Factor A low settings average = 60 Average of 55 and 65 Factor A high settings average = 57.5 Average of 70 and 45 Factor A effect is 2.5 Low to high average difference Trial Factor A Factor B Yield 1 Low Low 55 2 High Low 70 3 Low High 65 4 High High
121 2 2 Full Factorial Example Factor B Average Yields Factor B low settings average = 62.5 Average of 55 and 70 Factor B high settings average = 55 Average of 65 and 45 Factor B effect is 7.5 Low to high average difference Trial Factor A Factor B Yield 1 Low Low 55 2 High Low 70 3 Low High 65 4 High High
122 Yield Yield 2 2 Full Factorial Example Factor Effects Factor A Effect Factor B Effect Low Settings High Low Settings High
123 2 2 Full Factorial Example Test of Interaction Factors A and B Show Interaction Factors Show Interaction B Low B High A Low A High Lo Factor A Hi Factor B Settings Only need one chart or the other but not both
124 2 2 Full Factorial Design Replication Example Run Factor A Factor B Yield 1 Yield 2 Average s 2 1 low low high low low high high high
125 2 2 Full Factorial Factor Effects Factor A Effect Factor B Effect Lo Settings Hi Lo Settings Hi
126 2 2 Full Factorial Test of Interaction Factor A Interaction Lo Factor A Hi B Low B High Each of these charted lines represents conditions with B fixed
127 2 2 Full Factorial Exercise Your turn. An experiment was replicated three times. The data collected is shown below. Assume that a lower the output response is better. What is the optimum setting for each factor and what do the effects, and interaction look like? Calculate by hand. Run Factor A Factor B Yield 1 Yield 2 Yield 3 Average s 2 1 low low high low low high high high
128 Answer to 2 2 Full Factorial Exercise Run Factor A Factor B Yield 1 Yield 2 Yield 3 Average s 2 1 low low high low low high high high
129 Answer to 2 2 Full Factorial Exercise Factor Effects Factor A Effect Factor B Effect Low Settings Hi 18 Low Settings Hi
130 Answer to 2 2 Full Factorial Exercise Test of Interaction Factor A Interaction Low Settings High 20 B Low B High
131 2 2 Full Factorial Design 2 Factor 2 Level Coding A two level, two-factor experiment was performed. In this example the yield is the measured outcome of the experiment. For this example, the larger the yield is the better the results. Runs Factor A Factor B Yield Codes 1 low low high low low high high high
132 2 2 Full Factorial Design Interaction Added and Coding Runs A B AB Yield A B AB Contrast Effect Coeff
133 Factorial Yield Prediction Equation Generalize d yˆ 0 1 x 1 2 x 2 From problem: yˆ Predictingyieldat FactorsA low (-1)and B low (-1) yˆ Form: ( 1) 3 x 1 x A-375. B-8. 75AB 3.75( 1) 8.5( 1)
134 2 2 Full Factorial Design With Replication Using DOEKISS or DOEPRO Run Factor Factor Yield 1 Yield 2 Average s2 A B 1 low low high low low high high high
135 2 2 Full Factorial Design Replication, Interaction, Coding Run A B AB Y1 Y2 Mean s 2 A B AB Contrast Effect Coefficient
136 2 2 Full Factorial Design Standard Error of Effects To test coefficients, calculate standard errors Pooled variance = SSE = s p 2 = (sum of the run variances) = 21 Standard error = s e = 2 s p 2 k = se Standard error of the coefficients = s = k 2 r *2 2*2 (Where k = # of factors = 2, r = # replications = 2)
137 2 2 Full Factorial Design Calculate Test Statistics In each case the test statistic is calculated using the relationship: t test = [ Coefficient/ s ] The three test statistics are calculated. t A = [-2.0/0.81] = t B = [-2.75/0.81] = t AB = [-9.0/0.81] = The degrees of freedom are determined using the equation (r 1) * 2 k = (2 1) * 2 2 = 1 * 4 = 4 degrees of freedom
138 1 tail tail df
139 Answer for 2 2 Full Factorial Exercise Run A B AB Y1 Y2 Mean s2 A B AB Contrast s p = s beta = t(a)= t(b)= t(ab)= tcrit=
140 2 2 Full Factorial Design Hypothesis Test of Coefficients Hypothesis: H 0 : 1 = 0 or 2 = 0 or 3 = 0 H 1 : 1 0 or 2 0 or 3 0 Test Statistic: t A = 2.47, t B = 3.40, t AB = Critical Region: t crit = t (alpha,df) = t (.05,4) = where df = (2 factors )x(replications 1) = 2 2 x (2-1) = 4 Interpretation: Do not reject H 0 for 1 Reject H 0 for 2 and 3 Conclusion: The coefficient for Factor A is equivalent to zero, while the coefficients for Factors B and AB are significant
141 2 2 Full Factorial Design Reduced Prediction Equation Linear predicting relationship for yields is yˆ A 2.75B 9. 0AB Since A is not likely a significant influencing factor, the equation can be reduced to yˆ B 9. 0AB
142 2 3 Full Factorial Design 3 Factors Each With 2 Levels Factor Levels A B Low High C
143 Balanced 2 3 Full Factorial Design/Standard Order Coding Run Factors A B C Y1 Y Low Low High High Low Low High High
144 2 3 Full Factorial Design Coded with Interactions Run Factors A B C AB AC BC ABC Y1 Y Low Low High High Low Low High High
145 2 3 Full Factorial Design - Std. Errors and Coefficient Test Values The same equations listed earlier apply and they are: Pooled variance = SSE = s p 2 = (sum of the run variances) = Standard error = s e = 2 s p 2 k = e Standard error of the coefficients = s = r *2 k 2*2 (Where k = #of factors = 2, r = # replications = 2) The Test Values for the t s are calculated from: s ttest Coefficient i e.g., B 1 Test Value is calculated as follows = 9.125/ = s
146 2 3 Full Factorial Design All Values Spreadsheet Calculated Run Average S2 A B C AB AC BC ABC Contrs N/A s p =SSE Effects Bo N/A Coefs TSS SSi sigma=s e= t test S beta B1 B2 B3 B4 B5 B6 B
147 2 3 Full Factorial Design Additional Thoughts Third order or higher interactions are rarely important (e.g., ABC, ABCD, and ABCDE) Second order interactions are often important (e.g., AB, AC, and BC) Number of trials increases significantly with more factors
148 Your Turn Exercise 1 Using DOE KISS or DOE PRO The following is the design of an experiment. The process under study was a printing process. Factor Levels A Press Speed B Ink Viscosity Low High C Paper Weight A complete factorial experiment was run. The results and coding for standard order are shown below. The higher the output yield the better. What is the optimum setting for this process? Use =
149 Your Turn Exercise 1 Using DOE KISS or DOE PRO Factors Run PS IV PW Y1 Y Low Low High High Low Low High High
150 Your Turn Exercise 1 Factors Codes Y1 Y2 Run PS IV PW Low Low High High Low Low High High
151 Your Turn Exercise 1 Y-hat Model Factor Name Coeff P(2 Tail) Const E-13 A PS E-06 B IV C PW E-06 AB AC BC ABC
152 Your Turn Exercise 1 Y = x PS x PW x PS x IV x IV x PW x PS x IV x PW A = Low A B = High C C = High AB BC ABC
153 Your Turn Exercise 2 Using DOEPRO, set up the design and coding for the following experimental design. Factor Levels A Low High B Low High C Low High D Low High
154 Blank for 2 nd Exercise Run
155 Answer for 2 nd Exercise Run A B C D AB AC AD BC BD CD ABC ABD ACD BCD ABCD
156 Response Surface Methodology -Uses a non-linear equation to fit the response surface. e.g., a polynomial equation with an interaction term. -Higher order terms are possible, e.g., -At least 3 levels are needed for each factor. -Available in DOEKISS and DOE PRO. x
157 Response Value Response Surface Surface Plot of O vs P Constants: P O

158 Making use of Fractional Factorials Screening designs Used to eliminate factors Follow with a full factorial on significant factors to identify interactions Separate lions from pussycats
159 Plackett-Burman Screening Designs Must have L levels where L is prime For screening designs usually 2 Number or runs is a multiple of L 2 (4) All main effects are estimated with the same precision All main factor effects are estimated independently of each other Can estimate main factor effects of up to k-1 factors where k is the number of tests run
160 Eight Run Plackett-Burman (2 7-4 ) Run A B C D E F G
161 Eight Run Plackett-Burman (2 7-4 ) Main Effects A B C D E F G Two-Factor -BC -AC -AB -AE -AD -AG -AF Interaction -DE -DF -DG -BF -BG -BD -BE Confounding -FG -EF -EF -CG -CF -CE -CD Three-Factor BDG ADG ADF ABG ABF ABE ABD Interaction BEF AEF BDE ACF BCD ACD DEF Confounding CDF CDE BFG BCE DFG DEG BCF CEG CFG AEG EFG ACG BCG ACE
162 Plackett-Burman Screening Designs For More Information: Understanding Industrial Experimentation by Donald J. Wheeler, SPC Press, Inc. Tables of Screening Designs by Donald J. Wheeler, SPC Press, Inc
163 Making use of Fractional Factorials Full factorial analysis requires L K tests. For full factorial analysis of four factors, 2 4 = 16 tests are required. For various reasons, only 8 tests can be run. Cost Access Time Fractional factorial analysis required
164 Issues with Fractional Factorials Leads to aliases Examples--C and ABD, D and ABC 4 th (D) factor in ABC column Confounding because of identical columns or exactly opposite columns A and BCD B and ACD C and ABD D and ABC AB and CD AC and BD BC and AD (I) and ABCD
165 2 3 Full Factorial Full Factorial Calculation Matrix Run (I) A B C AB AC BC ABC
166 2 k-p Fractional Factorials Fractional Factorial Calculation Matrix D Run (I) A B C D AB AC AD BC BD CD ABC ABD ACD BCD ABCD ABC is an Alias for D in the Fractional Factorial Experiment
167 2 k-p Fractional Factorials Fractional Factorial Calculation Matrix Run (I) A B C D AB AC AD BC BD CD ABC ABD ACD BCD ABCD AD and BC are Confounded in the Fractional Factorial Experiment
168 DOE in Continuous Process Improvement Experiments done in phases to search for improvement/optimality. EVOP
169 Using a Catapult As a Model Conduct Physical review of catapult Identify major sources of variation Choose Factors to be studied 2-4 factors at two levels Set up Full Factorial Experiment with Replication Randomize Runs Run the experiment Develop linear model Test the model
170 Leading 6 Sigma Teams Through a DOE One Plan purpose and nature of experimentation Attempt to identify major sources of variation Chose most important controllable factors Select linear ranges of important factors
171 Leading 6 Sigma Teams Through a DOE Two Randomize/control factors not being studied Include replication to better understand variation and error Develop a set of hypotheses Select the DOE Design
172 Leading 6 Sigma Teams Through a DOE Three Plan the trials and data gathering Perform the analysis using DOE techniques Develop and test model parameters Verify model setting Use model to maximize yields
173 Where to Get More Information World Class Quality using Designed Experiments, Bhote, AMACOM 2000 Statistical Quality Design and Control, DeVor, Macmillian 1992 Analysis of Variance PDF in the readings section of the course web site
Solutions to Exercises
 1 c Atkinson et al 2007, Optimum Experimental Designs, with SAS Solutions to Exercises 1. and 2. Certainly, the solutions to these questions will be different for every reader. Examples of the techniques
3.4. A computer ANOVA output is shown below. Fill in the blanks. You may give bounds on the P-value.
 3.4. A computer ANOVA output is shown below. Fill in the blanks. You may give bounds on the P-value. One-way ANOVA Source DF SS MS F P Factor 3 36.15??? Error??? Total 19 196.04 Completed table is: One-way
Fractional Replications
 Chapter 11 Fractional Replications Consider the set up of complete factorial experiment, say k. If there are four factors, then the total number of plots needed to conduct the experiment is 4 = 1. When
MATH602: APPLIED STATISTICS
 MATH602: APPLIED STATISTICS Dr. Srinivas R. Chakravarthy Department of Science and Mathematics KETTERING UNIVERSITY Flint, MI 48504-4898 Lecture 10 1 FRACTIONAL FACTORIAL DESIGNS Complete factorial designs
The One-Quarter Fraction
 The One-Quarter Fraction ST 516 Need two generating relations. E.g. a 2 6 2 design, with generating relations I = ABCE and I = BCDF. Product of these is ADEF. Complete defining relation is I = ABCE = BCDF
FRACTIONAL REPLICATION
 FRACTIONAL REPLICATION M.L.Agarwal Department of Statistics, University of Delhi, Delhi -. In a factorial experiment, when the number of treatment combinations is very large, it will be beyond the resources
TWO-LEVEL FACTORIAL EXPERIMENTS: IRREGULAR FRACTIONS
 STAT 512 2-Level Factorial Experiments: Irregular Fractions 1 TWO-LEVEL FACTORIAL EXPERIMENTS: IRREGULAR FRACTIONS A major practical weakness of regular fractional factorial designs is that N must be a
Design of Experiments SUTD - 21/4/2015 1
 Design of Experiments SUTD - 21/4/2015 1 Outline 1. Introduction 2. 2 k Factorial Design Exercise 3. Choice of Sample Size Exercise 4. 2 k p Fractional Factorial Design Exercise 5. Follow-up experimentation
What If There Are More Than. Two Factor Levels?
 What If There Are More Than Chapter 3 Two Factor Levels? Comparing more that two factor levels the analysis of variance ANOVA decomposition of total variability Statistical testing & analysis Checking
Experimental design (DOE) - Design
 - Design") Experimental design (DOE) - Design Menu: QCExpert Experimental Design Design Full Factorial Fract Factorial This module designs a two-level multifactorial orthogonal plan 2 n k and perform its analysis.
Experimental design (DOE) - Design Menu: QCExpert Experimental Design Design Full Factorial Fract Factorial This module designs a two-level multifactorial orthogonal plan 2 n k and perform its analysis.
20g g g Analyze the residuals from this experiment and comment on the model adequacy.
 3.4. A computer ANOVA output is shown below. Fill in the blanks. You may give bounds on the P-value. One-way ANOVA Source DF SS MS F P Factor 3 36.15??? Error??? Total 19 196.04 3.11. A pharmaceutical
Reference: Chapter 8 of Montgomery (8e)
") Reference: Chapter 8 of Montgomery (8e) 69 Maghsoodloo Fractional Factorials (or Replicates) For Base 2 Designs As the number of factors in a 2 k factorial experiment increases, the number of runs (or
Reference: Chapter 8 of Montgomery (8e) 69 Maghsoodloo Fractional Factorials (or Replicates) For Base 2 Designs As the number of factors in a 2 k factorial experiment increases, the number of runs (or
" M A #M B. Standard deviation of the population (Greek lowercase letter sigma) σ 2
 σ 2") Notation and Equations for Final Exam Symbol Definition X The variable we measure in a scientific study n The size of the sample N The size of the population M The mean of the sample µ The mean of the
Notation and Equations for Final Exam Symbol Definition X The variable we measure in a scientific study n The size of the sample N The size of the population M The mean of the sample µ The mean of the
Dr. Shalabh Department of Mathematics and Statistics Indian Institute of Technology Kanpur
 Analysis of Variance and Design of Experiment-I MODULE IX LECTURE - 38 EXERCISES Dr. Shalabh Department of Mathematics and Statistics Indian Institute of Technology Kanpur Example (Completely randomized
Review of Statistics 101
 Review of Statistics 101 We review some important themes from the course 1. Introduction Statistics- Set of methods for collecting/analyzing data (the art and science of learning from data). Provides methods
FRACTIONAL FACTORIAL
 FRACTIONAL FACTORIAL NURNABI MEHERUL ALAM M.Sc. (Agricultural Statistics), Roll No. 443 I.A.S.R.I, Library Avenue, New Delhi- Chairperson: Dr. P.K. Batra Abstract: Fractional replication can be defined
Statistical Design and Analysis of Experiments Part Two
 0.1 Statistical Design and Analysis of Experiments Part Two Lecture notes Fall semester 2007 Henrik Spliid nformatics and Mathematical Modelling Technical University of Denmark List of contents, cont.
Design of Experiments SUTD 06/04/2016 1
 Design of Experiments SUTD 06/04/2016 1 Outline 1. Introduction 2. 2 k Factorial Design 3. Choice of Sample Size 4. 2 k p Fractional Factorial Design 5. Follow-up experimentation (folding over) with factorial
STA 260: Statistics and Probability II
 Al Nosedal. University of Toronto. Winter 2017 1 Chapter 7. Sampling Distributions and the Central Limit Theorem If you can t explain it simply, you don t understand it well enough Albert Einstein. Theorem
Sampling Distributions: Central Limit Theorem
 Review for Exam 2 Sampling Distributions: Central Limit Theorem Conceptually, we can break up the theorem into three parts: 1. The mean (µ M ) of a population of sample means (M) is equal to the mean (µ)
Construction of Mixed-Level Orthogonal Arrays for Testing in Digital Marketing
 Construction of Mixed-Level Orthogonal Arrays for Testing in Digital Marketing Vladimir Brayman Webtrends October 19, 2012 Advantages of Conducting Designed Experiments in Digital Marketing Availability
16.400/453J Human Factors Engineering. Design of Experiments II
 J Human Factors Engineering Design of Experiments II Review Experiment Design and Descriptive Statistics Research question, independent and dependent variables, histograms, box plots, etc. Inferential
Simple Linear Regression: One Quantitative IV
 Simple Linear Regression: One Quantitative IV Linear regression is frequently used to explain variation observed in a dependent variable (DV) with theoretically linked independent variables (IV). For example,
Written Exam (2 hours)
") M. Müller Applied Analysis of Variance and Experimental Design Summer 2015 Written Exam (2 hours) General remarks: Open book exam. Switch off your mobile phone! Do not stay too long on a part where you
M. Müller Applied Analysis of Variance and Experimental Design Summer 2015 Written Exam (2 hours) General remarks: Open book exam. Switch off your mobile phone! Do not stay too long on a part where you
Use of DOE methodology for Investigating Conditions that Influence the Tension in Marine Risers for FPSO Ships
 1 st International Structural Specialty Conference 1ère Conférence internationale sur le spécialisée sur le génie des structures Calgary, Alberta, Canada May 23-26, 2006 / 23-26 Mai 2006 Use of DOE methodology
STAT451/551 Homework#11 Due: April 22, 2014
 STAT451/551 Homework#11 Due: April 22, 2014 1. Read Chapter 8.3 8.9. 2. 8.4. SAS code is provided. 3. 8.18. 4. 8.24. 5. 8.45. 376 Chapter 8 Two-Level Fractional Factorial Designs more detail. Sequential
Session 3 Fractional Factorial Designs 4
 Session 3 Fractional Factorial Designs 3 a Modification of a Bearing Example 3. Fractional Factorial Designs Two-level fractional factorial designs Confounding Blocking Two-Level Eight Run Orthogonal Array
Analysis of Variance
 Analysis of Variance Chapter 12 McGraw-Hill/Irwin Copyright 2013 by The McGraw-Hill Companies, Inc. All rights reserved. Learning Objectives LO 12-1 List the characteristics of the F distribution and locate
Factorial Analysis of Variance
 Factorial Analysis of Variance Conceptual Example A repeated-measures t-test is more likely to lead to rejection of the null hypothesis if a) *Subjects show considerable variability in their change scores.
Soo King Lim Figure 1: Figure 2: Figure 3: Figure 4: Figure 5: Figure 6: Figure 7: Figure 8: Figure 9: Figure 10: Figure 11: Figure 12: Figure 13:
 1.0 ial Experiment Design by Block... 3 1.1 ial Experiment in Incomplete Block... 3 1. ial Experiment with Two Blocks... 3 1.3 ial Experiment with Four Blocks... 5 Example 1... 6.0 Fractional ial Experiment....1
Chapter 11: Factorial Designs
 Chapter : Factorial Designs. Two factor factorial designs ( levels factors ) This situation is similar to the randomized block design from the previous chapter. However, in addition to the effects within
The One-Way Repeated-Measures ANOVA. (For Within-Subjects Designs)
") The One-Way Repeated-Measures ANOVA (For Within-Subjects Designs) Logic of the Repeated-Measures ANOVA The repeated-measures ANOVA extends the analysis of variance to research situations using repeated-measures
The One-Way Repeated-Measures ANOVA (For Within-Subjects Designs) Logic of the Repeated-Measures ANOVA The repeated-measures ANOVA extends the analysis of variance to research situations using repeated-measures
Fractional Factorial Designs
 k-p Fractional Factorial Designs Fractional Factorial Designs If we have 7 factors, a 7 factorial design will require 8 experiments How much information can we obtain from fewer experiments, e.g. 7-4 =
THE ROYAL STATISTICAL SOCIETY 2015 EXAMINATIONS SOLUTIONS GRADUATE DIPLOMA MODULE 4
 THE ROYAL STATISTICAL SOCIETY 2015 EXAMINATIONS SOLUTIONS GRADUATE DIPLOMA MODULE 4 The Society is providing these solutions to assist candidates preparing for the examinations in 2017. The solutions are
Department of Economics. Business Statistics. Chapter 12 Chi-square test of independence & Analysis of Variance ECON 509. Dr.
 Department of Economics Business Statistics Chapter 1 Chi-square test of independence & Analysis of Variance ECON 509 Dr. Mohammad Zainal Chapter Goals After completing this chapter, you should be able
CHAPTER 4 Analysis of Variance. One-way ANOVA Two-way ANOVA i) Two way ANOVA without replication ii) Two way ANOVA with replication
 Two way ANOVA without replication ii) Two way ANOVA with replication") CHAPTER 4 Analysis of Variance One-way ANOVA Two-way ANOVA i) Two way ANOVA without replication ii) Two way ANOVA with replication 1 Introduction In this chapter, expand the idea of hypothesis tests. We
CHAPTER 4 Analysis of Variance One-way ANOVA Two-way ANOVA i) Two way ANOVA without replication ii) Two way ANOVA with replication 1 Introduction In this chapter, expand the idea of hypothesis tests. We
Sociology 6Z03 Review II
 Sociology 6Z03 Review II John Fox McMaster University Fall 2016 John Fox (McMaster University) Sociology 6Z03 Review II Fall 2016 1 / 35 Outline: Review II Probability Part I Sampling Distributions Probability
Design and Analysis of Multi-Factored Experiments
 Design and Analysis of Multi-Factored Experiments Fractional Factorial Designs L. M. Lye DOE Course 1 Design of Engineering Experiments The 2 k-p Fractional Factorial Design Motivation for fractional factorials
Institutionen för matematik och matematisk statistik Umeå universitet November 7, Inlämningsuppgift 3. Mariam Shirdel
 Institutionen för matematik och matematisk statistik Umeå universitet November 7, 2011 Inlämningsuppgift 3 Mariam Shirdel (mash0007@student.umu.se) Kvalitetsteknik och försöksplanering, 7.5 hp 1 Uppgift
Lecture 12: 2 k p Fractional Factorial Design
 Lecture 12: 2 k p Fractional Factorial Design Montgomery: Chapter 8 Page 1 Fundamental Principles Regarding Factorial Effects Suppose there are k factors (A,B,...,J,K) in an experiment. All possible factorial
Hypothesis testing for µ:
 University of California, Los Angeles Department of Statistics Statistics 10 Elements of a hypothesis test: Hypothesis testing Instructor: Nicolas Christou 1. Null hypothesis, H 0 (always =). 2. Alternative
Practical Statistics for the Analytical Scientist Table of Contents
 Practical Statistics for the Analytical Scientist Table of Contents Chapter 1 Introduction - Choosing the Correct Statistics 1.1 Introduction 1.2 Choosing the Right Statistical Procedures 1.2.1 Planning
Chapter 1 Statistical Inference
 Chapter 1 Statistical Inference causal inference To infer causality, you need a randomized experiment (or a huge observational study and lots of outside information). inference to populations Generalizations
We like to capture and represent the relationship between a set of possible causes and their response, by using a statistical predictive model.
 Statistical Methods in Business Lecture 5. Linear Regression We like to capture and represent the relationship between a set of possible causes and their response, by using a statistical predictive model.
Exam details. Final Review Session. Things to Review
 Exam details Final Review Session Short answer, similar to book problems Formulae and tables will be given You CAN use a calculator Date and Time: Dec. 7, 006, 1-1:30 pm Location: Osborne Centre, Unit
2 k, 2 k r and 2 k-p Factorial Designs
 2 k, 2 k r and 2 k-p Factorial Designs 1 Types of Experimental Designs! Full Factorial Design: " Uses all possible combinations of all levels of all factors. n=3*2*2=12 Too costly! 2 Types of Experimental
 IE 361 EXAM #3 FALL 2013 Show your work: Partial credit can only be given for incorrect answers if there is enough information to clearly see what you were trying to do. There are two additional blank
Probability Distribution
 Probability Distribution 1. In scenario 2, the particle size distribution from the mill is: Counts 81
(ii) Scan your answer sheets INTO ONE FILE only, and submit it in the drop-box.
 Scan your answer sheets INTO ONE FILE only, and submit it in the drop-box.") FINAL EXAM ** Two different ways to submit your answer sheet (i) Use MS-Word and place it in a drop-box. (ii) Scan your answer sheets INTO ONE FILE only, and submit it in the drop-box. Deadline: December
FINAL EXAM ** Two different ways to submit your answer sheet (i) Use MS-Word and place it in a drop-box. (ii) Scan your answer sheets INTO ONE FILE only, and submit it in the drop-box. Deadline: December
CHAPTER 6 A STUDY ON DISC BRAKE SQUEAL USING DESIGN OF EXPERIMENTS
 134 CHAPTER 6 A STUDY ON DISC BRAKE SQUEAL USING DESIGN OF EXPERIMENTS 6.1 INTRODUCTION In spite of the large amount of research work that has been carried out to solve the squeal problem during the last
44.2. Two-Way Analysis of Variance. Introduction. Prerequisites. Learning Outcomes
 Two-Way Analysis of Variance 44 Introduction In the one-way analysis of variance (Section 441) we consider the effect of one factor on the values taken by a variable Very often, in engineering investigations,
DESAIN EKSPERIMEN Analysis of Variances (ANOVA) Semester Genap 2017/2018 Jurusan Teknik Industri Universitas Brawijaya
 Semester Genap 2017/2018 Jurusan Teknik Industri Universitas Brawijaya") DESAIN EKSPERIMEN Analysis of Variances (ANOVA) Semester Jurusan Teknik Industri Universitas Brawijaya Outline Introduction The Analysis of Variance Models for the Data Post-ANOVA Comparison of Means Sample
DESAIN EKSPERIMEN Analysis of Variances (ANOVA) Semester Jurusan Teknik Industri Universitas Brawijaya Outline Introduction The Analysis of Variance Models for the Data Post-ANOVA Comparison of Means Sample
The t-test: A z-score for a sample mean tells us where in the distribution the particular mean lies
 The t-test: So Far: Sampling distribution benefit is that even if the original population is not normal, a sampling distribution based on this population will be normal (for sample size > 30). Benefit
Notes for Week 13 Analysis of Variance (ANOVA) continued WEEK 13 page 1
 continued WEEK 13 page 1") Notes for Wee 13 Analysis of Variance (ANOVA) continued WEEK 13 page 1 Exam 3 is on Friday May 1. A part of one of the exam problems is on Predictiontervals : When randomly sampling from a normal population
Notes for Wee 13 Analysis of Variance (ANOVA) continued WEEK 13 page 1 Exam 3 is on Friday May 1. A part of one of the exam problems is on Predictiontervals : When randomly sampling from a normal population
Chapter 8 Student Lecture Notes 8-1. Department of Economics. Business Statistics. Chapter 12 Chi-square test of independence & Analysis of Variance
 Chapter 8 Student Lecture Notes 8-1 Department of Economics Business Statistics Chapter 1 Chi-square test of independence & Analysis of Variance ECON 509 Dr. Mohammad Zainal Chapter Goals After completing
Mathematical Notation Math Introduction to Applied Statistics
 Mathematical Notation Math 113 - Introduction to Applied Statistics Name : Use Word or WordPerfect to recreate the following documents. Each article is worth 10 points and should be emailed to the instructor
Fractional Factorial Designs
 Fractional Factorial Designs ST 516 Each replicate of a 2 k design requires 2 k runs. E.g. 64 runs for k = 6, or 1024 runs for k = 10. When this is infeasible, we use a fraction of the runs. As a result,
1 Introduction to Minitab
 1 Introduction to Minitab Minitab is a statistical analysis software package. The software is freely available to all students and is downloadable through the Technology Tab at my.calpoly.edu. When you
MATH 251 MATH 251: Multivariate Calculus MATH 251 FALL 2006 EXAM-II FALL 2006 EXAM-II EXAMINATION COVER PAGE Professor Moseley
 MATH 251 MATH 251: Multivariate Calculus MATH 251 FALL 2006 EXAM-II FALL 2006 EXAM-II EXAMINATION COVER PAGE Professor Moseley PRINT NAME ( ) Last Name, First Name MI (What you wish to be called) ID #
23. Fractional factorials - introduction
 173 3. Fractional factorials - introduction Consider a 5 factorial. Even without replicates, there are 5 = 3 obs ns required to estimate the effects - 5 main effects, 10 two factor interactions, 10 three
Statistics For Economics & Business
 Statistics For Economics & Business Analysis of Variance In this chapter, you learn: Learning Objectives The basic concepts of experimental design How to use one-way analysis of variance to test for differences
3. Design Experiments and Variance Analysis
 3. Design Experiments and Variance Analysis Isabel M. Rodrigues 1 / 46 3.1. Completely randomized experiment. Experimentation allows an investigator to find out what happens to the output variables when
On the Compounds of Hat Matrix for Six-Factor Central Composite Design with Fractional Replicates of the Factorial Portion
 American Journal of Computational and Applied Mathematics 017, 7(4): 95-114 DOI: 10.593/j.ajcam.0170704.0 On the Compounds of Hat Matrix for Six-Factor Central Composite Design with Fractional Replicates
ANOVA - analysis of variance - used to compare the means of several populations.
 12.1 One-Way Analysis of Variance ANOVA - analysis of variance - used to compare the means of several populations. Assumptions for One-Way ANOVA: 1. Independent samples are taken using a randomized design.
Chapter 30 Design and Analysis of
 Chapter 30 Design and Analysis of 2 k DOEs Introduction This chapter describes design alternatives and analysis techniques for conducting a DOE. Tables M1 to M5 in Appendix E can be used to create test
Chapter 6 The 2 k Factorial Design Solutions
 Solutions from Montgomery, D. C. (004) Design and Analysis of Experiments, Wiley, NY Chapter 6 The k Factorial Design Solutions 6.. A router is used to cut locating notches on a printed circuit board.
TWO-LEVEL FACTORIAL EXPERIMENTS: REGULAR FRACTIONAL FACTORIALS
 STAT 512 2-Level Factorial Experiments: Regular Fractions 1 TWO-LEVEL FACTORIAL EXPERIMENTS: REGULAR FRACTIONAL FACTORIALS Bottom Line: A regular fractional factorial design consists of the treatments
ST3232: Design and Analysis of Experiments
 Department of Statistics & Applied Probability 2:00-4:00 pm, Monday, April 8, 2013 Lecture 21: Fractional 2 p factorial designs The general principles A full 2 p factorial experiment might not be efficient
Inference for Regression Simple Linear Regression
 Inference for Regression Simple Linear Regression IPS Chapter 10.1 2009 W.H. Freeman and Company Objectives (IPS Chapter 10.1) Simple linear regression p Statistical model for linear regression p Estimating
Probability Methods in Civil Engineering Prof. Dr. Rajib Maity Department of Civil Engineering Indian Institution of Technology, Kharagpur
 Probability Methods in Civil Engineering Prof. Dr. Rajib Maity Department of Civil Engineering Indian Institution of Technology, Kharagpur Lecture No. # 36 Sampling Distribution and Parameter Estimation
Table of z values and probabilities for the standard normal distribution. z is the first column plus the top row. Each cell shows P(X z).
.") Table of z values and probabilities for the standard normal distribution. z is the first column plus the top row. Each cell shows P(X z). For example P(X.04) =.8508. For z < 0 subtract the value from,
Table of z values and probabilities for the standard normal distribution. z is the first column plus the top row. Each cell shows P(X z). For example P(X.04) =.8508. For z < 0 subtract the value from,
DOE Wizard Screening Designs
 DOE Wizard Screening Designs Revised: 10/10/2017 Summary... 1 Example... 2 Design Creation... 3 Design Properties... 13 Saving the Design File... 16 Analyzing the Results... 17 Statistical Model... 18
CHAPTER EIGHT Linear Regression
 7 CHAPTER EIGHT Linear Regression 8. Scatter Diagram Example 8. A chemical engineer is investigating the effect of process operating temperature ( x ) on product yield ( y ). The study results in the following
Chapter 3 Multiple Regression Complete Example
 Department of Quantitative Methods & Information Systems ECON 504 Chapter 3 Multiple Regression Complete Example Spring 2013 Dr. Mohammad Zainal Review Goals After completing this lecture, you should be
Contingency Tables. Safety equipment in use Fatal Non-fatal Total. None 1, , ,128 Seat belt , ,878
 Contingency Tables I. Definition & Examples. A) Contingency tables are tables where we are looking at two (or more - but we won t cover three or more way tables, it s way too complicated) factors, each
Factorial Analysis of Variance
 Factorial Analysis of Variance Overview of the Factorial ANOVA In the context of ANOVA, an independent variable (or a quasiindependent variable) is called a factor, and research studies with multiple factors,
Hypothesis testing: Steps
 Review for Exam 2 Hypothesis testing: Steps Exam 2 Review 1. Determine appropriate test and hypotheses 2. Use distribution table to find critical statistic value(s) representing rejection region 3. Compute
Chapter 5 Introduction to Factorial Designs Solutions
 Solutions from Montgomery, D. C. (1) Design and Analysis of Experiments, Wiley, NY Chapter 5 Introduction to Factorial Designs Solutions 5.1. The following output was obtained from a computer program that
In a one-way ANOVA, the total sums of squares among observations is partitioned into two components: Sums of squares represent:
 Activity #10: AxS ANOVA (Repeated subjects design) Resources: optimism.sav So far in MATH 300 and 301, we have studied the following hypothesis testing procedures: 1) Binomial test, sign-test, Fisher s
CIVL /8904 T R A F F I C F L O W T H E O R Y L E C T U R E - 8
 CIVL - 7904/8904 T R A F F I C F L O W T H E O R Y L E C T U R E - 8 Chi-square Test How to determine the interval from a continuous distribution I = Range 1 + 3.322(logN) I-> Range of the class interval
HYPOTHESIS TESTING. Hypothesis Testing
 MBA 605 Business Analytics Don Conant, PhD. HYPOTHESIS TESTING Hypothesis testing involves making inferences about the nature of the population on the basis of observations of a sample drawn from the population.
Suppose we needed four batches of formaldehyde, and coulddoonly4runsperbatch. Thisisthena2 4 factorial in 2 2 blocks.
 58 2. 2 factorials in 2 blocks Suppose we needed four batches of formaldehyde, and coulddoonly4runsperbatch. Thisisthena2 4 factorial in 2 2 blocks. Some more algebra: If two effects are confounded with
Analysis of Variance (ANOVA)
") Analysis of Variance (ANOVA) Two types of ANOVA tests: Independent measures and Repeated measures Comparing 2 means: X 1 = 20 t - test X 2 = 30 How can we Compare 3 means?: X 1 = 20 X 2 = 30 X 3 = 35 ANOVA
Analysis of Variance (ANOVA) Two types of ANOVA tests: Independent measures and Repeated measures Comparing 2 means: X 1 = 20 t - test X 2 = 30 How can we Compare 3 means?: X 1 = 20 X 2 = 30 X 3 = 35 ANOVA
CS 5014: Research Methods in Computer Science. Experimental Design. Potential Pitfalls. One-Factor (Again) Clifford A. Shaffer.
 Clifford A. Shaffer.") Department of Computer Science Virginia Tech Blacksburg, Virginia Copyright c 2015 by Clifford A. Shaffer Computer Science Title page Computer Science Clifford A. Shaffer Fall 2015 Clifford A. Shaffer
Department of Computer Science Virginia Tech Blacksburg, Virginia Copyright c 2015 by Clifford A. Shaffer Computer Science Title page Computer Science Clifford A. Shaffer Fall 2015 Clifford A. Shaffer
Fundamental Statistical Concepts and Methods Needed in a Test-and-Evaluator s Toolkit. Air Academy Associates
 Fundamental Statistical Concepts and Methods Needed in a Test-and-Evaluator s Toolkit Mark Kiemele Air Academy Associates mkiemele@airacad.com ITEA 010 Symposium Glendale, AZ 13 September 010 INTRODUCTIONS
McGill University. Faculty of Science MATH 204 PRINCIPLES OF STATISTICS II. Final Examination
 McGill University Faculty of Science MATH 204 PRINCIPLES OF STATISTICS II Final Examination Date: 20th April 2009 Time: 9am-2pm Examiner: Dr David A Stephens Associate Examiner: Dr Russell Steele Please
Question. Hypothesis testing. Example. Answer: hypothesis. Test: true or not? Question. Average is not the mean! μ average. Random deviation or not?
 Hypothesis testing Question Very frequently: what is the possible value of μ? Sample: we know only the average! μ average. Random deviation or not? Standard error: the measure of the random deviation.
CS 5014: Research Methods in Computer Science
 Computer Science Clifford A. Shaffer Department of Computer Science Virginia Tech Blacksburg, Virginia Fall 2010 Copyright c 2010 by Clifford A. Shaffer Computer Science Fall 2010 1 / 254 Experimental
Design & Analysis of Experiments 7E 2009 Montgomery
 1 What If There Are More Than Two Factor Levels? The t-test does not directly apply ppy There are lots of practical situations where there are either more than two levels of interest, or there are several
Inferences for Regression
 Inferences for Regression An Example: Body Fat and Waist Size Looking at the relationship between % body fat and waist size (in inches). Here is a scatterplot of our data set: Remembering Regression In
How To: Analyze a Split-Plot Design Using STATGRAPHICS Centurion
 How To: Analyze a SplitPlot Design Using STATGRAPHICS Centurion by Dr. Neil W. Polhemus August 13, 2005 Introduction When performing an experiment involving several factors, it is best to randomize the
Reference: Chapter 6 of Montgomery(8e) Maghsoodloo
 Maghsoodloo") Reference: Chapter 6 of Montgomery(8e) Maghsoodloo 51 DOE (or DOX) FOR BASE BALANCED FACTORIALS The notation k is used to denote a factorial experiment involving k factors (A, B, C, D,..., K) each at levels.
Reference: Chapter 6 of Montgomery(8e) Maghsoodloo 51 DOE (or DOX) FOR BASE BALANCED FACTORIALS The notation k is used to denote a factorial experiment involving k factors (A, B, C, D,..., K) each at levels.
The Difference in Proportions Test
 Overview The Difference in Proportions Test Dr Tom Ilvento Department of Food and Resource Economics A Difference of Proportions test is based on large sample only Same strategy as for the mean We calculate
Inference for Regression Inference about the Regression Model and Using the Regression Line
 Inference for Regression Inference about the Regression Model and Using the Regression Line PBS Chapter 10.1 and 10.2 2009 W.H. Freeman and Company Objectives (PBS Chapter 10.1 and 10.2) Inference about
Unit 10: Simple Linear Regression and Correlation
 Unit 10: Simple Linear Regression and Correlation Statistics 571: Statistical Methods Ramón V. León 6/28/2004 Unit 10 - Stat 571 - Ramón V. León 1 Introductory Remarks Regression analysis is a method for
4:3 LEC - PLANNED COMPARISONS AND REGRESSION ANALYSES
 4:3 LEC - PLANNED COMPARISONS AND REGRESSION ANALYSES FOR SINGLE FACTOR BETWEEN-S DESIGNS Planned or A Priori Comparisons We previously showed various ways to test all possible pairwise comparisons for
SIMPLE REGRESSION ANALYSIS. Business Statistics
 SIMPLE REGRESSION ANALYSIS Business Statistics CONTENTS Ordinary least squares (recap for some) Statistical formulation of the regression model Assessing the regression model Testing the regression coefficients
Ch 13 & 14 - Regression Analysis
 Ch 3 & 4 - Regression Analysis Simple Regression Model I. Multiple Choice:. A simple regression is a regression model that contains a. only one independent variable b. only one dependent variable c. more
Example. χ 2 = Continued on the next page. All cells
 Section 11.1 Chi Square Statistic k Categories 1 st 2 nd 3 rd k th Total Observed Frequencies O 1 O 2 O 3 O k n Expected Frequencies E 1 E 2 E 3 E k n O 1 + O 2 + O 3 + + O k = n E 1 + E 2 + E 3 + + E
Answer Keys to Homework#10
 Answer Keys to Homework#10 Problem 1 Use either restricted or unrestricted mixed models. Problem 2 (a) First, the respective means for the 8 level combinations are listed in the following table A B C Mean