Spatio-temporal precipitation modeling based on time-varying regressions
|
|
|
- Brent Anderson
- 5 years ago
- Views:
Transcription
1 Spatio-temporal precipitation modeling based on time-varying regressions Oleg Makhnin Department of Mathematics New Mexico Tech Socorro, NM January 19,
2 Abstract: A time-varying regression model is considered, based on monthly precipitation data from gauge measurements. The model accounts for orographic effects, that is elevation and aspect of the terrain. The study area is NCDC climate division 2 in a mountainous area in northern New Mexico. We assess spatio-temporal variability and also trace the dependence of precipitation on El Niño/Southern Oscillation (ENSO) index. 2
3 Introduction In many studies (see, e.g. Gershunov and Barnett (1998)), a question was raised of teleconnections of ENSO (El Niño/Southern Oscillation) with precipitation in Southwestern US. In Guan, Vivoni and Wilson (2005), an instant of such teleconnection was reported. In particular, they looked at three categories of years (ENSO High, Low and Neutral) and observed, for example, a positive precipitation anomaly for High and Neutral ENSO in the winter. A question was also raised about the relationship of precipitation to PDO (Pacific Decadal Oscillation). However, at the time scales for the PDO (decades) we don t have enough data to reliably assess this relationship. 3
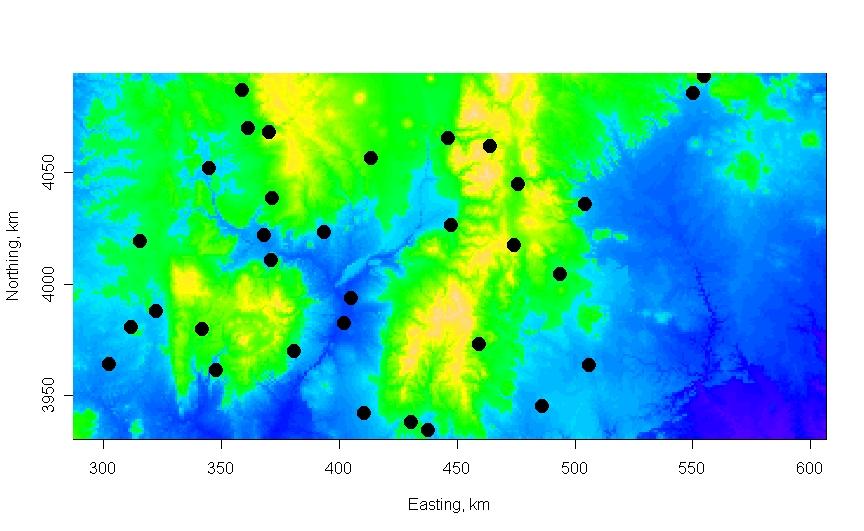
4 This work attempts to assess ENSO influence on a more statistical footing by capturing the spatiotemporal variability of precipitation in the mountainous region in northern New Mexico. The region is chosen because it has a great impact on the water supply in the state of New Mexico. Also, mountainous terrain affects precipitation in a certain way. The study region corresponding to New Mexico NCDC climate Division 2 is shown below. The NCDC rain gauges provide direct measurement of precipitation over various locations in the area. We picked 33 stations for which mostly uninterrupted records are available from 1970 to The data are total monthly precipitation measurements at these stations. 4
5 5
6 6
7 1 Model We fit time-varying regressions to the square-root transformed values of precipitation P jt for Station j and Month t: P jt = β t 0 + β t 1E j + β t 2N j + β t 3Z j + β t 4cos(A j ) + +β t 5sin(A j ) + S mod(t,12) + β SOI L t + τ t + ε jt, j = 1,..., N, t = 1,..., T (1) E j and N j : easting and northing coordinates of a station Z j is the elevation of a station S mod(t,12) are seasonal corrections (January through December, constant for each month throughout the study period) L t = SOI (Southern Oscillation Index, reported at 7
8 a proxy for ENSO. The terms β 4 cos(a j ) and β 5 sin(a j ) account for the moisture flux direction (MFD) effect (Guan, Wilson and Makhnin (2005)). They provide auto-search for the MFD W with β 4 cos(a j ) + β 5 sin(a j ) = β MFD cos(a j W ) (2) The term β MFD cos(a j W ) captures interaction of the MFD with the terrain aspect A j, which is the gradient direction of the terrain at station j, averaged in a 5km window. When the moisture is coming up slope (the directions of A j and W coincide), this results in extra precipitation. The term W inferred in our model is a statistical average over potentially many precipitation events. In Anandkumar (2005), the random field W ( ) was introduced, varying over the region. However, for our purposes, the region 8
9 is fairly small, therefore we assume here that W is constant, and the relation (2) is used instead. However, for larger regions, working with the random field MFD will be critical. The terms with β 1 and β 2 account for linear Moisture Gradient (MG) throughout the region. It does not necessarily coincide with MFD. The terms τ t are random effects for the month t, and ε jt are residual errors (possibly correlated). Instead of actual precipitation measurement we have used square-root transformed precipitation P jt. It is a popular choice of transformation and attains near normality of the transformed values. The covariates E, N, Z are coded; that is, they are scaled to have mean 0. This helps eliminate unwanted correlations between regression coefficients. 9
10 1.1 Time-varying regression coefficients The coefficients βk t, k = 0, 1,..., 5 depend on t. However, we allow for some degree of smoothing by introducing the autoregressive evolution equations, for each k: β t+1 k = µ k + r k (β t k µ k ) + β t k t = 1,..., T 1 (3) (note that β SOI is not time-varying). The increments βk t are assumed to be N (0, q2 k ) with additional variance parameters qk 2, k = 0,..., 5. Note that r 0 = 1 and µ 0 = 0, for identifiability purposes. This way, the mean precipitation value for the entire region for a given month t is split into a slow-varying component β t 0 and a random perturbation τ t. 10
11 1.2 Other parameters The seasonals S mod(t,12) can be thought of as average of the P jt values. For example, S 5 is the average for all May values (all Stations). The residuals ε jt are assumed to be temporally independent. It is well known that the spatial dependence exists (e.g. Guan, Wilson and Makhnin (2005)). We describe spatial dependence for ε jt based on exponential covariance model Cov(ε it, ε jt ) = σ 2 [exp( dist(i, j)/φ) + w 2 ] where dist(i, j) is the Euclidean distance between stations i and j. Currently we fit the values of the range φ = 30 km and relative nugget w 2 = 1/3. Later we will introduce the 11
12 estimation of φ, w 2 into the MCMC sampler. Some data were missing. In the MCMC framework, it is straightforward to impute the missing data using full conditional posteriors, through equation (1). 2 MCMC fit The parameters in the model are fitted using Markov Chain Monte Carlo approach. It is implemented via Gibbs sampler. The full conditional posteriors (FCP) for the parameters are indicated below. The FCP for the entire block of {βt k }, t = 1,..., T, k = 0,..., 5, given all the other parameters from equations (1) and (3), can be computed using forward-filtering backward-sampling (FFBS) approach 12
13 described in West and Harrison (1997). The variance parameters q 2 k are fitted using inverse chi-square (conjugate) prior with the location parameter ζ k and ν k degrees of freedom, similarly to Kim et al. (1998). Then, the FCP distribution ( of qk 2 is inverse chi-square with the location parameter ζ k + ) T 1 t=1 ( βk t ) 2 /(ν k + T 1) and ν k + T 1 degrees of freedom. We can choose informative priors for qk 2 if the shrinking of regression parameters is desired. Similar analysis can be done for residual variance σ 2 and random-effect variance σ 2 τ. Sampling of AR coefficients r k from equation (3) was done using a Metropolis step (see Kim et al. (1998), also for fitting µ k ). 13
14 3 Results The results of an MCMC simulation are presented below. We used the burn-in of 0 iterations and number of MC replicates M = 50, 000, with every 50th selected for the output. 14
15 First, a plot of data and the model fit are shown for the first 120 months sqrt Precipitation Month Figure 1: The data and model fit 15
16 β SOI ACF Frequency Index Lag β SOI Figure 2: The MCMC output for β SOI These clearly indicate the significant negative relationship between the SOI index values and precipitation. 16
17 β Month Figure 3: Posterior means of β t 3, for all Months t. Consistently positive values for β 3 are indicative of the well-documented relationship between elevation and precipitation. 17
18 A clearly expressed seasonal behavior is observed for β 3, as well as MG and MFD: β MG MFD Month Month Month Figure 4: Seasonal behavior of coefficient β t 3 (elevation), MG and MFD For example, the elevation effects are more significant during the Winter months (higher regression coefficient). Moisture Flux Direction fluctuates in a narrow band between southerly, 18
19 for Summer months, to south-westerly, for Winter months. Histogram of MG Histogram of MFD Frequency Frequency Figure 5: Histograms of posterior means for Moisture Flux Direction (MFD) and Moisture Gradient (MG), all months. 19
20 The results indicate a consistent near-southerly MFD for most months (about 180, clockwise with 0 pointing North), and a somewhat less consistent Moisture Gradient. It would be interesting to further investigate the dependence of MG on the SOI phases. 20
21 Figure 6: Posterior histograms of Moisture Gradient (MG) 21
22 Posterior quantiles of variance parameters: parameter 5% 25% 50% 75% 95% σ σ τ q q q q q q
23 Posterior quantiles of mean parameters: parameter 5% 25% 50% 75% 95% µ µ µ µ µ The values of µ 4 and µ 5 are indicative of the MFD value staying in a narrow band (see Figure 4 above) Autoregression coefficients r 3 and r 5 were significantly different from 0. This indicates predictability of β regression coefficients for elevation and MFD, likely due to seasonality of these effects 23
24 (see Figure 4). R code and the data used are available from 4 Conclusions A time-varying regression model was introduced, describing spatial and temporal variability of the precipitation in a given area. A fairly regular seasonal behavior is observed for some elements in our model, in particular, Moisture Flux Direction. There is a significant negative influence of SOI values on the average monthly precipitation. Thus, it confirms the hypothesis of teleconnections between ENSO and the climate in northern New Mexico. This has a potential significance for predicting water supply, especially in semi-arid Southwestern US. 24
25 5 Acknowledgments Thanks to Devon MacAllister for collaborating on R programs, and Huade Guan for useful discussions. References Anandkumar, S. (2005) Hidden Random Field Modeling of Orographic Effects on Mountainous Precipitation, Independent Study Report, New Mexico Tech. Gershunov, A., and T. P. Barnett (1998), Interdecadal modulation of ENSO teleconnections, Bull. Am. Meteorol. Soc., 79, Guan, H., Wilson, J., and Makhnin, O. (2005) Geostatistical Mapping of Mountain Precipitation Incorporating Auto-Searched Effects of Terrain and Climatic Characteristics, Journal of Hydrometeorology, 6, Guan, H., E. R. Vivoni, and J. L. Wilson (2005), Effects of atmospheric teleconnections on seasonal precipitation in mountainous regions of the 25
26 southwestern U.S.: A case study in northern New Mexico, Geophys. Res. Lett., 32, L23701 Kim, S., Shephard, N., and Chib, S. (1998) Stochastic Volatility: Likelihood Inference and Comparison with ARCH Models. Review of Economic Studies, 65, West, M., and Harrison, J. (1997) Bayesian forecasting and dynamic models, Springer-Verlag, New York. 26
27 Thanks! 27
Markov Chain Monte Carlo methods
 Markov Chain Monte Carlo methods By Oleg Makhnin 1 Introduction a b c M = d e f g h i 0 f(x)dx 1.1 Motivation 1.1.1 Just here Supresses numbering 1.1.2 After this 1.2 Literature 2 Method 2.1 New math As
The Correlation Between Fall and Winter Temperature Anomalies in the Midwest during ENSO Events
 The Correlation Between Fall and Winter Temperature Anomalies in the Midwest during ENSO Events Morgan E. Brown Iowa State University Mentors: Ray Arritt and Alan Czarnetzki ABSTRACT According to the National
Bayesian Model Comparison:
 Bayesian Model Comparison: Modeling Petrobrás log-returns Hedibert Freitas Lopes February 2014 Log price: y t = log p t Time span: 12/29/2000-12/31/2013 (n = 3268 days) LOG PRICE 1 2 3 4 0 500 1000 1500
NOTES AND CORRESPONDENCE. El Niño Southern Oscillation and North Atlantic Oscillation Control of Climate in Puerto Rico
 2713 NOTES AND CORRESPONDENCE El Niño Southern Oscillation and North Atlantic Oscillation Control of Climate in Puerto Rico BJÖRN A. MALMGREN Department of Earth Sciences, University of Göteborg, Goteborg,
Online appendix to On the stability of the excess sensitivity of aggregate consumption growth in the US
 Online appendix to On the stability of the excess sensitivity of aggregate consumption growth in the US Gerdie Everaert 1, Lorenzo Pozzi 2, and Ruben Schoonackers 3 1 Ghent University & SHERPPA 2 Erasmus
Reduced Overdispersion in Stochastic Weather Generators for Statistical Downscaling of Seasonal Forecasts and Climate Change Scenarios
 Reduced Overdispersion in Stochastic Weather Generators for Statistical Downscaling of Seasonal Forecasts and Climate Change Scenarios Yongku Kim Institute for Mathematics Applied to Geosciences National
Modelling trends in the ocean wave climate for dimensioning of ships
 Modelling trends in the ocean wave climate for dimensioning of ships STK1100 lecture, University of Oslo Erik Vanem Motivation and background 2 Ocean waves and maritime safety Ships and other marine structures
TAKEHOME FINAL EXAM e iω e 2iω e iω e 2iω
 ECO 513 Spring 2015 TAKEHOME FINAL EXAM (1) Suppose the univariate stochastic process y is ARMA(2,2) of the following form: y t = 1.6974y t 1.9604y t 2 + ε t 1.6628ε t 1 +.9216ε t 2, (1) where ε is i.i.d.
TIME SERIES ANALYSIS AND FORECASTING USING THE STATISTICAL MODEL ARIMA
 CHAPTER 6 TIME SERIES ANALYSIS AND FORECASTING USING THE STATISTICAL MODEL ARIMA 6.1. Introduction A time series is a sequence of observations ordered in time. A basic assumption in the time series analysis
Markov Chain Monte Carlo
 Markov Chain Monte Carlo Recall: To compute the expectation E ( h(y ) ) we use the approximation E(h(Y )) 1 n n h(y ) t=1 with Y (1),..., Y (n) h(y). Thus our aim is to sample Y (1),..., Y (n) from f(y).
Modelling and forecasting of offshore wind power fluctuations with Markov-Switching models
 Modelling and forecasting of offshore wind power fluctuations with Markov-Switching models 02433 - Hidden Markov Models Pierre-Julien Trombe, Martin Wæver Pedersen, Henrik Madsen Course week 10 MWP, compiled
Lecture 14 Bayesian Models for Spatio-Temporal Data
 Lecture 14 Bayesian Models for Spatio-Temporal Data Dennis Sun Stats 253 August 13, 2014 Outline of Lecture 1 Recap of Bayesian Models 2 Empirical Bayes 3 Case 1: Long-Lead Forecasting of Sea Surface Temperatures
Variability Across Space
 Variability and Vulnerability of Western US Snowpack Potential impacts of Climactic Change Mark Losleben, Kurt Chowanski Mountain Research Station, University of Colorado Introduction The Western United
Bayesian dynamic modeling for large space-time weather datasets using Gaussian predictive processes
 Bayesian dynamic modeling for large space-time weather datasets using Gaussian predictive processes Sudipto Banerjee 1 and Andrew O. Finley 2 1 Biostatistics, School of Public Health, University of Minnesota,
Bayesian Dynamic Linear Modelling for. Complex Computer Models
 Bayesian Dynamic Linear Modelling for Complex Computer Models Fei Liu, Liang Zhang, Mike West Abstract Computer models may have functional outputs. With no loss of generality, we assume that a single computer
Thai Meteorological Department, Ministry of Digital Economy and Society
 Thai Meteorological Department, Ministry of Digital Economy and Society Three-month Climate Outlook For November 2017 January 2018 Issued on 31 October 2017 -----------------------------------------------------------------------------------------------------------------------------
Bayesian dynamic modeling for large space-time weather datasets using Gaussian predictive processes
 Bayesian dynamic modeling for large space-time weather datasets using Gaussian predictive processes Andrew O. Finley 1 and Sudipto Banerjee 2 1 Department of Forestry & Department of Geography, Michigan
STAT 425: Introduction to Bayesian Analysis
 STAT 425: Introduction to Bayesian Analysis Marina Vannucci Rice University, USA Fall 2017 Marina Vannucci (Rice University, USA) Bayesian Analysis (Part 2) Fall 2017 1 / 19 Part 2: Markov chain Monte
(5) Multi-parameter models - Gibbs sampling. ST440/540: Applied Bayesian Analysis
 Multi-parameter models - Gibbs sampling. ST440/540: Applied Bayesian Analysis") Summarizing a posterior Given the data and prior the posterior is determined Summarizing the posterior gives parameter estimates, intervals, and hypothesis tests Most of these computations are integrals
Summarizing a posterior Given the data and prior the posterior is determined Summarizing the posterior gives parameter estimates, intervals, and hypothesis tests Most of these computations are integrals
Trends in Climate Teleconnections and Effects on the Midwest
 Trends in Climate Teleconnections and Effects on the Midwest Don Wuebbles Zachary Zobel Department of Atmospheric Sciences University of Illinois, Urbana November 11, 2015 Date Name of Meeting 1 Arctic
Bayesian dynamic modeling for large space-time weather datasets using Gaussian predictive processes
 Bayesian dynamic modeling for large space-time weather datasets using Gaussian predictive processes Andrew O. Finley Department of Forestry & Department of Geography, Michigan State University, Lansing
Bayesian dynamic modeling for large space-time weather datasets using Gaussian predictive processes
 Bayesian dynamic modeling for large space-time weather datasets using Gaussian predictive processes Alan Gelfand 1 and Andrew O. Finley 2 1 Department of Statistical Science, Duke University, Durham, North
Time Series Analysis -- An Introduction -- AMS 586
 Time Series Analysis -- An Introduction -- AMS 586 1 Objectives of time series analysis Data description Data interpretation Modeling Control Prediction & Forecasting 2 Time-Series Data Numerical data
United States Streamflow Probabilities based on Forecasted La Niña, Winter-Spring 2000
 United States Streamflow Probabilities based on Forecasted La Niña, Winter-Spring 2000 contributed by Michael D. Dettinger 1, Daniel R. Cayan 1, and Kelly T. Redmond 2 1 U.S. Geological Survey, Scripps
Spatial Statistics with Image Analysis. Outline. A Statistical Approach. Johan Lindström 1. Lund October 6, 2016
 Spatial Statistics Spatial Examples More Spatial Statistics with Image Analysis Johan Lindström 1 1 Mathematical Statistics Centre for Mathematical Sciences Lund University Lund October 6, 2016 Johan Lindström
Seasonal Climate Forecast August October 2013 Verification (Issued: November 17, 2013)
") Seasonal Climate Forecast August October 2013 Verification (Issued: November 17, 2013) Note: This product is published by the Oregon Department of Agriculture (ODA), in cooperation with the Oregon Department
Seasonal Climate Forecast August October 2013 Verification (Issued: November 17, 2013) Note: This product is published by the Oregon Department of Agriculture (ODA), in cooperation with the Oregon Department
ECO 513 Fall 2009 C. Sims HIDDEN MARKOV CHAIN MODELS
 ECO 513 Fall 2009 C. Sims HIDDEN MARKOV CHAIN MODELS 1. THE CLASS OF MODELS y t {y s, s < t} p(y t θ t, {y s, s < t}) θ t = θ(s t ) P[S t = i S t 1 = j] = h ij. 2. WHAT S HANDY ABOUT IT Evaluating the
Modelling Wind Farm Data and the Short Term Prediction of Wind Speeds
 Modelling Wind Farm Data and the Short Term Prediction of Wind Speeds An Investigation into Wind Speed Data Sets Erin Mitchell Lancaster University 6th April 2011 Outline 1 Data Considerations Overview
Precipitation processes in the Middle East
 Precipitation processes in the Middle East J. Evans a, R. Smith a and R.Oglesby b a Dept. Geology & Geophysics, Yale University, Connecticut, USA. b Global Hydrology and Climate Center, NASA, Alabama,
Mid-season Storm Surge Update: December, 2013
 December 17, 2012 Ambleside Beach (Photograph by: Mark van Manen, PNG) Mid-season Storm Surge Update: December, 2013 Mid-season discussion of tidal and climate conditions affecting extreme water levels
Statistical Forecast of the 2001 Western Wildfire Season Using Principal Components Regression. Experimental Long-Lead Forecast Bulletin
 Statistical Forecast of the 2001 Western Wildfire Season Using Principal Components Regression contributed by Anthony L. Westerling 1, Daniel R. Cayan 1,2, Alexander Gershunov 1, Michael D. Dettinger 2
Principles of Bayesian Inference
 Principles of Bayesian Inference Sudipto Banerjee University of Minnesota July 20th, 2008 1 Bayesian Principles Classical statistics: model parameters are fixed and unknown. A Bayesian thinks of parameters
Forward Problems and their Inverse Solutions
 Forward Problems and their Inverse Solutions Sarah Zedler 1,2 1 King Abdullah University of Science and Technology 2 University of Texas at Austin February, 2013 Outline 1 Forward Problem Example Weather
Interannual Variability of the South Atlantic High and rainfall in Southeastern South America during summer months
 Interannual Variability of the South Atlantic High and rainfall in Southeastern South America during summer months Inés Camilloni 1, 2, Moira Doyle 1 and Vicente Barros 1, 3 1 Dto. Ciencias de la Atmósfera
The U. S. Winter Outlook
 The 2018-2019 U. S. Winter Outlook Michael Halpert Deputy Director Climate Prediction Center Mike.Halpert@noaa.gov http://www.cpc.ncep.noaa.gov Outline About the Seasonal Outlook Review of 2017-18 U. S.
Hidden Markov Models for precipitation
 Hidden Markov Models for precipitation Pierre Ailliot Université de Brest Joint work with Peter Thomson Statistics Research Associates (NZ) Page 1 Context Part of the project Climate-related risks for
A Framework for Daily Spatio-Temporal Stochastic Weather Simulation
 A Framework for Daily Spatio-Temporal Stochastic Weather Simulation, Rick Katz, Balaji Rajagopalan Geophysical Statistics Project Institute for Mathematics Applied to Geosciences National Center for Atmospheric
Modeling of peak inflow dates for a snowmelt dominated basin Evan Heisman. CVEN 6833: Advanced Data Analysis Fall 2012 Prof. Balaji Rajagopalan
 Modeling of peak inflow dates for a snowmelt dominated basin Evan Heisman CVEN 6833: Advanced Data Analysis Fall 2012 Prof. Balaji Rajagopalan The Dworshak reservoir, a project operated by the Army Corps
Bayesian Methods for Machine Learning
 Bayesian Methods for Machine Learning CS 584: Big Data Analytics Material adapted from Radford Neal s tutorial (http://ftp.cs.utoronto.ca/pub/radford/bayes-tut.pdf), Zoubin Ghahramni (http://hunch.net/~coms-4771/zoubin_ghahramani_bayesian_learning.pdf),
Introduction of Seasonal Forecast Guidance. TCC Training Seminar on Seasonal Prediction Products November 2013
 Introduction of Seasonal Forecast Guidance TCC Training Seminar on Seasonal Prediction Products 11-15 November 2013 1 Outline 1. Introduction 2. Regression method Single/Multi regression model Selection
Climate informed flood frequency analysis and prediction in Montana using hierarchical Bayesian modeling
 Click Here for Full Article GEOPHYSICAL RESEARCH LETTERS, VOL. 35, L05404, doi:10.1029/2007gl032220, 2008 Climate informed flood frequency analysis and prediction in Montana using hierarchical Bayesian
Part I State space models
 Part I State space models 1 Introduction to state space time series analysis James Durbin Department of Statistics, London School of Economics and Political Science Abstract The paper presents a broad
Preferred spatio-temporal patterns as non-equilibrium currents
 Preferred spatio-temporal patterns as non-equilibrium currents Escher Jeffrey B. Weiss Atmospheric and Oceanic Sciences University of Colorado, Boulder Arin Nelson, CU Baylor Fox-Kemper, Brown U Royce
Weather and Climate Summary and Forecast March 2018 Report
 Weather and Climate Summary and Forecast March 2018 Report Gregory V. Jones Linfield College March 7, 2018 Summary: The ridge pattern that brought drier and warmer conditions from December through most
Time Series Analysis Model for Rainfall Data in Jordan: Case Study for Using Time Series Analysis
 American Journal of Environmental Sciences 5 (5): 599-604, 2009 ISSN 1553-345X 2009 Science Publications Time Series Analysis Model for Rainfall Data in Jordan: Case Study for Using Time Series Analysis
Bayesian data analysis in practice: Three simple examples
 Bayesian data analysis in practice: Three simple examples Martin P. Tingley Introduction These notes cover three examples I presented at Climatea on 5 October 0. Matlab code is available by request to
MCMC Sampling for Bayesian Inference using L1-type Priors
 MÜNSTER MCMC Sampling for Bayesian Inference using L1-type Priors (what I do whenever the ill-posedness of EEG/MEG is just not frustrating enough!) AG Imaging Seminar Felix Lucka 26.06.2012 , MÜNSTER Sampling
data lam=36.9 lam=6.69 lam=4.18 lam=2.92 lam=2.21 time max wavelength modulus of max wavelength cycle
 AUTOREGRESSIVE LINEAR MODELS AR(1) MODELS The zero-mean AR(1) model x t = x t,1 + t is a linear regression of the current value of the time series on the previous value. For > 0 it generates positively
The Role of Indian Ocean Sea Surface Temperature in Forcing East African Rainfall Anomalies during December January 1997/98
 DECEMBER 1999 NOTES AND CORRESPONDENCE 3497 The Role of Indian Ocean Sea Surface Temperature in Forcing East African Rainfall Anomalies during December January 1997/98 M. LATIF AND D. DOMMENGET Max-Planck-Institut
Lecture 2 APPLICATION OF EXREME VALUE THEORY TO CLIMATE CHANGE. Rick Katz
 1 Lecture 2 APPLICATION OF EXREME VALUE THEORY TO CLIMATE CHANGE Rick Katz Institute for Study of Society and Environment National Center for Atmospheric Research Boulder, CO USA email: rwk@ucar.edu Home
La Niña impacts on global seasonal weather anomalies: The OLR perspective. Andrew Chiodi and Ed Harrison
 La Niña impacts on global seasonal weather anomalies: The OLR perspective Andrew Chiodi and Ed Harrison Outline Motivation Impacts of the El Nino- Southern Oscillation (ENSO) on seasonal weather anomalies
THE ROLE OF OCEAN STATE INDICES IN SEASONAL AND INTER-ANNUAL CLIMATE VARIABILITY OF THAILAND
 THE ROLE OF OCEAN STATE INDICES IN SEASONAL AND INTER-ANNUAL CLIMATE VARIABILITY OF THAILAND Manfred Koch and Werapol Bejranonda Department of Geohydraulics and Engineering Hydrology, University of Kassel,
Effect of anomalous warming in the central Pacific on the Australian monsoon
 Click Here for Full Article GEOPHYSICAL RESEARCH LETTERS, VOL. 36, L12704, doi:10.1029/2009gl038416, 2009 Effect of anomalous warming in the central Pacific on the Australian monsoon A. S. Taschetto, 1
lecture 11 El Niño/Southern Oscillation (ENSO) Part II
 Part II") lecture 11 El Niño/Southern Oscillation (ENSO) Part II SYSTEM MEMORY: OCEANIC WAVE PROPAGATION ASYMMETRY BETWEEN THE ATMOSPHERE AND OCEAN The atmosphere and ocean are not symmetrical in their responses
lecture 11 El Niño/Southern Oscillation (ENSO) Part II SYSTEM MEMORY: OCEANIC WAVE PROPAGATION ASYMMETRY BETWEEN THE ATMOSPHERE AND OCEAN The atmosphere and ocean are not symmetrical in their responses
Sub-kilometer-scale space-time stochastic rainfall simulation
 Picture: Huw Alexander Ogilvie Sub-kilometer-scale space-time stochastic rainfall simulation Lionel Benoit (University of Lausanne) Gregoire Mariethoz (University of Lausanne) Denis Allard (INRA Avignon)
Comparing Non-informative Priors for Estimation and Prediction in Spatial Models
 Environmentrics 00, 1 12 DOI: 10.1002/env.XXXX Comparing Non-informative Priors for Estimation and Prediction in Spatial Models Regina Wu a and Cari G. Kaufman a Summary: Fitting a Bayesian model to spatial
Lecture 4: Dynamic models
 linear s Lecture 4: s Hedibert Freitas Lopes The University of Chicago Booth School of Business 5807 South Woodlawn Avenue, Chicago, IL 60637 http://faculty.chicagobooth.edu/hedibert.lopes hlopes@chicagobooth.edu
CSC 2541: Bayesian Methods for Machine Learning
 CSC 2541: Bayesian Methods for Machine Learning Radford M. Neal, University of Toronto, 2011 Lecture 3 More Markov Chain Monte Carlo Methods The Metropolis algorithm isn t the only way to do MCMC. We ll
P2.1 CAN U.S. WEST COAST CLIMATE BE FORCAST? Steve LaDochy*, Jeffrey N. Brown and Mattias Selke California State University, Los Angeles
 P2.1 CAN U.S. WEST COAST CLIMATE BE FORCAST? Steve LaDochy*, Jeffrey N. Brown and Mattias Selke California State University, Los Angeles William C. Patzert, JPL NASA 1. Introduction The tropical Pacific
Stefan Liess University of Minnesota Saurabh Agrawal, Snigdhansu Chatterjee, Vipin Kumar University of Minnesota
 Introducing and Finding Tripoles: A Connection Between Central Asia and the Tropical Pacific Stefan Liess University of Minnesota liess@umn.edu Saurabh Agrawal, Snigdhansu Chatterjee, Vipin Kumar University
South & South East Asian Region:
 Issued: 10 th November 2017 Valid Period: December 2017 May 2018 South & South East Asian Region: Indonesia Tobacco Regions 1 A] Current conditions: 1] El Niño-Southern Oscillation (ENSO) ENSO Alert System
MDA WEATHER SERVICES AG WEATHER OUTLOOK. Kyle Tapley-Senior Agricultural Meteorologist May 22, 2014 Chicago, IL
 MDA WEATHER SERVICES AG WEATHER OUTLOOK Kyle Tapley-Senior Agricultural Meteorologist May 22, 2014 Chicago, IL GLOBAL GRAIN NORTH AMERICA 2014 Agenda Spring Recap North America Forecast El Niño Discussion
The U. S. Winter Outlook
 The 2017-2018 U. S. Winter Outlook Michael Halpert Deputy Director Climate Prediction Center Mike.Halpert@noaa.gov http://www.cpc.ncep.noaa.gov Outline About the Seasonal Outlook Review of 2016-17 U. S.
Here s what a weak El Nino usually brings to the nation with temperatures:
 Time again for my annual Winter Weather Outlook. Here's just a small part of the items I considered this year and how I think they will play out with our winter of 2018-2019. El Nino / La Nina: When looking
Session 5B: A worked example EGARCH model
 Session 5B: A worked example EGARCH model John Geweke Bayesian Econometrics and its Applications August 7, worked example EGARCH model August 7, / 6 EGARCH Exponential generalized autoregressive conditional
Temporal Trends in Forest Fire Season Length
 Temporal Trends in Forest Fire Season Length Alisha Albert-Green aalbertg@sfu.ca Department of Statistics and Actuarial Science Simon Fraser University Stochastic Modelling of Forest Dynamics Webinar March
Ecological indicators: Software development
 Ecological indicators: Software development Sergei N. Rodionov Joint Institute for the Study of the Atmosphere and Ocean, University of Washington, Seattle, WA 98185, U.S.A. E-mail: sergei.rodionov@noaa.gov
Metropolis Hastings. Rebecca C. Steorts Bayesian Methods and Modern Statistics: STA 360/601. Module 9
 Metropolis Hastings Rebecca C. Steorts Bayesian Methods and Modern Statistics: STA 360/601 Module 9 1 The Metropolis-Hastings algorithm is a general term for a family of Markov chain simulation methods
South & South East Asian Region:
 Issued: 15 th December 2017 Valid Period: January June 2018 South & South East Asian Region: Indonesia Tobacco Regions 1 A] Current conditions: 1] El Niño-Southern Oscillation (ENSO) ENSO Alert System
Wind: Global Systems Chapter 10
 Wind: Global Systems Chapter 10 General Circulation of the Atmosphere General circulation of the atmosphere describes average wind patterns and is useful for understanding climate Over the earth, incoming
A Statistical Input Pruning Method for Artificial Neural Networks Used in Environmental Modelling
 A Statistical Input Pruning Method for Artificial Neural Networks Used in Environmental Modelling G. B. Kingston, H. R. Maier and M. F. Lambert Centre for Applied Modelling in Water Engineering, School
Modes of Climate Variability and Atmospheric Circulation Systems in the Euro-Atlantic Sector
 Modes of Climate Variability and Atmospheric Circulation Systems in the Euro-Atlantic Sector David Barriopedro 1,2 (1) Dpto. Física de la Tierra II, Universidad Complutense de Madrid (2) Instituto de Geociencias,
THE INFLUENCE OF CLIMATE TELECONNECTIONS ON WINTER TEMPERATURES IN WESTERN NEW YORK INTRODUCTION
 Middle States Geographer, 2014, 47: 60-67 THE INFLUENCE OF CLIMATE TELECONNECTIONS ON WINTER TEMPERATURES IN WESTERN NEW YORK Frederick J. Bloom and Stephen J. Vermette Department of Geography and Planning
Separation of a Signal of Interest from a Seasonal Effect in Geophysical Data: I. El Niño/La Niña Phenomenon
 International Journal of Geosciences, 2011, 2, **-** Published Online November 2011 (http://www.scirp.org/journal/ijg) Separation of a Signal of Interest from a Seasonal Effect in Geophysical Data: I.
The Planetary Circulation System
 12 The Planetary Circulation System Learning Goals After studying this chapter, students should be able to: 1. describe and account for the global patterns of pressure, wind patterns and ocean currents
The role of teleconnections in extreme (high and low) precipitation events: The case of the Mediterranean region
 precipitation events: The case of the Mediterranean region") European Geosciences Union General Assembly 2013 Vienna, Austria, 7 12 April 2013 Session HS7.5/NP8.4: Hydroclimatic Stochastics The role of teleconnections in extreme (high and low) events: The case of
European Geosciences Union General Assembly 2013 Vienna, Austria, 7 12 April 2013 Session HS7.5/NP8.4: Hydroclimatic Stochastics The role of teleconnections in extreme (high and low) events: The case of
Seasonal and interannual relations between precipitation, soil moisture and vegetation in the North American monsoon region
 Seasonal and interannual relations between precipitation, soil moisture and vegetation in the North American monsoon region Luis A. Mendez-Barroso 1, Enrique R. Vivoni 1, Christopher J. Watts 2 and Julio
Bayesian Estimation of Input Output Tables for Russia
 Bayesian Estimation of Input Output Tables for Russia Oleg Lugovoy (EDF, RANE) Andrey Polbin (RANE) Vladimir Potashnikov (RANE) WIOD Conference April 24, 2012 Groningen Outline Motivation Objectives Bayesian
NIWA Outlook: March-May 2015
 March May 2015 Issued: 27 February 2015 Hold mouse over links and press ctrl + left click to jump to the information you require: Overview Regional predictions for the next three months: Northland, Auckland,
CPSC 540: Machine Learning
 CPSC 540: Machine Learning MCMC and Non-Parametric Bayes Mark Schmidt University of British Columbia Winter 2016 Admin I went through project proposals: Some of you got a message on Piazza. No news is
Eurasian Snow Cover Variability and Links with Stratosphere-Troposphere Coupling and Their Potential Use in Seasonal to Decadal Climate Predictions
 US National Oceanic and Atmospheric Administration Climate Test Bed Joint Seminar Series NCEP, Camp Springs, Maryland, 22 June 2011 Eurasian Snow Cover Variability and Links with Stratosphere-Troposphere
Analysis Links Pacific Decadal Variability to Drought and Streamflow in United States
 Page 1 of 8 Vol. 80, No. 51, December 21, 1999 Analysis Links Pacific Decadal Variability to Drought and Streamflow in United States Sumant Nigam, Mathew Barlow, and Ernesto H. Berbery For more information,
Pacific Decadal Oscillation ( PDO ):
:") Time again for my annual Winter Weather Outlook. Here's just a small part of the items I considered this year and how I think they will play out with our winter of 2015-2016. El Nino / La Nina: When looking
Time again for my annual Winter Weather Outlook. Here's just a small part of the items I considered this year and how I think they will play out with our winter of 2015-2016. El Nino / La Nina: When looking
The Bayesian Approach to Multi-equation Econometric Model Estimation
 Journal of Statistical and Econometric Methods, vol.3, no.1, 2014, 85-96 ISSN: 2241-0384 (print), 2241-0376 (online) Scienpress Ltd, 2014 The Bayesian Approach to Multi-equation Econometric Model Estimation
Forecasting of meteorological drought using ARIMA model
 Indian J. Agric. Res., 51 (2) 2017 : 103-111 Print ISSN:0367-8245 / Online ISSN:0976-058X AGRICULTURAL RESEARCH COMMUNICATION CENTRE www.arccjournals.com/www.ijarjournal.com Forecasting of meteorological
Making rating curves - the Bayesian approach
 Making rating curves - the Bayesian approach Rating curves what is wanted? A best estimate of the relationship between stage and discharge at a given place in a river. The relationship should be on the
Preisler & Westerling 2005 Joint Statistical Meetings Minneapolis MN. Estimating Risk Probabilities for Wildland Fires
 Estimating Risk Probabilities for Wildland Fires Haiganoush K. Preisler 1 and Anthony L. Westerling 2 1 USDA Forest Service USDA, Pacific Southwest Research Station, 800 Buchanan St., West Annex, Albany,
June 1993 T. Nitta and J. Yoshimura 367. Trends and Interannual and Interdecadal Variations of. Global Land Surface Air Temperature
 June 1993 T. Nitta and J. Yoshimura 367 Trends and Interannual and Interdecadal Variations of Global Land Surface Air Temperature By Tsuyoshi Nitta Center for Climate System Research, University of Tokyo,
Hmms with variable dimension structures and extensions
 Hmm days/enst/january 21, 2002 1 Hmms with variable dimension structures and extensions Christian P. Robert Université Paris Dauphine www.ceremade.dauphine.fr/ xian Hmm days/enst/january 21, 2002 2 1 Estimating
State-Space Methods for Inferring Spike Trains from Calcium Imaging
 State-Space Methods for Inferring Spike Trains from Calcium Imaging Joshua Vogelstein Johns Hopkins April 23, 2009 Joshua Vogelstein (Johns Hopkins) State-Space Calcium Imaging April 23, 2009 1 / 78 Outline
Switching Regime Estimation
 Switching Regime Estimation Series de Tiempo BIrkbeck March 2013 Martin Sola (FE) Markov Switching models 01/13 1 / 52 The economy (the time series) often behaves very different in periods such as booms
Bayesian Linear Models
 Bayesian Linear Models Sudipto Banerjee 1 and Andrew O. Finley 2 1 Biostatistics, School of Public Health, University of Minnesota, Minneapolis, Minnesota, U.S.A. 2 Department of Forestry & Department
Bayesian Stochastic Volatility (SV) Model with non-gaussian Errors
 Model with non-gaussian Errors") rrors Bayesian Stochastic Volatility (SV) Model with non-gaussian Errors Seokwoo Lee 1, Hedibert F. Lopes 2 1 Department of Statistics 2 Graduate School of Business University of Chicago May 19, 2008 rrors
rrors Bayesian Stochastic Volatility (SV) Model with non-gaussian Errors Seokwoo Lee 1, Hedibert F. Lopes 2 1 Department of Statistics 2 Graduate School of Business University of Chicago May 19, 2008 rrors
TROPICAL-EXTRATROPICAL INTERACTIONS
 Notes of the tutorial lectures for the Natural Sciences part by Alice Grimm Fourth lecture TROPICAL-EXTRATROPICAL INTERACTIONS Anomalous tropical SST Anomalous convection Anomalous latent heat source Anomalous
CHAPTER 1: INTRODUCTION
 CHAPTER 1: INTRODUCTION There is now unequivocal evidence from direct observations of a warming of the climate system (IPCC, 2007). Despite remaining uncertainties, it is now clear that the upward trend
Diagnosing the Climatology and Interannual Variability of North American Summer Climate with the Regional Atmospheric Modeling System (RAMS)
") Diagnosing the Climatology and Interannual Variability of North American Summer Climate with the Regional Atmospheric Modeling System (RAMS) Christopher L. Castro and Roger A. Pielke, Sr. Department of
Diagnosing the Climatology and Interannual Variability of North American Summer Climate with the Regional Atmospheric Modeling System (RAMS) Christopher L. Castro and Roger A. Pielke, Sr. Department of
INVISIBLE WATER COSTS
 Every Drop Every Counts... Drop Counts... INVISIBLE WATER COSTS Corn - 108.1 gallons per pound How much water it takes to produce... Apple - 18.5 gallons to grow Beef - 1,581 gallons per pound Oats - 122.7
Prediction of Snow Water Equivalent in the Snake River Basin
 Hobbs et al. Seasonal Forecasting 1 Jon Hobbs Steve Guimond Nate Snook Meteorology 455 Seasonal Forecasting Prediction of Snow Water Equivalent in the Snake River Basin Abstract Mountainous regions of
The Effects of Monetary Policy on Stock Market Bubbles: Some Evidence
 The Effects of Monetary Policy on Stock Market Bubbles: Some Evidence Jordi Gali Luca Gambetti ONLINE APPENDIX The appendix describes the estimation of the time-varying coefficients VAR model. The model
The North Atlantic Oscillation: Climatic Significance and Environmental Impact
 1 The North Atlantic Oscillation: Climatic Significance and Environmental Impact James W. Hurrell National Center for Atmospheric Research Climate and Global Dynamics Division, Climate Analysis Section