Dynamic Stability Review of Lafayette Dam ( 1 of 2 ) Report
|
|
|
- Brandon Gregory
- 5 years ago
- Views:
Transcription

 Report")


1 Geotechnical Environmental and Water Resources Engineering Dynamic Stability Review of Lafayette Dam ( 1 of 2 ) Report Submitted to: East Bay Municipal Utility District Oakland, CA Prepared By: Gilles Bureau, P.E., G.E. William A. Rettberg, P.E. Date 08/16/05 Project
2
3 Dynamic Stability Review of Lafayette Dam East Bay Municipal Utility District 08/16/05 Table of Contents 1. SUMMARY Lafayette Dam Field and Geologic Inspections Tectonic Setting Updated Seismic Criteria Liquefaction Potential Previous Analyses Updated Simplified Analyses Operation, Maintenance and Monitoring Data Conclusions and Recommendations DESCRIPTION OF PROJECT FEATURES General Embankment Dam Spillway and Outlet Works Standard Operational Procedures Instrumentation SUMMARY OF CONSTRUCTION HISTORY AND OPERATION Design and Construction History Original Design and Initial Construction The 1928 Construction Failure Revised Design and Final Construction Dam Operation GEOLOGIC AND SEISMIC CONSIDERATIONS Regional Geology Geologic Structure and Tectonic Setting Recent Faulting and Seismicity Landslides Foundation Condition Seismic Criteria General Basis for Seismic Criteria Influence of Local Site Conditions Peak Ground Acceleration Response Spectra INSTRUMENTATION Survey Monuments GEI Consultants - i -
4 Dynamic Stability Review of Lafayette Dam East Bay Municipal Utility District 08/16/ Piezometers Seepage Monitoring Instrument Evaluation FIELD INSPECTION General Dam Outlet Tower and Spillway Embankment STABILITY ASSESSMENT Previous Field Exploration and Laboratory Testing Programs Pre-Construction and 1929 Post-Failure Field Programs Investigation Investigation Investigation Previous Analyses Static and Pseudo-Static Analyses (1956) Static and Pseudo-Static Analyses (1966) Equivalent-Linear Dynamic Analyses (1976) Simplified Analyses by DSOD (2003) Current Applicability of Previous Analyses Review of Material Properties Phreatic Surface Assumption Updated Slope Stability Analysis Analysis Properties Analysis Model and Results Evaluation of Liquefaction Potential Computed Earthquake-Induced Deformations Review of 1976 Cyclic Triaxial Test Data ADEQUACY OF MAINTENANCE AND METHODS OF OPERATION Operation, Maintenance and Surveillance Procedures Evaluation CONCLUSIONS Construction History Assessment of Dam and Reservoir Perimeter Adequacy of Instrumentation, Monitoring of Instrumentation and Surveillance Adequacy of Operation of Spillway and Outlet Works Updating of Seismic Criteria Assessment of Material Properties Assessment of Previous Analyses Simplified Stability Analysis and Adequacy of Factors of Safety RECOMMENDATIONS GEI Consultants - ii -
5 Dynamic Stability Review of Lafayette Dam East Bay Municipal Utility District 08/16/ Recommendations for Optional Geologic Investigations Recommendations for Optional Field and Laboratory Investigations Recommendations Regarding Stability Assessment REFERENCES LIST OF TABLES Table 2-1 Principal Project Data Table 4-1 Faults in Vicinity of Lafayette Dam Table 4-2 Updated Ground Motion Estimates Lafayette Dam Table 4-3 Recommended Horizontal Spectra Hayward Fault Table 4-4 Recommended Vertical Spectra Hayward Fault Table 4-5 Recommended Horizontal Spectra San Andreas Fault Table 4-6 Recommended Vertical Spectra San Andreas Fault Table 4-7 Recommended Horizontal Spectra Calaveras Fault Table 4-8 Recommended Vertical Spectra Calaveras Fault Table 4-9 Recommended Horizontal Spectra Lafayette-Reliez Valley Fault Table 4-10 Recommended Vertical Spectra Lafayette-Reliez Valley Fault Table 4-11 USGS Probabilistic Ground Motion Estimates Table 7-1 Lafayette Dam Previous Borings Inventory Table 7-2 Lafayette Dam Summary of Unit Weights and Moisture Contents Table 7-3 Lafayette Dam Summary of Strength Parameters Table 7-4 Summary of Computed Factors of Safety Table 7-5 Summary of Computed Average Crest Settlements Table 7-6 Cyclic Triaxial Test Results (W.A. Wahler & Associates, 1976) LIST OF FIGURES Figure 2-1 Figure 2-2 Figure 2-3 Vicinity Plan Lafayette Dam Plan Lafayette Dam Sections Figure Failure: Aerial View Figure Failure: Limits of Downstream Surface Movement Figure 3-3 Movement and Test Borings at Cross-Section on Station GEI Consultants - iii -
6 Dynamic Stability Review of Lafayette Dam East Bay Municipal Utility District 08/16/05 Figure 4-1 Figure 4-2 Figure 4-3 Figure 4-4 Regional Fault Map Geologic Structure in Lafayette Reservoir Area Recommended Response Spectra Hayward Fault Response Spectrum Comparison Figure 7-1 Boring Locations Figure 7-2 Embankment Geometry (Dam and Foundation Zoning) Figure 7-3 Slope Stability Analysis Model Figure 7-4 Critical Circles at Yield Acceleration (U/S slope) Figure 7-5 Critical Circles at Yield Acceleration (D/S slope) Figure 7-6 Assessment of Liquefiable Soils Atterberg Limit Tests Shannon & Wilson 1966 Figure 7-7 Assessment of Liquefiable Soils Atterberg Limit Tests Wahler 1976 LIST OF APPENDICES Appendix A Survey Monuments Review Appendix B Piezometric Data Review Appendix C Selected Project Photographs Appendix D - Development of Site-Dependent Response Spectra Appendix E Review of Laboratory Data Appendix F Calculation of Earthquake-Induced Deformations GEI Consultants - iv -
7 Dynamic Stability Review of Lafayette Dam East Bay Municipal Utility District 08/16/05 1. SUMMARY This report presents the results of our dynamic stability review of Lafayette Dam, Contra Costa County, CA. The dam is referred to as Dam No by the State of California, Department of Water Resources, Division of Safety of Dams (DSOD). The dam is owned and operated by the East Bay Municipal Utility District (EBMUD, or the District). The project inspection and preparation of this report were done by GEI Consultants, Inc. (GEI), under the direction of Gilles Bureau, P.E., G.E., Project Manager, Bill Rettberg, P.E., Project Director, and with assistance from Carol Buckles, P.E., G.E. We also acknowledge our Subconsultants: William Cole, R.G., C.E.G. from Cotton, Shires and Associates, Inc. (CSA), who reviewed the site geology and tectonic environment; Mark McKee, P.E. of Robert Y. Chew Geotechnical, Inc. (RYCG), who participated in the review and interpretation of previous data; and Sangeeta Lewis, P.E. of Lewis Engineering (LE), who performed the slope stability analyses. We also acknowledge the contributions of Dr. I.M. Idriss, P.E., G.E. who independently reviewed the draft of this report and provided useful comments. In the preparation of this report, GEI and project team members reviewed previous reports and other information updated since the last safety evaluations of Lafayette Dam by Shannon and Wilson (1966) and W.A. Wahler and Associates (1976); performed site and geologic inspections; defined current seismic requirements; reevaluated the liquefaction potential of the embankment and foundation soils; and performed limited new analyses to assess the stability of the embankment and estimate the potential for earthquake-induced deformations. We reviewed existing project reports describing construction and performance history, previous field exploration and laboratory testing programs, geology, engineering drawings, plans, specifications and other documents provided by the District and the DSOD. These previous data, which cover and summarize 77 years of project history and performance since the beginning of construction of Lafayette Dam, provided substantial project information. The Phase I Inspection Report (National Dam Inspection Program) prepared by the DSOD (1980) was another useful source of information. We gratefully acknowledge the assistance of District personnel in providing feedback and continuous interaction and assembling and making the extensive project data available to us. We appreciated the cooperation of Xavier Irias, Manager of Engineering Services, Atta Yiadom, Project Manager, Fred Starr, Senior Civil Engineer, and Hon Fung Chan, Assistant Engineer, who coordinated our access to the District s project files. DSOD staff, including Tina Glorioso and Chuck Wong, facilitated our review of the State s files. GEI Consultants - 1 -
8 Dynamic Stability Review of Lafayette Dam East Bay Municipal Utility District 08/16/05 No supplemental field exploration or laboratory testing was conducted as part of this review. To prepare this report, we exclusively relied on knowledge of the project acquired from existing reports, re-interpreted and updated as required, and on applicable recent literature, discussions with DSOD and EBMUD project engineering staff, and our field observations at the site Lafayette Dam Lafayette Dam was built from August 1927 to It is mostly founded on valley fill alluvium, underlain by soft sedimentary bedrock of the Tertiary Orinda Formation. A major failure of the downstream (D/S) slope occurred during construction in The failed slope was rebuilt at a flatter angle by placement of additional fill and the dam completed at a lower crest elevation than originally designed. At the time of failure, the constructed crest elevation was at about El. 476, hence 9 feet higher than the final as-built crest elevation (El. 467). Since its completion in 1933, the dam has performed satisfactorily. The reservoir is operated as a standby emergency storage and recreational facility. The dam is a rolled zoned earthfill embankment, 132 feet high, and with a crest 1,200 feet long. The upstream dam face has a slope of 3H to 1V (horizontal to vertical), with two 15- foot wide berms originally designed at El. 450 and El. 400, respectively. The downstream slope varies at 2.5H to 1V, 4.0H to 1V and 8.0H to 1V and has a 10-foot wide berm, located at El The dam crest is 210 feet wide. The dam has a central clayey core with upstream and downstream slopes, originally built at 0.5H:1V. The constructed top width of the core is about 22 feet. A cutoff trench was excavated beneath the core into the alluvium during the early phase of the dam construction. A steel sheet pile curtain and a short concrete cutoff wall (pile cap) were installed in the cutoff trench, before placement of the core materials. The reinforced concrete outlet tower, approximately 120-foot high with an annular crosssection, provides reservoir drawdown capacity. The dam does not have a channel spillway. The top rectangular port in the tower (2.5 x 3 ) is ungated and provides limited spillway discharge capacity, with a spillway crest elevation at El Reservoir control is provided by four rectangular ports in the tower wall, of same size as the spillway port and equipped with slide gates Field and Geologic Inspections Our engineers and geologist inspected the dam, reservoir slopes and surrounding area during three field visits. The dam embankment does not display significant cracks, recent horizontal or vertical displacements or shear failure, or any other visible signs of active deformations, GEI Consultants - 2 -
9 Dynamic Stability Review of Lafayette Dam East Bay Municipal Utility District 08/16/05 settlement, or instability. The upstream (U/S) slope is prominently concave, with about 4 feet of vertical downward elevation differential at crest center. Rainwater ponds near that location at the lowest point of the upper U/S berm. We did not find any drawings or data indicating that U/S slope was constructed with some concavity. If settlement caused such elevation differential, it should have occurred during or immediately after the 1928 downstream slope failure, and before the dam crest was brought to its present elevation. The crest itself, which is paved with asphalt concrete, does not show any indication of recent settlement. The downstream (D/S) slope is covered with grass but was found to be in excellent condition with no signs of cracks, settlement or seepage. We observed minor, infrequent cracks in the U/S concrete facing, along with occasional sealant deterioration or absence of sealant at a few of the slab joints. No seepage was visible along the downstream slope, which is covered with grass but was free of visible erosion or settlement. We could not get full access to the terminal portion of the outlet conduit, on the left abutment side and across Mount Diablo Boulevard, due to heavy vegetation and fencing. At the dam toe, on the right abutment side, we observed minor seepage from the drainage collection system. Numerous landslides are present along the margins of Lafayette Reservoir. Most of these landslides are old and inactive, limited in size or located high on the hillside and upslope from the reservoir, and should not affect the safety of the dam and reservoir. An older landslide, adjacent to the right (east) abutment, might partially pass under the embankment at that location and could affect the toe area of the dam, e.g. if it reactivated as a result of strong ground shaking. However, even if this landslide were to be reactivated, its impact on the overall stability of the dam should be minimal. Overall, we did not observe any visual signs of instability or inadequacy of any of the project works that would require immediate remedial action. The project appears to be in good condition, and adequately maintained. The outlet tower was not included in our review, but its ability to remain stable under severe seismic loading is under review by others. Although failure of the tower would not impact the dam, the tower is used as a spillway and the District has submitted conceptual designs to the DSOD for possible seismic upgrade of that structure (EBMUD, 2002). Lafayette Reservoir is the only terminal reservoir, among those owned by the District, which uses the outlet tower for spillway function Tectonic Setting The Lafayette site is located in the East Bay Hills, which consist of Tertiary age sedimentary and volcanic rocks. In the vicinity of the dam, these rocks are folded into parallel to subparallel, west-to-northwest-trending anticlines and synclines with limbs characterized by moderate to steep dips (30 to 65 degrees) to the northeast and southwest. The East Bay Hills have a long history of Cenozoic folding and faulting and are bounded by two well-recognized GEI Consultants - 3 -
10 Dynamic Stability Review of Lafayette Dam East Bay Municipal Utility District 08/16/05 tectonic features. The Hayward Fault is located 8.8 km to the southwest, and the Calaveras Fault is 9.8 km to the southeast. Although more distant (39 km), the San Andreas Fault is also significant to the seismic setting of Lafayette Dam, because it is capable of locally generating moderate to strong shaking with long duration (60 seconds or more). These three major active faults and other smaller related faults form a complex tectonic environment. Additional information is provided below regarding the faults most critical to the dam. The Hayward Fault (about 87 km long) and its northern portion, which is the closest to the dam site, represent a relatively well-defined tectonic feature. It has an average slip rate of 9 mm/year. Segmentation of the fault, which has been considered in some studies, no longer seems clearly defined, based on the results of current research. Based on the lack of indisputable evidence for segmentation, we have assigned a Moment Magnitude of 7.25 (Mw) to the Hayward Fault. The Calaveras Fault (nearly 120 km long) is a major active feature that has been subdivided into three segments, based on geologic, geomorphic and seismic data. The northern segment, about 42 km long, is the closest to the Lafayette site, but has been less active (average slip rate 6 mm/year) than the central and southern segments (average slip rate 15 mm/year). Geologists generally agree that segmentation of that fault and the different rates of slip along the three segments justify consideration of shorter lengths of rupture for upper-bound magnitude estimation purposes, although the possibility of rupture propagating from one segment to the other cannot be completely ruled out. Based on assumed segmentation, we have assigned a Moment Magnitude (Mw) of 7.0 to the Calaveras Fault in this study. The northern segment of the San Andreas Fault (474 km long) is the dominant regional tectonic structure accommodating right-lateral, translational motion and represents the boundary between the North American and Pacific plates. It has been the most seismically active of the faults present in the Bay Area and has the highest rate of slip, between 17 and 24 mm/year for its segment the closest to Lafayette Dam. Lafayette Dam is approximately 39 km away from the northern portion of the San Andreas Fault. Earthquake magnitude estimates range from Mw 7.1 for individual segments up to M w 7.9 for the entire northern San Andreas Fault. Despite its distance, it represents a significant earthquake hazard for Lafayette as being potentially associated with large magnitudes and long durations of shaking. We used M w 7.9 in this study. Other smaller faults, such as the Lafayette-Reliez Valley (LRV), at a distance of 3.0 km, Franklin (6.4 km), Miller Creek ( km) and Concord (12.8 km) could generate significant motion at the site, although of shorter duration than upper-bound magnitude events along the Hayward or Calaveras faults. These faults are all less than 20 km long. Based on recent studies, the Lafayette-Reliez Valley and Franklin faults, as well as folds and thrusts in the vicinity of the Lafayette site, seem related to a transfer to the west, toward the Hayward Fault, of tectonic stresses associated with the northern extremity of the Calaveras GEI Consultants - 4 -
11 Dynamic Stability Review of Lafayette Dam East Bay Municipal Utility District 08/16/05 Fault. We assigned upper bounds of magnitude of 6.5 (Mw) to all four of these smaller faults. Because of its short distance, the LRV Fault could potentially be associated with stronger shaking at the site than either the Hayward or Calaveras faults, but of considerably shorter duration. USGS geologists (Graymer, et al., 1994) have suggested that a previously unrecognized inferred fault might pass under the dam, parallel to the crest. Insufficient information is available to confirm or reject such assertion. If such inferred fault were present, it would likely not be active, because the orientation of its strike is not consistent with the trend of other well-recognized tectonic features. In the absence of more specific information, the presence of such inferred fault appears questionable. Even if it were present, we concluded that it would represent an insignificant hazard to the dam as a potential seismic source, or in terms of secondary (sympathetic) movement potentially triggered by a major rupture of any of the major faults identified in the greater site area, because of its short length and favorable orientation with respect to the dam axis. Lastly, several poorly understood lineaments, the Russell Peak lineament, 2 km north of the dam, and another lineament, 1.5 km west of the reservoir, have been recognized since 2002 and could represent potentially active or capable tectonic features. These lineaments are not strongly pronounced, but their origin is not clearly explained. Based on the data reviewed to date, we cannot eliminate the hypothesis that these lineaments could be fault-related. Such lineaments should have negligible impact on Lafayette Dam Updated Seismic Criteria Lafayette Dam is a high risk facility located near faults with a high (1 to 9 mm/yr) or very high slip rate (greater than 9 mm/yr). The high risk classification assigned to this dam in the National Inventory of Dams (NID) reflects its potential for extreme human and economic consequences in case of failure, due to heavy downstream development. Based on such considerations, we updated the applicable seismic requirements based on deterministic concepts and 84th percentile criteria, as is required by the DSOD for the corresponding combination of hazard and consequences. To quantify potential ground motion at the site, we used three sets of ground motion attenuation equations, previously accepted and used by the DSOD in recent dam studies, and developed horizontal and vertical response spectra representing the maximum level of shaking that could be potentially generated at the site by each of the active faults near or in the project s greater vicinity. The influence of the local site conditions, the foundation alluvium and the soil-like characteristics of the local bedrock (Orinda Formation) were taken into consideration in developing the ground motions. GEI Consultants - 5 -
12 Dynamic Stability Review of Lafayette Dam East Bay Municipal Utility District 08/16/05 Because the site is located within less than 10 kilometers of the northwestern portions of the Hayward and Calaveras faults, near-field and directivity effects could potentially affect local ground motions characteristics. As a significant portion of the rupture along these faults could propagate toward Lafayette Dam, under conceivable earthquake scenarios, this could increase spectral accelerations at periods greater than 0.6 sec and simultaneously reduce the overall duration of shaking at that particular location. Such effects could also affect ground motion emanating from either the San Andreas or the LRF faults. Directivity and near-field effects have been included in the development of our updated seismic criteria. Our ground motion estimates were expressed as horizontal and vertical peak ground accelerations (PGA) and sorted by decreasing Earthquake Severity Index (ESI). The ESI is related to both the horizontal PGA and, through the magnitude, to the expected duration of shaking (Bureau, et al., 1985). It quantifies the potential for earthquake-induced dam deformations better than the PGA. The fault most critical to Lafayette Dam is the Hayward Fault, with an estimated horizontal PGA of 0.60g and an ESI of Next come the San Andreas and Calaveras faults with ESIs of and 8.11, respectively. Computed PGAs for the MCE s assigned to these faults are 0.52g (Calaveras) and 0.27g (San Andreas). Hence, despite its significantly lower PGA, the San Andreas Fault represents an appreciable level of risk for Lafayette Dam. The LRV Fault could generate the largest horizontal accelerations (0.76g) because of its proximity (3 km), but would be associated with significantly shorter durations of shaking. The ESI of the LRV Fault is It should be noted that three of these faults could generate significant vertical accelerations at the site, because of their short distances. Hence, for possible future seismic evaluation purposes, we have updated both the horizontal and vertical spectra applicable to the Lafayette site. We compared our recommended response spectra with the response spectra of the acceleration time histories used in 1976 by W.A. Wahler & Associates to represent the Hayward ( Earthquake A ) and San Andreas ( Earthquake B ) earthquake scenarios. We believe that the spectral accelerations of Earthquake A were insufficiently conservative, by a factor of between 2 and 3, at the periods of significance to the response of Lafayette Dam. Earthquake B was sufficiently conservative Liquefaction Potential The liquefaction potential of the various dam zones and of the foundation was reviewed. No loose saturated silts or sands, generally acknowledged the most susceptible to liquefaction, have been encountered in the borings. The embankment materials are classified as clays, sandy clay, or silty clay. CL and CH are the dominant soil classifications in the dam and foundation materials, with ML occasionally encountered. The average plasticity index (PI) GEI Consultants - 6 -
13 Dynamic Stability Review of Lafayette Dam East Bay Municipal Utility District 08/16/05 and liquid limits (LL) of most of the core, shell and foundation materials fall outside the liquefiable or potentially liquefiable zones, based on a recent interim soil types classification using Atterberg limits (Seed, R.B., et al., 2003). The few data points that fall within the potentially liquefiable zone fail a supplementary test that would indicate liquefaction susceptibility and, therefore, do not represent any particular concern. While the dam and foundation materials are classified as non-liquefiable based on their clay content and Atterberg limits, they might be susceptible to straining due to the large cyclic stress ratios that would be induced under the most demanding earthquake scenarios. While not liquefiable in the classic term as clean loose sands or silts would be, the dam and foundation materials could be sensitive to progressive loss of strength with remolding or monotonic accumulation of shear deformations under the most severe earthquake loading Previous Analyses Most previous analyses found the Lafayette embankment to have adequate static and seismic stability, with factors of safety generally complying with evaluation procedures, formulations and criteria applicable at the time when such analyses were performed. The embankment was concluded to meet stability guidelines for static normal operating, rapid drawdown and seismic loading conditions, except in early slope stability studies (Dukleth, 1956). In such studies, the dam was concluded to be unsafe for rapid drawdown condition, should the reservoir level be raised 8 feet from its current operating level (El. 448), and for earthquake condition (pseudo-static, 0.10g) with a reservoir level at only El The 1956 studies were based, however, on very conservative (i.e. low) strength parameters. Subsequent static or pseudo-static (0.10g) analyses by Shannon & Wilson (1966) demonstrated acceptable performance. These early definitions of the seismic requirements are insufficiently conservative by current standards. W.A. Wahler & Associates (Wahler) performed equivalent-linear (EQL) dynamic response finite element analyses in The San Andreas event was found the most critical of the three Maximum Probable earthquake scenarios considered (Hayward, Calaveras or San Andreas). We concluded that the methodology and dam and foundation modeling assumptions used in these analyses raise some questions regarding prediction of the dam response, due to the potentially insufficient resolution of the finite element grid (mesh too coarse), the use of now obsolete equivalent-linear properties, and because of recently recognized limitations of the analysis and interpretation procedures then implemented (e.g. inability to rigorously address the problem of large, non-recoverable soil deformations). Furthermore, the Hayward response spectrum used in 1976 is significantly below the presently recommended response spectra at the periods of interest to Lafayette Dam response. While the 1976 analyses represented the state-of-the-art at the time when performed, it appears from our review that no sufficiently reliable and detailed dynamic response analyses of Lafayette Dam are available, especially for the Hayward event. This GEI Consultants - 7 -
14 Dynamic Stability Review of Lafayette Dam East Bay Municipal Utility District 08/16/05 needs to be considered in relationship with the eventful construction history of the dam and its classification as a high risk facility. The most recent slope stability and simplified deformation analyses by the California Department of Water Resources, Division of Safety of Dams (DSOD, 2003), using the material properties established in 1966 by Shannon and Wilson and updated seismic criteria, concluded that the dam should have adequate seismic stability and reserve freeboard. However, because the reservoir is located within a heavily urbanized area and in proximity to the Hayward Fault, the DSOD suggested that the District perform its own review of the dam, which is the subject of this report Updated Simplified Analyses For our static and pseudo-static slope stability analysis of Lafayette Dam, we reviewed the material properties previously used, and updated the dam section geometry and analysis properties. We estimated strength properties from considerations such as the location of the samples tested and the conditions of confinement that prevail in the field. We used the consolidated-undrained triaxial tests (TXCU) results as the primary basis to define strength properties. We then performed slope stability analyses and implemented simplified deformation analysis procedures to evaluate the performance of Lafayette Dam and compare it with the previous static and dynamic analyses. We performed static and pseudo-static stability analyses of the upstream and downstream slopes of Lafayette Dam using the computer program XSTABL. We successively considered two methods of analysis (Janbu and Spencer). Our analysis model is generally similar to those previously used, except for the foundation alluvium, which we represented with two zones. The alluvium below the core and upstream shell seems stronger than the alluvium below the downstream shell, which was affected by the 1928 failure. For steady-state seepage static condition and a reservoir elevation at El. 449, the lowest factor of safety we calculated is 2.3 for the downstream slope, and 2.5 for the upstream slope. These values confirm the satisfactory performance of the embankment to-date. For the partial rapid drawdown condition (repeat of the maximum historic reservoir drawdown to El. 431), we calculated a minimum factor of safety of 2.0. We also postulated a rapid complete drawdown to the elevation of the lowest outlet port, and obtained a minimum factor of safety of 1.7. We performed pseudo-static analyses to calculate the yield accelerations under simulated seismic loading condition. We found the yield acceleration of the downstream slope (0.14g) to be substantially lower than that of the upstream slope (0.29g). The downstream yield acceleration is slightly lower than obtained in previous investigations. This is because we used total-stress strength parameters for the pseudo-static analysis and took into account the GEI Consultants - 8 -
15 Dynamic Stability Review of Lafayette Dam East Bay Municipal Utility District 08/16/05 results of static consolidated-undrained (CU) triaxial compression test data by W.A. Wahler and Associates (1976). The potential critical failure surface identified would involve the entire downstream shell and extend deep within the foundation alluvium. The soil volume bounded by this failure surface presents similarities with the soil mass involved in the 1928 failure. Next, we estimated potential permanent earthquake-induced deformations using seven simplified or empirical methods. Such methods only make approximate prediction of the dam performance. They are useful as a screening technique, however, to assess whether a dam is safe by an appreciable margin, needs more rigorous investigations, or is potentially unsafe. We obtained deformations estimates for the upstream or downstream slopes, or for the dam as a whole, depending on what procedure was implemented. As expected, different methods provide different estimates, which must be pondered by recognizing the limitations of each simplified procedure implemented. We obtained best estimates by averaging crest settlements obtained with the upstream or downstream yield accelerations and the various procedures implemented. Our seismic settlement estimates for the dam crest range from 0.9 to 4.5 feet for the Hayward Earthquake, which is the most critical event considered. An average settlement of 2.7 feet is our preferred prediction. We have chosen the term preferred to indicate that we have simultaneously considered several methods and analysis assumptions to compute deformations or settlements. Such methods involve simplified procedures, which all have limitations on how they can be applied to specific seismic, embankment and foundation conditions. Important factors, such as the presence of the alluvium and how the seismic loading would be truly applied, are only approximately or not taken into account in some of these procedures. The use of a preferred settlement estimate reduces the potential margin of error that would be associated with only considering the lowest or the largest estimated dam movements. Computed crest settlements for the Calaveras, San Andreas or Lafayette- Reliez Valley earthquakes were found to be less than for the Hayward Earthquake. In all of the simplified analysis procedures implemented, directly or indirectly computed maximum settlements are less than the available freeboard (17.8 ft). Our estimated average maximum crest settlement (2.7 feet) would leave over 15 feet of residual freeboard, which is a considerable margin of safety. Alternatively, if an upper-bound settlement of 4.5 feet were to occur, this would still leave 13.3 feet of residual freeboard. Hence, based on these procedures, Lafayette Dam will likely safely impound the reservoir under earthquake loads similar to or less than postulated. However, because of the history of the dam, we believe that simplified analysis procedures, which are often conservative when a large margin of safety is available, may not be sufficient to demonstrate that large non-recoverable deformations could not occur under the worst conceivable earthquake scenarios and, especially, considering that the embankment fill and foundation materials that failed during construction were never removed. A 210-feet wide crest, as is present, improves the safety GEI Consultants - 9 -
16 Dynamic Stability Review of Lafayette Dam East Bay Municipal Utility District 08/16/05 of Lafayette Dam. However, because of the uncertain extent of potentially weaker foundation materials, the wide crest may not necessarily guarantee that slope movements would be limited to the vicinity of the dam slopes. Earthquake-induced movements could potentially involve a large volume of soils. The 1928 failure caused large crest settlements (16 to 24 feet) over the entire width (about 160 feet) of the construction crest of the unfinished dam. The present crest (210-feet wide) is only about 30 percent wider than was the top of the unfinished embankment that experienced failure in Although the load conditions would be different from the previous failure, it is conceivable, although unlikely, that the existing dam crest could settle and the embankment and foundation alluvium experience large deformations, in a pattern similar to 1928, if the site were to experience extreme seismic shaking. Finally, we compared estimated field cyclic stress ratios (CSR) for an equivalent reference magnitude (M 7.5), based on H.B. Seed s simplified method as updated by Idriss (1999), with laboratory cyclic stress ratios causing 10 percent axial strain in 15 uniform stress cycles. In the case of the Hayward Earthquake (M w 7.25), many equivalent field CSRs equal or exceed the laboratory CSRs causing 10 percent axial strain or greater, after correction for field condition, for the applicable number of cycles. Such comparison suggests that simplified procedures may not be sufficient to fully assess the seismic performance of Lafayette Dam. Earthquake-induced deformations larger that those computed might occur, under some of the severe earthquake scenarios postulated, and may need to be further evaluated. This suggestion is based on our review of the 1928 failure, rather than on the computed deformations, which would likely be acceptable considering the large freeboard available, had Lafayette Dam not experienced an extensive historic slope failure Operation, Maintenance and Monitoring Data Operation and maintenance of Lafayette Dam are considered adequate. Instrumentation includes 24 crest monuments that were installed in grid pattern on the embankment, and are monitored about every year, occasionally twice a year. In the last fifteen years, maximum measured horizontal and vertical displacements have been less than 3.5 inches. Time versus displacements graphs for individual monuments show stable movements, with no significant increases or adverse trends in recent years. The dam is equipped with 18 active open-standpipe piezometers, monitored about once a month. Most piezometers were installed in 1965 or in as part of safety investigations of the embankment. They replaced original observation wells installed during and shortly after the dam construction. The wells and some piezometers have frequently indicated erratic water levels, higher than expected based on reservoir surface elevations, or have shown fluctuations indicative of questionable functioning. Especially, seven of the eight crest piezometers consistently indicated water levels higher than the reservoir level. Five were replaced in 1992, and another in GEI Consultants
17 Dynamic Stability Review of Lafayette Dam East Bay Municipal Utility District 08/16/05 In recent years, nine piezometers still indicate seasonal water levels higher than expected from the corresponding reservoir levels. The others indicate no unusual trends or fluctuations. It has been suspected that surface water runoff from the wide dam crest after high rainfall and seepage or runoff from the abutments affect piezometric readings. Overall, for a dam built with an impervious core, the phreatic surface is unusually high in the downstream shell of Lafayette Dam. This dam behaves as a homogeneous dam regarding the position of the phreatic surface. This has not been a problem, because the embankment is very wide and the seepage is collected in drains. The similar permeability characteristics of the core and shell materials or perhaps seepage from the abutments may contribute to such observation. Seepage through the dam is collected by tunnel and embankment subdrains. A 24-inch conduit, which was installed in a 60-inch diameter concrete conduit, runs along the left abutment of the dam. Outlet tunnel leakage is collected in a sump box, located near the west end of the toe of the dam. Seepage through the dam is collected by a pipe subdrain system, which runs perpendicular to the dam axis and along the toe of the dam. Seepage collected in the pipes is evacuated through a seepage collection box, located near the right abutment at the toe of the dam. Seepage is regularly monitored by the District and by the DSOD at approximately bi-yearly inspections. Our review of these inspection reports and correlations established over a 10-year period indicate that tunnel and subdrains flows are typically very low, ranging from near zero to about 10 gpm for the toe drain, and from less than 1 gpm to 5 gpm for the tunnel flows Conclusions and Recommendations The purpose of this investigation was to perform a detailed review and update of the seismic stability of Lafayette Dam. We carefully reviewed existing data made available to the project team and updated the seismic requirements. Our conclusions and recommendations rely solely on a reinterpretation of such information, on a review of applicable literature, on visual inspection of the dam and site, and on simplified slope stability and dam deformation analyses. The watershed area is very small (1.34 square miles). The dam crest and surrounding grounds are used as a regional park, and day use of the facilities is extensive. The reservoir is presently used for emergency backup water supply and recreation, and is only subject to minor annual fluctuations. A substantial freeboard (17.8 feet) is maintained under normal operating conditions. As previously mentioned, the dam experienced in 1928 a major downstream slope failure during construction, and was built to a lower crest elevation than originally designed. The GEI Consultants
18 Dynamic Stability Review of Lafayette Dam East Bay Municipal Utility District 08/16/05 downstream slope was flattened by placement of additional fill, but the failed central section of the dam was left in place. The top of the failed embankment was kept near its incomplete height and graded to form the present crest. The dam has satisfactorily performed since construction ended in A detailed seismic evaluation of this dam was performed in 1976, using procedures then applicable, and concluded that it would be safe under the postulated earthquake scenarios. We found no visual signs of deterioration, instability or inadequacy of the embankment. Seepage is low, consistent with the norms for the dam and the reservoir level, and is not detrimental to the safety of the dam. The instrumentation is regularly monitored. The phreatic surface within the embankment is high and indicates that Lafayette Dam performs similar to a homogeneous embankment rather than as a zoned dam with an impervious core. This is probably because there are little differences between the physical characteristics of the core and shell materials, which all came from nearby borrow sources. The clayey nature of the embankment and foundation materials and other physical properties, such as liquid limit, plasticity index and water content, indicate that they are unlikely to liquefy and experience instantaneous loss of strength as a result of earthquake loading. Lafayette Dam is well maintained, in good visual condition, and the District should be commended for the obvious care it has given to this facility over the years. The very wide crest (210-feet) and the large freeboard significantly contribute to improving the safety of this dam. Considering the high risk rating of Lafayette Dam and its seismic exposure to the Hayward and other regional faults, we have found no condition that would require immediate action. However, based on our review and the simplified analyses performed, we recommend that the District consider implementing several action items to confirm the predicted seismic performance of this dam. Lafayette Dam is sited within a complex geologic environment, and numerous old landslides surround the reservoir. The dam was built on a thick layer of alluvium, up to 100 feet deep, and averaging 90 feet in its central portion. The dam itself was well constructed but, according to the post-failure investigation (Consulting Board,1929), the foundation alluvium was the primary cause of failure during construction, in response to loads applied by perhaps too rapid placement of the embankment materials. The 1928 failure was massive, and involved a considerable volume that included part of the core and downstream shell, as well as the underlying foundation alluvium over most of its 90-feet thickness. The failed materials were not removed, were not strengthened through compaction, consolidation grouting or other soil improvement techniques, and construction was completed by simply leveling the dam crest, backfilling failure cracks and flattening the downstream slope by placement of additional fill. GEI Consultants
19 Dynamic Stability Review of Lafayette Dam East Bay Municipal Utility District 08/16/05 The upstream slope and impervious core, which experienced a substantial spread in crosssectional shape (about 24 percent spread of its designed base width) during the failure, were left as originally built despite the significant movements and probable disturbances they experienced. The central portion of the upstream slope settled by about four feet in the years that immediately followed the end of construction. The failed materials have stabilized, and undoubtedly consolidated and regained strength over time. Under static loading, possible reactivation of movement along the 1928 failure surface, which was not clearly identified in the borings drilled in the 1966 and 1976 investigations, is unlikely. The affected materials should have had ample time to stabilize in the 76 years since the failure occurred and most of the old failure surface has probably regained strength. Horizontal and vertical crest or slope movements have been insignificant for many years, and are continuously monitored. Yet, it is not clear whether the foundation alluvium has regained sufficient additional strength to withstand major earthquake loads. The foundation soils that failed in 1928 under rapidly applied construction loads experienced very large movements, and have neither been removed nor improved following the failure. This leaves open the question whether the presence of the previous failure surface might affect potential deformations of the foundation soils and embankment under rapidly applied, major seismic loads. Recent geologic literature mentions discontinuous lineaments and possible inferred faulting in the immediate project vicinity. Such features do not seem to represent any threat to the dam. The inferred faults are short, and the one that has been shown to potentially intersect the dam footprint is parallel, rather than perpendicular to the dam crest. Hence, if confirmed, it would unlikely be critical in terms of direct or sympathetic relative movements, because of its short length and favorable orientation. Additional field investigation of the inferred fault is not required because, should it be confirmed, it is not a seismogenic structure and sympathetic rupture would be very small and of no consequence to Lafayette Dam. Many old landslides along the reservoir rim are in a low slope position and presently inactive. One of these, however, is adjacent to the east margin of the dam and might impact the lower portion of the embankment if it were to be reactivated as a result of strong ground shaking. Evaluation would be desirable if any signs of reactivation are observed in future inspections. Such evaluation would include preparation of improved geologic maps and cross sections of this landslide to establish probable volume, dimensions and possible directions of any movements. Existing field penetration data and laboratory test results in the alluvium below the downstream slope of Lafayette Dam indicate that these materials are the weakest. The information available is limited because of the wide spacing of the upper and lower downstream berms, which controlled the locations of the previous borings. As was the case in 1928, such materials may control the overall stability of Lafayette Dam. Further field and laboratory testing in that area could be considered, including field exploration methods that would facilitate recognition of any thin and potentially weaker zones such as the old failure GEI Consultants
20 Dynamic Stability Review of Lafayette Dam East Bay Municipal Utility District 08/16/05 surface. Cone penetration testing (CPT) and in-situ shear vane testing, combined with reference SPT testing, could be a rapidly implemented and cost-effective way to perform such investigations. The response spectra developed for the Hayward and Lafayette-Reliez Valley faults, which are potentially the most critical to this site, are significantly more demanding in the range of periods of interest to the response of Lafayette Dam and foundation than the response spectrum of the acceleration time history used in 1976 to represent a maximum probable Hayward Earthquake. We suspect that the equivalent-linear dynamic analyses that were then performed did not fully capture the anticipated response of Lafayette Dam, due to the coarseness of the finite element mesh used to represent the dam and its foundation. Our best estimates of potential earthquake-induced deformations, for the most critical earthquake scenarios, suggest maximum average crest settlements on the order of 2 to 3 feet. Hence, Lafayette Dam is likely to maintain a large freeboard (greater than 15 feet). However, based on the yield acceleration (0.14g) computed for the most critical of the hypothetical failure surfaces considered, which would involve both the downstream shell of the dam and the underlying foundation alluvium, simplified methods of analysis predict a wide range of deformations. Three of these methods lead to estimated upper bound crest settlements (due to combined embankment slope and foundation deformations) that range between 4 and 7 feet. The simplified Newmark and Seed-Makdisi procedures lead to upper bound combined slope deformations on the order of 8 to 13 ft for the downstream slope side of the dam and underlying foundation. Furthermore, simplified methods of analysis are not always conservative. More detailed exploration and testing are desirable, primarily in the portion of the foundation alluvium, below the downstream slope of the dam, which has not been explored in the course of past safety evaluations. If strength properties higher than assumed were established for that portion of the foundation alluvium, no further analysis would be required. However, if strength properties lower than those assumed were to be encountered, and because of the history of Lafayette Dam, we would suggest that EBMUD consider a detailed reanalysis, using updated material properties, modern computational techniques, updated acceleration time histories consistent with the recommended response spectra, and constitutive relationships that would simulate the behavior of the embankment and foundation materials more reliably than was possible in 1966 or In conclusion, Lafayette Dam is a well-maintained facility, and is reasonably safe for the MCE. However, because of the dam s failure during construction, the District should supplement the existing information regarding the downstream foundation alluvium. GEI Consultants
21 Dynamic Stability Review of Lafayette Dam East Bay Municipal Utility District 08/16/05 2. DESCRIPTION OF PROJECT FEATURES 2.1 General The following description of the project facilities is excerpted from the previous reports (Shannon & Wilson, 1966; W.A. Wahler & Associates, 1996; DSOD, 1980) with relevant updates to reflect our observations from the current field inspection and data review. Lafayette Dam is owned by the East Bay Municipal Utility District (the District, or EBMUD) and is located about 1.6 km west of the center of the City of Lafayette, in Contra Costa County, CA. A map of the vicinity is presented on Figure 2-1. The dam was built across Lafayette Creek, a small tributary of Las Trampas (Walnut) Creek that flows in a northerly direction. The watershed has a very small drainage area, 1.34 square miles, and lies within the boundaries of the East Bay Regional Park System. The dam can be accessed at all times, and its crest is paved and actually used as a parking lot for visitors to the park. Unless otherwise stated, all elevations in this report are in feet and refer to United States Geological Survey (USGS) Mean Sea Level Datum (1929), which is referred to in some project-related documents as National Geodetic Vertical Datum (NGVD-29). Based on DSOD and National Inventory of Dams (NID) classification guidelines, Lafayette Dam is classified as a large (higher than 100 ft) and has a high hazard potential, because of its closeness to the City of Lafayette and densely developed areas. There have been numerous recent commercial and residential developments downstream, which confirm the hazard classification of the dam. 2.2 Embankment Dam Lafayette Dam was built from August 1927 to 1933 and was raised one foot in 1967 during regrading of its crest. Plans and sections of the major project appurtenances are presented on Figures 2-2 and 2-3. The dam is a rolled zoned earthfill embankment, 132 feet high, and with a crest 1,200 feet long. The crest of the dam is at El The upstream dam face has a slope of 3H to 1V (horizontal to vertical), with two 15-foot wide berms originally designed at El. 450 and El. 400, respectively. The upstream face berms experienced up to about 1.5 feet of upward (lower berm) or downward (top berm) movement during the construction failure in 1928 (see Section 3.1.2). The upper berm settlement is visible on photographs (see Appendix C), and appears to have increased since the end of construction. The downstream GEI Consultants
22 Dynamic Stability Review of Lafayette Dam East Bay Municipal Utility District 08/16/05 slope varies at 2.5H to 1V, 4.0H to 1V and 8.0H to 1V and has a 10-foot wide berm, located at El The dam crest is 210 feet wide. Most of the dam is founded on valley fill alluvium, underlain by soft sedimentary bedrock of the Tertiary Orinda Formation. The dam has a central impervious clayey core with upstream and downstream slopes, originally built at 0.5H:1V. The core slopes were also affected by the 1928 failure, see Section The constructed top width of the core is about 22 feet. A cutoff trench was excavated into the alluvium during the early phase of the dam construction. A steel sheet pile curtain and a short concrete cutoff wall (pile cap) were installed in the cutoff trench, before placement of the core materials. Principal project data regarding Lafayette Dam were obtained from the National Inventory of Dams (NID) and the Division of Safety of Dams (DSOD). The most important of these data are summarized in Table Spillway and Outlet Works The dam does not have a channel spillway, although adding one was considered in 1956 (Dukleth, 1956). A reinforced concrete outlet tower, approximately 120-foot high, with an annular cross-section, provides reservoir drawdown capacity. The top platform of the tower is at El. 500, and the tower is free-standing from about El The interior space of the outlet tower is separated into a spillway chamber portion and an outlet chamber portion through inner reinforced concrete partition walls. The top rectangular port in the tower (2.5 x 3 ) is ungated and provides limited discharge capacity, with a spillway crest elevation at El Spillway flow exits the tower through a 60-inch diameter conduit located at the base of the structure. This conduit has a total length of 1,845 feet and terminates in a baffle box. Reservoir control is provided by four rectangular ports in the tower wall, of same size as the spillway port (see Table 1) and equipped with slide gates. The outlet portion of the tower is connected to a 60-inch diameter conduit, which extends downstream of the dam toe. From thereon, outlet discharge is conveying through as 24-inch diameter steel pipe located a 60- inch diameter concrete conduit. The capacity of the spillway is very small and was shown capable of barely passing the Probable Maximum Flood in earlier studies. According to the EBMUD Dam Guide for Lafayette Dam, the District plans to modify the spillway to increase its capacity in the future. International Civil Engineering Consultants, Inc. evaluated the structural performance of the Lafayette outlet tower (ICEC, 1995). The structure was found to have insufficient seismic capacity, and six conceptual upgrade alternatives were proposed. In a letter dated August 2002, the District submitted to the DSOD documents and sketches describing its preferred upgrade alternative, which would consist of infilling the tower with mass concrete between GEI Consultants
23 Dynamic Stability Review of Lafayette Dam East Bay Municipal Utility District 08/16/05 El. 379 and El. 432 (except for space used for three new 24-inch diameter spillway and outlet conduits). 2.4 Standard Operational Procedures Lafayette Reservoir is normally operated as a standby emergency storage and recreation reservoir and is maintained near its maximum operating level (El. 449). Personnel supervising the operations of the East Bay Regional Park System (EBRPS) are continuously present at the park headquarters during the day. District operation and maintenance engineers and patrolmen frequently inspect the dam, with quarterly inspections by a District Supervisor. Unscheduled inspections are performed on an as-needed basis, e.g., after any felt earthquakes in the vicinity. The DSOD has semi-annual scheduled inspections of the project, with inspections of the dam and spillway tower performed at regular intervals. Because the surrounding watershed area is small, the potential for reservoir siltation and filling by debris or sediments is low. There are no minimum downstream flow requirements for Lafayette Reservoir, as it is filled with water imported from the Mokelumne Aqueduct. 2.5 Instrumentation Instrumentation includes 24 crest monuments that were installed in grid pattern on the Lafayette embankment, and are monitored about every year, occasionally twice a year. From 1989 to present, maximum horizontal and vertical displacements recorded from all the monuments have been 3.36 inches and 3.12 inches, respectively. Review of the time versus displacements graphs for individual survey monuments show that slope horizontal and vertical movements are stable with no significant increase in recent years. Additional details are provided in Appendix A, Instrumentation Review. Originally installed observation wells and several older piezometers have been replaced by eighteen currently active standpipe piezometers, which are regularly monitored about once every month. Other instrumentation includes instruments to monitor flows from the outlet conduits and seepage from the embankment toe drain. The District annually provides to the DSOD plots of horizontal and vertical movements, measured at the crest monuments, and piezometric records. We reviewed such data as part of this investigation. Seepage is collected by tunnel and embankment subdrains. A 24-inch conduit, installed in a 60-inch diameter concrete conduit, runs along the left abutment of the dam. Tunnel leakage is collected in a sump box, located near the west end of the toe of the dam. Seepage through the dam is collected by a subdrain system, composed of 6-inch and 8-inch pipes, which run perpendicular to the dam axis and along the toe of the dam. Seepage collected in the pipes is evacuated through a seepage collection box, located at the dam toe near the right abutment. GEI Consultants
24

25
26
27
28
29 Dynamic Stability Review of Lafayette Dam East Bay Municipal Utility District 08/16/05 3. SUMMARY OF CONSTRUCTION HISTORY AND OPERATION The following summary of the construction history and operation of the Lafayette Dam is excerpted from the previous reports with relevant updates to reflect our observations from the current field inspection and data review. 3.1 Design and Construction History Original Design and Initial Construction Lafayette Dam was originally designed as a 140-foot high dam, with a 32 feet wide and 1,400 feet long crest at El Dam zoning consisted of a central impervious clay core (referred as Zone 1 in this report), a porous downstream shell (Zone 2) and an upstream shell to be built of selected impervious materials (Zone 3). The upstream slope was designed at 3H:1V, with two 15-foot berms at El. 400 and El. 450, respectively. The downstream slope had one berm at El. 430 and a slope of 2.5H:1V above the berm, and 3H:1V below. According to original construction drawings, the clay core was originally designed with upstream and downstream slopes of 0.5H:1V. Construction of the dam started in August Dam construction started in August 1927 with the stripping of the creak banks (placed at the dam toe) and excavation of the cutoff trench. The trench was excavated a maximum of 20 feet in the channel section. The materials to build the embankment were obtained from the basin and side hills upstream of the dam and rolled in 12-inch lifts (less clayey materials) or 8-inch lifts (more clayey materials). Although Lafayette Dam was designed as a zoned dam, all construction materials were clayey in character (Consulting Board, 1929). The Zone 1 core materials were reported to contain about 70 percent clay and were obtained from borrow pits in the reservoir area. The core is largely composed of clays from the foundation alluvium. The Zone 2 (D/S) materials were select fill from the Orinda Formation, described as the most granular but with an average of about 20 percent clays. The Zone 3 (U/S) materials contain about 45 percent clay and 20 percent passing the No. 14 sieve, and are practically watertight. The dam was built over 50 to 90 feet of alluvium, consisting mostly of clays, overlying the Orinda Formation. The upper 10 to 15 feet of the alluvium were describes as dry and firm, while deeper alluvium was moist and more or less plastic. GEI Consultants
30 Dynamic Stability Review of Lafayette Dam East Bay Municipal Utility District 08/16/05 Original design included a curtain of steel sheet piling, driven into the core trench before placement of the core materials, and capped by a concrete cutoff wall. Based on a drawing prepared by U.S. steel, the pile curtain in the central portion of the dam (between Stations and 12+75) was mostly constructed of 45-foot long piles (M-105 or equivalent), with a few 60-foot long piles at about Station The length of the piles was irregular and progressively shorter toward the abutments, between Stations 9+50 and at the left abutment, and between Stations and at the right abutment. The concrete core wall is shown on existing drawings to be 12-foot high, 4-foot wide at the base, and 2-foot wide at the top in the central portion of the dam (e.g. Station 12+00), but was 16-foot high near the abutments, where no piles were driven (e.g. Station 9+00). Tile and gravel foundation drainage was also provided at construction to a depth of about 5 feet in the downstream part of the foundation. A concrete facing was also placed along the entire upstream face The 1928 Construction Failure On September 17, 1928, the crest had reached between El. 476 to El. 478, based on available data (or a dam height of between 116 feet and 118 feet at centerline). This was about 22 feet below the intended final height. The reservoir was at El. 392 on that day. Longitudinal cracking was first observed along the crest, accompanied by bulging of the ground surface at the downstream toe. Additional cracks occurred in the following days, followed by progressive failure of the downstream slope. Figure 3-1 shows an aerial view of the dam taken shortly after the failure. Figure 3-2 shows the outline of the failed zone and surface movements on a proposed reconstruction plan for the failed dam. The failed portion of the embankment reached a stable position on September 28, Hence, slope failure movements lasted about eleven days. Based on cross-sections of the failed dam prepared after the failure, see Figure 3-3, the top of the dam had dropped a maximum of 24 to 26 feet in its central portion (up to 22 percent of the constructed height), and across a width of about 525 feet. The area affected by this movement was about 8 acres (340,000 ft 2 ). Maximum settlement of the downstream edge of the constructed crest was about 20 feet. The top of the upstream shell, in-between the core material and the upstream edge of the crest, settled about 10 feet and experienced severe cracking. The lower portion of the downstream slope moved about 40 feet in the horizontal direction, while the upstream toe moved outward about 5 feet. A bulge or ridge of squeezed foundation soils, about 20-foot high and up to 80-foot wide perpendicularly to the dam crest, formed along the edge of the displaced downstream toe. Although the upstream slope was considerably less affected than the downstream slope, it experienced curving of its berms at El. 450 and El. 400 with maximum horizontal displacements of about 3.8 feet and 5.5 feet, respectively. No bulge was observed at the upstream toe. The upper berm was reported to have experienced a maximum of 1.5 feet of downward movement, while the lower berm experienced upward movement, with a maximum vertical displacement of 1.5 feet. Some of the concrete slabs were GEI Consultants
31 Dynamic Stability Review of Lafayette Dam East Bay Municipal Utility District 08/16/05 displaced, locally pulled apart, or thrust up to one foot on top of each other. A 1954 study of settlement records by the DSOD (E.V. Poe, Memorandum of 1/15/1954) suggested a marked increase in the rate of observed settlement between 1949 and 1953 and that settlement records did not show a smooth but humps and dips at different times, reflecting influence of changes in reservoir elevation and perhaps continuing consolidation of the failed materials. It should be noted that during our field inspection, we noticed that the upper berm of the upstream slope is curved downward by about 4 feet, suggesting further slope adjustments in the years that followed the failure. A thorough investigation of the failure, including 23 borings (reported as 16 in some of the reports) along a line perpendicular to the dam axis (at Station 11+58) through the failed portion of the dam and foundation, was completed. This investigation focused on the alluvium material. It concluded that, for that material, its most noticeable features as a whole were its plasticity when wet or moist and its lack of distinct and persistent stratification. The investigation also concluded that the top of the foundation soils, below the failed portion of the dam, had settled up to a maximum of about 9 feet under the downstream half of the core. The exploratory borings also indicated that the upstream corner of the base of the core had moved about 8 feet toward upstream, while the downstream corner had moved about 30 feet toward downstream, based on the contacts between core and shell materials interpreted from the borings. The two slopes of the core, after the failure, were found to be at approximately 0.85H:1V (downstream slope), and 0.7H:1V (upstream slope), hence were substantially flatter than the designed (and presumably constructed) slopes present at the time of failure. Such finding, combined with the extensive measured crest settlements and measured slope movements, suggest that the entire core of the dam and downstream shell experienced large non-recoverable displacements and substantial remolding during the failure. The same in true for the portion of the foundation soils located below the core and original displaced downstream shell. Hence, the extent of the 1928 failure involved most of the core and downstream shell materials, and supporting foundation soils. Perhaps ten longitudinal cracks and crevices, with depths of between 10 and 18 feet and widths of one to four feet, are shown on a cross-section of the dam prepared after the failure (see EBMUD Drawing DH , dated January 1929). Cracks ranging from hairline to up to 1.5 inch wide were also reported in the outlet conduits, but no change in grade or alignment of the conduits was reported. Water levels were measured in some of the borings drilled before the 1928 failure, and suggested pore pressures increase averaging 1.35 times the height of the embankment at its pre-failure stage of completion. Hence, it was suspected that high pore pressures existed within the foundation alluvium at the time of failure. The post-failure borings did not GEI Consultants
32 Dynamic Stability Review of Lafayette Dam East Bay Municipal Utility District 08/16/05 encounter any phreatic surface within the embankment materials, but a very small reservoir (El. 392) was already impounded. Additional details are provided in the report prepared by the Consulting Board hired in 1928 by the District to investigate the cause of failure (Consulting Board, 1929). The Board concluded that the dam failed as a result of plastic flow within the foundation soils and in the most heavily loaded region. Some of these materials were squeezed out toward the region of least pressure. The dam would have shown no weakness had it rested upon a firm foundation. The exceptional conditions of the foundation alluvium that led to the dam failure were its uncommon thickness and general plasticity. It was also concluded, from the location of the displaced alluvium foundation surface and comparisons of failed material volumes, that significant consolidation had been experienced by the foundation soils during the failure. The Board report concluded that the dam was well built and that the failure was caused by the sole foundation conditions. We did not find, in the materials reviewed, any suggestion that the occurrence of the failure could have been related to the construction sequence or the steeper D/S slope of the original design. Subsequent field investigations performed in 1976 by W.A. Wahler & Associates concluded that a substantial downstream movement of the core wall had been associated with the 1928 failure. The total movement of the core wall was then estimated to be 12 to 14 feet, and had previously been undetected. Hence, the core wall and sheet piles may no longer function as an impervious barrier as originally intended, which may contribute to the high piezometric water surface observed within the dam section Revised Design and Final Construction In 1929, the Board of Consultants who investigated the 1928 failure recommended reconstruction of the dam with a crest width of 70 feet, at El. 460, and with flatter upstream and downstream slopes of 5H:1V and 7H:1V, respectively, see Figure 3-2. However, the dam was actually redesigned and rebuilt using a less conservative (steeper) downstream slope than recommended by the Review Board, but keeping the repaired and re-leveled wide top of the failed dam (220 feet wide) as a new crest. The Board accepted such redesign and construction was completed in The present downstream slope is flatter than that of the original dam and, except for a very flat (8H:1V) bottom section below El. 380, consists of a top section at 3H:1V and an intermediate section at 4H:1V, separated by a 10-foot wide berm at El The original (but displaced) upstream slope was essentially left intact. Only the slope protection concrete slab facing was repaired (EBMUD, 1957). Hence, an essential aspect of the reconstruction process is that most of the failed materials were neither removed nor recompacted. Cracks and scarps were filled at the dam crest. The surface of the crest of the failed embankment was regraded and the bulged foundation soil at the downstream toe were removed, but the dam was redesigned simply by flattening the GEI Consultants
33 Dynamic Stability Review of Lafayette Dam East Bay Municipal Utility District 08/16/05 downstream slope by placement of additional material and keeping a very wide crest at El During additional grading in 1967, the dam crest was raised one foot to its present elevation (El. 467). The present crest width is 210 feet. 3.2 Dam Operation The originally planned dam (crest El. 500) was originally intended to provide storage for about 10,590 acre-feet for water pumped into the reservoir from the Mokelumne Aqueduct. Following reconstruction after the 1928 failure, the maximum storage capacity was considerably reduced, due to the lower crest and spillway elevations. Furthermore, the reservoir water was prudently kept at reduced levels for an extended period of time. Over the years, the water was successively raised to El. 410, El.428 and, finally, to El. 448 in Reservoir level has been restricted since that time to about that level and the present water level fluctuates between El. 441 and (spillway crest). Current maximum storage is 4,250 acre-feet. The reservoir functions as a standby emergency storage facility to be used in case of disruption in the Mokelumne Aqueduct Water Transmission System. It should be noted that Lafayette Reservoir, among those owned and operated by the District, is the only one that relies on the outlet tower for spillway functions. GEI Consultants

34

35
36

37

38

39
40 Dynamic Stability Review of Lafayette Dam East Bay Municipal Utility District 08/16/05 4. GEOLOGIC AND SEISMIC CONSIDERATIONS The geologic and tectonic environment of the project area were reviewed using recently published maps and reports on geology in the area, analysis of geomorphology profiles, air photo interpretations, and geologic field mapping of the dam and reservoir area. Critical faults were identified, based on review of applicable literature and recent research on the subject. 4.1 Regional Geology Lafayette Dam is located in the East Bay Hills, a northwest-trending topographic upland within the Coast Range geomorphic province, see Figure 4-1. The East Bay Hills consist of Tertiary-age sedimentary and volcanic rocks underlain by older plutonic and metamorphic rocks. The area is characterized by northwest-trending bedrock ridges and intervening valleys filled with Quaternary sediments of varying thickness. The reservoir area is characterized by moderately steep to very steep (up to 35 degrees inclination) hillside terrain. Lafayette Dam is constructed across the neck of a small, northeast-trending valley eroded into Tertiary-age sedimentary rocks of the Contra Costa Group (Orinda Formation). Fine-grained alluvial materials underlay the dam foundation. These clayey materials were likely deposited in a ponded depression setting, which contributed to their limited strength. The bedrock in the vicinity of the dam and reservoir consists of interbedded conglomerate, sandstone, siltstone and claystone. These rocks typically are poorly cemented. However, hard and well-cemented units are locally present, and form ridges in the vicinity with dominant northwest-trending strike. Quaternary-age stream alluvium underlies the reservoir valley and central portion of the Lafayette embankment. Only a thin mantle of soil and colluvium underlies ridges and most hillsides; however, these surficial materials are thicker in valleys and drainage swales. Landslides are present locally on many hillsides (see Landslides section). 4.2 Geologic Structure and Tectonic Setting The East Bay Hills are situated between the active Hayward and Calaveras faults, and have been strongly deformed by late Cenozoic folding and faulting associated with plate boundary transpression, see Figure 4-1, where the regional faults are plotted. Traditionally, tectonic structures within the East Bay Hills have been considered to be mostly compressional. However, re-evaluation of tectonic features in the East Bay Hills indicates that a significant GEI Consultants
41 Dynamic Stability Review of Lafayette Dam East Bay Municipal Utility District 08/16/05 dextral (to the right) movement has also occurred. Unruh and Kelson (2002) propose a leftstepping, restraining bend step-over from the northern Calaveras Fault to a broad zone of distributed dextral slip within the East Bay Hills, either partly or wholly along previously mapped faults and newly identified north-trending lineaments. Tectonic strain in the northern East Bay Hills may be accommodated by a complex interaction of dextral slip and reverse slip structures. The principal faults in the vicinity of Lafayette Dam are listed in Table 4-1. In the vicinity of Lafayette Dam, the Tertiary-age rocks are folded into parallel to subparallel, west- to northwest-trending anticlines and synclines with limbs characterized by moderate to steep (30 to 65 degrees) northeast and southwest dips. Geologic maps by Graymer, et al. (1994) and Haydon (1995) depict a previously unidentified, possibly questionable fault extending below the dam (parallel to the crest). As mapped, the fault trace parallels the local fold axes to the east of the dam, but bends southward and offsets fold axes to the west of the dam. According to Graymer, (personal communication, May 2004), this fault was inferred on the basis of the apparent truncation of two northwest-trending fold axes by Wagner (1978). Wagner conducted regional mapping of 12 quadrangle maps as part of his 1978 Ph.D. Research. His map displays the fault as a possible subsurface feature that would help explain an apparent change in structural trend across that location. As depicted in Graymer, et al., this inferred fault might connect to the northwest-trending Pinole fault, which is currently considered conditionally active. We conducted a reconnaissance of the aforementioned mapped fault trace and surrounding terrain. At the western termination of the mapped trace (near the inferred junction with the Pinole fault), we observed an apparent faulted contact, with an east-west trend and steep northward dip (N75E, 50 degrees NW), between conglomerate and mudstone units. The exposure appears to support the presence of an east-west trending fault at that location; however, it does not explain the approximately 1-mile-long northward bend to the dam, and we did not observe obvious truncation of northwest-trending fold axes. We note that a map of the same area (Dibblee, 1980) indicates geologic structure to be consistent across the fault mapped by Graymer and does not show that fault. A bedrock orientation (northeast strike, dipping 47 degrees southeast) shown on Wagner s 1978 map, approximately 4,000 feet west of the dam, could be interpreted to represent a change in bedrock structure. However, it appears from our observations that this plotted bedrock attitude is located within a landslide and is likely not a reliable indicator of local structure. The lack of sufficient bedrock exposures along the remainder of the mapped trace does not allow us to confirm or reject the presence and mapped location of that inferred fault and, if such presence was confirmed, to assess whether it is active or not. The inferred fault, would it be confirmed, is not seismogenic and could only rupture due to movement on a nearby active fault (sympathetic faulting). The rupture would be small, less than a few inches, and favorably oriented with respect to the dam, which has a size and configuration capable of readily accommodating such unlikely movement. Hence, no additional investigation of this inferred fault is justified. GEI Consultants
42 Dynamic Stability Review of Lafayette Dam East Bay Municipal Utility District 08/16/ Recent Faulting and Seismicity Lafayette Dam is located in a seismically active area, between the historically active Hayward Fault (8.8 km to the southwest) and the Calaveras Fault (9.8 km to the southeast). These distances were interpreted by our geologist and are shorter than the 9.6 km (Hayward) and 11.5 km (Calaveras) previously assumed for these faults by the DSOD (Geologic Review, J.L. Lessman, 2003). W.A. Wahler & Associates (1976) estimated the distance from the dam to the Hayward Fault as 10 km, but assumed the Calaveras Fault to be only 6.4 km away, which cannot be substantiated. The northern Hayward Fault is a well-defined, active tectonic feature along the western margin of the East Bay Hills. In contrast, the Calaveras Fault, which is well defined geomorphically to the south, becomes poorly defined and less active toward the north. Dextral slip north of the Calaveras Fault is likely transferred to multiple north- to northwesttrending faults located to the northwest or northeast. Traditionally, geologists have assumed that dextral slip along the Calaveras Fault was being transferred to the Concord Fault, located to the northeast. However, there is a growing awareness that dextral slip may be transferred to the west via left-stepping, north-trending faults within the interior of the northern East Bay Hills (Taylor, 1992; Unruh and Kelson, 2002). Several northwest-trending linear valleys extend into the northern East Bay Hills from the town of Alamo, near the interpreted northern end of the active Calaveras Fault. These valleys, and related lineaments, appear to merge with previously recognized faults and folds (e.g., by Saul, 1973; Dibblee, 1980; and Crane, 1995), and newly identified lineaments and faults (Unruh and Kelson, 2002). The northern East Bay Hills are characterized by a moderate level of seismicity, compared to the stronger level of seismicity associated with the dominant fault and fold zones in the San Francisco Bay Area. The 1977 sequence of moderate-sized earthquakes near Briones Reservoir (called the Briones swarm ) may be typical of the style of earthquakes that occur in stepover zones between the endpoints of major faults (Oppenheimer and Macgregor-Scott, 1992). Other swarms, including in 1970, 1976, 1990 and 2002, have occurred in the Danville, Alamo and San Ramon areas, near the northern termination of the Calaveras Fault. During the last twenty years, two significant earthquakes were experienced in the Greater Bay Area, but had no impact on Lafayette Dam. These were the April 24, 1984 Morgan Hill (M 6.2), and the October 17, 1989 Loma Prieta (M w 6.9). Other earlier historic events of potential significance to Lafayette Dam were the October 24, 1955 Concord/Walnut Creek Earthquake (M 5.4), a June 1, 1911 earthquake (estimated M 6.6), presumed centered along the Calaveras Fault, the 1906 San Francisco Earthquake (estimated M w 7.9), and two large earthquakes centered along or near the Hayward Fault (1836 and 1868). The 1955 earthquake was centered about 12 km away from the site. In the last century, there has been GEI Consultants
43 Dynamic Stability Review of Lafayette Dam East Bay Municipal Utility District 08/16/05 about 20 earthquakes of assigned magnitude greater than 4 within a 30 km radius from the site. The faults of significance to the project site are described in the following paragraphs. Maximum earthquake magnitudes were obtained using empirical relationships between moment magnitude (M w ) and fault rupture area developed by Wells and Coppersmith (1994). Hayward Fault The Hayward Fault extends from Fremont northward to San Pablo Bay, for a length of approximately 87 km. The Hayward Fault is considered to be a part of the longer Hayward- Rodgers Creek fault system, which has been divided into three potential fault rupture segments: Rodgers Creek (north of San Pablo Bay), northern Hayward, and southern Hayward (WGCEP, 1999). This fault system is considered to be the primary dextral slip fault in the eastern San Francisco Bay area. Dextral movement is to the right, when looking across a strike-slip fault from the stable plate side. Portions of the Hayward Fault experience aseismic creep at about 4 to 5 mm per year, and locally as high as about 9 mm per year in the Fremont area (Lienkaemper, 1992; Lettis, 2001). A large (estimated M w 7.0) historic earthquake ruptured the southern, 50 to 55-km section of the fault in 1868, and paleoseismic investigations indicate that between four and seven large earthquakes have occurred on the northern Hayward Fault (considered to be 30 to 35 km long) during the past 2,100 years. The long-term slip rate on the fault is estimated to be 9 mm per year, which represents a Very High Slip Rate, per the fault slip rating classification and Consequence Hazard Matrix used by the DSOD (DSOD, personal communication). Previous segmentation models of the Hayward Fault were based on the extent of the 1868 rupture and presumed location of another earlier, large earthquake (1836). The 1836 earthquake, however, has recently been relocated (Toppozada and Borchardt, 1998) and is now considered not associated with the Hayward Fault. The apparent lack of clear physical, geologic or seismic evidence indicating a segment boundary lead us to consider the full Hayward Fault length in our maximum earthquake magnitude estimate (M w 7.25). Calaveras Fault The Calaveras Fault is a major northwest-striking tectonic structure. It is considered to be an active tectonic feature for nearly 120 km, from south of the City of Hollister to Danville, and possibly further north. The fault has been divided into three sections (northern, central and southern), based on geologic, geomorphic and seismic data. The Holocene slip rate decreases from south to north along the length of the fault, from approximately 15 to 20 mm per year along the southern section to about 14 mm per year along the central section, and to GEI Consultants
44 Dynamic Stability Review of Lafayette Dam East Bay Municipal Utility District 08/16/05 approximately 5 to 6 mm per year along the northern section (Sims, 1991; Simpson and others, 1999). Seismic data indicate that dextral slip along the southern and central fault sections is partially transferred westward to the Hayward Fault in the vicinity of Calaveras Reservoir. Active tectonic deformation on the northern Calaveras Fault appears to dissipate at its northern end, near Danville (Dibblee, 1980; Hart, 1981; Simpson and others, 1999). The northern portion of the Calaveras Fault, from Calaveras Reservoir to the Danville area, is approximately 40 km in length, and has been associated with less seismic activity than the southern portion. Although there have been micro-earthquake swarms in the general vicinity of the northern Calaveras Fault, as discussed earlier, we found no well-constrained data on the timing of the most recent large earthquake. The northern segment can be considered seismically dissimilar, compared with the central and southern sections of that fault, due to its lower slip rate and rate of seismic activity. Based on such differentiation, it seems excessively conservative to assign a moment magnitude using the entire 120-km fault length (M w 7.5) of the Calaveras Fault, but keeping in mind that the June 28, 1992 Landers Earthquake (M w 7.3) involved a rupture over 85 km long, with complex relative movements propagating along three different faults and a stepover segment (Lazarte, et al., 1994). Although unique, the Landers experience suggests that a major rupture along a well-defined fault segment could propagate to other segments of that same fault or even to nearby faults, increasing the overall rupture length and effective duration of associated ground motion. However, in consistence with recent studies approved by the DSOD (Olivia Chen Consultants, Inc., 2003), we assumed segmentation of the Calaveras Fault to define our recommended upper bound estimate, M w 7.0, which is based on the 40 km long northern segment. This M w estimate is larger than M w 6.8 assigned to that same segment for near-source classification of faults for the Uniform Building Code (Petersen, et al., 2000). We noted, however, that the DSOD assigned an M w of 7.25 to the Calaveras Fault in its recent geologic review of Lafayette Dam (J.L. Lessman, 2003). San Andreas Fault The San Andreas Fault is the dominant tectonic structure accommodating right-lateral, translational motion along the boundary between the North American and Pacific plates. The total fault length, from Point Arena southward to the Gulf of California, is on the order of 1,100 km. In northern California, the San Andreas Fault can be separated into two sections, the approximately 135-km-long creeping segment (from Cholame to San Juan Bautista), and the approximately 450-km-long 1906 rupture segment (from San Juan Bautista to Point Delgada in Mendocino County). WGCEP (1999) divides the northern San Andreas Fault into four discrete segments: North Coast North, North Coast South, Peninsula, and Santa Cruz Mountains segments. GEI Consultants
45 Dynamic Stability Review of Lafayette Dam East Bay Municipal Utility District 08/16/05 Lafayette Dam is approximately 39 km from the northern San Andreas Fault; the closest location on the fault is near the interpreted break between the North Coast South and Peninsula segments (i.e., Golden Gate). Late Holocene slip rate estimates for these two closest segments to Lafayette Dam are 24 mm per year for the North Coast South segment, and 17 mm per year for the Peninsula segment. Paleoseismic investigations appear to indicate that the 1906 event was characteristic of large rupture events along the northern San Andreas Fault (i.e., M w 7.9 with recurrence intervals on the order of several centuries). Current magnitude estimates for the San Andreas Fault range from M w 7.9 for the entire northern portion of the fault to M w 7.1 for individual segments (North Coast South and Peninsula). We have assigned M w 7.9 to the San Andreas Fault in this study. Concord Fault The Concord Fault extends from Mount Diablo northwestward to Suisun Bay and is approximately 14 to 24 km long and is about 12.8 km away from the dam. From Suisun Bay northward, it is presumed that dextral slip along the Concord Fault is transferred to the east to the Green Valley Fault, which extends to Wooden Valley in eastern Solano County. Thus, the Concord Fault is considered to be the southern segment of the Concord-Green Valley fault system. We have assigned a moment magnitude M w 6.5 to the Concord Fault, hence appreciably below the M w 7.0 recently estimated by the DSOD (Geologic Review, J.L. Lessman, 2003). However, using the DSOD estimate, this fault would produce at the site less severe shaking than could be produced by the Hayward or Calaveras faults and, therefore, such issue does not need to be investigated further. The Concord Fault experiences aseismic creep of about 3 to 4 mm per year, which appears to closely match the geologic slip rate from sparse paleoseismic investigations (Borchardt and others, 1999; Borchardt and Baldwin, 2001). WGCEP (1999) uses a slip rate of 4 +/- 2 mm per year for earthquake probability scenarios. The largest known historic earthquake (M 5.4) on the Concord Fault occurred on October 24, 1955, and no significant earthquakes (M > M 6.0) have been reported along this fault in the past 225 years (Toppozada and others, 1986). Franklin Fault The Franklin Fault is a southwest-dipping thrust fault that forms the southwestern boundary of an apparent micro-structural block within the East Bay Hills (Crane, 1995). A structurally related feature, the Southhampton Fault, forms the northeastern boundary of the block. Unruh and Kelson (2002) describe multiple, discontinuous geomorphic lineaments associated with the Franklin Fault that appear to suggest dextral motion. Consequently, the Franklin Fault (and Southhampton Fault) may be a pre-existing Tertiary fault that has been subsequently deformed by dextral displacement or has actually accommodated both thrust and strike-slip motion along a complex zone of faulting. The Franklin Fault is located approximately 7.5 km from the dam. From the information reviewed, we assigned to the GEI Consultants
46 Dynamic Stability Review of Lafayette Dam East Bay Municipal Utility District 08/16/05 Franklin Fault a moment magnitude (M w ) of 6.75, based on probable rupture length vs. magnitude relationships (Wells and Coppersmith, 1994). The DSOD (2003) also assigned a moment magnitude of 6.75 to the Franklin Fault, but a shorter distance (6 km). Miller Creek Fault The Miller Creek Fault is one of many recognized thrust or reverse faults within the interior of the East Bay Hills. This fault is subparallel to the Hayward Fault, and has accommodated a large amount of late Cenozoic contraction. Most of the thrust faults in the area are not considered active tectonic features. However, paleoseismic investigation by Wakabayashi and Sawyer (1998) revealed that at least a portion of the Miller Creek Fault displays evidence of lateral (strike-slip) movement during the late Quaternary. Their southern trench site, located on a north-trending section of the fault, revealed evidence of lateral offset of late Pleistocene colluvium. However, a northern trench site, located north of a distinct westward bend in the strike of the fault, demonstrated that the fault has not displaced late Pleistocene units at this second location. Although slip along the Miller Creek Fault might be transferred northward to other faults in the area, no breaks in geologic structure suggesting fault offset have been observed to date. The southern extent and active portion of the fault is not clearly known. The fault may be a short as 7 km in length, or could transfer slip to other faults further south for a possible length of approximately 20 km. We have assigned a moment magnitude of 6.5 to the Miller Creek Fault, based on probable rupture length vs. magnitude relationships. This estimate is consistent with current interpretation by the DSOD (2003). Lafayette-Reliez Valley Faults The Lafayette and Reliez Valley faults are separate faults that merge at their northern end, but are subparallel to each other along most of their length (Graymer and others, 1994). Recent investigations of the area reveal that the faults are associated with strongly pronounced geomorphic features that may be indicative of Quaternary fault activity, including saddles, tonal lineaments, linear valleys, vegetation alignments, and closed depressions (Unruh and Kelson, 2002). The Lafayette-Reliez Valley (LRV) fault system is approximately 13 km in length, although possible connection with the Cull Canyon Fault (which has not been demonstrated to show dextral offset) could extend the length for another 14 km. The LRV faults require further investigation to better constrain their possible Quaternary activity. However, because of the geomorphic evidence indicating potential Quaternary activity, we consider these faults active for dam safety evaluation purposes, and assigned them a moment magnitude (M w ) of 6.5, based on an assumed rupture length of 13 km. GEI Consultants
47 Dynamic Stability Review of Lafayette Dam East Bay Municipal Utility District 08/16/05 Inferred Faults As discussed in Paragraph 4.2, Graymer and others (1994) have depicted an inferred, buried fault passing under the dam centerline. During our field reconnaissance, which was limited to surficial observations and did not include any subsurface investigations, we did not observe any geologic features that would substantiate such assertion. Our review of the geologic map provided no strong evidence for the existence of such inferred fault. The same bedrock formation (Contra Costa Group) is present on both sides of this fault, and the local geologic structure appears to be locally consistent with fold axes. The fold axes are parallel to the postulated alignment of the inferred fault, between the dam left (west) abutment to the eastern termination of the inferred fault (approximately 5,000 feet east) and are depicted as being truncated, about 2,000 feet west of the dam, by a northeast-southwest bend of this fault. However, this apparent truncation in fold axes could also result from changes in the strike of the folds, or might be associated with deformation along unrecognized north-south oriented faulting. Such north-south faulting has not been identified to date, but could explain a series of other discontinuous lineaments, as discussed under the next title of this section. In addition to the lack of strong geologic evidence supporting the presence of a fault under the dam, we have not found in our review any data that would indicate that faulting was observed during excavation of the dam foundation. If such inferred fault were present, it would likely not be active, because the orientation of its strike is not consistent with the trend of other well-recognized tectonic features (i.e., north-south to northwest-southeast Northern Calaveras stepover features). In the absence of more specific information, the existence of such inferred fault may be questionable. We conclude that it would represent a very low hazard to the dam as a potential seismic source, or in terms of secondary (sympathetic) movement potentially triggered by a major rupture of any of the major faults identified in the greater site area. Furthermore, its orientation, parallel to the dam crest, would reduce the potential for any sympathetic movements affecting the dam adversely. Another unnamed small bedrock fault was mapped to the north of the dam, and shows some dextral displacement (Wagner, 1978; Graymer, et al., 1994; Haydon, 1995). This northtrending fault could represent one of multiple, north-trending smaller faults that might be associated with the transfer of slip from the northern Calaveras Fault. Other lineaments near Lafayette Dam North of the dam, Unruh and Kelson (2002) have identified a 6.5-km-long, north-trending lineament zone. This zone, called the Russell Peak lineament zone, appears to coincide with an unnamed bedrock fault, mapped to the north of the dam, that shows some dextral displacement (Wagner, 1978; Graymer and Other, 1994; Haydon, 1995). As mapped by Unruh and Kelson (2002), the Russell Peak lineament zone ends approximately 2 km north GEI Consultants
48 Dynamic Stability Review of Lafayette Dam East Bay Municipal Utility District 08/16/05 of the dam. Southward projection of this lineament zone would pass through or near the eastern margin of Lafayette Reservoir. We evaluated available aerial photographs (from 1928, and 1986) to substantiate any indications of lineaments in the reservoir and dam area. Although several possible lineaments were observed near the eastern reservoir margin, these are weak and discontinuous, and not necessarily along trend with the welldefined zone located further north. A second possible zone of weak, discontinuous lineaments may be present approximately 1.5 km west of the reservoir. Based on our geologic inspection, we have not identified any obvious fault-related lineaments through the reservoir. A strong, northwest-trending strike ridge located approximately 700 m south of the reservoir margin appears to extend unbroken across the projection of the weak lineaments, see Figure 4-2. Overall, lineaments identified in the dam region are not strongly pronounced. However, when considered together with similar features mapped to the north and east, they could represent conditionally active or capable faulting associated with the recent tectonic setting. At this time, we consider the lineaments to represent a low hazard to the dam as potential seismic sources. To improve understanding of the local geology as it specifically relates to Lafayette Dam and to help resolve any issues regarding the inferred fault and the lineaments, more detailed geologic mapping might be considered to clarify their geologic relationships and assess whether they represent faulting and could have any potential for activity. 4.4 Landslides Numerous landslides are present along the margins of Lafayette Reservoir, including probable deep-seated landslides involving rock material and shallow failures involving surficial materials (soil and colluvium). The largest landslides identified during our review, based on aerial photographs and site reconnaissance, are also depicted on Figure 4-2. We also observed abundant small soil slumps and shallow debris flows that were not mapped. Yet, most of the observed landslides appear to pose a low to moderate risk of significant impact to the dam, because they are located high on the hillside and upslope from the reservoir, or are interpreted to be relatively small in size. Several landslides may have a higher potential risk due to their relatively large size, more definitive geomorphic form, and location relative to the reservoir. An older landslide is located adjacent to the right (east) abutment. The landslide appears to be old, based on a subdued landform, but still retains the distinctive remnants of a headscarp and landslide body. If the landslide actually underlies a corner of the embankment, and experiences movement in the future, it could potentially damage the downstream toe of the embankment. This would not affect, however, the overall safety of the dam. GEI Consultants
49 Dynamic Stability Review of Lafayette Dam East Bay Municipal Utility District 08/16/05 An active landslide is present above the parking lot for the Visitor Center, at the northwest corner of the reservoir. This landslide may have been triggered, in part, by grading for reservoir facilities. We note that the landslide is not visible in 1928 photographs, but appears to be fully developed by Foundation Condition The foundation for the dam could not be observed, except for the downstream abutment contacts. The abutments were observed to be in satisfactory condition. We did not observe any signs of foundation stability issues. We evaluated foundation conditions from the available subsurface exploration and laboratory testing data. Lafayette Dam is founded on alluvial sandy clays from the Orinda formation. The alluvium thickness extends from a few feet or less at the abutments, and averages about 90 feet in the central portion of the dam. Greatest depths of alluvium were encountered in Boring SS-2 (100 feet), SS-22 (98 feet) and SS-1 (90 feet). Alluvium primarily consists of clay to sandy clay with occasional lenses of thin sands and gravel. The sand content of the alluvium varies from 5 to 40 percent (S&W, 1966), except for two soil samples retrieved from two borings (Fig. A.4 of the S&W report). W.A. Wahler & Associates (WA, 1976) reported that no significant lenses of sand were detected during their field exploration program. The most recent subsurface investigations, relying on soil data interpreted from their borings, did not identify any specific layer or zoning within the foundation alluvium. The first geologic report by Louderback (1927) described the upper 5 to 15 feet of the alluvium as a dark clay, behaving as a stiff adobe when dry, and as a plastic clay when wet. Below the upper alluvium, Louderback described a change in clay color, but not in lithology. He also identified a confined water-bearing zone, about 50 feet below the original ground surface of the alluvium, with a water level 64 feet above the proposed reservoir level. Overall, no loose saturated silts or sands, generally acknowledged the most susceptible to liquefaction, have been encountered in these borings. The foundation alluvium is underlain by bedrock from the Orinda Formation. The Orinda Formation is of Pliocene origin. It is composed of partially consolidated claystone, sandstone and conglomerate and was encountered below the alluvium under the dam footprint and at both abutments. Based on boring logs and field penetration data, no firm rock was encountered, and S&W (1966) stated that in some cases, the formation resembles a hard clay, rather that a rock and that dry densities in that formation range from 110 to 130 pcf. Following the 1928 failure, the failed foundation soils were not removed when the dam was reconstructed. Although these soils have most probably consolidated with time, we judge that the quality of the Lafayette dam foundation materials may not meet modern standards for dam foundation requirements within the area affected by such failure. GEI Consultants
50 Dynamic Stability Review of Lafayette Dam East Bay Municipal Utility District 08/16/ Seismic Criteria General The purpose of this section is to discuss the selection of criteria for the seismic stability review of Lafayette Dam. As discussed in Section 4.3, various faults may affect Lafayette Dam. Based on maximum magnitude and distance considerations and its high rate of slip, the Hayward Fault is the most critical (controlling) feature. The San Andreas and Calaveras also represent significant seismic hazard. Despite its shorter distance to the site and being potentially causative of large PGA s, the Lafayette-Reliez Valley is associated with a lesser risk than the aforementioned faults, based on its uncertain, lower rate of activity and much shorter expectable durations of ground shaking in case of related earthquake occurrence. The inferred fault (see Section 4.3) below the dam was not considered as a potential seismic source Basis for Seismic Criteria The seismic evaluation of dams whose failure would present a hazard to life ( high risk dams) is presently based on the concept of Controlling Maximum Credible Earthquake (CMCE). The high risk classification assigned to Lafayette Dam in the National Inventory of Dams (NID) reflects its potential for extreme human and economic consequences in case of failure, due to heavy downstream development. The United States Committee on Large Dams (USCOLD, 1985), now the U.S. Society on Dams (USSD), defines the CMCE as the most severe of all Maximum Credible Earthquakes (MCE) capable of affecting a dam. The MCE is the largest, reasonably conceivable earthquake that appears possible along either a recognized fault zone or within a geographically-defined tectonic province, under the presently known or presumed tectonic framework. Little regard is given to its probability of occurrence. The MCE is assumed centered at the closest distance between the dam and causative seismogenic source. More recent literature refers the MCE as the Maximum Considered Earthquake. Because the faults that might generate ground motion potentially affecting Lafayette Dam have high rates of slip, it is appropriate to use 84 th percentile criteria to define the ground motion that could be generated at the site in case of tectonic rupture along these faults. The Consequence Hazard Matrix of the DSOD (first proposed October 4, 2002) describes such requirements. We developed seismic criteria for the four faults the most critical to Lafayette Dam: the Hayward, San Andreas, Calaveras and Lafayette-Reliez Valley faults. GEI Consultants
51 Dynamic Stability Review of Lafayette Dam East Bay Municipal Utility District 08/16/ Influence of Local Site Conditions. A consideration to develop seismic criteria is the subsurface condition at the site. The central portion of Lafayette Dam is founded an average of 90 feet of clayey alluvium. Furthermore, based on measured shear wave velocities and descriptions provided in the project files, the local bedrock, the Orinda Formation, is poorly cemented and characterized by low shear wave velocities (average Vs less than 1,300 ft/s). Therefore, the Orinda Formation cannot be classified as a hard rock, or even as a soft rock. The 1929 Board reported that when thoroughly wet, the Orinda beds have probably little, if any, greater strength than wellcompacted layers of gravel, sand and clay. Both the valley alluvium and the Orinda Formation bedrock on which Lafayette Dam is founded are equivalent to a firm soil. Using shear wave velocities (1,180 ft/s<v s <2,460 ft/s) and NEHRP 1994 subsurface classification (Types A through E), Lafayette Dam must be considered as founded on Type C soil, for ground motion evaluation purposes Peak Ground Acceleration We used recently published ground motion attenuation equations applicable to the Western United States and shallow crustal events to estimate 50th percentile (mean) and 84 th percentile (mean+σ) horizontal and vertical peak ground accelerations (PGA's) that could be induced at the site from the occurrence of the MCE. While we have recommended 84 th percentile criteria for the evaluation of Lafayette Dam, we also developed 50 th percentile criteria for comparison purposes. The vertical component of ground motion has been typically ignored in dynamic response analyses of embankment dams, because it does not induce significant hydrodynamic pressures along relatively flat embankment slopes, and because conventional equivalentlinear (EQL) analyses, e.g. as performed in 1976 for Lafayette Dam, are little sensitive to the consideration of a vertical component of input motion. Such is not the case for modern analysis techniques, e.g. using nonlinear soil constitutive relationships. Appreciable differences in computed non-recoverable deformations can occur when vertical excitation is included or ignored in the seismic analysis (Bureau, 1996). Hence, for potential use by the District, we have also developed criteria for the vertical component of our recommended MCE s. For the horizontal response spectra, we used three sets of well-accepted attenuation equations for PGA (Abrahamson and Silva; Boore, Joyner and Fumal; and Sadigh, Chang, Egan, Makdisi and Youngs). These were presented in the January/February 1997 Issue of the "Seismological Research Letters", a publication of the Seismological Society of America (SSA). These three equations are well accepted and commonly used by the DSOD. For comparison purposes, and although not used to develop our recommended criteria, we also GEI Consultants
52 Dynamic Stability Review of Lafayette Dam East Bay Municipal Utility District 08/16/05 considered equations developed by Crouse and McGuire (1995), because they are applicable to the Western United States and differentiate between subsurface conditions classified per NEHRP site type, and by Campbell (1997, 2001), who is well recognized for his extensive work on the subject. We used Campbell s and Abrahamson and Silva s equations for the vertical component of motion, as the other authors did not include the vertical component of motion in their studies. Details of the numerical procedures followed to develop our recommended PGA's and complete references are presented in Appendix D. The attenuation equations used in our review apply to shallow crustal earthquakes in active tectonic regions such as Coastal California, which has provided the largest amount of data. We used parameters applicable to strike-slip predominant tectonic regime. These equations differentiate between strike-slip or reverse tectonic environments, and between soil or rock subsurface conditions. Depending on the equations considered, we have used soil or an average of soil and rock conditions for this site, as discussed in Appendix D. All equations, except Crouse and McGuire s, which are based on the surface-wave magnitude (M s ), use the moment magnitude (M w ) to quantify the size of the earthquake. We obtained the peak ground motion estimates for each fault by geometric (logarithmic) averaging of the predictions of the three selected attenuation equations. Peak ground accelerations and corresponding Earthquake Severity Indexes (ESI) are summarized in Table 4-2. The ESI is an indicator of the energy content of the earthquake motion considered and is used to estimate earthquake-induced deformations (see Appendix D). The ESI is a convenient way to quickly rank the probable order in which the faults are the most critical to the Lafayette site. The Hayward and San Andreas faults are the two most critical features. Faults other than those listed in Table 4-2 (e.g. Concord and Franklin faults) could generate significant ground motion at the site but, because of their associated distance and magnitude, have less demanding ESIs and, therefore, do not control the MCEs for Lafayette Dam Response Spectra Attenuation equations for five percent damping pseudo-absolute spectral accelerations (PSA) at various periods are also provided in the same references as for the PGA. We used these attenuation equations to develop response spectra that define the MCE ground motion at various frequencies. These spectra are representative of the average horizontal motion at the site, since both the primary and secondary components of the records analyzed to develop attenuation equation parameters were used. The process by which we obtained these response spectra is also described in Appendix D. As for the PGA, mean + σ estimates were averaged to develop the recommended response spectra. We believe this averaging procedure to be conservative. GEI Consultants
53 Dynamic Stability Review of Lafayette Dam East Bay Municipal Utility District 08/16/05 Because Lafayette Dam is located a short distance away from several faults of significant length, the location where the fault rupture could originate along the causative fault and the direction of propagation of such rupture, e.g., toward or away from the site, could induce near-field and directivity effects and influence the response spectra. Such effects have typically been observed as large velocity pulses (directivity) at the beginning of some strong motion records and can result in large spectral amplitudes in a narrow band of periods located between 0.6 sec and 5 sec. In addition, in the near-field, the fault-normal (FN) component can be substantially larger than the fault-parallel (FP) component. The concept of correcting response spectra for directivity and near-field effects is rather recent. As it is somewhat impossible to accurately predict at what periods of the spectra such effects would be the most significant, we have corrected the 84 th percentile horizontal spectra to include near-field and directivity effects using a recently recommended broad-band correction process that depends on the type of faulting, magnitude and distances considered. Details on the way these effects were implemented in our recommended horizontal spectra are provided in Appendix D. The 5 percent damping Hayward MCE response spectra, which would be the most demanding for Lafayette Dam because of the large associated magnitude, are presented on Figure 4.3. The response spectra for the other faults are presented in Appendix D. Response spectra for damping values other than five percent are also needed, as significant damping is expected in soil-like materials under demanding ground motions such as considered. For this purpose, we used a scaling procedure based on spectral amplification ratios published by Newmark and Hall (1982), and we multiplied the five percent damping spectral amplitudes by appropriate scaling factors to obtain response spectra at 0.5, 2, 7, 10 and 20 percent damping. The recommended scaling coefficients provide a smooth variation of the calculated spectral amplitudes as a function of period. Because of this scaling process, response spectra at damping values other than five percent are only approximate. The response spectra developed for the faults most critical to Lafayette Dam are tabulated in Tables 4-3 through These spectra conservatively define the frequency characteristics of the ground motion representing the various MCEs. The recommended PGAs and spectral accelerations listed in Tables 4-3 through 4-10, which are based on deterministic principles, can be compared with ground motion levels obtained for the Lafayette site (latitude: o, longitude: o ) through probabilistic seismic hazard analysis by the USGS (Seismic Hazard Mapping Program), see Table Two conclusions can be drawn from comparing Table 4-11 with our recommended spectral values: Although obtained deterministically, some of the PGAs and recommended spectral values have relatively high probabilities of occurrence, of about 10 percent in 50 years or higher at some frequencies. This is not surprising, considering the high rates of slip of the local faults. GEI Consultants
54 Dynamic Stability Review of Lafayette Dam East Bay Municipal Utility District 08/16/05 The recommended spectral accelerations do not represent upper bounds of ground motion and could be exceeded during events of low probability of occurrence. Although they represent conservative requirements, 84th percentile response spectra could be exceeded at any period or range of periods of vibration. The above comparison with the USGS probabilistic estimates is only useful as a relative indication of potential seismic hazard, and is not intended to provide an alternative way to define seismic criteria for this project. However, as mentioned above, the 84 th percentile deterministic spectra have a finite probability of being exceeded at any specific exposure period, and independently of how they compare with probabilistic estimates derived from the data contained in the USGS database. We compared our recommended 5 percent damping response spectra with the response spectra presented for the Hayward (Earthquake A) and San Andreas (Earthquake B) input motions previously considered in 1976 by W.A. Wahler & Associates, see Figure 4-4. The 1976 response spectra were originally intended by their developers to represent bedrock motion and, therefore, have a high energy content at periods between 0.2 sec and 0.5 sec, of little applicability to Lafayette Dam. Earthquake A was a modified Lake Hughes record, intended to represent a M 7.5 event, and Earthquake B was the Seed-Idriss 1969 synthetic earthquake, composed of accelerograms of shorter magnitudes and durations intended to represent the propagation of the rupture for a M 8+ event. Periods of dynamic response of significance to Lafayette Dam are comprised in the range of periods sec. From the graphical comparison shown on Figure 4-4, we conclude that Earthquake A is insufficiently conservative by modern standards to represent the Hayward event, by a factor of between 2 and 3 at some periods of potential significance to the dam response. Earthquake B is adequate and, indeed, quite conservative. GEI Consultants
55 Table 4-1 Faults in the vicinity of Lafayette Dam Fault or Fault Segment San Andreas Distance From Lafayette Dam (km) Best Estimate Rupture Length (km) Down- Dip Width of Fault Rupture (km) 3 Approximate Rupture Area (km 2 ) 4 Magnitude Estimate (based on rupture length) Magnitude Estimate (based on rupture area) Hayward Northern, Central, and Southern Calaveras Northern Calaveras Concord Miller Creek 9.5/ (not known) Franklin (not known) Lafayette Reliez Valley (not known) Table A-1 (Working Group on Northern California Earthquake Probabilities, 1999) 2 Best estimate of rupture length reported in Table A-1 (WGNCEP, 1999) 3 Best estimate of down-dip width of fault rupture reported in Table A-1 (WGNCEP, 1999) 4 Product of rupture length and down-dip width of fault rupture 5 Magnitude vs rupture length estimated using Wells and Coppersmith (1994) Figure 9 6 Magnitude vs rupture area estimated using Wells and Coppersmith (1994) Figure 16 Fault locations and distances based on: Hayward: (Lienkamper, 1992; Radbruch, 1969) Calaveras: (Hart, 1981; Crane, 1988, Simpson and others, 1992) Concord: (WGNCEP, 1999) Miller Creek: (Wakabayashi and Sawyer, 1995; Dibblee, 1980) Franklin: (Crane, 1988) Lafayette-Reliez Valley: (Unruh and Kelson, 2002)
56
57
58
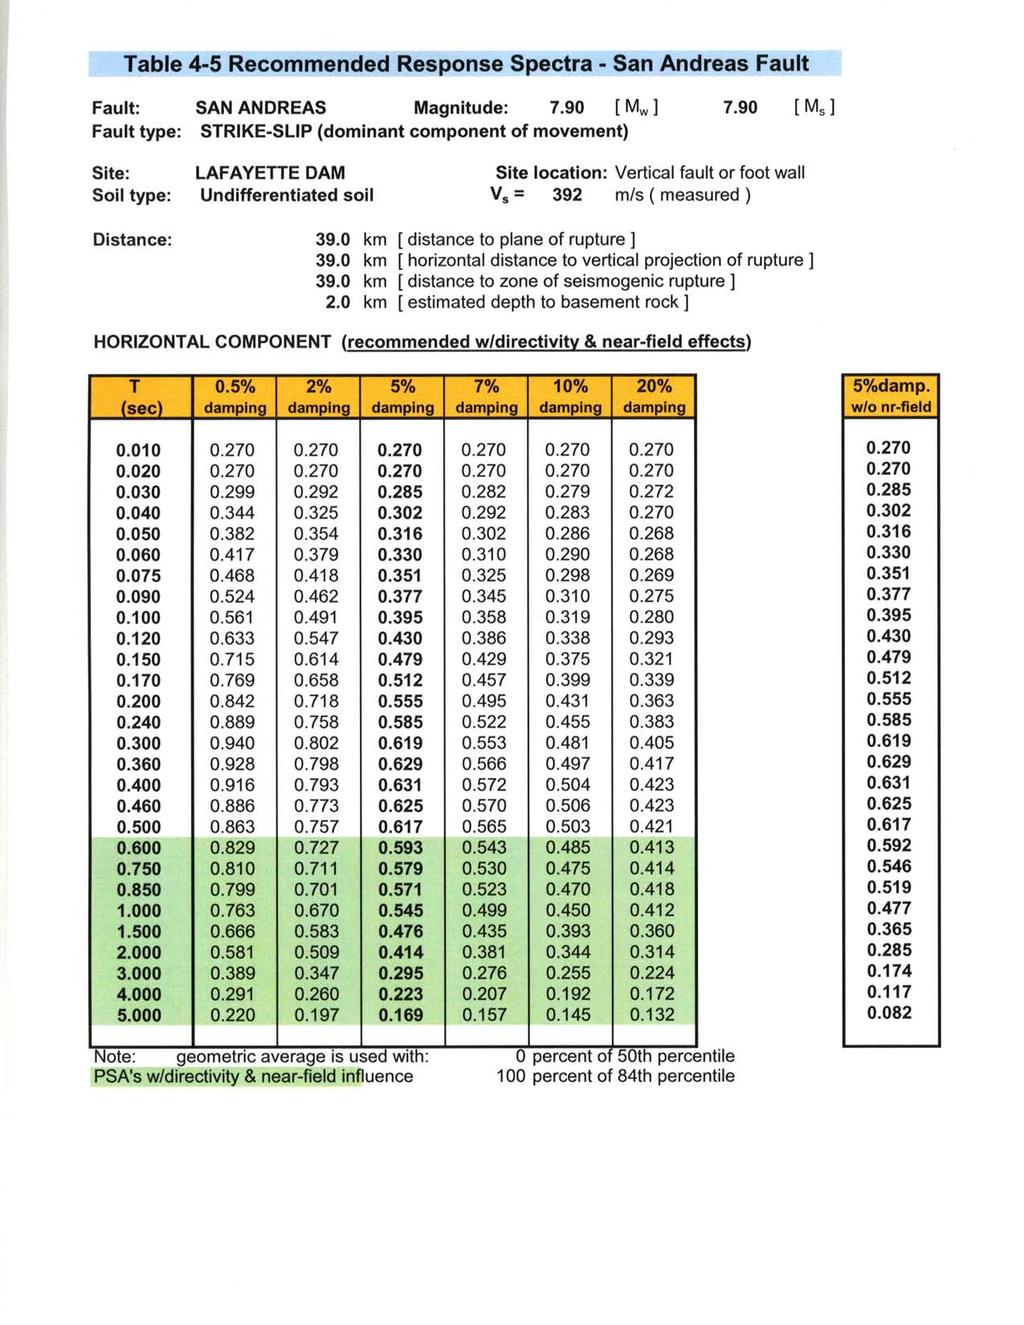
59
60
61
62
63
64
65

66

67

68
69
70 Dynamic Stability Review of Lafayette Dam East Bay Municipal Utility District 08/16/05 5. INSTRUMENTATION 5.1 Survey Monuments There are currently 24 survey monuments, arranged in a grid on the embankment of Lafayette Dam. The monuments are surveyed approximately once (and occasionally twice) a year. EBMUD provided survey data measurements from June 1, 1989 to December 9, 2003 for our review. These data were provided both as graphs and raw data. Tables and figures of maximum vertical and horizontal displacements recorded for the monuments from 1989 to the present have been prepared and are included in Appendix A. The maximum horizontal and vertical displacements for all the survey monuments during these 15 years of record are 3.36 inch and 3.12 inch, respectively. Review of the time versus displacement graphs for individual survey monuments shows that the horizontal and vertical movements are stable, with no significant increase in recent years. Horizontal movement of the upstream slope is toward the upstream direction, while the downstream slope has moved slightly downstream. 5.2 Piezometers There are currently 18 active piezometers at Lafayette Dam. The District provided us timeversus-reading graphs for the active piezometers from January 1989 to January 2004 for our review. Piezometers readings are taken approximately monthly. In addition, the corresponding readings of reservoir level from 1989 to 2004, as well as rainfall measurements, were included in the graphs. Details regarding the installation history and readings of the piezometers are provided in Appendix B. While several piezometers show only small variations consistent with the reservoir level and no specific trends over the last 10 years, others show fluctuations in excess of the reservoir level fluctuations and readings higher than the reservoir level. Following review of the piezometric data, we estimated the average phreatic level in the maximum cross-section of the embankment, see Figure 7-3. Comparison of the estimated phreatic surface with the phreatic surface assumed in the Wahler (1976) stability analyses and by the DSOD (2003) indicates that our estimated phreatic surface is generally similar to those used in previous studies, although somewhat lower in the upstream portion of the dam, and slightly higher in the downstream portion of the dam. Overall, such variation is probably not significant to the stability and performance evaluation, and remains well within the level of judgment needed to interpret the piezometric data. GEI Consultants
71 Dynamic Stability Review of Lafayette Dam East Bay Municipal Utility District 08/16/05 The phreatic surface in the downstream portion of the embankment, as interpreted from these open-well piezometric data, is quite high for a dam with an impervious core. The core wall and sheet piles probably no longer function as an impervious barrier as originally intended, which may contribute to the high water surface observed within the dam section. Some piezometric readings could represent foundation water pressures, rather than indicate the true phreatic surface within the embankment. 5.3 Seepage Monitoring Seepage is collected by tunnel and embankment subdrains. A 24-inch conduit, which was installed in a 60-inch diameter concrete conduit, runs along the left abutment of the dam. Tunnel leakage is collected in a sump box, located near the west end of the toe of the dam. Seepage through the dam is collected by a subdrain system, composed of 6-inch and 8-inch pipes, which run perpendicular to the dam axis and along the toe of the dam. Seepage collected in the pipes is evacuated through a seepage collection box, located near the right abutment at the toe of the dam. Preliminary review of seepage data collected in the last ten years indicate that tunnel leakage ranges from 1 gpm to less than 5 gpm, and seepage from the toe drain range from zero to less than 10 gpm. These quantities are well within acceptable, and not indicative of any particular problem. 5.4 Instrument Evaluation The crest survey data are within the survey accuracy and indicates no significant vertical or horizontal movement in the last 15 years. Due to the age of Lafayette Dam, we believe that crest monument surveys provide limited information, and could be conducted only after felt earthquakes. However, we understand that the District intends to continue surveying the monuments at regular intervals. Until 1992, the piezometers in Lafayette Dam have had both relatively consistent and erratic readings with relatively high phreatic levels. The piezometers indicate a general downward gradient in the downstream slope. The indicated phreatic levels remain in agreement with or are conservative with respect to the assumptions of the previous and present slope stability analyses. Some piezometers were replaced, and still show fluctuations exceeding the reservoir water elevation, due to probable continued infiltration of surface water or blinding. Several of the older piezometers (installed 1956, 1965) may display signs of plugging. Review of the installation details suggests that the piezometer screens may not have been adequately designed to mitigate fines infiltration. Overall, the piezometers adequately monitor the continued good performance of the dam. Presently, leakage appears to generally be within the bounds of historic fluctuations. For a dam of the size of Lafayette, average seepage of less than 10 gpm about is quite low. GEI Consultants
72 Dynamic Stability Review of Lafayette Dam East Bay Municipal Utility District 08/16/05 6. FIELD INSPECTION 6.1 General The dam and reservoir area were inspected on 2/24/2004 by Bill Cole (CSA) and Mark McKee (RYCG), and on 4/1/2004 by Gilles Bureau and Carol Buckles (GEI). Bill Cole returned to the site on April 30, 2004 to specifically look for any evidence of an inferred fault mapped by Graymer, et al. (1994). The purpose of these visits was to observe and assess the local geologic conditions, compare the site layout with the available drawings, observe the current condition of the facilities, and identify any conditions that would potentially impact the seismic stability of the dam. The inspection was conducted by following standard inspection procedures (FERC dam inspection checklists). Selected inspection photographs are included as Appendix C. The project serves as an emergency standby storage facility. The reservoir is small (4, 250 acre-feet) off-channel, and typically subject to insignificant daily fluctuations. Water surface elevation at the time of our second inspection was about one foot below the lowest point along the top berm (El. 445 ft, estimated, taking the downward curvature of the berm into account). Lafayette Reservoir is open to the public for recreational purposes. The crest of the dam serves as parking for hikers and fishermen. However, access to the dam is limited to the crest; the upstream and downstream slopes have restricted access. Permission was granted by EBMUD to walk in and inspect the restricted areas of the embankment. The reservoir rim is heavily vegetated. No signs of reservoir rim instability were noted, but numerous old landslides, discussed in Section 4.4, were observed. 6.2 Dam Lafayette Dam is a zoned earth embankment. Its upstream slope is lined with concrete panels (slabs) intended for slope protection. The crest of the dam is paved with asphalt concrete and is used for parking. The crest was observed to be in good condition with no obvious signs of settlement, misalignment, or cracks. Because of its wide area, surface runoff may accumulate locally, but a drainage collection system discharging into a pipe near the top of the upstream slope in the central portion of the dam appears to have been installed. The upstream slope has a very noticeable concave shape near the maximum section of the dam, with about 4 feet of vertical elevation differential at crest center, see Photos C-1 and C- 2. Rainwater ponds near that location at the lowest point of the upper upstream berm. Based on existing data and considering the vertical retaining wall along the upstream edge of the crest, most of this settlement should have occurred shortly after the 1928 dam failure and GEI Consultants
73 Dynamic Stability Review of Lafayette Dam East Bay Municipal Utility District 08/16/05 before the dam crest was brought to its present elevation. The 1929 report by the Consulting Board mentioned only 1.5 feet of subsidence for the upper upstream berm. Hence, an additional 2.5 feet of vertical downward movement occurred at that location after the 1928 post-failure surveys. Presently, the crest does not show any indication of settlement. The upstream face concrete panels appear to be in good condition, except for minor cracking (Photo C-3) and some gaps, up to 4-inch wide, between adjacent concrete panels (Photo C- 4). The joints have been filled with asphalt, but the filling is frequently deteriorated or missing, and grass grows in open joint spaces, see Photo C-5. The downstream slope was covered with grass at the time of our inspection (Photo C-6), but was observed to be free of erosion, excessive vegetation, and cracks or obvious settlement. No seepage was visible along that slope. The groin areas were observed to be dry. Various 6-inch and 8-inch clay-tiled surface drains, dry (Photo C-7), or collecting minor surface runoff (Photo C-8), are located along the downstream face. Numerous rodent holes were noticed. The dam is primarily founded on alluvium, but we noted no foundation deficiencies along the sides or at the bottom of the embankment where it abuts the Orinda Formation. We observed the downstream toe of the dam and the collector outlet box for the subsurface drains. Very small, clear outflow was observed at the downstream drainage collection system (Photo C-9). Piezometer locations along the crest and two faces of the dam are well marked and protected with steel caps, see Photo C-10. No signs of adverse artesian pressures were observed downstream of the dam. Our review of the historical information on Lafayette Dam indicated that the 1928 failure occurred after much of the upstream concrete slabs were in place. The Consulting Board convened after the failure (see Section 3.1.2) stated in its report that the upstream slope of the dam experienced much less movement than the crest and downstream slope, and that its upper berm, originally constructed to be straight at El. 450, curved convexly (outward horizontal bulge) with a maximum horizontal displacement of 3.8 feet toward upstream as a result of the failure. The central portion of the upper berm also showed a maximum subsidence of 1.5 feet. The concrete slabs on the face were displaced but generally not broken. Remedial work following the 1928 failure consisted of repairing or replacing the concrete panels on the upstream face, but the post-failure slopes in-between the crest and the berms were not modified (Shannon & Wilson, 1966). Hence, the maximum vertical slumping reported immediately after the 1928 failure is less than the distortion of the upstream face presently observed (about 4 feet of downward movement). Shannon & Wilson (1996) reported that the dam settled 1.3 feet between 1933 and 1963, and predicted another 0.4 ft in the following 30 years. Hence, some 0.8 ft of settlement may have occurred from 1928 to Review of the recent settlement data indicates only minor, insignificant movement of the upstream slope. It is reasonable to conclude that most of the observed distortion of the upstream face has occurred in the 35 years that followed the 1928 failure, and is not indicative of recent movement. GEI Consultants
74 Dynamic Stability Review of Lafayette Dam East Bay Municipal Utility District 08/16/ Outlet Tower and Spillway The dam does not have a separate spillway. A reinforced concrete outlet tower (Photo C-11), located in the reservoir approximately 320 ft from the crest, provides both spillway function and reservoir drawdown capacity. The outlet tower was not accessible for inspection during this site visit. Spillway flows and releases from the reservoir exit the tower through two adjacent 60-inch diameter underground conduits located below the left abutment portion of the embankment. The portion of the outlet conduit beyond the dam toe includes an internal steel pipe. The outlet conduits terminate downstream of the dam toe in a baffle box across Mount Diablo Blvd. The inspection team attempted to observe the baffle box and outlet discharge but was not able to gain access to the area due to heavy vegetation and fencing. Minor drainage was observed from the drainage collector at the right abutment side of the dam toe, as would be expected for this time of year. The seepage was clear and exiting at low velocity. The evaluation of the tower was not included in this review. The outlet tower appears to be in fair exterior condition, seen from the dam, but we are aware that its performance under earthquake loading is under review, based on recent studies by the District. No deficiencies other than insufficient seismic capacity have been reported in recent years. We understand that seismic upgrade of that tower is presently contemplated. GEI Consultants
75 Dynamic Stability Review of Lafayette Dam East Bay Municipal Utility District 08/16/05 7. EMBANKMENT STABILITY ASSESSMENT 7.1 Previous Field Exploration and Laboratory Testing Programs Various field exploration programs have been performed over the years at the site, including prior to the dam construction. An inventory of the borehole information we collected and reviewed is shown in Table 7-1. In addition to the original field investigation and the borings drilled after the 1928 slope failure (see Figure 3-3), three exploration programs (1956, 1965 and 1973) provided data useful to this review. Location of these borings is shown on Figure 7-1, which is taken from the 1976 Wahler report. Additional boreholes were drilled in 1992 and 1996 by EBMUD to install piezometers, but we did not locate any corresponding boring logs. Summary information is provided below regarding these various field and laboratory programs. More complete information regarding laboratory testing data is provided in Appendix E. In general, we found many similarities between embankment and foundation materials. This is no surprise, since all construction materials were locally obtained from borrow areas in the alluvium and hillside upstream from the dam. Virtually all materials recovered either from the dam core and shells or from the underlying foundation alluvium are referred as clay or clay-like materials. Based on the data reviewed and our interpretations, we believe that the dam zones and foundation materials are essentially homogeneous, with occasional small zones of more sandy materials, but with no continuous granular layers or significant lenses in either the dam shells or foundation Pre-Construction and 1929 Post-Failure Field Programs. Louderback (1927) described 12 test pits dug at various locations along the proposed centerline of the dam, some to significant depths (11+05 pit was 32 feet deep). Borings were advanced from the bottom of three of these pits with a hand auger, and reached depths of 48 to 79 feet. Louderback provided a description of the soils encountered in his report, but we found little information of current engineering significance. We found no information whether groundwater was encountered in the borings drilled prior to the dam construction, but water was encountered at about 20 feet below ground surface in two wells, 74 feet and 94 feet deep, respectively, drilled a short distance above the dam site (Board Report, 1929). GEI Consultants
76 Dynamic Stability Review of Lafayette Dam East Bay Municipal Utility District 08/16/05 The 1929 investigation of the 1928 failure included 5 test pits along the upstream berm, 22 borings through the failed portion of the dam along a line perpendicular to the dam axis (at Station ), and 6 test holes along the downstream toe. The logs of these borings were retrieved from the data files reviewed and are also plotted on a District drawing showing the failed cross-section of the dam (DH , dated January 1929). The corresponding logs only describe the types of materials encountered, and their estimated condition of moisture and plasticity. No free water was encountered in these borings within the embankment materials. Erratic water levels were encountered below the former ground surface (top of alluvium). For example, based on the 1929 report, high water pressures were encountered about 50 feet below the original ground surface and the water rose in Hole 24, on the upstream side of the top the dam, to 64 feet above the reservoir water level (reported to be at El. 392 on 9/17/1928). While this occurrence could have represented artesian pressure, it was concluded that in the alluvium and, especially, near the downstream toe, the laterally compressed failed materials probably significantly influenced pore pressures ratios Investigation In 1956, the District drilled two borings, SS-1 and SS-2, by using its own rig, to obtain samples from the foundation alluvium and embankment materials. Boring SS-1 was drilled from the dam crest to a depth of 203 feet, Boring SS-2 from the upper downstream berm to a depth of 182 feet. Samples were obtained with a 2-inch diameter modified California split spoon sampler and Shelby tubes. We did not find records of any blow counts for these two borings in the files made available to our project team. Soil samples from these two borings were tested in the laboratory. The testing program included moisture and density tests (MD), Atterberg limits tests (AL), specific gravity (SG), consolidation (CONSOL) and confinedundrained (TXCU) and unconfined-undrained (TXUU) triaxial compression tests. Most specimens tested were 2-inch diameter by 4-inch long. TXCU tests were loaded to failure or up to 20% strain at a constant rate of loading of 0.05 inch/mn, with a confining pressure targeted to be 0.6 times the overburden pressure at the depth where the sample was recovered. The strength testing included samples from the core (Zone 1), the upstream shell (Zone 3), and foundation materials presumably failed during construction (Zone 4?). The TXUU tests were intended to measure the shearing resistance of the clayey soils Investigation Twelve borings designated as B-3 through B-14 were drilled in 1965 with a Failing 750 drill rig. The holes were augered to about 5 feet, then 5 to 8 feet of casing were driven from the top of the hole, and the holes were completed to their final depth with rotary wash drilling without drilling mud. No further casing was placed. Two-inch O.D. standard SPT testing/sampling was alternated with undisturbed sampling using a 3-inch diameter Pitcher barrel. A few specimens were recovered by pushing the sampler into the soils, indicating the presence of possibly softer zones. MD tests were performed on all samples recovered. AL GEI Consultants
77 Dynamic Stability Review of Lafayette Dam East Bay Municipal Utility District 08/16/05 and TXUU tests were performed on selected samples, and torsion vane shear tests were performed on all cohesive undisturbed samples. One CONSOL test was performed on a core sample, and eight series of TXCU tests were performed on various materials Investigation In 1973 and 1974, W.A. Wahler & Associates (WA) directed a subsurface investigation conducted using truck-mounted (Failing 1500) and barge-mounted (B-40) drilling equipment. The drilling and sampling were actually performed by District s engineering staff, who also prepared the boring logs. Seventeen borings were completed. The Wahler field program was also supplemented by a cross-hole geophysical investigation (Langenkamp and Nelson, 1973). The DSOD questioned the 1973 geophysical data (shear velocities too high) and the spacing of the holes, and Woodward-Clyde Consultants (1975) conducted a second crosshole geophysical program. CalTrans also performed an independent downhole survey for research purposes, and the results were made available to the project team. The measured velocities were intermediate between those of the two other geophysical programs and were used by Wahler as the primary basis to define the low-strain dynamic shear moduli of the materials encountered. Wahler also performed an extensive laboratory testing program, including TXCU tests and stress-controlled and strain-controlled cyclic triaxial tests, isotropically (K c = 1) or anisotropically consolidated (K c = 1.5). 7.2 Previous Analyses The stability of Lafayette Dam was previously investigated by the District (1956), Shannon and Wilson, Inc. (1966), and W. A. Wahler & Associates (1976). In 2003, the DSOD used existing data and performed additional slope stability and simplified deformation analyses (Newmark s method). These previous studies are reviewed in the following paragraphs Static and Pseudo-Static Analyses (1956) The District performed early stability studies in At that time, the reconstructed dam impounded a reservoir at El. 448 (since 1937), following two earlier reservoir raises at El. 410 and at El. 428 in the years that followed reconstruction. The 1956 studies were to investigate the feasibility of raising the reservoir water level to El. 456 and constructing a new spillway, which was never built, through the left abutment. The 1956 studies were also intended to compensate for the poorly documented reconstruction of the dam. As part of these studies, various options to upgrade the dam were proposed, including flattening of the slopes or constructing a drainage curtain. GEI Consultants
78 Dynamic Stability Review of Lafayette Dam East Bay Municipal Utility District 08/16/05 The data from the 1956 laboratory testing were used to develop analysis parameters. Strength properties were obtained from triaxial compression test results, reduced by a working factor of 1.2 (EBMUD, 1956). However, strength of the foundation material was back-calculated from the at rest post-failure position of the 1928 embankment slopes, and a cohesion of 580 psf and a friction angle of 12 degrees appears to have been assigned to both the foundation and the embankment fill in the final 1956 analyses (Dukleth, 1956). Stability analyses were performed using the method of slices. They included steady seepage, rapid drawdown, and pseudo-static analysis of the upstream (U/S) slope; and steady seepage and pseudo-static analysis of the D/S slope. The pseudo-static horizontal load coefficient was taken as 0.10g. The studies concluded the upstream slope to be unsafe for rapid drawdown, and the dam to be unsafe under either proposed or present operation if subjected to a major earthquake of sufficient force to produce a horizontal acceleration of 0.10g. G. Dukleth (1956) presented factors of safety (FS) related to the 1956 studies in a memorandum. For rapid drawdown (El. 456 to El. 420), the computed FS was The FS was 1.12 for normal storage lowered to El. 420, and 0.63 for a reservoir at El. 420 and pseudo-static earthquake analysis (0.10g). The factors of safety computed by Dukleth are extremely low, but were based on post-failure strength estimates that should approach the residual strength of the foundation and embankment materials. Undoubtedly, the failed embankment and foundation materials have gained strength with time, as indicated by subsequent laboratory testing programs Static and Pseudo-Static Analyses (1966) In 1966, and following a review of the 1956 studies by DSOD, Shannon and Wilson, Inc. (S&W, 1966) used the standard method of slices (no side forces) with postulated circular failure surfaces. Based on the results of field exploration (12 additional borings) and laboratory testing, they subdivided the dam section into three zones Zone 1 (core), Zone 2 (U/S shell), Zone 3 (D/S shell) and the foundation alluvium into two zones, Zone 4 and Zone 5. Zone 4 represented a somewhat weaker section of the alluvium at shallow depth below the downstream section. First, S&W performed a post-failure analysis of the 1928 embankment, then static (steady seepage and rapid drawdown) and pseudo-static analyses of the maximum section of the reconstructed embankment. They also analyzed several wedges to investigate the construction failure, assuming horizontal forces only. Pseudo-static analysis used a horizontal seismic coefficient equal to 0.10g. For the analyses during construction, S&W calculated a FS of about 1.0 for deep circles passing through the foundation, and between 0.5 to 0.9 in the wedge-failure analysis. They concluded that the dam in the 1928 final stages of construction was marginally safe, but stated that factors of safety obtained in their wedge failure analyses were unrealistically low. S&W used the slip circle analyses of the 1928 section as a basis to select shear strengths for stability analyses of the reconstructed dam. GEI Consultants
79 Dynamic Stability Review of Lafayette Dam East Bay Municipal Utility District 08/16/05 Based on their laboratory and post-failure analysis results, S&W selected effective stress strength parameters to represent normal operating ( steady seepage ), and total stress strength parameters for the construction failure and pseudo-static analyses of the reconstructed dam. Such strength parameters are summarized in Table 7-4. Steady seepage analysis of the reconstructed dam section only considered the D/S slope. The lowest FS was 1.9, and involved a circular failure surface (referred to as trial circle 4A ) passing through the crest center and at a shallow depth within the foundation alluvium. Hence, such failure would involve most of the D/S slope, but not the deeper part of the alluvium. Rapiddrawdown analyses of the U/S slope involved critical circles passing through a berm at El. 447 (normal pool) and through the foundation soils and dam toe, and corresponded to a FS of 1.4. In pseudo-static analysis (0.10g), the same failure circle for the D/S slope as in the steady seepage analysis (circle 4A) resulted in the FS, 1.2. A wedge analysis was also performed for pseudo-static condition and had a FS of 1.7. The U/S slope was also not analyzed for pseudo-static condition. Based on these results, S&W concluded the safety of the embankment to be adequate Equivalent-Linear Dynamic Analyses (1976) In 1976, W. A. Wahler & Associates (WA) assessed the seismic stability of Lafayette Dam, assuming that general liquefaction of the dam materials would not occur. They conducted a new field exploration program to recover samples for cyclic triaxial testing. No instantaneous or sudden loss of strength occurred in any of the samples dynamically tested. Wahler subcontracted downhole geophysical surveys (Langenkamp, 1973), but the results were questioned by the State, presumably because the spacing of the holes was excessive. Woodward-Clyde Consultants (WCC, 1975) conducted new cross-hole and down-hole seismic surveys at the site, but Wahler concluded that the new data probably underestimated V s in the alluvium. The WCC results and the results of another downhole geophysical survey by CalTrans (1975) in one single hole (SS-30) were used to define the low-strain dynamic modulus of the soils encountered. The CalTrans variations of wave velocities in the upper half of the alluvium appear quite large (500 fps to 2,500 fps), if not erratic. Overall, the shear wave velocities used by Wahler as a basis for estimating lowstrain dynamic properties for dynamic analyses appear to be substantially higher than measured by either WCC or CalTrans (see Fig. VI-6 of the Wahler report), but a review of the Wahler analyses performed in 1977 concluded that such selection of V s should not significantly affect the results of the analysis (Memorandum of Design Review, 3/4/1977). In its analyses, Wahler used zones 1 through 3 (U/S shell, D/S shell and core) to represent the maximum section of Lafayette Dam, but did not differentiate between Zone 4 and Zone 5 in the foundation alluvium, as did Shannon & Wilson, and used the same engineering properties for the entire alluvium layer below and beyond the dam. The response of Lafayette Dam embankment to earthquake ground motion specified at bedrock level below the dam s GEI Consultants
80 Dynamic Stability Review of Lafayette Dam East Bay Municipal Utility District 08/16/05 foundation was estimated through equivalent-linear (EQL) dynamic finite element response analysis. Bedrock motions were estimated for three Maximum Probable Earthquakes as follows: Hayward Fault (M 7.5) at 9.6 km distance, with a peak ground acceleration (PGA) of 0.60g; Calaveras Fault (M 7.3) at 6.4 km, with a PGA of 0.52g; and San Andreas Fault (M 8.3) at 40 km, with a PGA of 0.40g. M designated the Richter Magnitude. Wahler selected horizontal acceleration histories with bracketed durations of shaking of 39 seconds (Hayward), 38 seconds (Calaveras), and 75 seconds (San Andreas). The bracketed duration is the interval of time between the first and last acceleration peaks of 0.05g or greater. Wahler calculated a fundamental period of 1.97 sec for the maximum section of the dam (Station 11+65). Such long period was obviously influenced by the thickness of alluvium at such section. It was concluded that the maximum section should be the most critical because the cyclic strength of the compacted shell material was between 15 and 50 percent higher than that of the alluvium. As both the dam and foundation materials were not liquefiable, Wahler estimated earthquake-induced deformations based on the concept of strain potential, using the laboratory-measured cyclic strengths and computed number of equivalent cycles. Strain potentials calculated within each element of the numerical model were converted, using a simplified procedure, to shear displacements along selected vertical columns through the embankment. In preliminary analyses, Wahler found the response to the San Andreas event to be the most critical, and the final dynamic analysis was only performed for that earthquake scenario. We found an early review memorandum in the files, dated March 18, 1974, that stated that these results showed many elements in the foundation with factors of safety less than 1.0. It is not clear whether that sentence pertained to preliminary or final results of the Wahler study. Thirty (30) equivalent uniform stress cycles were concluded to represent the average response of the embankment to the San Andreas event, and average induced stresses were compared with the cyclic strength of the dam and foundation materials at 5 percent and 10 percent dynamic strain levels. The most critical area was found to be the upper half of the foundation alluvium, below the upstream slope of the dam, with strain potentials at between 5 and 10 percent (Figure VI-7). Maximum earthquake-induced displacements of 8 to 9 feet were estimated for the section analyzed, and assumed to result in a maximum loss of freeboard of between 2 and 3 feet Simplified Analyses by DSOD (2003) In a simplified reevaluation of the seismic stability of the Lafayette embankment, the DSOD performed additional slope stability and simplified deformation analyses. The DSOD reviewers used the same dam zoning as S&W and Wahler and similar properties for Zones 1 through 5, but introduced a new foundation Zone (Zone 4.5) below the lower portion of the D/S slope, where the slope is 8H:1V, to account for some low blow counts possibly indicative of residual soils. The dam and foundation zoning considered by the DSOD is GEI Consultants
81 Dynamic Stability Review of Lafayette Dam East Bay Municipal Utility District 08/16/05 shown on Figure 7-2. DSOD performed various stability analyses of the D/S slope, including static, pseudo-static (0.15g coefficient) and post-earthquake static (using the residual strength in Zone 4.5), and of the U/S slope, including pseudo-static (0.15g) and rapid drawdown. All of these analyses resulted in computed factors of safety greater than 1.0. The earthquakeinduced deformations were estimated at 1 to 3 feet using the Makdisi and Seed simplified procedure (1977) with an 84 th percentile PGA of 0.69g, an estimated magnitude (M w ) of 6.5 and a computed yield acceleration of 0.21g. Hence, based on these PGA and estimated magnitude, these deformations seem to correspond to a nearby event along the Lafayette- Reliez Valley Fault, rather than along the Hayward or Calaveras faults. Deformations were also computed using the Newmark s method (1965) by double integration of acceleration increments of the Lucerne (1992 Landers Earthquake) above the yield acceleration. With this method, non-recoverable displacements less than one foot were estimated Current Applicability of Previous Analyses We critically reviewed the results of the previous analyses discussed above. The standard method of slices (no side forces) was used in both 1956 and 1966, and analysis properties were estimated by back-calculations of the 1928 failure. Hence, the corresponding factors of safety were probably underestimated. The 1956 studies used excessively conservative analysis parameters, and should probably be disregarded. The 1966 analyses of the reconstructed dam led to acceptable factors of safety, but only considered the D/S slope. The U/S slope could have been more critical, because of its higher phreatic surface and steeper slope, but its performance was likely acceptable, considering that a FS of 1.4 was obtained for rapid drawdown condition. The 1976 dynamic analyses were state-of-the-art procedures at the time when performed, but the EQL method of dynamic analysis may not be sufficient for a high risk dam, potentially subjected to very demanding severe earthquake ground motion. For example, the frequency content of the input motion and the velocities of simulated earthquake waves affect the dynamic response analysis. Using modern finite element mesh sizing criteria, and depending on the computer program to be used, the maximum element size should be smaller than 1/6 th to 1/10 th of the minimum shear wavelength to be transmitted. The low-strain shear-wave velocities (V s ) of the embankment and foundation materials range from 500 to 1,500 ft/s. Assuming that frequencies of 5 Hz or below should be propagated without being overdamped, maximum element size (low-strain dynamic motion) should be between 10 feet and 15 feet (for V s = 500 ft/s) and between 30 feet and 50 feet (for V s =1,500 ft/s). Hence, for the maximum dam section (132 feet high and 90 feet of alluvium) and low-strain condition, 7 to 14 layers, and possibly more, might be required at low-strain levels. Under earthquake loading, the dam and foundation material will lose stiffness and V s decrease, requiring additional refinement of the analysis model and thinner layers. Wahler represented the dam and foundation with 8 layers, a number probably insufficient to assure proper transmission of the seismic waves under MCE loading condition. GEI Consultants
82 Dynamic Stability Review of Lafayette Dam East Bay Municipal Utility District 08/16/05 In his review, Dr. Idriss also indicated that the dynamic properties used in the 1976 analyses for the clay shear modulus reduction and damping factors have been since judged inadequate for such soils, and updated in recent work by Dr. K.H. Stokoe and his colleagues at the University of Texas, Austin. However, we did not address this review comment further, as no dynamic analysis was contemplated in this study. The above modeling limitation may have contributed to lengthening the calculated fundamental period of the dam and may explain why no amplification of the peak base motion (0.40g) was computed at the crest (0.39g) in Most dams amplify ground motion, based on observed performance of existing instrumented dams (USCOLD; 1992, 2000). At such level of input motion, one would expect some amplification of the peak acceleration at the top of a dam such as Lafayette Dam, although its wide crest may reduce response at that level, compared with the base motion. This observation raises some questions regarding the computed response. Quick checking that the dam response might have been underestimated as a result of insufficient resolution of the numerical model was obtained by comparing the Wahler crest acceleration amplification ratio (0.97) with crest acceleration amplification ratios obtained in the Makdisi-Seed s procedure (1977), see Section 7.7 and Appendix F. Makdisi and Seed provided empirical formulas to estimate the spectral amplitudes of the first three periods of vibration of an embankment dam and combine them into an approximate crest acceleration, based on mode superposition principles. For a base motion with 0.60g PGA (Hayward event), the Seed-Makdisi's peak crest acceleration ranges from about 1.1g to 1.3 g, depending on whether the alluvium is included in the analysis, hence is about twice the PGA of the input motion. For a San Andreas event (0.29g PGA), crest accelerations estimated through the Makdisi-Seed procedure range from 0.62g to 0.64g, hence provide similar amplification ratios. While these values represent simplistic estimates and may be on the high side, they suggest that the crest acceleration computed in 1976 (0.39g for 0.40g PGA) was perhaps too low. Empirical correlations developed from earthquake motions recorded on dams (Idriss, 2004) suggest that, at about 0.40g peak base acceleration, dam crest accelerations could approach up to 0.65g. The fundamental period of vibration of the dam reported in 1976, 1.97 sec, appears to be very long, as compared with the periods calculated in the Makdisi-Seed procedure or the fundamental periods estimated from empirical formulas suggested by Dr. Idriss in his review of the GEI draft report. For the Hayward event (0.60g PGA), the Makdisi-Seed procedure leads to periods that range from 0.8 sec to 1.6 sec, whether or not the thickness of the alluvium is assumed to be included in the overall height of the dam. Periods calculated through this procedure are shorter for the San Andreas event (0.29g PGA) than the Hayward event, due to the lesser reduction in dynamic modulus stiffness, and range from 0.6 sec to 1.25 sec. Based on Dr. Idriss formulas and assuming an average uniform low-strain V s of 1,000 ft/sec (measured V s ranged from 500 ft/sec to 1,500 ft/sec), the low-strain fundamental GEI Consultants
83 Dynamic Stability Review of Lafayette Dam East Bay Municipal Utility District 08/16/05 period of a triangular wedge of same height as the dam (132 ft) would be 0.3 sec [ T 0 = 2.4 H/V s ], and the period of a semi-infinite soil layer of thickness equal to the dam plus the underlying alluvium (132 ft + 90 ft = 222 ft) would be about 0.9 sec [ T 0 = 4 H/V s ]. Hence, the low-strain period of the dam-foundation system, based on those formulas, should be somewhere between 0.3 and 0.9 sec. For average shaking conditions representing the Hayward Earthquake, the Makdisi-Seed s procedure indicate a modulus reduction of about 80 percent, or an average V s equal to about 45 percent of the low-strain V s. This would correspond to a lengthened fundamental period of 0.7 sec for the triangular wedge and 2 sec for a semi-infinite layer. This range, sec, is consistent with that obtained in the Makdisi-Seed procedure ( sec) and suggests that the fundamental period computed by Wahler was probably too long. As periods of significance to the Wahler response analysis were substantially longer than the period at which peak spectral amplitudes occur, this might have contributed to underestimating the response of Lafayette Dam. The fundamental period of 1.97 sec calculated in the Wahler analysis for the San Andreas event may also result from too low iterated dynamic moduli and too high damping values, combined with the probable insufficient resolution (element size) of the numerical model. As Wahler found the simulated San Andreas event to be the most critical (Earthquake B ), they did not include detailed results concerning their Hayward Earthquake (Earthquake A ) in their report. We noted, however, that the response spectrum of Earthquake A was insufficiently conservative at the periods of significance to the dam response, a probable reason why the San Andreas event was found to be the most critical in As normally done for EQL analyses, different computer programs were used by Wahler for the initial static (program LSTRN) and dynamic response analyses (program QUAD-4). Such programs are not fully compatible, which adds some uncertainty, although not significant, when their results are combined. LSTRN was described as a linear-elastic analysis program, a possible limitation when used for soil materials. Static analysis programs using hyperbolic constitutive relationships are now preferred for use in parallel with EQL dynamic analysis. Also, Wahler used an early version of QUAD-4, and a subsequently recognized coding error in one of the subroutines may have affected the computed stresses. Such coding error was discussed in the review of the 1976 results by the DSOD (Memorandum of Design Review, dated 3/4/1977). Strain potentials were computed in a small number of elements using a decoupled procedure. An improved method for estimating earthquake-induced deformations from strain potentials (Serff, et al., 1976) was not yet commonly used at the time Wahler performed its EQL analyses. Lastly, no post-earthquake static stability analyses that would take into account any potential loss of strength experienced as a result of dynamic straining have been performed. As shear displacements of up to nine feet were predicted within the upstream GEI Consultants
84 Dynamic Stability Review of Lafayette Dam East Bay Municipal Utility District 08/16/05 foundation, the residual shear strength of the affected materials would be mobilized in the post-earthquake condition. We also noted that the Wahler study found the upstream foundation to be the most critical under seismic loading, while the history of the dam and strength data suggest that the downstream foundation is the weakest. While EQL analysis procedures are acceptable for non-liquefiable materials and when an appreciable margin of safety can be demonstrated, the early history of Lafayette Dam must be taken into consideration. Although the failed foundation and embankment materials must have consolidated and gained substantial strength since 1928, one must keep in mind that the wide-crested incomplete dam experienced substantial flow failure displacements that led to crest settlements of 24 to 26 feet in the central portion, under static loading conditions. This is more than the current freeboard (17.8 feet). Previously failed materials were never removed from the foundation and downstream slope of the dam, and could be sensitive to sustained dynamic loading. From sole consideration of the previous dynamic analysis results, one cannot rule out that such materials might be prone to experiencing large nonrecoverable displacements, under exceptionally demanding earthquake loads and long durations of shaking. Such consideration and the limitations of the 1976 dynamic analyses raise the question of whether the District should consider implementing modern evaluation procedures to more reliably assess the seismic performance of Lafayette Dam. The simplified analyses by DSOD used the June 28, 1992 Lucerne Valley record (M w 7.3), which represents near-field (1.1 km distance) ground motion at a very shallow soil/rock site. We did not find information regarding which component of this record was used. The Lucerne acceleration histories contain near-field effects at periods well above 2 sec, but their frequency content at periods between 0.5 sec and 2 sec seem to fall substantially below the recommended 84 th percentile spectral requirements. Hence, if not modified in frequency content to match the requirements of the Lafayette site, deformations estimates obtained with the Lucerne record(s) may be on the low side. Updated deformation estimates, using simplified evaluation procedures, are discussed in Section Review of Material Properties This section presents the results of our review of existing data describing the dam and foundation material properties, and our selection of analysis parameters to perform simplified analyses of Lafayette Dam. Table 7-2 presents the summary of our interpretation of average unit weights and moisture contents, and Table 7-3 presents our recommended total stress and effective strength parameters. Our estimated strength parameters are based on a critical review of the strength testing performed to date and, as needed, on our reinterpretation of the triaxial test data and Mohr failure envelopes. Detailed review and our selection process for the strength parameters are discussed in Appendix E. Dr. Idriss, in his review of the GEI draft report, noted that assuming a cohesion intercept could be unconservative for the shallow GEI Consultants
85 Dynamic Stability Review of Lafayette Dam East Bay Municipal Utility District 08/16/05 segments of any potential failure surface. However, since we found that the most critical failure surfaces involve the whole upstream slope, or the entire downstream slope plus the foundation alluvium, we used the cohesion values shown in Table 7-3 for all zones and locations within the analyzed cross-section. The principal soil parameters normally required for the detailed seismic evaluation of an embankment dam are unit weight, shear and bulk modulus, static (total or effective stress) strength, cyclic and residual shear strengths, and damping coefficient. In addition, and as needed for the evaluation of dynamic pore pressures in sandy materials, gradation characteristics, relative density D R, porosity, degree of saturation, percent fines content and rate of build-up of excess pore pressures may be needed. Because of the clayey nature of Lafayette Dam and foundation materials, and because the previous studies only included conventional slope stability or EQL dynamic analyses, some of the above parameters were not required. Furthermore, dam studies from the 1960 s and 1970 s did not consider the concept of residual strength. Our review and update of analysis parameters included the following steps: Review existing field and laboratory data; Re-interpret some of the triaxial testing data, based on current practice; Review previous static and dynamic analysis parameters; and Select updated analysis parameters. We updated the material properties primarily from those tested by Shannon & Wilson (1966) and W.A. Wahler and Associates (1976). Based on our review, we distinguish the same three zones within the dam, the core (Zone 1), the downstream shell (Zone 2) and the upstream shell (Zone 3), see Figure 7-2. However we believe that only two zones need to be considered in the foundation alluvium. Zone 4 comprises the foundation alluvium at about 115 feet depth or less below the downstream slope surface, and at and beyond the downstream toe. Zone 5 primarily includes the foundation soils below the core and upstream shell, and is the same as shown on Figure 7-2. We also considered some of the deeper alluvium below the downstream shell as being part of Zone 5. Our Zone 4 includes weaker materials probably affected by the 1928 failure, as identified from available field penetration and laboratory testing data, and the Zone 4 and Zone 4.5 shown on Figure 7-2. Based on the limited information available for the alluvium below the downstream toe of the dam, we found no strong reason to differentiate between Zones 4 and 4.5. Hence, our slope stability analyses assigned the same average material properties to Zone 4 and 4.5 previously considered by the DSOD in its review. For our static and pseudo-static slope stability analysis of Lafayette Dam, we assumed the material properties listed in Tables 7-3 and 7-4. GEI Consultants
86 Dynamic Stability Review of Lafayette Dam East Bay Municipal Utility District 08/16/05 For some of our estimations of earthquake-induced deformations, we used the generic modulus reduction curve and lower bound damping curves originally proposed by Makdisi- Seed (1978). Considering the approximate nature of this simplified method to estimate deformations, we consider the use of such generic curves sufficient. It is also appropriate, as Makdisi and Seed primarily used clayey dams in the development of their methodology and considered such curves to be suitable. In their EQL studies, Wahler used the Seed and Idriss (1970) shear modulus and damping curves, which are generally similar in shape and of a comparable vintage to the ones we used. We also specified an approximate average maximum shear wave velocity of 1,000 feet per second, and an average unit weight of 130 pcf in our simplified analysis. 7.4 Phreatic Surface Assumption We compared the phreatic surfaces assumed within the embankment in the S&W 1966 slope stability analyses and in the Wahler 1976 seismic stability evaluation with our interpretation of recorded piezometric measurements. Such comparison indicates slight differences between our and the earlier interpretations, or reflects improved readings from the piezometers that have been replaced since While such readings have been consistent in recent years, all piezometers are open-standpipe instruments and cannot reliably assess actual pore pressures at specific locations within the embankment or foundation. Hence, there could be some uncertainty associated with past and current interpretations of the position of the phreatic surface within the embankment, which does not seem to be influenced by the intended dam zoning. The phreatic surface interpreted in earlier studies was higher in the upstream shell and core, but slightly lower in the D/S shell than presently assumed. S&W and Wahler took a nearhorizontal surface to represent the water level in the U/S shell and in the U/S half of the core, and then assumed a sloping near-planar phreatic surface, extending from about the center of the core to slightly beyond the lower D/S berm, and then reaching the D/S toe at a flatter slope angle. From our interpretation, the average phreatic surface drops at a flatter slope, nearly constant from the U/S face of the dam to the downstream toe (see slope stability analysis model), see Figure 7.3. Hence, our interpreted phreatic surface is lower than was defined by S&W and Wahler in the U/S shell, but slightly higher in the D/S shell. Such differences should have little impact on the results of the slope stability analyses. In summary, we draw two conclusions from our updated interpretation of the phreatic surface: First, the core does not lower the phreatic surface within the embankment, as might normally be expectable from an impervious zone. This may be because the core and shells have similar coefficients of permeability, due to their high fines content, or because of stratification. Hence, the zoned Lafayette Dam functions as a GEI Consultants
87 Dynamic Stability Review of Lafayette Dam East Bay Municipal Utility District 08/16/05 homogeneous embankment regarding the location of the phreatic surface within the dam section. Overall, the phreatic level within the D/S half of the embankment is rather high, considering the high clay content and expected low permeability of the embankment materials. This could indicate that some seepage may travel through zones affected by the 1928 failure, or that the embankment collects surface runoff from the crest and side hills. Overall, other than potentially making the local clays more plastic, the seepage through the embankment, as indicated from the seepage collection systems, is quite low, and is considered to represent satisfactory performance of the embankment. 7.5 Updated Slope Stability Analysis Analysis Properties Our analyses for steady-state seepage (normal operating) condition are based on effectivestress strength parameters (c, Φ ), developed from updated interpretation of the available isotropically-consolidated undrained (ICU) or anisotropically-consolidated undrained (ACU) triaxial (TX) tests. Because of the clayey nature of the embankment and foundation materials, we considered the use of the undrained shear strength (S u ) for the slope stability analyses, but did not use such an approach because it is impractical to reliably define increases in S u as a function of depth in the slope stability model, where deep surfaces of failure need to be considered. Also, the variability of the measured S u s makes it difficult to select truly representative values. Wahler reported that disturbance did occur during the sampling process, especially for deep samples, and that the S u s obtained from unconfined compression (UC) or unconsolidatedundrained (UU) triaxial tests might significantly underestimate the actual strength available at the depth where the samples were recovered. Yet, Wahler compared S u s in the core, shell and foundation materials, as obtained from UC, UU, or TXICU and TXACU laboratory tests (see Drawing V-2 of the 1976 report) and defined approximate linear increases in S u as a function of the consolidation pressure P o. Because these S u -P o average relationships seem primarily controlled by the CU data, we concluded the use of the effective stress strength parameters derived from the CU tests would be more reliable than direct use of undrained shear strengths. For slope stability analyses for rapid drawdown condition and to determine yield acceleration coefficients (for conditions representing those that might occur when a slope GEI Consultants
88 Dynamic Stability Review of Lafayette Dam East Bay Municipal Utility District 08/16/05 under steady-state condition is subjected to undrained loading such as an earthquake), we performed analyses based on total-stress shear strength envelopes (c, Φ) obtained from the CU triaxial tests Analysis Model and Results We performed slope stability analyses for both the upstream and downstream slopes of Lafayette Dam. We used the computer program XSTABL, version 5.2 (ISD, Inc., ) for this purpose. The program calculates slope stability using a limit equilibrium analysis based on the method of slices. The program calculates the forces that would cause and the forces that would resist movement of a soil mass bounded by a postulated failure surface. The program automatically defines the most critical postulated failure surface through a searching routine. In XSTABL, several methods of slope stability analysis can be activated. These methods are derived from the standard method of slices and Bishop s method. The searching routine employs either the simplified Bishop or Janbu (1954) s methods of analyses. The Janbu method is particularly useful to analyze the influence of partial submergence and drawdown conditions and, as needed, the effect of tension cracks and surcharge. More rigorous methods, such as Spencer s Method (1967), the General Limit Equilibrium Method or Janbu s Generalized Method of Slices may be subsequently used in XSTABL to further assess the safety evaluation of any single surface. We successively implemented the Janbu and Spencer s methods of analysis. Searches for critical surfaces were performed using Janbu s method, and the critical failure surfaces were then reevaluated using Spencer s method. Spencer s method is based on cylindrical failure surfaces and satisfies two equations of equilibrium, the first with respect to forces, and the second with respect to moments. It assumes parallel inter-slice forces. For pseudo-static seismic analysis, we represented inertial forces due to the earthquake loading with a constant horizontal acceleration coefficient (a H ). As is often done in conventional slope stability analyses, we did not use a vertical acceleration coefficient (a V ). Our slope stability analysis model is shown on Figure 7.3. As previously discussed, we combined Zone 4 and Zone 4.5 of the DSOD model (Figure 7-2) as a single Zone 4. The phreatic surface interpreted from the piezometric readings is shown on Figure 7.3. A summary of the computed factors of safety is provided in Table 7-4. We obtained comparable factors of safety for either Janbu or Spencer s methods, and Table 7-4 applies to either of these two methods. The PMF load case, normally considered for dams, was outside the scope of our review. Slightly higher factors of safety were computed in Spencer s Method. For steady-state seepage static condition and a reservoir elevation at El. 449, the lowest factor of safety we calculated is 2.3 for the downstream slope, and 2.5 for the upstream slope. These values GEI Consultants
89 Dynamic Stability Review of Lafayette Dam East Bay Municipal Utility District 08/16/05 confirm the satisfactory performance of the embankment to-date. For partial rapid drawdown condition (repeat of the maximum historic reservoir drawdown to El. 431), we calculated a minimum factor of safety of 2.0. We also postulated a rapid complete drawdown to the elevation of the lowest outlet port, and obtained a minimum factor of safety of 1.7. As this review was primarily intended to assess the seismic stability of Lafayette Dam, we have presented detailed results only for the pseudo-static analysis cases and, especially, as used to verify K y, the yield acceleration. K y was obtained using the total-stress method of analysis by progressive increase of the pseudo-static acceleration, starting from the most critical surfaces obtained in a static analysis with the total stress strength parameters, until a factor of safety equal to or less than 1.0 was obtained. Hence, K y is the a H that corresponds to a factor of safety of exactly 1.0. Multiple trial failure surfaces were then re-analyzed with K y to assure that the most critical surface had been found. Cross sections of the dam showing the locations of the most critical surfaces (a H = K y ) are shown on Figure 7-4 for the upstream slope, and on Figure 7-5 for the downstream slope. A yield acceleration of 0.29g was computed for the upstream slope in both the Janbu and Spencer methods of analysis, using total stress strength parameters. The critical failure surface is entirely located within the embankment materials. This is not surprising, as the assigned total strength parameters are higher for Zone 5 than for the core (Zone 1) or upstream shell (Zone 3) materials. For the downstream slope, we obtained a yield acceleration of 0.14g. The corresponding failure surface passes through the foundation Zone 4, which has a lower assigned strength. Zone 4 of our model combines Zones 4 and 4.5 of the DSOD model. The existing field and laboratory data may be insufficient to properly define the strength of the downstream alluvium for the earthquake loading condition. For this reason, we have selected a conservative strength estimate, based on the available field penetration data and laboratory testing results which suggest that weaker materials might still be present. For deformation analysis purposes, we took a K y of 0.29g for the upstream slope, and K y of 0.14g for the downstream slope. Hence, the assumed weaker alluvium materials will influence our seismic analyses of the downstream slope. 7.6 Evaluation of Liquefaction Potential The liquefaction potential of the various dam zones was reviewed. No loose saturated silts or sands, generally acknowledged the most susceptible to liquefaction, have been encountered in the borings. The embankment materials are classified as clays, sandy clays, or silty clays. CL and CH are the dominant soil classifications in dam and foundation materials, with ML occasionally encountered. Neither continuous layers nor significant lenses of clean GEI Consultants
90 Dynamic Stability Review of Lafayette Dam East Bay Municipal Utility District 08/16/05 sands or silts have been reported in the previous field investigations. Shannon and Wilson (S&W, 1966) reported that the soils encountered at the site are not sensitive to earthquakes. as would be sensitive clays or loose sands and W.A Wahler and Associates (WA, 1976) concluded that, in these materials, no instantaneous or sudden loss of strength occurred during the dynamic testing and that significant liquefaction would not occur. Using the Modified Chinese Criteria (Zhou, 1981) and a modified version of these criteria (Andrews and Martin, 2000), the DSOD concluded that the embankment and foundation soils are not expected to liquefy, due to high clay content and liquid limit. In his review, Dr. Idriss indicated his belief that the Chinese criteria should not be used for cohesive soils. Yet, the clayey characteristics and plasticity indexes of the local materials can be used in recently updated approaches to further evaluate whether or not these would be susceptible to liquefaction. Average plasticity index (PI) is 30 in the core materials, 15 in the D/S shell (Zone 2) and 22 in the U/S shell (Zone 3). The PI ranges from 18 to 21 in the foundation materials, depending on which zone is considered. A new classification has been proposed by R.B. Seed, at al. (2003) to replace the Modified Chinese Criteria and the percent fines rule, which are based on one single key parameter. This new interim classification of liquefiable soil types is based on two key parameters, the LL and PI. As S&W and Wahler performed numerous Atterberg limits (AL) tests, we recompiled these data and plotted them on a reference chart that provides a way to quickly assess if the soils are liquefiable, see Figure 7-6 (S&W data) and Figure 7-7 (WA data). We also prepared similar plots, zone-by-zone (see Appendix E). Most AL tests on the dam and foundation soils fall outside of Zone A ( classic cyclic liquefaction) or Zone B (potentially liquefiable). The core (Zone 1) materials clearly fall outside Zone A or Zone B. Three data points for the downstream shell (Zone 2) are within Zone A or Zone B. One data point for the upstream shell (Zone 3) is within Zone B and another is on the boundary. Over half of the data points for the foundation (Zones 4, 4.5 and 5) fall within Zone A or Zone B. However, only one of the data points within Zones A or B fails the supplementary test [ w (%) > 0.8 LL ] regarding liquefaction susceptibility. Hence, based on AL tests and the high clay content of all the materials encountered in Lafayette Dam and its foundation, we conclude that the embankment and foundation materials are not susceptible of liquefying by sudden loss of strength. 7.7 Computed Earthquake-Induced Deformations No detailed response analyses of Lafayette Dam were included in this review. However, we implemented several simplified or empirical procedures to obtain estimates of potential earthquake-induced deformations as a result of the MCE earthquake scenarios the most critical to Lafayette Dam. These methods include: Newmark (1965); Makdisi-Seed (1977); Bureau, et al. (1985, 1987); Jansen (1987); and Swaisgood (1995, 1998). We also implemented a modified Makdisi-Seed s procedure, based on recommendations made by Dr. GEI Consultants
91 Dynamic Stability Review of Lafayette Dam East Bay Municipal Utility District 08/16/05 Idriss in his review of our draft report (letter-report to GEI from I.M. Idriss, dated August 31, 2004). Such approach, referred herein as the Idriss procedure, replaces the dam crest and failed soil mass accelerations iteratively computed from the specified response spectrum in the Makdisi-Seed s method by estimates derived from empirical correlations between base and crest peak horizontal accelerations obtained on several existing dams during historic earthquakes. Three of the methods implemented use the yield acceleration (K y ) as an input parameter, hence provide different displacement estimates for the upstream and downstream slopes. The two slopes were successively considered. The other methods depend on the energy content of the specified input motion and calculate crest settlements, hence provide a single estimate for a specified dam configuration and postulated earthquake scenario. Other assumptions significant to the implementation of the above procedures are briefly discussed below. A more detailed review of these procedures can be found in Appendix F. Dynamic Strength Reduction Factor As is customary for earthquake-induced deformation estimates in clayey materials, the computed yield accelerations (K y ), which were based on undrained (total-stress) Mohr- Coulomb strength envelopes, were reduced by 20 percent in our slope deformation analyses to account for any loss of strength under cyclic loading and initiation of possible soil movements. This procedure approximates the reduction in strength proposed by Makdisi and Seed (1978) for the K y calculations. Dr. Idriss suggested an initial 15 percent reduction of the static strength due to shaking. Such reduction was specifically applied in his procedure, in lieu of the 20 percent used in some of the other methods. Dr. Idriss further suggested that, if considerable displacements were calculated (say one foot or so for a few cycles of shaking), the strength would have to be reduced to a residual value, best established based on in-situ shear vane tests. As no information on the residual strength was available in the data reviewed and no time-history analysis was performed, such additional correction was not implemented, but suggests that deformations computed in Dr. Idriss and other methods based on the concept of yield acceleration K y could be potentially underestimated. Instead, we used a conservative reduction of the calculated K y s, in recognition of such uncertainty. Influence of Foundation Alluvium Except for Swaisgood s method, the simplified analyses implemented do not consider the presence of the potentially deformable foundation alluvium. Therefore, we first obtained lower-bound deformation estimates by assuming that Lafayette Dam is founded on a rigid foundation, then upper-bound estimates by assuming the plastic foundation alluvium to be part of the embankment (hence, we assumed an equivalent 222-foot high dam). GEI Consultants
92 Dynamic Stability Review of Lafayette Dam East Bay Municipal Utility District 08/16/05 Crest Settlement Versus Displacements As some methods calculate maximum displacements along postulated failure surfaces, while others directly calculate maximum crest settlements, all results were approximately converted to crest settlements by assuming that the maximum crest settlement would be half of the corresponding computed maximum displacement. The factor 0.5 was selected after observing that maximum displacements reported after the 1928 failure were more than twice the maximum crest settlement, and based on experience of GEI s Project Manager with detailed nonlinear dynamic response analyses of six embankment dams. For such timehistory analyses, performed from 1994 to 2001 by Mr. Bureau when employed by Dames & Moore, the average of the ratios of computed crest settlement and maximum slope displacement calculated from these studies was Results We obtained best estimates by averaging crest settlements obtained with the upstream or downstream yield accelerations, and for all procedures implemented. The results of our analyses are summarized in Table 7-5 for each of the earthquake scenarios considered, and are presented in more detail in Appendix F, Tables F-1 to F-4. As expected, a wide range of deformations is predicted by the different methods, which all have limitations and apply to a range of conditions broader than considered herein. The results of the simplified Newmark, Seed-Makdisi and Idriss procedures are strongly influenced by the computed yield acceleration of the downstream slope. Idriss procedure leads to considerably lower deformations than obtained in the Makdisi-Seed s procedure, due to a lower estimated crest and resulting failed soil mass accelerations (crest accelerations: Idriss, 0.76g; Makdisi-Seed, 1.08g or 1.33g, depending on whether the alluvium is included or not). All computed or estimated crest settlements are significantly less than the available freeboard, but upper-bound estimates (dam + alluvium) range from about 2 feet to 7 feet, or about five percent of the dam height (132 feet), for the most demanding earthquake scenario. Because the computed crest settlements are based on the combined deformations of the embankment plus alluvium, the corresponding cumulative strain levels in these materials should be less than about 3 percent. Without rigorous consideration of the residual strength (which might increase displacement estimates), the procedure recommended by Dr. Idriss leads to downstream slope deformation estimates ranging from 0.5 feet (U/S slope) to 2.6 feet (D/S slope), for the most critical earthquake scenario. GEI Consultants
93 Dynamic Stability Review of Lafayette Dam East Bay Municipal Utility District 08/16/05 Hayward Earthquake After considering all the procedures implemented as a whole, our best (weighted) estimates of crest settlements for the Hayward Earthquake, which is the most critical earthquake scenario considered, vary from 0.9 to 4.5 feet. An average crest settlement of 2.7 feet represents our preferred mean prediction. We have chosen the term preferred to indicate that we have simultaneously considered several methods to compute deformations or settlements. Such methods involve simplified procedures, which all have limitations on how they can be applied to specific seismic, embankment and foundation conditions. Important factors, such as the presence of the alluvium and how the seismic loading would be truly applied, are only approximately or not taken into account in these procedures. Our use of preferred average settlement estimates is intended to reduce the potential margin of error associated with the lowest or largest estimated dam movements. Other Earthquake Scenarios We did not use the Idriss procedure for the other earthquake scenarios, as they all resulted in significantly lower crest settlement estimates than for the Hayward Earthquake. Based on the results obtained for the Hayward MCE, including the Idriss procedure in our averaging process would lower the preferred estimates described below by about 10 percent. For the Calaveras Earthquake, our mean estimates range from 0.8 to 2.4 feet, with a preferred prediction of 1.6 feet. For the San Andreas Earthquake, we estimated crest settlements between 0.2 and 2.8 feet, with a preferred estimate of 1.5 feet. This result actually compares well the 2.0 to 3.0 feet previously obtained in 1976 for the San Andreas event by Wahler, probably because our recommended San Andreas response spectrum and the response spectrum of Earthquake B used by Wahler have reasonably compatible energy content in the range of frequencies of interest to Lafayette Dam. Lastly, we calculated a range of settlements between 1.0 and 5.3 feet for the Lafayette-Reliez Valley Earthquake, and a preferred estimate of 2.2 feet. The average crest non-recoverable settlements obtained in our simplified analysis are substantially less than the available freeboard (17.8 ft). Hence, Lafayette Dam is likely to safely retain the reservoir under the MCE. Our analysis procedures, under the most conservative analysis conditions, result in estimates that range from several feet to about a quarter of the magnitude of the dam crest settlements and slope movements that occurred in 1928 (which averaged about 20 and 40 feet, respectively). While such numbers suggest a condition less critical than previously encountered during construction, these computed displacements are large enough to partially or totally mobilize the residual shear strength, which was taken into consideration based on approximate strength reduction factors and not on measured values. GEI Consultants
94 Dynamic Stability Review of Lafayette Dam East Bay Municipal Utility District 08/16/05 Overall, Lafayette Dam is reasonably safe for the MCE, considering its large operating freeboard and wide crest. However, actual behavior of this dam may not be predicted with sufficient accuracy through simplified analysis procedures, considering the relatively high potential earthquake loads to which it is exposed. Because the foundation soils were the main contributor to the dam failure in 1928, earthquake-induced seismic deformations would also likely involve both the dam and underlying foundation alluvium, thereby increasing the combined crest settlements. It is not clear whether the failure surface of the 1928 represents a potentially weaker, thin zone within the dam section. Such failure surface was not clearly identified in the previous field investigations, other than through recognition that several zones are present within the alluvium. While the foundation alluvium has undoubtedly gained strength under the loading provided by the dam body, and excess pore water pressures caused by the added weight of the newly constructed dam have now dissipated, we believe that, based on the history of this dam, further investigation would be desirable to confirm the in-situ strength of the downstream portion of the alluvium, and demonstrate that unacceptable non-recoverable deformations cannot be induced by extreme earthquake scenarios. 7.8 Review of 1976 Cyclic Triaxial Test Data W.A. Wahler & Associates (Wahler) performed in 1976 stress-controlled and straincontrolled cyclic triaxial tests. The Wahler dynamic testing laboratory was long considered as being one of the best-equipped and best-experienced to perform such tests. The stresscontrolled cyclic tests were performed on isotropically consolidated (K c =1) or anisotropically consolidated samples (K c =1.5), for various confining pressures (σ 3 ). Tests were performed on the core, shell and foundation materials, and were used as a basis to compute the strain potential in some elements of the 1976 finite element model. None of the specimens tested experienced instantaneous or sudden loss of strength, consistent with the clayey nature of the Lafayette Dam and foundation materials. These test results suggest that a similar behavior (no classic liquefaction) would likely be observed in the field. Using the data presented in the Wahler report, it is possible to define cyclic strength curves based on the cumulative number of applied uniform cyclic deviator stress cycles when the samples tested reached 5 percent, 10 percent axial strain, or other interpolated or extrapolated axial strain levels. For example, from the Wahler cyclic triaxial tests results and based on the cyclic deviator stress plots presented in the 1976 report, we calculated the laboratory cyclic stress ratios (CSR) causing 10 percent axial strain in the tested specimens at 10, 15, 20 and 30 cycles, see Table 7-6. However, laboratory cyclic triaxial tests do not represent field conditions as well as simple cyclic shear tests would do. Yet, the CSR causing a specified level of axial strain in the laboratory tests (σ dc /2σ 3 ) can be approximately related to the field CSRs (τ h /σ v ) under multi-dimensional shaking conditions by the following expression: GEI Consultants
95 Dynamic Stability Review of Lafayette Dam East Bay Municipal Utility District 08/16/05 τ h / σ v = C r σ dc / 2σ 3 In such equation, τ h represents the earthquake-induced horizontal shear stress, σ v the vertical effective overburden pressure, σ dc the applied deviatoric cyclic stress in the laboratory sample, and σ 3 is the lateral initial consolidation stress of such sample. The correction coefficient C r varies from about 0.6 for K o = 0.4, to about 0.9 to 1.0 for K o = 1, where K o designates the coefficient of earth pressure at rest (Seed and Idriss, 1982). Overall, there seems to be little variability, relatively to each other, in the cyclic strengths of the foundation alluvium, shell or core materials. As Wahler did in 1976, we interpreted some of the cyclic strength data based on trends as, at some confining stress levels, not enough samples were tested to fully define cyclic strength curves. The downstream foundation alluvium (Zone 4) shows lower laboratory CSRs than the upstream foundation (Zone 5). Based on only two series of cyclic triaxial tests performed for the core materials, one series (6,000 psf) resulted in the lowest CSR at N equal 15 or greater, compared with the alluvium or the downstream shell materials, while the other (3,000 psf) led to higher CSRs than these other materials. Few samples were tested in the shell materials (Zone 2), but most of these tests yielded laboratory CSRs higher than for the other materials. Additional details are provided in Appendix E. Our slope stability analyses and the simplified methods we used to obtain earthquakeinduced deformations did not require cyclic strength curves to make a preliminary assessment of the performance of the dam. Cyclic shear strength data are normally used for interpreting the results of more detailed numerical analyses, and we do not know K o and have no reliable field CSRs. However, we computed the CSRs for an equivalent reference magnitude of 7.5 (CSR eq ), using H.B. Seed s simplified method as updated by Idriss (1999). While a detailed direct comparison of these CSR eq s with field CSRs converted from the laboratory CSRs (C r σ dc / 2σ 3 ) shown in Table 7-6 is of limited value, considering the uncertainties of such simplified methods, we concluded that the CSR eq s, converted to the reference magnitude of 7.5 and estimated for the Hayward Earthquake (M w 7.25) by the simplified Seed-Idriss procedure equal or exceed the laboratory CSRs causing 10 percent axial strain or greater and corrected for field condition, for an equivalent number of applicable stress cycles (N=15). Hence, the above simplistic comparison suggests that simplified analysis procedures are not sufficient to fully assess the seismic performance of Lafayette Dam. Appreciable earthquakeinduced deformations appear to be possible, under some of the severe earthquake scenarios postulated, and should be further evaluated. GEI Consultants

96
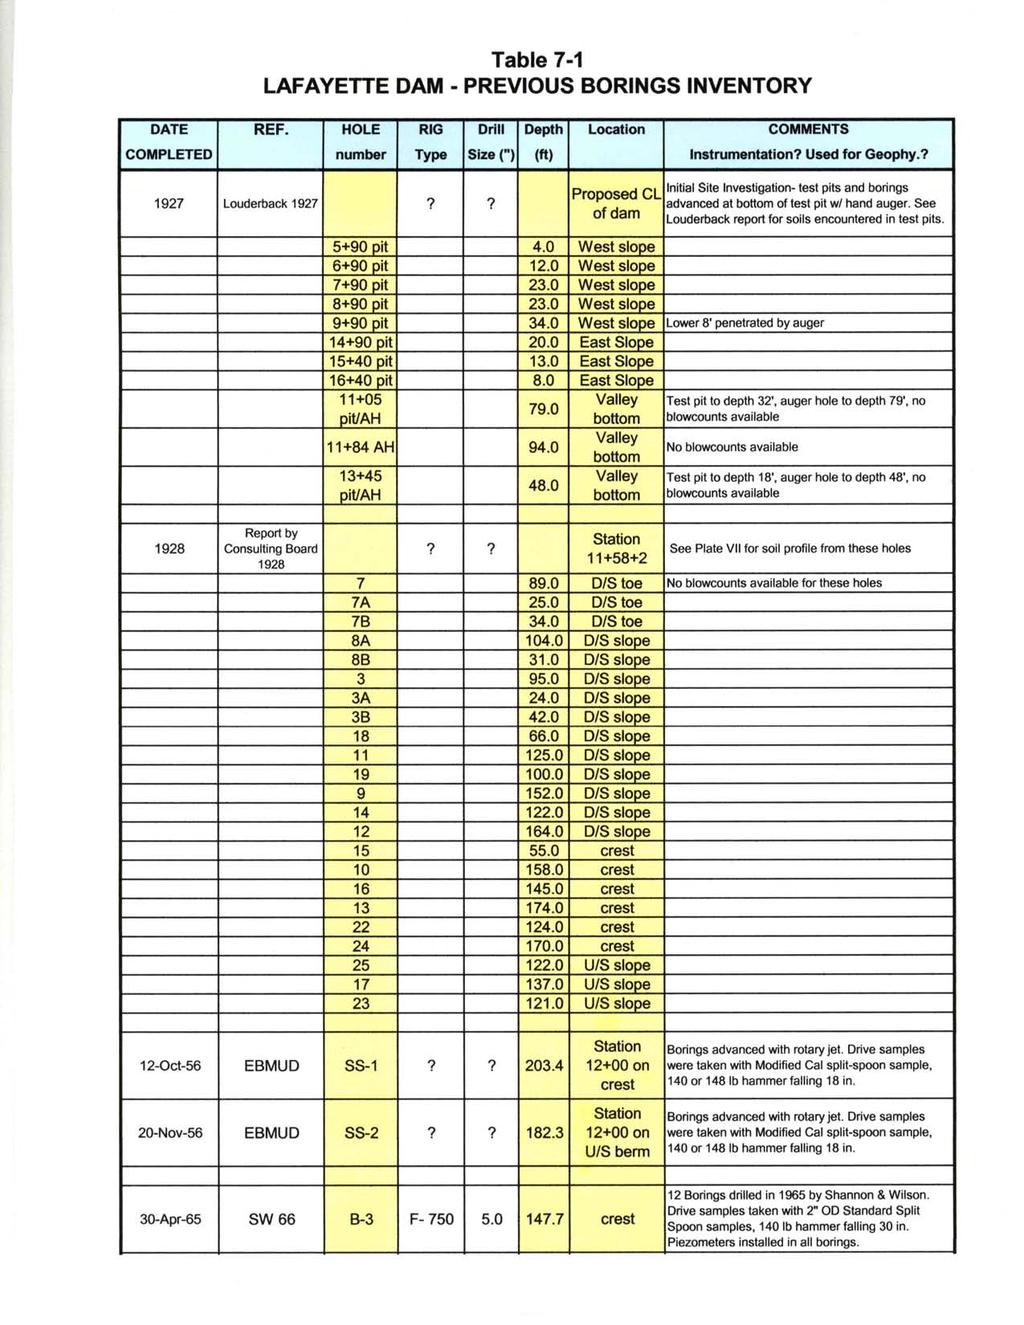
97
98

99
100
101
102
103
104
105
106
107
108
109
110 Dynamic Stability Review of Lafayette Dam East Bay Municipal Utility District 08/16/05 8. ADEQUACY OF MAINTENANCE AND METHODS OF OPERATION 8.1 Operation, Maintenance and Surveillance Procedures Operational procedures that relate to project safety were briefly outlined in Section 2.4 of this report. Our inspection indicated no conditions that would require emergency action or changes to the current operational procedures. Project facilities are visited regularly and maintenance is scheduled as needed. During the last twenty years, maintenance of the dam has been regular and cosmetic, and has simply involved installation of new piezometers. The maintenance performed on the dam appears adequate with regard to maintaining this dam in excellent condition. The surveillance program appears to be adequate. 8.2 Evaluation No emergency maintenance measures are required for public safety under normal operating condition. We did not identify any inadequacy of methods of operation that would potentially affect public safety. Based on the results of this review, we do not recommend any changes in maintenance procedures or methods of operation. GEI Consultants
111 Dynamic Stability Review of Lafayette Dam East Bay Municipal Utility District 08/16/05 9. CONCLUSIONS This section summarizes the findings of our inspection and seismic stability review of Lafayette Dam. This work was carried out in accordance with current, generally accepted simplified procedures for dam safety evaluation. The purpose of this evaluation was to assess the seismic safety of the structure for continuing operation in the interest of the District s water system requirements and maintenance of public safety, based on existing data. No additional field exploration, laboratory testing, or detailed numerical analyses were included in the scope of work. Our conclusions are based on observations and findings drawn from: (1) a detailed review of existing project files, made available to the project team by the District and the DSOD; (2) visual and geologic inspections of Lafayette Dam and adjacent areas, including the reservoir perimeter; (3) review of project maintenance, operation, and instrumentation monitoring records; (4) review of the seismic setting of the site and the development of response spectra for the most critical MCE scenarios applicable to this site; and (5) performance of slope stability analyses and simplified evaluations of potential earthquake-induced deformations. Our safety review focused on the dam embankment and evaluating its ability to impound the reservoir in regard to its adequacy against possible catastrophic failure due to earthquakes. Other natural phenomena, such as flooding or excessive precipitation, were not investigated but are of lesser concern for this site because the drainage area is small and the reservoir is mostly filled with imported water, rather than with natural stream flow. The outlet tower, which also serves as spillway, was not included in our review, but has been shown by others to have insufficient seismic capacity. No consideration has been given or is intended to those public safety aspects of the project features other than the dam stability. 9.1 Construction History Lafayette Dam experienced in 1928 a major downstream slope failure during construction, and was built to a lower crest elevation than originally designed, keeping the final crest essentially at the same width and elevation as the incomplete embankment after failure. The dam has satisfactorily performed since. The embankment was built on a thick layer of plastic clayey alluvium, up to an average of 90 feet deep below the central portion of the dam. The foundation alluvium was the primary cause of failure during construction, according to the report that was prepared by a renowned Consulting Board who investigated the failure. The failed embankment and foundation materials were not removed. Construction was completed by leveling the crest of the failed dam, by backfilling failure cracks, and by flattening the downstream slope by placement of additional fill. Such procedures would be unacceptable GEI Consultants
112 Dynamic Stability Review of Lafayette Dam East Bay Municipal Utility District 08/16/05 by today s standards in dam construction. The failed materials have stabilized shortly after the end of construction, and have undoubtedly consolidated and gained strength over time. 9.2 Assessment of Dam and Reservoir Perimeter The reservoir is used for emergency backup water supply and is only subject to minor level fluctuations. A substantial freeboard (17.8 feet) is maintained. The watershed area is very small. All reservoir water is imported and no significantly stream inflow can occur, which essentially eliminates risks of flood overtopping or uncontrolled spillway releases. Lafayette Dam is well maintained by the District staff and in good visual condition. No signs of instability or inadequacy of the embankment that would require emergency remedial action were observed. Seepage levels are minimum and consistent with the norms for the dam and reservoir level. The limited seepage is not detrimental to the safety of the dam and is continuously monitored. Recent geologic literature mentions discontinuous lineaments and possible inferred faulting in the immediate project vicinity. As discussed in this report, such features do not seem to represent a threat to the dam. The inferred faults are short, and one that has been shown to potentially intersect the dam footprint is parallel, rather than perpendicular to the dam crest. Hence, if further confirmed, it would unlikely be critical in terms of direct or sympathetic relative movements, because of its short length and favorable orientation. 9.3 Adequacy of Instrumentation, Monitoring of Instrumentation and Surveillance The instrumentation and dam monitoring program are adequate. The existing seepage measurement systems properly monitor seepage flows. Several piezometers show high readings and fluctuations during the wet season, possibly due to contributing surface runoff. Horizontal and vertical crest or slope movements have been insignificant for many years, and are continuously monitored. The settlement and movement surveys are inconsequential for a dam over 76 years old. Methods of project operation relating to public safety are adequate. GEI Consultants
113 Dynamic Stability Review of Lafayette Dam East Bay Municipal Utility District 08/16/ Adequacy of Operation of Spillway and Outlet Works There is no separate spillway at Lafayette Dam, and infrequent releases are performed through the uncontrolled upper 2.5 by 3 open port in the outlet tower. The seismic stability of this tower has been questioned in recent studies initiated by the District. Emergency release of the reservoir water, should it be required after an earthquake for upstream slope inspection or safety purpose, might be impaired or impossible due to potential tower failure. Outflow of reservoir water through the outlet pipes and conduits, could be either uncontrolled or impaired by clogging of these elements by tower debris. We did not evaluate the seismic safety of the outlet conduit. 9.5 Updating of Seismic Criteria The response spectra developed for the Hayward and Lafayette-Reliez Valley faults, which are potentially the most critical to this site, are significantly more demanding in the range of periods of interest to the response of Lafayette Dam and foundation than the response spectrum of the acceleration time history used in 1976 to represent a Maximum Probable Hayward Earthquake; The input history used at that time to represent a Maximum Probable San Andreas Earthquake was sufficiently conservative. 9.6 Assessment of Material Properties No loose saturated silts or sandy silts, generally acknowledged to be the soil types the most susceptible to liquefaction, were encountered in the existing borings. We concluded that the embankment and foundation materials are not liquefiable. The available data may be insufficient to properly define the strength of the downstream foundation alluvium (Zone 4), where existing field penetration data and laboratory testing results suggest that weaker materials might be present. It is not clear whether the alluvium in that area has developed sufficient additional strength to withstand major earthquake loads. Possible reactivation of movement along the 1928 failure surface, which was not clearly identified in the borings drilled in the 1966 and 1976 investigations, is unlikely but remains a candidate potential failure mode under extreme seismic loading. As was concluded after the 1928 failure, it may still be that although the dam had come to rest, there is no evidence that the alluvium has lost its ability to move under sufficient load (Consulting Board, 1929). GEI Consultants
114 Dynamic Stability Review of Lafayette Dam East Bay Municipal Utility District 08/16/ Assessment of Previous Analyses We concluded that the equivalent-linear dynamic analyses performed in 1976 might not fully capture the possible response of Lafayette Dam, due to insufficient refinement of the finite element mesh used to represent the dam and its foundation. 9.8 Simplified Stability Analysis and Adequacy of Factors of Safety We have reanalyzed Lafayette Dam to assess stability under normal reservoir operating and rapid drawdown conditions and found it to have adequate stability and factors of safety in compliance with the requirements of modern dam safety evaluations. Pseudo-static loading conditions and simplified deformation analysis suggest that the dam should have adequate seismic stability and reserve freeboard. Our best estimates of potential non-recoverable earthquake-induced deformations, for the most critical earthquake scenario, suggest crest settlements of up to less than 3 feet. Hence, Lafayette Dam is likely to maintain sufficient freeboard, as the dam is normally operated with a freeboard of 17.8 feet. The most critical hypothetical failure surfaces considered for the downstream slope of the dam would potentially include both that slope and the underlying foundation alluvium. Three simplified methods of analysis predicted upper-bound deformations that were approximately converted into crest settlements of 4 to 7 feet. Such settlements include the combined contributions of both embankment and alluvium deformations. Estimated displacements are large enough that they could induce progressive degradation of the undrained strength of the affected zones. This was only considered in a simplistic fashion in several of the procedures (those based on K y ) implemented in this review by assuming that the degraded strength would be about 80 percent of the original strength. Conclusions similar to those described above were derived after comparing field cyclic stress ratios (CSRs) for an equivalent reference magnitude (M 7.5) with laboratory cyclic stress ratios causing 10 percent axial strain in 15 uniform stress cycles. In the case of the Hayward Earthquake, most equivalent field CSRs would equal or exceed the laboratory CSRs causing 10 percent axial strain or greater, after correction for field condition, for the number of cycles applicable to the reference magnitude. Hence, the cyclic triaxial test results available for Lafayette Dam suggest that simplified procedures may be insufficient to fully assess the seismic performance of the dam. Appreciable earthquake-induced deformations appear possible, under the severe earthquake criteria postulated, and suggest that more detailed evaluation of the in-situ strength of the downstream foundation alluvium is desirable. GEI Consultants
115 Dynamic Stability Review of Lafayette Dam East Bay Municipal Utility District 08/16/ RECOMMENDATIONS Despite the high risk rating of Lafayette Dam and its seismic setting, we have found no condition that requires immediate action (Priority Level 1). However, based on our review and the limited analyses performed, we recommend that the District consider deferred implementation of some action items to allow assessment of the seismic performance of Lafayette Dam with greater reliability. Such lesser priority action items have been assigned either a moderate (Priority Level 2), or a low level of priority (Priority Level 3). Action items assigned a Priority Level 3 can be deferred until a related change of condition is observed, suspected or concluded likely in future inspections or safety reviews Recommendations for Optional Geologic Investigations Lineaments: The series of lineaments observed in the vicinity of the dam could be better characterized to determine their most likely cause of formation and, if found to be faultrelated, to help assess the associated rate of activity. However, because these lineaments appear to have negligible potential impact on the dam if they were confirmed, such action item was not assigned any priority level. Should future changes in the understanding of the local geologic and tectonic setting occur that would justify a need to better identify such features, the discontinuous lineaments closest to the dam could be investigated by means of additional geologic fieldwork, including detailed surface mapping. If suitable trenching sites were identified, subsurface exploration could be performed across discrete lineaments to help determine the reason(s) of their existence. Landslides: Many of the large landslides along the reservoir rim are in a low slope position and do not appear active. However, to a limited extent, there is always an unknown potential for reactivation during periods of elevated ground water or in response to strong ground shaking. The District should consider the long-term benefits of investigating the landslides closest to the dam (Priority Level 3), in order to assess any need to develop some mitigation alternatives to reduce any damage potential that could be associated with continued or renewed movements. Of course, a higher priority level would be re-assigned to such action item, if any signs of landslide reactivation were observed during future inspections. Should signs of reactivation become apparent, the old landslide adjacent to the east margin of the dam should be immediately evaluated through additional geologic fieldwork for potential impact on the lower portion of the embankment. A complete evaluation would include preparation of geologic maps and cross sections to establish the probable volume and dimensions of this landslide, and assess whether it could impact a larger portion of the dam in case of enhanced reactivation during earthquake loading. GEI Consultants
116 Dynamic Stability Review of Lafayette Dam East Bay Municipal Utility District 08/16/ Recommendations for Optional Field and Laboratory Investigations Strength Parameters for Foundation Alluvium: Existing field penetration data and laboratory test results in the alluvium below the downstream slope of Lafayette Dam indicate that these materials are weaker. As was the case in 1928, such alluvium materials may control the overall seismic stability of Lafayette Dam. As the information in that area is limited, further field and laboratory testing in that area would be desirable (Priority Level 2). Field exploration methods that would facilitate recognition of any thin and potentially weaker zones, including the old failure surface, should be considered. Cone penetration testing (CPT) could be a rapidly implemented and cost-effective way to perform such investigations. CPT would be supplemented with SPTs for correlation purposes. Completion of in-situ vane shear tests at various depths and a number of locations would also be essential. The primary purpose of the vane shear tests would be to define the in-situ residual strength of the clayey materials, which cannot be established from correcting existing blowcount data because of the highly clayey nature of the materials encountered. The shear tests should be conducted in a manner consistent with measuring both the peak strength and ultimate (remolded or residual) strength. Thus, it would be important to conduct these tests at depths that contain no gravel. As new holes would to be drilled to conduct the shear tests, it would be beneficial to install some multi-stage piezometers, which would provide more reliable information than the existing open-standpipe piezometers Recommendations Regarding Stability Assessment Detailed Seismic Analysis: Lafayette Dam is a well-maintained facility, and appears to be seismically safe based on simplified analyses. However, because of several factors including (1) the dam failure during construction, (2) insufficiently complete existing information regarding the downstream foundation alluvium, and (3) the lack of a sufficiently rigorous and reliable seismic evaluation consistent with current standards, we recommend that EBMUD consider, if found desirable after the recommended field and laboratory investigations, a detailed reanalysis, that would use confirmed alluvium properties, modern computational techniques, updated acceleration time histories compliant with the recommended response spectra, and non-linear material properties and constitutive relationships that would simulate the probable behavior of the embankment and foundation materials more closely than was possible in 1966 or 1976 (Priority Level 3). The existing static dynamic laboratory testing data already available could be used to define dynamic properties and improved constitutive models, and to characterize the strength degradation characteristics of the dam and foundation materials under cyclic loading. The new CPT and vane-shear tests would be very useful to better define or confirm the parameters required for such analyses. Such information would be used, as needed, as input to a more detailed, and more reliable method of analysis than those used to date. GEI Consultants
117 Dynamic Stability Review of Lafayette Dam East Bay Municipal Utility District 08/16/ REFERENCES Andrews, D. C.A.; Martin, G.R. (2000), Criteria for Liquefaction of Silty Soils, Proceedings, 0312, 12 th World Conference on Earthquake Engineering. Borchardt, G. and Baldwin, J. N. (2001), Late Holocene Behavior and Seismogenic Potential of the Concord-Green Valley Fault System in Contra Costa and Solano Counties, California, in Ferriz, H. and Anderson, R. (eds.), Engineering Geology Practice in Northern California, Association of Engineering Geologists Special Publication 12 and California Division of Mines and Geology Bulletin 210, pp Bureau, G. (1996), Numerical Analysis and Seismic Safety Evaluation of Embankment Dams, ASCE, BSCES Geotechnical Group, 1996 Lecture Series, Dam Inspection, Analysis and Rehabilitation, November 2, Bentley College, Waltham, MA, Proceedings, 28 pp. plus Figures. Bureau, G.; Volpe, R.L.; Roth, W.R.; Udaka, T. (1985), "Seismic Analysis of Concrete Face Rockfill Dams", ASCE Int. Symp. on CFRD's, Detroit, Oct. 21, in "Concrete Face Rockfill Dams - Design, Construction and Performance", pp , and Closure (1987), ASCE Journ. of the Geotechnical Eng. Div., Vol. 113, No. 10, October, pp Consulting Board (1929), Report on Partial Failure During Construction of Lafayette Dam, East Bay Municipal Utility District, January 12. Crane, R. (1988), Geologic Maps of the Las Trampas Ridge and Walnut Creek, 7.5-minute quadrangles, 1:48,000 scale. Crane, R. (1995), Geology of the Mt. Diablo Region and East Bay Hills, in Sangines, E. M., Andersen, D. W., and Buising, A. V., (eds.), Recent Geologic Studies in the San Francisco Bay Area, Society of Economic Paleontologists and Mineralogists, Pacific Section Vol. 76, pp Dibblee, T. W., Jr. (1980, Preliminary Geologic Maps of the Briones Valley, Hayward, Las Trampas Ridge, Niles, and Walnut Creek, 7.5-minute quadrangles: United States Geological Survey Open-File Reports, 1:24,000 scale. DSOD (2003), Geologic Review of Seismic and Foundation Conditions Lafayette Dam, No. 31-2, Contra Costa County, Internal Memorandum by James L. Lessman, dated March 14, GEI Consultants
118 Dynamic Stability Review of Lafayette Dam East Bay Municipal Utility District 08/16/05 DSOD (1980), Phase I Inspection Report for Lafayette Dam, Report to Department of the Army, Corps of Engineers, Sacramento District, July. Dukleth, G.W. (1956), Lafayette Dam No. 31-2, Stability Study, Internal Memorandum to Mr. W.A. Brown, DSOD, March 8. East Bay Municipal Utility District (2002), Lafayette Reservoir Tower Seismic Upgrade Lafayette Reservoir No , letter to DSOD, with attachments, dated August 12. East Bay Municipal Utility District ( ), Lafayette Dam Foundation Investigation and Stability Analysis (1956), Internal Report, Foundation Design Section, November East Bay Municipal Utility District (1929), Revised Cross-Section Recommended by Consulting Board, EBMUD Drawing DH , January. Graymer, R. W., Jones, D. L., and Brabb, E. E. (1994), Preliminary Geologic Map Emphasizing Bedrock Formations in Contra Costa County, California A Digital Database, United States Geological Survey Open-File Report , 1:75,000 scale. Hart, E. W. (1981), Evidence for Recent Faulting, Calaveras and Pleasanton Faults, Diablo and Dublin Quadrangles, California, California Division of Mines and Geology Open File Report SF. Haydon, W. D. (1995), Landslide Hazards in the Martinez-Orinda-Walnut Creek Area. Contra Costa County, California, California Division of Mines and Geology (CDMG), Open-File Report 95-12, Landslide Hazard Identification Map No. 32, 1:24,000 scale. Idriss, I.M. (2004), Dynamic Stability Review of Lafayette Dam, letter-report to GEI, Draft 02, dated August 31, 2004, 9 pp. Interactive Software Designs, Inc. [ISD] ( ), XSTABL, Slope Stability Analysis Using the Method of Slices, Sharma, S., Version 5-206, Moscow, ID International Civil Engineering Consultants (1995), Seismic Response Analysis and Performance Evaluation of the Inlet/Outlet Tower of Lafayette Reservoir, Report prepared for East Bay Municipal Utility District. Janbu, N. (1954), Stability Analysis of Slopes with Dimensionless Parameters, Harvard Soil Mechanics Series, No. 46, 81 pp. GEI Consultants
119 Dynamic Stability Review of Lafayette Dam East Bay Municipal Utility District 08/16/05 Jansen, R.B. (1987), "The Concrete Face Rockfill Dam. Performance of Cogoti Dam under Seismic Loading", discussion of a paper presented at ASCE's Symposium on Concrete Face Rockfill Dams, ASCE Journal of the Geotech. Engineering Div., Vol. 113, No. 10, October. Kelson, K. I. (2001), Geologic Characterization of the Calaveras as a Potential Seismic Source in San Francisco Bay Area, California, in Ferriz, H. and Anderson, R. (eds.), Engineering Geology Practice in Northern California, Association of Engineering Geologists Special Publication 12 and California Division of Mines and Geology Bulletin 210, pp Langenkamp, D.L.; Nelson, J.S. (1973), Seismic Survey: P and S Wave Velocities, Lafayette Dam, Lafayette, CA, report to W.A. Wahler & Associates, Job NO. 5949,002.01, December. Lazarte, C. A.; Bray, J.D.; Johnson, A.M. and Lemmer, R.E. (1994), Surface Breakage of the 1992 Landers Earthquake and its Effects on Structures, Bulletin of the Seismological Society of America, Volume 84, No. 3, pp , June. Lettis, W. R. (2001), Late Holocene Behavior and Seismogenic Potential of the Hayward- Rodgers Creek Fault System in the San Francisco Bay Area, California, in Ferriz, H. and Anderson, R. (eds.), Engineering Geology Practice in Northern California, Association of Engineering Geologists Special Publication 12 and California Division of Mines and Geology Bulletin 210, pp Lienkaemper, J. J. (1992), Map of Recently Active Traces of the Hayward Fault, Alameda and Contra Costa Counties, California, United States Geological Survey Map MF-2196, 1:24,000 scale. Louderback, G.D. (1927), Geological Report on the Site of the Proposed Lafayette Reservoir. Makdisi, F.; Seed, H.B. (1977), "A Simplified Procedure for Estimating Earthquake-Induced Deformations in Dams and Embankments" U. of California, Berkeley, EERC Report No. UCB/EERC-77/19, 33 pp, plus Appendices. Makdisi, F.I., and Seed, H.B., (1978). "Simplified Procedure for Estimating Dam and Embankment Earthquake Induced Deformations". Journal of Geotechnical Engineering, ASCE, July. Makdisi, F.I., and Seed, H.B., (1979). "Simplified Procedure for Evaluating Earthquake Response", Journal of Geotechnical Engineering, ASCE, December. GEI Consultants
120 Dynamic Stability Review of Lafayette Dam East Bay Municipal Utility District 08/16/05 Newmark, N.M. (1965), "Effects of Earthquakes on Dams and Embankments", Rankine Lecture, Geotechnique 15, No. 2, pp Olivia Chen Consultants, Inc. (2003), Report on the Seismic Stability of Calaveras Dam, Report to San Francisco Public Utilities Commission, Utilities Engineering Bureau, January. Oppenheimer, D. H., and Macgregor-Scott, N. (1992), The Seismotectonics of the Eastern San Francisco Bay Region, in Borchardt, G., Hirschfeld, S. E., Lienkaemper, J. J., McClellan, P., Williams, P. L., and Wong, I. G. (eds.), Proceedings of the 2 nd Conference on Earthquake Hazards in the Eastern San Francisco Bay Area, California Division of Mines and Geology Special Publication 113, pp Petersen, M.D.; Toppozada, T.R.; Cao, T.; and Cramer, C.H. (2000), Active Fault Near- Source Zones Within and Bordering the State of California for the 1997 Uniform Building Code, EERI, Earthquake Spectra, Volume 16, No. 1, February, pp Radbruch, D. H. (1969), Areal and Engineering Geology of the Oakland East (7.5-minute) Quadrangle, California, United States Geological Survey Miscellaneous Geologic Quadrangle Map GQ-769, 1:24,000 scale. Sarma, S.K. (1975), "Seismic Stability of Earth Dams and Embankments", Geotechnique 25, No. 4, pp Saul, R. B. (1973), Geology and Slope Stability of the SW 1/4 Walnut Creek Quadrangle, Contra Costa County, California, California Division of Mines and Geology Map Sheet 16, 1:12,000 scale. Seed, H.B.; Idriss, I.M. (1970), "Soil Moduli and Damping Factors for Dynamic Response Analysis", University of California, Berkeley, Report No. EERC/70-10, December, 15 pp. Seed, H.B., and Idriss, I.M. (1982) "Ground Motions and Soil Liquefaction During Earthquakes", Earthquake Engineering Research Institute, Monograph Series. Seed, R.B.; et al. (2003), Recent Advances in Soil Liquefaction Engineering: A Unified and Consistent Framework, 26 th ASCE Geotechnical Spring Seminar, Keynote Presentation, Long Beach, CA, pp Seed, R.B.; Harder, L.F. Jr. (1990), "SPT-based Analysis of Cyclic Pore Pressure Generation and Undrained Residual Strength", Presented at H. Bolton Seed Memorial Symposium, Proceedings, Volume 2, BiTech Publishers, Canada, May. GEI Consultants
121 Dynamic Stability Review of Lafayette Dam East Bay Municipal Utility District 08/16/05 Shannon & Wilson, Inc. (1966), Review of Stability Lafayette Dam, Report to East Bay Municipal Utility District, Oakland, CA, January, with amendment letters, February 15, 1966 and February 21, Simpson, G. D., Baldwin, J. N., Kelson, K. I., and Lettis, W. R. (1999), Late Holocene Slip Rate and Earthquake History for the Northern Calaveras Fault at Welch Creek, Eastern San Francisco Bay Area, California, Bulletin of the Seismological Society of America, vol. 89, no. 5, pp Sims, J. D. (1991), Distribution and Rate of Slip Across the San Andreas Transform Boundary, Hollister Area, Central California, Geological Society of America Abstracts with Programs, Cordilleran section, vol. 23, no. 2, p. 98. Somerville, P.G.; Smith, N.F.; Graves, R.W.; Abrahamson, N.A. (1995), "Accounting for Near-Fault Rupture Directivity Effects in the Development of Design Ground Motions", Proceedings, ASME/SSME Conference, Hawaii, July. Spencer, E. (1967), A Method of the Stability Analysis of Embankments Assuming Parallel Inter-Slices Forces, in Géotechnique, XII, No. 1, pp Swaisgood, J.R. (1995), "Estimating Deformation of Embankment Dams Caused by Earthquakes", ASDSO Western Regional Conference, Red Lodge, Montana, May Swaisgood, J.R. (1998), Seismically-Induced Deformation of Embankment Dams, 6 th U.S. National Conference on Earthquake Engineering, Seattle, Washington, June Tokimatsu, K.; Yoshimi, Y. (1983), "Empirical Correlation of Soil Liquefaction Based on SPT N-Value and Fines Content", Soils and Foundations, Vol. 23, No. 4, December, Japanese Society of Soil Mechanics and Foundation Engineering, pp Toppozada, T. R., Real, C. R., and Parke, D. L. (1986), Earthquake History of California, California Geology, vol. 39, no. 2, pp Toppozada, T. R. and Borchardt, G. (1998), Re-evaluation of the 1836 Hayward Fault Earthquake and the 1838 San Andreas Fault Earthquake, Bulletin of the Seismological Society of America, vol. 88, pp Unruh, J. R., and Kelson, K. I. (2002), Critical Evaluation of the Northern Termination of the Calaveras Fault, Eastern San Francisco Bay Area, California, Final Technical Report to the United States Geological Survey, Award no HQ-97-GR-03146, 72 p. with figures. GEI Consultants
122 Dynamic Stability Review of Lafayette Dam East Bay Municipal Utility District 08/16/05 Vrymoed, J.L. (1996), "Seismic Safety Evaluation of Two Earth Dams", in "Earthquake Engineering For Dams", Western Regional Technical Seminar, Ass. of State Dam Safety Officials, April 11-12, Sacramento, pp W.A. Wahler & Associates (1976), Seismic Stability Evaluation Lafayette Dam Contra Costa County, California, Report to East Bay Municipal Utility District, Oakland, Ca, May. Wakabayashi, J. and Sawyer, T. L. (1998), Paleoseismic Investigation of the Miller Creek Fault, Eastern San Francisco Bay Area, California, Final Technical Report to the United States Geological Survey, award no HQ-97-GR-03141, 17 pp. with figures. Wagner, J. R. (1978), Late Cenozoic History of the Coast Ranges East of San Francisco Bay, Map 1:24,000 scale, University of California, Berkeley, Ph. D. Thesis, 161 pp. Wells, D. L. and Coppersmith, K. J. (1994), New Empirical Relationships Among Magnitude, Rupture Length, Rupture Width, Rupture Area and Surface Displacement, Bulletin of the Seismological Society of America, vol. 84, pp Woodward-Clyde Consultants (1975), Lafayette Dam Seismic Evaluation Cross-Hole Shear Wave Velocity Survey, prepared for East Bay Municipal Utility District, WCC Project G-13377, March. Working Group on California Earthquake Probabilities (1999), Earthquake Probabilities in the San Francisco Bay Region: 2000 to 2030 A Summary of Findings, United States Geological Survey Open-File Report Zhou, S.G. (1981), Influence of Fines on Evaluating Liquefaction of Sand by CPT, Proceedings, International Conference on Recent Advances in Geotechnical Earthquake Engineering and Soil Dynamics, Vol. 2, pp GEI Consultants
123
124 Dynamic Stability Review of Lafayette Dam APPENDICES APPENDIX A SURVEY MONUMENTS REVIEW APPENDIX B PIEZOMETRIC DATA REVIEW APPENDIX C SELECTED PROJECT PHOTOGRAPHS APPENDIX D DEVELOPMENT OF SITE-DEPENDENT SPECTRA APPENDIX E REVIEW OF LABORATORY DATA APPENDIX F CALCULATION OF EARTHQUAKE-INDUCED DEFORMATIONS - i - GEI Consultants Project #
125
126
127
128
129 APPENDIX A SURVEY MONUMENTS REVIEW A-1 Survey Monuments Location There are currently 24 survey monuments, arranged in a grid on the embankment of Lafayette Dam. The location of the monuments is shown on Figure A-1. Monuments BL-6 through BL-14 are located on the centerline of the crest, which is considered the baseline. The number represents the closest station, e.g., BL-6 is located at approximate Station 6+03, BL-8 is located at 8+03, etc. Monuments DIA-10 to DIA-14 are located on a diagonal line traversing the upstream face. Monuments 116-S-10 to 116-S-14 are located on the upstream berm, 116 ft upstream (south) of the baseline (e.g. 116-S-10 is located 116 ft south of the baseline at station 10+03). Monuments 85-N-10 to 85-N-14 are located on the downstream berm, 85 ft downstream (north) of the baseline. Monuments 179-N-10 to 179-N-14 are located on the downstream berm, 179 ft downstream (north) of the baseline. Monuments 396-N-10 to 396-N-14 are located on the downstream berm, 396 ft downstream (north) of the baseline. Monuments 582-N-10 to 582-N-14 are located on the downstream berm, 582 ft downstream (north) of the baseline. A-2 Recent Readings The monuments are surveyed approximately once (and occasionally twice) a year. EBMUD provided survey data measurements from June 1, 1989 to December 9, 2003 for our review. These data were provided both as graphs and raw data. The graphs are shown in the pages that follow Figure A-1. Table A-1 summarizes the maximum vertical and horizontal displacements recorded for the monuments from 1989 to the present. Figures A-2 and A-3 are graphs of the maximum horizontal and vertical displacements at the survey monuments plotted along stations of the dam. It can be seen from Table A-1 that the maximum horizontal and vertical displacements for all the survey monuments are 3.36 inch and 3.12 inch, respectively. Review of the time versus displacement graphs for individual survey monuments shows that the horizontal and vertical movements are stable, with no significant increase in the last 15 years. Horizontal movements of the upstream slope are toward the upstream direction, while the downstream slope has moved slightly downstream. While these measured displacements are very small, it is rather unusual that the slopes of a dam move in opposite directions, especially considering that the reservoir load is rather constant in the case of Lafayette Dam. This could be indicative of extremely slow creep taking place or continuing in the foundation alluvium. Similar dual directions of movement occurred during the 1928 failure. The dam displacements are too small, however, to be of concern. The plots of survey monuments provided by the District also include precipitations. Dam displacements should not be affected by precipitation, unless the monuments are too shallow. This does not seem to be the case, as precipitation seems to have no effects on the measured dam movements. A-1 GEI Consultants Project #

130
131
132
133
134
135
136
137
138
139
140
141
142
143
144
145
146
147
148
149
150
151
152
153
154
155
156
157
158
159
160
161
162
163
164
165
166
167
168
169 APPENDIX B PIEZOMETRIC DATA REVIEW B-1 Phreatic Level Monitoring Background Prior to 1965, the water level within the Lafayette embankment was monitored with observation wells. The exact locations and date of installation of these wells are not known. Review of records on Lafayette Dam at the DSOD indicates that the wells were installed in about 1932 to monitor seepage of natural groundwater into the left abutment and under the downstream shell of the dam. The following excerpt is from a 1932 review by DSOD (Engle, 1932): Seepage- Mr. Marliave has made a geological investigation as of January, I have discussed with him the proposed repairs now before us for action. From a geological standpoint he questions the formation of the left or west abutment, believing that natural ground water may find a passage from the abutment into and under the downstream portion of the dam to create undesirable condition of saturation. He suggests that the owners put down test wells at the left end of dam to determine water condition of the abutment and suggest the advisability, if conditions warrant, of providing drainage for the abutment- perhaps a drift run in from about the elevation of the downstream toe. While no records of well installation were found in the DSOD or District s files, it appears that these wells were actually installed. In 1944, another DSOD (Perkins, 1994) memorandum discussed the advisability of a foundation drainage program involving continuous pumping from two of the wells that penetrate the foundation upstream from the cutoff. In 1956, a field investigation was conducted by EBMUD as part of a stability analysis of the upstream slope for a proposed spillway (never constructed) through the left abutment. Two borings, SS-1A and SS-2, were drilled for this investigation. No record of piezometer installation has been found, so it is assumed that piezometers were not installed at this time in these two borings. In 1965, Shannon and Wilson and Burton Marliave performed field investigations and seismic stability analyses using a horizontal load coefficient. During that investigation, 12 borings were drilled, SS-3 to SS-14. DSOD records indicate that 13 piezometers were installed in June and July 1965 in the core and alluvium foundation to monitor the dam. These piezometers are SS-1A (3 tip elevations), 3, 4, 5, 6 (2 tip elevations), 7, 8 (3 tip elevations), 9, 10, 11, 12, 13 and 14. After the piezometers were installed, the observation wells were abandoned. In , EBMUD conducted a new field investigation. The field investigation included drilling 17 rotary borings, SS-14 to SS-29. In , W.A. Wahler & Associates interpreted the field results, performed laboratory tests and conducted another seismic evaluation using dynamic equivalent-linear response analysis. Piezometers were not installed in the borings drilled for this investigation. Records obtained from DSOD files indicate that, in 1992, seven of the eight crest piezometers were reading water surface elevations higher than the reservoir elevation. It was suggested that B-1 GEI Consultants Project #
170 the malfunction could have been due to rain infiltration. This could also represent capillary rise. It was proposed to abandon the left abutment piezometer (SS-14) and replace the remaining six piezometers. Piezometer SS-14 was reported to be malfunctioning, but was not replaced because of its non-critical water level data. Piezometers SS-10 and SS-11 were also reported to be malfunctioning, but were not replaced because of their non-critical water level data and environmental constraints. It was also noted that piezometers SS-5 to SS-9 in the downstream slope area had shown fluctuations that could indicate that they were not working properly. Further evaluation of these piezometers was suggested. EBMUD records indicate that in 1992, piezometers SS-30A, SS-30B and SS-30C were installed to replace SS-1-AA, SS-1-AB, SS-1-AC. Drilling logs for these holes do not appear to be available. Whereas SS-1-AA, SS-1-AB and SS-1-AC had been installed in one hole, the replacement piezometers were installed in three separate boreholes. Also in August 1992, piezometer SS-31A was installed to replace SS-3, and piezometer SS-32A was installed as a replacement for SS-13. In 1996, EBMUD records indicate that piezometer SS-33A was installed. It was not indicated whether this was a replacement piezometer, but due to its proximity to the location of SS-4 and the fact that SS-4 is no longer monitored, we presume that it was installed as a replacement for SS-4. The drill log for this piezometer hole is not available. Table B-1 presents a summary of the 18 active piezometers at Lafayette Dam including the location and sensing depth of the instruments, as shown in EBMUD records. All piezometers are open-standpipe piezometers. B-2 Time vs. Reading Graphs of Data Figure B-1 indicates the approximate location of the 18 active piezometers. This figure was reprinted from the 1966 Shannon & Wilson report and includes the locations of several piezometers that are no longer active (SS-1A, SS-3, SS-4, SS-13 and SS-14). Time-versusreading graphs for the active piezometers from January 1989 to January 2004 are attached. Piezometers readings are taken approximately monthly. In addition, the corresponding reading of reservoir level from 1989 to 2004 is included in the attached graphs as well as rainfall measurements. Table B-2 summaries the piezometric data from June 1998 (after several piezometers were cleaned) to January The maximum historic high and low water levels for this time period for each piezometer are indicated in the table along with the reservoir level reading for the corresponding date. In addition, the most recent water level reading is also shown for each piezometer. B-3 Evaluation Review and evaluation of the piezometer data reveals that Piezometers SS-5A, SS-6A, SS-7A, SS-9A show seasonal fluctuation beyond what would be expected from response to the increase B-2 GEI Consultants Project #
171 in reservoir level. This may be due to infiltration of rainwater into the piezometers, since the increase in water level reading appears to correlate to periods of higher rainfall. Piezometers SS-8A, SS-8B and SS-8C show only small variation due to change in reservoir level. Within the last ten years, the piezometers show no upward trend and are within historic range, with the exception of one reading in May Closer inspection of this data point seems to indicate that the reading is in error. Subsequent readings have returned to expected levels. Piezometers SS-10A and SS-11A on the upstream face appear to be reading at or slightly below the reservoir level. Due to their location, these piezometers are submerged during high reservoir stage and are of limited value. Piezometer SS-12, located on the crest near the right abutment, continues to show water levels about 15 feet lower than the reservoir level and appears to fluctuate with changes in reservoir level. Within the last ten years, piezometer readings show no upward trend and are within historic range, with the exception of one reading in February Closer inspection of this data point seems to indicate that this reading is in error, probably due to infiltration of surface water since this occurred during a period of high rainfall. Subsequent readings have returned to expected levels. Piezometers SS-30A, SS-30B and SS-30C are located on the crest towards the upstream slope. Since installation in 1992, Piezometer SS-30A (tip depth 34.0 ft) has shown water levels about 15 feet above the reservoir level. This may be due to infiltration of surface water, influence of ground water or plugging of the piezometer. EBMUD records indicate that in May 1998 this piezometer was cleaned, but water level readings continued to be high. Piezometer SS-30B (tip depth ft) currently indicates water levels about 15 ft below the reservoir level and SS-30C (tip depth ft in the foundation bedrock) has water levels about 36 ft below the reservoir level. In 1998, SS-30B and SS-30C showed erratic readings for several months. EBMUD records indicate that in May 1998 these piezometers were cleaned and since that time they appear to be operating properly. Readings in SS-30B and SS-30C show no upward trend in readings and appear to fluctuate with changes in reservoir level. Piezometers SS-31, SS-32 and SS-33 are located on the crest towards the downstream slope. SS- 31 continues to have readings about 10 ft higher than the reservoir level. In May 1998, this piezometer was cleaned and pumped out. Since that time, the water level has slowly risen and now appears to be stable at its current reading. It can be concluded that this piezometer is plugged, and of little value. Piezometer SS-32 (tip at depth in the foundation bedrock) shows water level readings approximately 34 ft below the reservoir level. Within the last ten years, SS-32 readings show no upward trend and are within historic range with the exception of one reading in EBMUD records indicate that, in May 1998, this piezometer was cleaned and appears to be operating properly since that time. The water level readings in piezometer SS- 33, installed in January 1996, have risen slowly since installation to a level about 10 ft above the reservoir level. The water level in this piezometer appears to be stable at its current reading. The unusual readings may be due to the influence of ground water from the right abutment, or perhaps this piezometer is plugged. B-3 GEI Consultants Project #
172 B-4 Phreatic Surface for Slope Stability Analyses Following review of the piezometric data discussed above, we developed an estimate of the phreatic level through the maximum cross-section of the embankment. Figure B-2 shows the estimated phreatic level. The phreatic level is based on the high water level readings in the piezometers. We used extrapolation and considerable judgment to estimate such phreatic level. The exact locations of the piezometers are not known, since the only available drawing (Figure B-1) showing current piezometer locations is only schematic. Also data from several piezometers (SS-30A, SS-31 and SS-33) are of questionable value, as discussed above. The piezometric readings show little influence of the dam zoning upon the position of the phreatic surface in the embankment. Two interpretations of phreatic levels are possible. The upper level takes into consideration the readings in piezometer SS-6A, which are considerably higher than would be expected. While this piezometer may be subject to surface water infiltration, in which case the phreatic level at this location would be less than that indicated, there is no tangible evidence to discount this piezometer. The lower level, which does discount the readings in SS-6A, is shown for illustrative purposes. We believe the upper level best represents the actual maximum phreatic level through the embankment. It can also be seen from Figure B-2 that the piezometers that monitor the pore pressures in the foundation show that the clayey foundation does not provide additional drainage, since the water level in those piezometers are consistent with those measured in the embankment. Comparison of the estimated phreatic surface with the phreatic surface assumed in the Wahler (1975) stability analyses and the DSOD (2003) review is shown in Figures B-3 and B-4, respectively. Our estimated phreatic surface is generally similar to those used in previous studies. Our interpreted phreatic surface is somewhat lower in the upstream portion of the dam, but slightly higher in the downstream portion of the dam. Overall, such variation is probably not significant, and well within the level of judgment needed to interpret the piezometric data. REFERENCES APPENDIX B Engle, G.F. (1932), Memorandum to Mr. Hawley Lafayette Dam #31-2. Comments on Owner s Application for Repair of Dam, DSOD Internal Memorandum, Dated July 8, Perkins, W.A. (1944), Memorandum to Mr. Holmes Lafayette Dam #31-2. Conference July 20, B-4 GEI Consultants Project #
173
174
175
176
177
178
179
180
181
182
183
184

185
186
187
188
189
190
191
192 APPENDIX C SELECTED PROJECT PHOTOGRAPHS The following photographs, taken during our field inspection of 4/01/04, describe the current condition of Lafayette Dam: Photo C-1: Upstream face. This is a view of the upstream face of Lafayette Dam, taken from near the park headquarters. Note the apparent settlement in the central portion of the concretelined upstream slope, which occurred in the years that followed the 1928 failure. Photo C-2: Upstream face. This view is taken from the near the right abutment, and also shows the upstream shell settlement and resulting ponding near the center of the top upstream berm. Photo C3: Typical cracking, upstream concrete slab panels. Minor random cracking was observed in some of the concrete slab facing of the upstream slope. Such cracking does not represent a safety concern, as settlements of the upstream shell have been negligible for several decades. Especially, the concrete slabs are used as slope protection, not as an impervious barrier. Photo C4: Typical gap between upstream concrete slab panels. Gaps, up to 4-inch wide, are present between several concrete panels, and probably result from the aforementioned settlement of the upstream shell. Although these open joints have been filled with asphalt, such filling is frequently missing, deteriorated, or affected by the growth of weeds. Photo C-5: Upstream face. This view is taken from the top upstream berm, near the left abutment. It shows the weeds growing in the joints between adjacent concrete slabs. This is a non-critical maintenance issue. Photo C-6: Downstream face. The downstream face is covered with grass, and appears to be in good condition. No traces of seepage, slope movements, settlement, cracking or deterioration are visible. Numerous small rodent holes were noticed, however. Photo C-7: Downstream face, typical surface drain. Clay-tiled surface drains collect rainstorm runoff along the downstream face. A piezometer cap is visible, left of the drain channel. Note the excellent apparent condition of the downstream slope toward the left abutment. C-1 GEI Consultants Project #
193 Photo C-8: Surface drain collector, bottom of downstream face. Note the good apparent condition of the downstream slope toward the right abutment. Photo C-9: Exit box, downstream drainage collection system. Negligible (less than 1gpm) and clear seepage was observed on the day of our visit. Photo C-10: Typical piezometer cap. This picture shows a typical, well-maintained piezometer location (Piezometer SS-7). Photo C-11: Lafayette Dam outlet and spillway tower. The outside of the outlet tower, which is inside the reservoir near its right bank, appears in good visual condition as seen from the dam. --o-oo-o-- C-2 GEI Consultants Project #
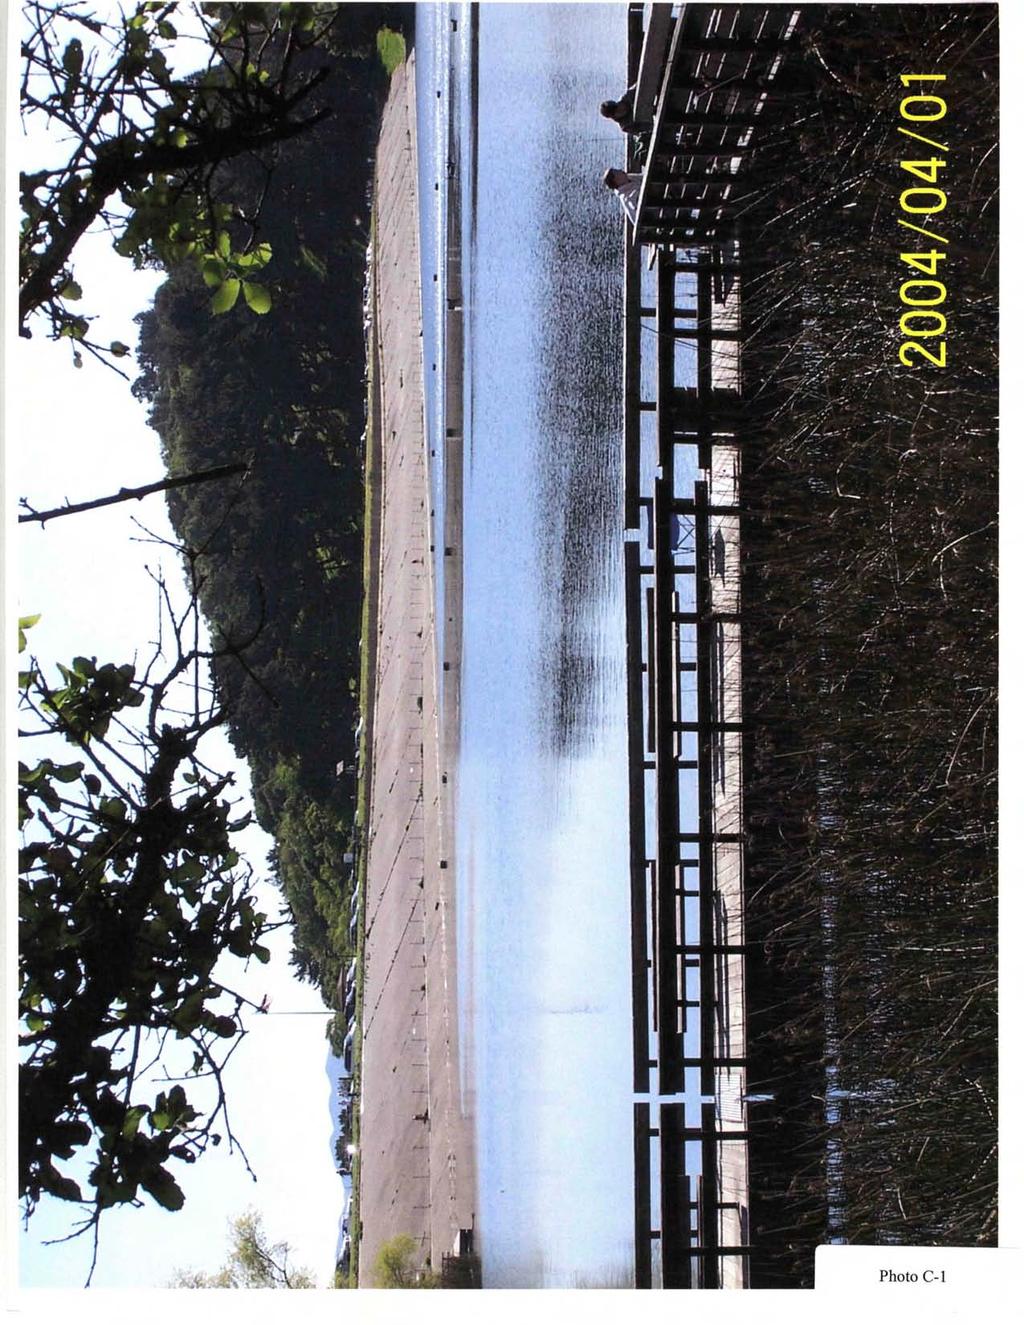
194

195

196

197

198

199

200
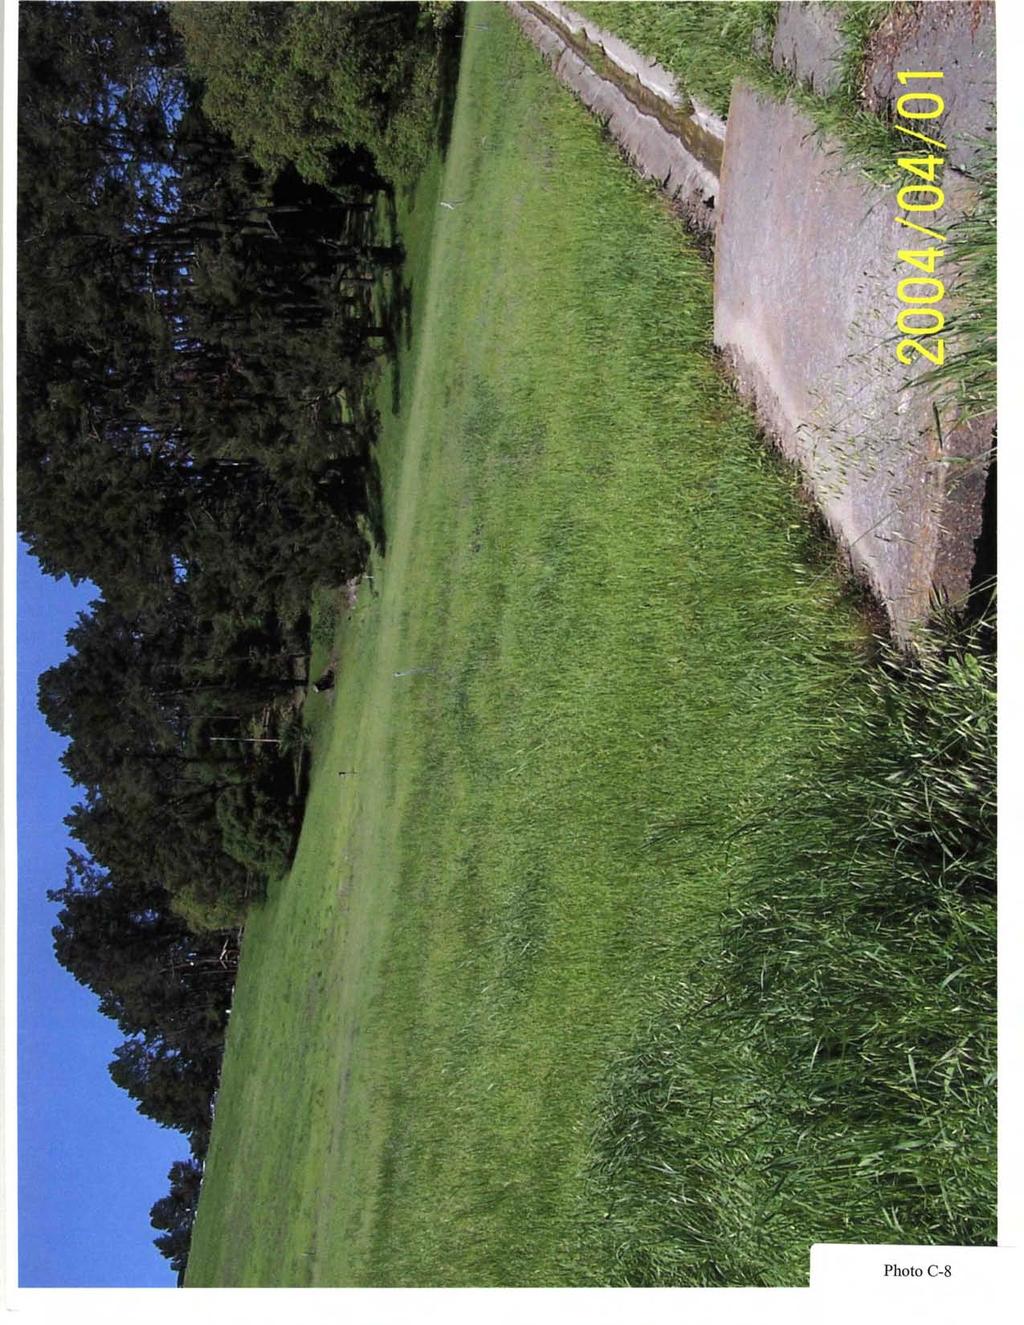
201

202

203

204
205 APPENDIX D DEVELOPMENT OF SITE-DEPENDENT RESPONSE SPECTRA D-1 Introduction The characteristics of ground motion at a given distance from an earthquake of specified magnitude is required for the seismic evaluation of existing dams. Attenuation equations (empirical relationships that relate the characteristics of ground motion to magnitude and distance) are the most reliable at intermediate magnitudes (M w 5.5 to 7.0) and intermediate distances (10 to 50 km), which represent the parameters for which the largest amount of strong motion data is available. Hence, in the case of Lafayette Dam, estimates obtained from applicable attenuation equations are influenced by the large magnitudes (M w >= 7.0) and short distances (<10 km) considered. Seismic criteria for Lafayette Dam are also affected by four factors: The closeness of several major active faults, including the Hayward, Calaveras and Lafayette-Reliez Valley faults, all within less than 10 km from the dam (near-field effects). The large upper bounds of magnitude assigned to the Hayward, Calaveras and San Andreas faults. The significant mapped lengths of these faults, which means that the fault rupture process could originate at some distance away from the site and propagate either in the forward or backward directions (directivity effects). The poor quality of the local bedrock, the Orinda Formation, which is intermediate between a soft rock and a stiff soil. Near-field effects have been observed to affect the frequency characteristics and maximum amplitude ratios between vertical and horizontal components of earthquake motion. This is because high frequency motion attenuates more rapidly as a function of distance than intermediate and low frequency motion. In the near-field, vertical spectral amplitudes at short frequencies can substantially exceed the corresponding horizontal spectral amplitudes. Directivity effects primarily affect the relationship between the fault-normal and fault-parallel components of ground motion at intermediate to long periods, and are often expressed as large velocity pulses at the beginning of recorded acceleration histories. Because relatively few records have been obtained at short distances (less than 10 km away) from the causative fault, some uncertainty is inevitable when trying to quantify near-field and directivity effects. D-2 Ground Motion Attenuation Equations Ground motion attenuation equations have generally been developed in two ways: empirically, using statistical processing of previously recorded ground motions; or theoretically, using D-1 GEI Consultants Project #
206 seismological models of the fault rupture process. In California, the statistical method is the most frequently used, due to the existence of an appreciable set of strong motion records. Many attenuation equations started to be developed after the 1971 San Fernando earthquake, the first event to generate a large database of recorded ground motions. They have been continuously updated since, and every time that more records become available. Recent California events, such as the Loma Prieta (October 18, 1989), Landers (June 28, 1992) and Northridge (January 17, 1994) earthquakes have significantly increased the existing database for near-field records. Attenuation equations are based on different definitions of the applicable distance parameter, which is particularly critical in the near-field. The augmentation of the strong ground motion database has improved the reliability of horizontal attenuation equations, allowing consideration of different types of faulting (strike- slip, reverse, and normal or extensional) and various subsurface conditions, typically simply differentiated as hard rock, soft rock, firm soil, deep soil or soft soil. Some site classification schemes rely on the average shear wave velocity (V s ) in the upper 30 meters. As the Orinda Formation is intermediate between a soft rock and a hard soil, the use of V s is more rigorous than a simple distinction between soil and rock. Lastly, several sets of equations include vertical motion. Although simplified and equivalent-linear solutions typically ignore vertical motion, such component can be significant for near-field sites and when more sophisticated analysis methods are implemented. It has been included in our development of response spectra. Appreciable errors can be associated with strong motion predictions, when compared to past or future recordings, and attenuation equations typically consider mean (50 th percentile) or meanplus-one-standard-deviation (84 th percentile) estimates. Because Lafayette Dam is a high-risk dam, located in the vicinity of faults with a high to very high slip rate, we have used 84 th percentile seismic criteria. For this study, we tested five sets of well-accepted attenuation equations for peak ground acceleration (PGA) and pseudo-absolute spectral accelerations (PSA) at 5 percent damping. Crouse and McGuire (1995) developed the first set. The others (Abrahamson & Silva; Boore, et al.; Sadigh, et al. and Campbell) were presented in the January/February 1997 Issue of the Seismological Research Letters of the Seismological Society of America (SSA). The Crouse- McGuire s equations use the shear wave magnitude (M s ) to quantify the size of the earthquake, and the others use the moment magnitude (M w ). In our review of the Lafayette Project files, we found out that the DSOD uses the Abrahamson & Silva, Boore, et al., and Sadigh, et al. s equations for horizontal motion. Therefore, we also used these three sets of equations as the primary basis for our horizontal ground motion estimates. We used the Crouse-McGuire s and Campbell s equations, however, for comparative purposes and to confirm the suitability of the predictions obtained with the three other equations. All of these equations are applicable to California events (shallow crustal earthquakes), and are further discussed in the following pages. D-2 GEI Consultants Project #
207 Crouse and McGuire (1995). Crouse and McGuire developed attenuation equations applicable to the Western U. S. to revise NEHRP Seismic Provisions. These equations depend on a V s -dependent classification of the site (Site Classes A through E). Based on measured shear wave velocities in the Orinda Formation, the Lafayette site falls in the lower-bound of the V s range for Soil Class C. Hence, for ground motion estimation purposes, we averaged predictions obtained for soil Class C and Class D. Abrahamson and Silva (1997). Abrahamson and Silva used a database of 655 recordings from 58 earthquakes to develop empirical equations for peak and spectral response (horizontal and vertical). They distinguished between two types of sites, rock and shallow soil, and deep soil ). Their equations include a correction factor to differentiate between strike-slip (used herein) or reverse faulting, and are based on the closest distance to the fault surface rupture (R up ). They also introduced a correction factor to account for differences in the ground motion on the hanging wall and foot wall of dipping faults. After reviewing the site conditions present at the Lafayette site, we used the arithmetic average of Abrahamson and Silva s deep soil and rock and shallow soil equations to develop MCE response spectra for Lafayette Dam. Abrahamson and Silva provide equations for both the horizontal and the vertical components of ground motion. Boore, Joyner, and Fumal (1997). In 1997, Boore, Joyner and Fumal upgraded Joyner and Boore s 1982 equations. They added records from the 1989 Loma Prieta, 1992 Petrolia and 1992 Landers records. They used as a distance parameter the closest horizontal distance from the recording station to a point on the earth surface that lies directly above the fault rupture (R jb ). Their regression analysis uses shear wave velocity (V s ), averaged over the upper 30 meters of the site, as a way to differentiate between various subsurface conditions. Different equations apply to strike-slip or reverse-slip earthquakes, and we used the strike-slip equations. Boore, Joyner and Fumal did not provide equations for vertical motion. Sadigh, Chang, Egan, Makdisi and Youngs (1997). These equations, primarily based on strong motion data from California earthquakes, have evolved over the years. The 1997 equations include data from the 1994 Northridge Earthquake. Distance is defined as R up, the minimum distance to the fault rupture. Attenuation equations are presented for two general site categories, rock and deep soil. The authors also differentiated between strike-slip and reverse faulting and concluded that ground motions from normal and strike-slip faulting do not significantly differ. For this study, we averaged the predictions obtained for rock and deep soil, and used the equations for strike-slip faulting. Campbell (1997, 2001). In 1997, Campbell updated his 1994 equations for predicting horizontal and vertical free-field PGA and PSAs at 5 percent damping. His 1997 database included 645 horizontal recordings and 225 vertical recordings for PGA, and 226 horizontal and 173 vertical recordings for PSA's. Source-to-site distance is defined as R seis, the shortest distance between the recording site and the interpreted zone of seismogenic rupture on the fault. This implies that softer sediments and the upper 2 to 4 D-3 GEI Consultants Project #
208 km of the fault zone are primarily non-seismogenic, at periods of engineering interest. Campbell also introduced a correction for long-period site response, using the depth to basement rock (D b ) as a parameter. He differentiated between strike-slip and reverse faulting, and suggested that estimates for normal faulting be taken as the geometric average of those for strike-slip and reverse faulting. Different equations apply to alluvium or firm soil, hard rock and soft rock. For this study, we concluded that the arithmetic average of Campbell s equations for soft rock and alluvium would best represent the local ground motion. Campbell and Bozorgnia (2000) published an abbreviated and slightly different form of the 1997 equations and, in 2001, Campbell provided an erratum and additional guidance on the use of his equations for sites simply classified as soil or rock. He has submitted for publication another new set of equations (Campbell, 2003), which we did not consider. Like the Crouse-McGuire s equations, we only used Campbell s horizontal attenuation equations for comparative purposes, but used his vertical ground motion estimates not to rely on a single set of equations (Abrahamson and Silva). While the above relationships are well-accepted in common earthquake engineering practice, they have been recently updated or will be revised in the near future. Campbell and Bozorgnia (2003) published revised attenuation relationships to update Campbell s 1997/2001 equations, using a database of records obtained throughout the world. We have tested the applicability of these new equations to California sites, such as the Lafayette site. For the MCEs and site conditions considered, Campbell and Bozorgnia s horizontal spectra are comparable to those recommended in this report, but the vertical spectra are lower. This is of no significance, as vertical spectra presented in this Appendix were included for informational purposes only. The other attenuation relationships (Boore, et al., Abrahamson and Silva, and Sadigh, et al.) should be updated around the end of 2005, when the Pacific Earthquake Engineering Research (PEER) Center publishes the findings of a recent workshop on the subject. D-3 Methodology First, we calculated average response spectra for the distance parameters and upper bound of magnitude (see main part of the report, Section 4.3) that would result in the most severe ground motion estimates at the site. The Hayward Fault is the controlling feature, in the case of Lafayette Dam, but we also developed ground motion estimates for the Calaveras, San Andreas and Lafayette-Reliez Valley faults. Such response spectra are designated as deterministic, and describe the motion from each critical fault, as opposed to probabilistic response spectra, e.g. USGS estimates. Probabilistic spectra include the contributions of all applicable faults and seismogenic zones that can produce ground motion with a specified probability of nonexceedance at the site. In the case of high risk dams, the State Division of Safety of Dams (DSOD) requires deterministic criteria based on 84 th percentile estimates. To reduce the uncertainty associated with our estimates, we combined the horizontal response spectra developed from the Abrahamson and Silva, Boore, et al. and Sadigh et al. s attenuation equations, and the vertical spectra from the Abrahamson and Silva and Campbell s equations, using a geometric averaging process. Geometric averaging is based on the natural logarithms of the calculated PGA's or PSA's) and is compatible with the regression analysis procedures used D-4 GEI Consultants Project #
209 for the development of such equations. As these equations do not use the same periods of vibration, we obtained intermediate estimates by interpolating from the natural logarithms of the PSA's calculated at the two closest periods values. All of the above relationships apply to the average of the primary and secondary components of horizontal ground motion. D-4 Near-Field And Directivity Effects It has been observed that increase or decrease of ground motion may occur as a result of the direction of propagation of the rupture (a Doppler-like effect). Amplitudes in the forward direction of the rupture propagation will often be increased, while amplitudes in the backward direction reduced. Furthermore, systematic and significant differences have been observed in the near-field between the fault-perpendicular (normal to the rupture plane) and the fault-parallel components of long period ground motion. Although recognized, such effects have not been used directly in the development of attenuation equations discussed in Section D-2. Sadigh, et al. (1993) first suggested that, within 10 km of the rupture surface, the fault normal component be increased by 20 percent for spectral periods of 2.0 sec or greater, and the faultparallel component decreased by 20 percent, compared to the geometric averages. Others (Ansary, et al., 1995) proposed that the largest component of motion be approximated from the average estimate using a 15 percent increase. Somerville, et al. (1997) concluded that near-field rupture directivity effects become significant around 0.6 sec period and increase in size with longer periods. They proposed a simple geometric modification method based on empirical analysis of strong motion attenuation data. Abrahamson (2000) used a similar model to estimate directivity and radiation pattern effects on the fault-normal and fault-parallel components of ground motion. In 2000, Somerville indicated that his 1997 and the just developed Abrahamson models were too simple, and that near-field and directivity effects rather manifest themselves as narrow-band pulses at a period that appears to increase with the magnitude of the causative event. However, because it is impossible to reliably predict at what period such effects will occur, Campbell (2003) concluded that the 2000 Somerville directivity pulse model needed more development before it could be used for engineering purposes and that, until then, the 1997 Somerville and 2000 Abrahamson models would remain the state-of-the-art. Because Lafayette Dam is a very wide-crested embankment dam, it is should respond at periods of vibration of 0.6 sec or greater and near-field and directivity effects could influence its response, especially in the case of the Lafayette-Reliez Valley, Calaveras and/or Hayward faults. The correction factor for directivity effects depends on the ratio s/l, where L represents the total rupture length and s the distance from the epicenter to the normal projection of the site location to the fault surface trace, and on the angle (θ) between the fault trace and a line joining the site location to the epicenter. In the case of strike-slip faulting and rupture propagating toward the site, maximum directivity effects result in a maximum increase of about 68 percent in the spectral acceleration at 5 sec period, compared with average predictions. Minimum directivity effects result in a similar reduction, when the fault rupture propagates away from the site. In addition to directivity effects, near-field fault-normal (FN) and fault-parallel (FP) effects can cause up to about 107 percent increase (at the largest magnitudes) in fault-normal amplitudes, compared with average predictions, with a similar decrease for fault-parallel motion. As D-5 GEI Consultants Project #
210 directivity and fault-normal/fault-parallel effects are cumulative, this could result for strike-slip faulting in a cumulative directivity factor ranging from near-zero at 0.6 sec period to a maximum of about 3.5 at 5 sec period, for the most demanding combination of orientation, distance, fault rupture length and magnitude. For dam evaluation purposes, the DSOD recommends (record of conversation with Jeff Howard, 4/30/2004) that directivity and fault-normal effects be considered for the largest component of motion (to be used perpendicularly to the dam crest), while the secondary component of motion is not reduced from the average motion based on attenuation equations. Directivity effects are not necessarily broad-banded, based on DSOD s own recent studies, which seems in consistence with Somerville (2000). The DSOD indicated it will soon publish a position paper but, until such paper is available, we have adopted Campbell s recommendation and used the Somerville and Abrahamson s correction method to approximately account for directivity and near-field effects in our development of recommended seismic criteria and to define the primary horizontal component of motion (assumed to be oriented perpendicularly to the crest). Many combinations are possible between the parameters involved in estimating directivity effects. As these depend on the unknown location of the initial rupture, a rigorous solution is not possible. Furthermore, as we have recommended 84 th percentile criteria based attenuation equations developed for the average of the primary and secondary components of motion, some unknown portion of the directivity effects is already included in the error term (σ) of the attenuation equations. Yet, for this review, we have considered that maximum directivity effects, which correspond to a value of the product (s/l) x cos(θ) greater than 0.4, would apply. For dam evaluation purposes, the most critical orientation of the dam is when its crest axis is parallel to the fault trace, as the largest shaking would occur perpendicularly to the crest, in the upstream to downstream direction. The crest of Lafayette Dam is not parallel to the Hayward, Calaveras or Lafayette-Reliez Valley faults, which should reduce fault-normal (FN) and faultparallel (FP) effects for the components of ground motion parallel or perpendicular to the dam crest (the most critical to the dam). The angle (α) between the axis of Lafayette Dam crest and the faults considered are approximately 33 o, for the Hayward and San Andreas Fault, a minimum of about 38 o for the Calaveras and about 65 o for the Lafayette-Reliez Valley Fault. To take such orientation into account, we have assumed the motion perpendicular to the crest of the dam to be equal to the FN motion, multiplied by cos(α). Hence, a slight reduction of the FN motion is accounted for, based on the applicable crest orientation. The average horizontal and vertical 84 th percentile spectra predicted by the various attenuation equations are presented in Tables D-1 to D-8. They correspond to the applicable subsurface conditions and dominant strike-slip type of motion, for each of the critical faults potentially affecting Lafayette Dam. The recommended near-field and directivity correction factors are listed in Tables D-9 through D-12. The 50 th and 84 th percentile recommended average and corrected spectra are plotted on Figures D-1 to D-4. The above response spectra correspond to 5 percent of critical damping, which is the damping value commonly used for comparative studies of the characteristics of strong ground motion. As other damping values are may be needed for analysis or simplified dynamic response evaluation purposes, we also obtained response spectra for damping values other than 5 percent. In this D-6 GEI Consultants Project #
211 purpose, we used a scaling procedure using spectral ratios derived from Newmark-Hall (1985). The corresponding spectral values (which also include directivity and near-field effects) are presented in Section 4.6 of the main part of this report. D-7 GEI Consultants Project #
212 REFERENCES APPENDIX D Abrahamson, N.A. (2000), Effects of Rupture Directivity on Probabilistic Seismic Hazard Analysis, CD-ROM Proceedings, 6 th International Conference on Seismic Zonation, November 12-15, Palm Springs, CA, EERI, Oakland, CA. Abrahamson, N.A; Silva W.J. (1997), "Empirical Response Spectral Attenuation Relations for Shallow Crustal Earthquakes", Seismological Research Letters, Seismological Society of America, Volume 68, No. 1, January/February, pp Ansary, M.A.; Yamazaki, F.; Katamaya, T. (1995), Statistical Analysis of Peaks and Directivity of Earthquake Ground Motion, in Earthquake Engineering and Structural Dynamics, Vol. 24, pp Boore, D.B.; Joyner, W.B; Fumal, T.E. (1997), "Equations for Estimating Horizontal Response Spectra and Peak Acceleration from Western North American Earthquakes: A Summary of Recent Work", Seismological Research Letters, Seismological Society of America, Volume 68, No. 1, January/February, pp Campbell, K.W. (2003), Engineering Models of Strong Ground Motion, Chapter 5, Earthquake Engineering Handbook, W.F. Chen and C. Scawthorn, Editors, ICBO/SEA/CRC-Press, Editors, pp Campbell, K.W. (2001), Erratum: Empirical Near-Source Attenuation Equations Relationships for Horizontal and Vertical Components of Peak Ground Acceleration, Peak Ground Velocity, and Pseudo-Absolute Acceleration Response Spectra, Seismological Society of America, Seismological Research Letters, Vol. 72, p Campbell, K.W. (1997), "Empirical Near-Source Attenuation Equations Relationships for Horizontal and vertical Components of Peak Ground Acceleration, Peak Ground Velocity, and Pseudo-Absolute Acceleration Response Spectra", Seismological Research Letters, Seismological Society of America, Volume 68, No. 1, January/February, pp Campbell, K.W.; Bozorgnia, Y. (2003), Updated Near-Source Ground-Motion (Attenuation) Relations for the Horizontal and Vertical Components of Peak Ground Acceleration and Acceleration Response Spectra, Bulletin of the Seismological Society of America, Vol. 93, No.1, February, pp Campbell, K.W.; Bozorgnia, Y. (2000), New Empirical Models for Predicting Near-Source Horizontal, Vertical and V/H Response Spectra: Implications for Design, CD-ROM Proceedings, 6 th International Conference on Seismic Zonation, November 12-15, Palm Springs, CA, EERI, Oakland, CA. Crouse, C.B.; McGuire, R., Site Response Studies for Purpose of Revising NEHRP Seismic Provisions, Proceedings, SMIP 94. D-8 GEI Consultants Project #
213 Sadigh, et al. (1993), "Specification of Long-Period Ground Motions: Updated Attenuation Relationships for Rock Site Conditions and Adjustment Factors for Near-Fault Effects", ATC Seminar on Seismic Isolation, Passive Energy Dissipation and Active Control, March 11-12, San Francisco, CA, Proceedings, pp Sadigh, K.S.; Chang, C.Y.; Egan, J.A; Makdisi, F.; Youngs, R.R. (1997), "Attenuation Relationships for Shallow Crustal Earthquakes Based on California Strong Motion Data", Seismological Research Letters, Seismological Society of America, Volume 68, No. 1, January/February, pp Somerville, P.G. (2000), New Developments in Seismic Hazard Estimation, CD-ROM Proceedings, 6 th International Conference on Seismic Zonation, November 12-15, Palm Springs, CA, EERI, Oakland, CA. Somerville, P.G; Smith, N.F.; Graves, R.W; Abrahamson, N.A. (1997), "Modification of Empirical Strong Ground Motion Attenuation Relations to Include the Amplitude and Duration Effects of Rupture Directivity", Seismological Research Letters, Seismological Society of America, Volume 68, No. 1, January/February, pp D-9 GEI Consultants Project #
214
215
216
217

218
219
220
221

222
223
224
225
226
227

228
229
230 APPENDIX E REVIEW OF LABORATORY DATA E.1 Static Analysis Parameters We reviewed the extensive field and laboratory data developed over the years and, especially, the analysis parameters selected for the S&W and WA studies. A summary of the available information is presented in Tables 7-1, 7-2 and 7-3 of this report. Most of the static parameters required for our slopes stability analyses were obtained from such review. Table E-1 summarizes the field and laboratory unit weights and index properties of the various dam and foundation zones identified by the DSOD (see Figure 7-2 of this report). These properties include moisture content, Atterberg limits (AL), clay content (percent passing #200 sieve) and gravel content (percent retained in #4 sieve). Average values, as reinterpreted from our review, are also provided in Table E-1 for each of the dam and foundation zones. Table E-2 presents the results of the undrained shear strength (S u ) testing previously performed on the various materials, as summarized in the 1966 Shannon and Wilson (SW) and 1976 W.A. Wahler and Associates (WA) reports. SW provided a range of S u values for each type of materials. In Table E-2, Zone 4 refers to either Zone 4 or Zone 4.5 previously used by the DSOD. As discussed subsequently, we considered a single zone, Zone 4, to represent these two zones Table E-3 summarizes the results of isotropically consolidated undrained triaxial tests (TXICU) performed by SW. We reviewed the interpretation of strength envelopes provided in Appendix A of the SW report, and generally agree with such interpretations. Table E-4 summarizes the results of all strength testing performed by WA, and includes unconfined compression tests (UC), unconfined undrained triaxial tests (TXUU), and isotropically consolidated undrained triaxial tests (TXICU) or anisotropically consolidated triaxial tests (TXACU or K o CU). Consolidated-undrained triaxial tests are also referred as CU tests in this report. As we found sufficient details of the laboratory testing performed by WA, we independently re-estimated the unconfined shear strengths (S u ) and the total stress (c, Φ) and effective stress (c, Φ ) strength parameters from the raw laboratory test data included in one of the appendices the 1976 report. Our updated strength estimates are shown in Table E-4. We also assessed the liquefiability of the various dam and foundation zones, based on liquid limits (LL), plasticity indexes (PI), and water contents (w, in % of dry unit weight). Section 7.6 of the report discusses how these parameters were used to identify whether each AL data point, defined by LL and PI, is positioned within or outside of two critical zones, Zone A, classic cyclic liquefaction and Zone B potentially liquefiable. Potential liquefiability is further assessed through the results of a supplementary test, based on water content w and LL. The results of such classification and testing are presented in Table E-5 and on Figure E-1 through E- 6, for each zone identified within the dam section and foundation alluvium. We found that a single data point for a sample within Zone 5 of the alluvium was potentially liquefiable. Therefore and consistent with previous studies, we conclude based on the results of these tests E-1 GEI Consultants Project #
231 and because of the high percentage of clayey fines (materials passing the #200 sieve) encountered in all materials that they are not liquefiable (liquefiable being defined as potential sudden loss of strength under applied cyclic loading). Based on the information contained in Tables 7-2 and 7-3, we plotted the effective stress and total stress Mohr envelopes for Zones 1, 2, 3, 4.5 and 5, as estimated by previous investigators and as re-estimated in this review. Zones 1, 2 and 3 represent the core, upstream and downstream shells, respectively. Zone 4.5 and 5 are within the alluvium on which the dam is founded, below the downstream shell and upstream shell, respectively. Based on the depth at which samples were recovered, we did not interpret any sample tested as belonging to Zone 4. Hence, based on their similar corrected penetration resistance and the lack of samples from Zone 4, we combined Zone 4 and Zone 4.5 as a single Zone 4 in our slope stability calculations. In general, we have several comments regarding the way some of the CU triaxial tests were performed. These comments suggest that the testing performed 30 years ago or more may not match the quality of the testing that could be achieved today in a modern and well-equipped laboratory: The tests were performed very rapidly, especially considering the clayey nature of the samples recovered. Typically, a maximum strain rate of 2 percent should be used, which means that for the type of materials encountered at Lafayette Dam, such tests would now be performed over periods of time that would range from days to an entire week. Results interpretation and, probably, data collection were done manually, which probably explains why the tests were performed so quickly. No computer-control was then available to continue testing overnight. Normally, change in sample volume should level out at the end of the initial consolidation phase. Some tests plots indicate that the consolidation had not been fully completed before proceeding with the actual testing. Some test were arbitrarily switched from stress-controlled to strain-controlled, sometimes several times during the testing. The data presented in the appendices of the previous reports include no deviator stresses or pore-water pressures (u) when a state of failure has been reached. Sample descriptions are sometimes incomplete or inconsistent with the field logs, e.g. sieve data for some sizes are not provided. We found one sample of the Wahler 1976 testing program (Zone 5, hole SS-23 at ft depth) to have a strength envelope somewhat lower than the other tests in that zone, due to possible disturbance of that sample upon recovery, or a perhaps simply indicating a local weaker sample, not truly representative of the average strength of that zone. As the other tests in Zone 5 materials were relatively consistent, we ignored that specific test in our recommended strength estimate. E-2 GEI Consultants Project #
232 On Figures E-7 through E-11, effective stress strength envelopes developed from the S&W and WA testing programs, as well as those selected by the DSOD, are compared with those recommended after our review and interpretation of the available data. The results of the two previous testing programs are reasonably consistent, although some variability does exist. Total stress strength envelopes are presented on Figures E-12 through E-16. Again, most of the tests provide reasonably consistent results. As we have no direct detailed knowledge on how the tests were performed, we took a relatively prudent, but not excessively conservative approach in our selection of strength envelopes for each zone. Overall, specimens recovered from Zone 2 (downstream shell) display higher frictional resistance and undrained strength than samples from the other zones, based on either effective stress or total stress strength considerations. Samples recovered from the core, upstream shell, or from the foundation do not exhibit strength characteristics that significantly differ from each other. E.2 Dynamic Analysis Parameters E.2.1 General Properties significant to the dynamic response analysis of an embankment dam are the low-strain shear and bulk moduli, damping coefficients and the cyclic strength characteristics of the materials encountered. Low-strain modulus and damping govern the dam response in the elastic range. Undrained static and cyclic strengths define thresholds for possible occurrence of large strains and plastic flow during dynamic response and, in the case of sandy materials, for any potential development of excess pore pressure build up. Because no dynamic analyses were included in our review, we only performed a limited evaluation of the 1976 dynamic testing results. Modern dynamic analysis methods give less emphasis to laboratory cyclic triaxial testing than was given in the 1970 s. This is because dynamic laboratory testing does not rigorously duplicate field conditions and because truly undisturbed samples of a size sufficient for such tests to be meaningful are rarely recovered. While a few research laboratories still perform cyclic triaxial or cyclic direct shear tests, current practice favors the use of field penetrating testing (SPT or CPT) and shear wave velocity measurements to assess dynamic soil properties and lower-bound estimates of the cyclic strength of the materials encountered. E.2.2 Dynamic Moduli and Damping WA used in 1976 the Seed and Idriss relationships (1970) for clay shear modulus and damping. The low-strain dynamic shear modulus of the dam and foundation materials was defined from classic relationships between G and S u. Field-measured shear wave velocities were also used in that purpose. This methodology is reasonable, although the low-strain shear moduli may be on the low side. This would be of limited significance in modern nonlinear analyses, except at very low levels of dynamic shaking, of little interest to assessing the dam overall performance under earthquake loading. It should be noted that such relationships, in the case of clays, have been updated by Dr. K.H. Stokoe and his colleagues at the University of Texas, Austin. E-3 GEI Consultants Project #
233 E.2.3 Cyclic Strength Stress-controlled cyclic triaxial tests were performed in 1976 on selected specimens. There is little basis to assess the quality of the dynamic testing program performed on the Lafayette Dam and foundation materials, other than knowing that these tests were performed by W.A. Wahler and Associates, a firm recognized at the time as a leader in the field. The WA laboratory was long considered as being one of the best-equipped and best-experienced laboratories to perform such tests. The WA 1976 laboratory testing provides a reasonable assessment of the cyclic strength of the Lafayette materials. Stress-controlled cyclic tests were performed on isotropically consolidated (K c =1) or anisotropically consolidated samples (K c =1.5), for various confining pressures. Tests were performed on the core, shell and foundation materials. While the specimens tested did not experience sudden loss of strength, cyclic strength curves were defined when the samples tested reach 5 percent or 10 percent axial strain under the applied cyclic deviator stress. The numbers of blows to reach such axial strain levels were recorded and define the cyclic strength. The cyclic stress ratios (CSR) causing 10 percent axial strain in laboratory specimens are presented in Table 7-6 of the main part of this report. Cyclic triaxial tests do not represent field conditions as well as simple cyclic shear tests would do. However, the CSRs causing a specified level of axial strain (or liquefaction in the case of sandy materials) in the triaxial tests (σ dc /2σ 3 ) can be related to the CSR under multi-dimensional shaking conditions in the field (τ h /σ v ) by the following expression: τ h /σ v = C r σ dc /2σ 3 [ E-1 ] In the above equation, τ h represents the horizontal earthquake-induced shear stress, σ v the vertical effective overburden pressure, σ dc the applied cyclic deviatoric stress in the laboratory sample and σ 3 is the lateral initial consolidation stress of such sample. The correction coefficient C r varies from about 0.6 for K o = 0.4, to about 0.9 to 1.0 for K o = 1 (Seed and Idriss, 1982). We interpreted the WA cyclic tests results and computed the laboratory CSRs causing 10 percent axial strain in the tested specimens at 10, 15, 20 and 30 cycles. Such laboratory CSRs can be converted to field CSRs and were compared with estimated induced CSRs under the various earthquake scenarios considered in order to quickly assess the straining potential of the dam and foundation materials. The downstream foundation materials (Zone 4) appear to have lower laboratory CRSs that the upstream foundation (Zone 5). For example, see Table 7-6, for K c =1 and N=15 (which corresponds to the number of equivalent uniform stress cycles commonly used for the reference magnitude M w 7.5), laboratory CSRs required to reach 10 percent axial strain, under 6,000 psf confining pressure, are 0.35 in the downstream alluvium (Zone 4), but 0.40 and 0.55 in the central and upstream foundation (Zone 5). Similarly, for K c =1.5 and 6,000 psf, the CSR in Zone 4 is 0.31, but 0.34 and 0.37 in Zone 5. For the two series of tests performed in the core materials, one series (6,000 psf) resulted in the lowest CSR for N equal to 15 or greater, compared with the alluvium or the downstream shell materials, while the other series (3,000 psf) led to higher CSRs, compared with the other materials. Only a limited number of samples were E-4 GEI Consultants Project #
234 tested in the shell materials (Zone 2), but these tests consistently yielding higher laboratory CSRs than in the other materials. One could also consider using the corrected field penetration testing data to estimate lowerbound cyclic strengths for the various dam and foundation zones. But for the clayey materials encountered, cyclic failure is progressive and would occur as a result of large straining, hence is more difficult to define than in the classic liquefaction. Hence, the applicability to clayey materials of standard relationships between cyclic stress ratios (CSR) at failure based on field observations and SPT data corrected to cyclic simple shear condition is questionable and such approach was not considered. E.2.4 Post-Cyclic Failure Residual Strength A parameter of potential significance to clayey dam analysis is the post-cyclic undrained residual strength, S u,r (Castro, et al., 1987). The concept of residual strength was unknown in 1976, and has been controversial since first developed. It is now become better accepted in the geotechnical engineering profession. While Castro's suggested laboratory testing procedures remain difficult to implement and are sensitive to subjective interpretation, they would undoubtedly be helpful in the case of clayey materials such as present at Lafayette Dam and site, and could be supplemented by in-situ testing, as discussed subsequently. As for the cyclic strength, simple estimates of the residual strength obtained through empirical relationships based on the corrected standard penetration resistance (SPT) would not be reliable in the case of clayey materials such as those encountered. The relationships between the residual undrained shear strength S ur and N 1 (60) cs based on various case histories and provided by Seed and Harder (1990) and other researchers (Seed, R.B., 1999) are most useful in the case of sandy materials, and their applicability to clayey materials would be highly questionable. In 1956, Dukleth back-calculated strength parameters for both the embankment and alluvium from the at-rest post-failure position of the 1928 failed embankment slope. He assigned a cohesion of 580 psf and a friction angle of 12 degrees to these materials. Such calculations provide an indication of what the residual strength might be, and suggest a residual strength substantially lower than the static strength parameters measured in 1966 and 1976 by the District and its Consultants. The residual strength of clayey materials remains difficult to measure in the laboratory, and is still somewhat prone to controversy, when weak materials are present. This is because field conditions rarely yield undisturbed samples, and are difficult to reproduce in the laboratory. However, in-situ shear vane tests can be performed to obtain the peak and ultimate (remolded or residual) strength of clayey materials. The use of carefully field-measured residual strengths would be useful for any more detailed numerical analysis that the District might want to consider for Lafayette Dam. E-5 GEI Consultants Project #
235 REFERENCES APPENDIX E Castro, G. et al. (1987), "On the Behavior of Soils During Earthquakes -Liquefaction", in Soil Dynamics and Liquefaction, A.S. Cakmak, Editor, Elsevier, Publisher, The Netherlands, pp Dukleth, G. W. (1956), Lafayette Dam No. 31-2, Stability Study, Internal Memorandum to Mr. A.W. Brown, DSOD, March 8, in East Bay Municipal Utility District s project files. Seed, H.B.; Idriss, I.M. (1982), Ground Motions and Soil Liquefaction During Earthquakes, EERI Mongraph Series, 134 pp. Seed, H.B.; Idriss, I.M. (1970), "Soil Moduli and Damping Factors for Dynamic Response Analysis", University of California, Berkeley, Report No. EERC/70-10, December, 15 pp. Seed, R.B. (1999), Engineering Evaluation of Post-Liquefaction Residual Strengths, presented at TRB Workshop New Approaches in Liquefaction Analyses, Washington, D.C., 10 January, Proceedings, 10 pp. Seed, R.B.; Harder, L. F. H., Jr. (1990), "SPT-based Analysis of Cyclic Pore Pressure Generation and Undrained Residual Shear Strength", in Proceedings of H.B. Seed Memorial Symposium, Vol. II, May, pp E-6 GEI Consultants Project #

236

237

238
239

240
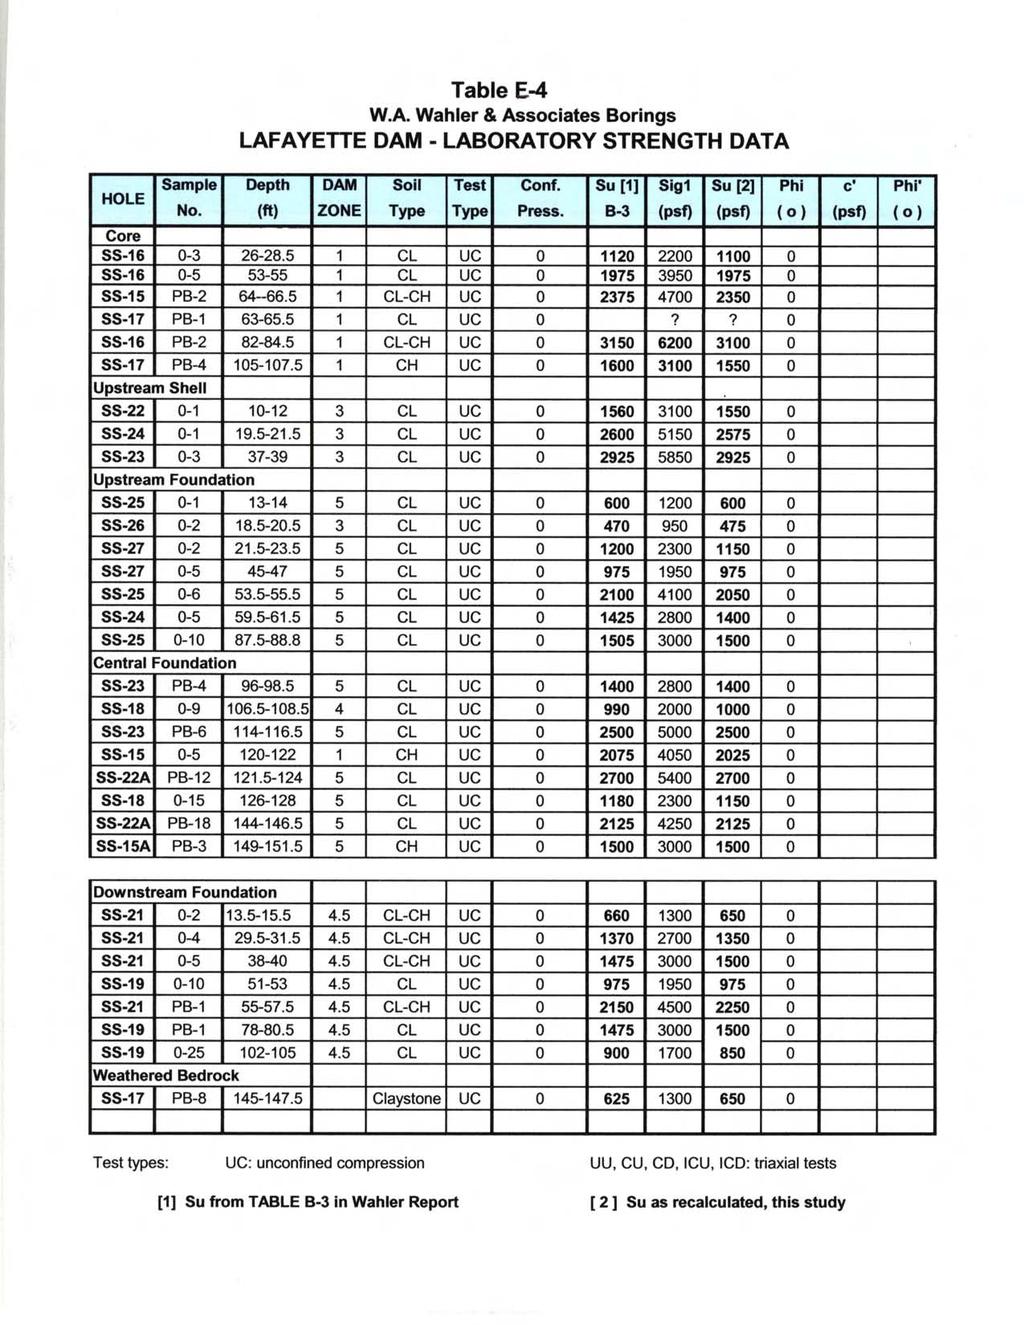
241

242
243
244
245
246
247
248
249
250
251
252
253
254
255
256
257
258
259 APPENDIX F CALCULATION OF EARTHQUAKE-INDUCED DEFORMATIONS In this Appendix, we describe the various approaches taken to estimate the potential earthquakeinduced deformations of Lafayette Dam. F-1 Simplified Newmark s Method In 1965, Newmark estimated earthquake-induced displacements in embankments by assuming that slope movements are initiated when inertia forces on a potentially sliding mass exceed the available yield resistance along the bounding surface of failure. Newmark s method is normally implemented by double-integration of acceleration increments above the yield acceleration, as calculated in a time history response analysis. When acceleration response histories have not been developed, as is the case herein, Newmark proposed a simpler approach where he related the peak acceleration (PGA) and velocity (PGV) of the input motion to standard maximum displacement estimates depending on the sliding resistance and yield acceleration factor (N). The Newmark s displacement estimates are, of course, significantly influenced by the computed yield acceleration (N or K y ). The PGV can be estimated from the applicable PGA and magnitude of the earthquake considered. Newmark's method applies to dams on rigid foundations, hence may provide lower-bound deformation estimates in the case of Lafayette Dam, which is mostly founded on deep alluvium. However, as discussed subsequently, we also took an upper-bound approach, which exaggerates the influence of the foundation alluvium. Newmark s Method assumes rigid body movement of a failed portion of the embankment and formation of a distinct failure surface, two recognized potential limitations. Newmark's original upper bounds of displacement applied to a "normalized" Maximum Probable Earthquake with a PGA of 0.50g and a PGV of 30 in/s. While the formulas can be used with other ground motion parameters, they imply a number of effective pulses for the standardized earthquake not greater than six. Newmark suggested that, for magnitudes larger than he considered in 1965, the number of effective pulses be assumed to be proportional to the square root of the expected duration of shaking. We made such an adjustment. Newmark also considered various standardized displacement estimates for symmetrical or unsymmetrical resistance. In the case of embankment dams, the DSOD (Vrymoed, 1996) extended Newmark s procedure by applying it successively to the upstream and downstream slopes. The crest settlement was obtained by vectorially combining the displacements of both slopes. In order to estimate crest settlement from the computed maximum slope displacements, we simply took the crest settlement as half of the slope movements. As Lafayette Dam is not symmetrical, we took Newmark s standardized displacements for unsymmetrical resistance as the basis for our estimated maximum displacements. F-1 GEI Consultants Project #
260 F-2 Makdisi-Seed s Simplified Procedure Recognizing that a dam responds as a flexible body, Sarma (1975) varied the accelerations as a function of depth within the embankment. Makdisi and Seed (1977, 1978) further refined that procedure, using the examples of clayey dams, which actually included Lafayette Dam. Assuming a rigid foundation, they calculated the peak crest acceleration through a square-rootof-the-sum-of-the-squares (SRSS) combination of the peak accelerations of the first three modes of dam vibration. Standardized or project-dependent spectral shapes, such as those recommended for Lafayette Dam, see Figures D-1 to D-4 in Appendix D, can be used in that purpose. Then, using strain-dependent average dynamic properties (Seed and Idriss, 1970), they used the acceleration response of equivalent-linear (EQL) finite element models of several embankment dams to correlate the average peak acceleration of the sliding mass with the depth of the failure surface. They also related the normalized displacement of the soil mass with the ratio of yield acceleration to average acceleration of soil mass (k y /k max ), for three different magnitudes, 6.5, 7.5 and 8.0. The procedure can be refined using actual field or laboratory-tested dam properties. Makdisi and Seed used dams of moderate height (75, 132, and 150 feet) and their procedure applies best to dams of similar height such as Lafayette Dam. In taller dams, peak accelerations do not necessarily increase regularly from base to crest, resulting in possible errors in estimating k max. Although the Makdisi-Seed's procedure relates normalized displacement and dam height through the calculated period, it is not clear whether the influence of the dam size is properly accounted for. For dams higher than 200 feet, a prudent approach may consist of increasing calculated displacements proportionately to the dam height. Makdisi and Seed clearly stated that their procedure only applies to dams built of materials experiencing little or no strength loss during earthquake shaking (such as densely-compacted sands or cohesive clays), a sometimes forgotten restriction. Such restriction does not apply in the case of Lafayette Dam. Due to the assumptions of no loss of strength during shaking and EQL properties, the procedure is, however, questionable for severe ground shaking (say 0.50g or greater) as plastic flow may be induced even in competent embankment materials. Furthermore, it is very sensitive to crest acceleration estimates. As for the Newmark s method, the Makdisi-Seed estimates are very sensitive to the calculated yield acceleration. Based on the location of the critical failure surfaces obtained in our static slope stability analyses, we assumed deep failure surfaces in our application of the Makdisi-Seed procedure to Lafayette Dam. As we used peak strength parameters to obtain the yield accelerations, we lowered our calculated yield acceleration by 20 percent, which approximates the use a reduced strength of 80 percent of the static undrained strength, as recommended by Makdisi and Seed in the application of their procedure. F-3 Bureau, et al. s Empirical Correlations Bureau, et al. (1985) used the observed performance of concrete face and earth core rockfill dams (ECRD's) to develop an empirical relationship between the local intensity of shaking, expressed as the Earthquake Severity Index (ESI), and the expected relative crest settlement for this type of dam. Calculated settlements assume the dam to be founded on bedrock or hard soils, F-2 GEI Consultants Project #
261 although a few of the dams used in developing the correlation were constructed on alluvial foundations. The ESI is defined as: ESI = PGA x (M - 4.5) 3 where PGA represents the applicable peak ground acceleration in g's and M is the magnitude. [F-1] True nonlinear deformation analyses of a 325-foot high typical CFRD, using an elastic-plastic, Mohr-Coulomb model and stress-dependent friction angle, provided results consistent with the ESI-settlement relationship (Bureau et al., 1985). As no volumetric changes were considered in such verification analyses, the ESI-settlement relationship applies best to compacted rockfill, a material that does not develop significant loss of strength during shaking. In 1987, the authors tested the correlation with friction angles other than typically encountered in rockfill, using the results of physical model tests on dry sand embankments (Roth et al., 1986). The extended correlations are still primarily intended for rockfill dams, but can be used in the case of densely compacted granular materials, using the applicable friction angle. In subsequent unpublished studies, Bureau tested the ESI relationships to estimate deformations of embankments dams built of well-compacted soil, regardless of the materials they were built of, and used comparison with the results of more detailed finite difference studies. He found that the ESI-relative crest settlement relationships led to reasonable estimates, in the case of materials that are not liquefiable and when computed deformations remain moderate. As the materials of Lafayette Dam have a high clay content, the application of this procedure, which relies primarily on the effective friction angle, is conservative at low confining pressures, as the influence of cohesion is essentially ignored. If failure surfaces are controlled by deep failure surfaces, then the frictional component of the strength envelope predominates. F-4 Jansen s Formula In a discussion of the observed performance of Cogoti Dam, Chile, Jansen (1987) presented an empirical equation to estimate earthfill or rockfill dams settlement under earthquake loading. In Jansen's equation, the estimated displacement U depends on the magnitude M, the yield acceleration k y and the maximum crest acceleration k m. It is expressed as follows: U = 10 x (M/10) 8 x (k m - k y ) 1.5 / k y [F-2] Jansen did not describe how he developed his formula. A major shortcoming is that his calculated settlement is independent of the dam height. His verifications, using one hypothetical and four existing dams, were based on "estimated", rather than calculated yield accelerations, but are influenced by the experience of this distinguished author. Jansen's equation implies that no deformations will occur if the peak acceleration remains below the yield acceleration, and applies to dams not vulnerable to liquefaction, such as Lafayette Dam. A correction factor taking into account the height of smaller dams was proposed by Bureau (1997). F-3 GEI Consultants Project #
262 F-5 Swaisgood s Approach Swaisgood (1995) estimated seismic crest settlements based on statistical treatment of empirical information developed from a review of the seismic performance of 54 existing embankment dams. He related the crest settlement (in percent of combined dam and alluvium thickness) to a Seismic Energy Factor (SEF) and three constants based on type of dam construction (K typ ), dam height (K dh ), and alluvial thickness (K at ) as follows: Relative Settlement (%) = SEF x K typ x K dh x K at [F-3] Like the ESI, the SEF depends on magnitude and PGA of the causative earthquake. Swaisgood differentiated between rockfill (ECRD's or CFRD's), earthfill (E) and hydraulic fill (HF) dams. Furthermore, his settlement estimate attempts to incorporate the effect of alluvial foundations. However, dam and foundation are assumed to contribute to the settlement in proportion of their respective heights, a potential limitation for weak dams on strong foundations, or the reverse. Material strength is not used other than through the consideration of three types of dams. The limited applicable data justify extreme caution when applying Swaisgood's formula to HF's or loose embankment dams that may experience significant excess pore pressures. This is not the case for Lafayette Dam. In 1998, Swaisgood has submitted an updated version of his approach. He added 60 case histories of embankment dams severely shaken by historic earthquakes and, following a regression analysis on the available data, expressed the computed dam crest settlement (CS) as a function of the SEF and a resonance factor (RF), specified for three types of dams (earthfill, hydraulic fill and rockfill) as a function of the distance in km between the seismic energy source and the dam. Although Swaisgood s equations are empirical and are based on the observed performance of dams that may differ from Lafayette in size, slope geometry and zoning or types of materials encountered, it is helpful to place deformation estimates in perspective with historic observations. Swaisgood s 1995 correlations represent the only simplified procedure that differentiates between dams founded on bedrock or alluvium and, for that reason, were also considered in our deformation estimates for Lafayette Dam. We used a weighting factor of 0.5 to each of his 1995 and 1998 equations. F-6 Idriss s Approach In his review of the draft of our report, Dr. Idriss recommended a procedure similar to the Makdisi-Seed's procedure, but with the following modifications: F-4 GEI Consultants Project #
263 a) Use a 15 percent reduction in static undrained strength to compute the yield acceleration (we have approximated a 20 percent reduction, as suggested in Makdisi- Seed's original paper). b) Estimate the transverse crest acceleration from empirical correlations based on observed records, see Figure F-1, instead of the procedure recommended by Makdisi- Seed (which is based on the specified response spectrum and the estimated periods of the first three modes of vibration of the dam). Other than the two above changes, the Makdisi-Seed s and Idriss procedures are identical. They use the same empirical correlations between the depth y of the sliding mass and the ratio k max /a max of the effective acceleration of the sliding mass (k max ) and crest acceleration (a max ), and between the computed displacement and the ratio k y /k max, as established for magnitudes of 6.5, 7.5 and 8 ¼. Modification a) slightly increases the effective yield acceleration (K y ) to be used, hence slightly reduces computed deformation estimates, compared with Makdisi-Seed s procedure. Modification b) has the most significant impact, since for the Hayward Earthquake (PGA = 0.60g), the upper range crest acceleration computed from Fig. F-1 is 0.76g, hence quite lower than computed in the Makdisi-Seed's procedure, see Paragraph F-7. This appreciably reduces the average acceleration k max of the sliding soil mass. Hence, both modifications a) and, especially, modification b) reduce estimated deformations, compared with the original Makdisi- Seed's method. It is not surprising that the range of crest accelerations obtained from Figure F-1 is lower than estimated in the Makdisi-Seed's procedure from the specified 84 th percentile response spectrum. This is because Figure F-1 shows "upper-range" and "lower-range" relationships between base and peak accelerations, empirically developed from acceleration records obtained at the crest of existing dams. Records from most "natural" earthquakes display a normalized frequency content significantly less complete (demanding) than the specified 84 th percentile response spectrum, except occasionally in a limited range of periods. Furthermore, the data shown on Figure F-1 include no base accelerations higher than 0.48g, and most likely correspond to magnitudes lower than that specified for the Hayward Earthquake (M w =7.25). Hence, while extrapolating the data shown on Figure F-1 a specified PGA of 0.60 g appears reasonable, the procedure has not been verified for large magnitudes and short distances between the site and potential earthquake sources, for which essentially no dam base/crest records have been obtained to date. F-7 Computed Deformations Computed deformation estimates in the case of Lafayette Dam are presented on Tables F-1 through F-4, for the four earthquake scenarios considered in this study, which correspond to Maximum Considered Earthquakes (MCE) centered along the Hayward, Calaveras, San Andreas, or Lafayette-Reliez Valley faults at their closest approach to Lafayette Dam. For those of these methods that depend on the computed yield acceleration, separate estimates were made F-5 GEI Consultants Project #
264 for the upstream and downstream slopes, as respective yield accelerations of 0.29g and 0.14g were obtained, based on the total-stress method of analysis. The Idriss procedure was only applied to the Hayward MCE, which is the most critical and controls the evaluation of the seismic safety of Lafayette Dam. Several of the analysis methods discussed in the previous paragraphs calculate estimated maximum deformations. To facilitate comparisons between the various procedures, we assumed that the ratio between maximum crest settlement and maximum displacement (deformation) would be Such ratio was based on the two following lines of reasoning: a) A review of the maximum displacements and crest settlements reported in 1928 after the static slope failure of Lafayette Dam, b) Calculated average ratios between maximum dynamic crest settlements and maximum displacement vectors computed in detailed nonlinear time-history response analyses of six other embankment dams. In 1928, the incomplete top of the dam dropped a maximum of 24 to 26 feet in its central portion. The lower portion of the downstream slope moved about 40 feet horizontally. The maximum vector displacement of the downstream edge of the crest can be estimated at between 50 and 60 feet, see Figure 3-3 of the main portion of this report. Hence, a ratio of 0.50 between maximum settlement and displacement appears to be appropriate, in the case of Lafayette Dam, based on observations made in The choice of a value of 0.50 for such ratio is further substantiated in the results of detailed nonlinear dynamic response analyses performed for six other dams and a pit slope by Mr. Bureau and his former colleagues at Dames & Moore. These studies were completed for Pleasant Valley, Magalia, Lake Madigan, Hidden and Los Angeles dams, in California, Los Leones Dam, Chile, and the South Slope of Pit O, a quarry facility operated by the Alameda County Water District. For these analysis cases, the specified seismic criteria were intended to represent earthquakes between magnitudes 7 to 8+. Computed ratios between maximum non-recoverable crest settlement and slope displacement ranged from 0.27 to 0.85, with a mean value of Hence, in the absence of detailed studies, a ratio of 0.50 is a reasonable choice in the case of an embankment dam such as Lafayette Dam. Additional information on the aforementioned detailed studies can be found in several related technical publications (Bureau, 1996, 1997, 1999; Bureau, et al., 1994, 1996; and Roth, et al., 1991) All methods, except Swaisgood, ignore the foundation soils in their calculations of deformation estimates. As the foundation alluvium probably significantly contributes to the expectable overall deformations, as being potentially the weakest materials, we took two successive approaches: 1) A lower-bound approach simply assumed that the dam is founded on a non-deformable foundation, and displacements or relative crest settlements with respect to the rigid base are calculated based on the dam height, or 132 feet. 2) In an upper-bound approach, we assumed that the foundation alluvium, of maximum thickness 90 feet in the central part of the dam, would be part of the dam itself, which F-6 GEI Consultants Project #
265 was simply treated as a 222-foot-high embankment. Such results of course, provide more conservative estimates than would be expected in reality, because the restraining influence of the upstream and downstream alluvium, outside of the dam footprint, is ignored. More realistic, but unknown, estimates should be intermediate between those obtained in the lower-bound and the upper-bound approaches. Hence, we considered that averaging the predictions obtained by the application of these various simplified procedures and for Approach 1) and Approach 2) provides the preferred (most reliable) estimates for each of the earthquake scenarios considered, keeping in mind that a substantial margin of error (up to 100 percent) can be associated with any of the simplified procedures implemented. In the case of the Hayward MCE (most critical), we have also used the procedure suggested by Dr. Idriss in his review memorandum, approximating his recommended 15 percent reduction in static soil strength to compute k y (instead of 20 percent used for several of the other procedures) and an selecting the upper range crest acceleration obtained from Figure F-1 for the specified base acceleration of 0.60g. The new crest acceleration is 0.76g, and is considerably less severe than the value 1.33g computed in the Makdisi-Seed's simplified procedure from the specified 84 th percentile spectrum (based on the estimated periods of the first three modes of vibration of Lafayette Dam). The Idriss crest acceleration of 0.76g is 57 percent of that computed through the standard simplified Makdisi-Seed procedure. This results in a substantial reduction of the average acceleration of the sliding mass (k max ) and resulting estimated deformations. After implementing the above steps, computed maximum deformations range from about 4 to 12 inches (upstream slope) to 25 to 62 inches (downstream slope), hence are considerably lower than those obtained through the standard simplified Makdisi-Seed procedure (29 to 89 inches, upstream slope; and 48 to 160 inches for the downstream slope). Based on the successive application of all the procedures discussed in this Appendix, we confirmed that the Hayward Earthquake would be the most critical to Lafayette Dam. For such MCE earthquake scenario, we estimated crest settlements that might range between 0.9 to 4.5 feet, 2.7 feet representing our preferred estimate. The next most critical event would be the Lafayette-Reliez Valley (LRV) Earthquake, because of its large peak ground acceleration (0.76g). Estimates of crest settlements for the LRV MCE range from 1.0 to 5.3 feet, with a preferred estimate of 2.2 feet. Our preferred deformation estimates for the San Andreas event are less than computed in the 1976 EQL finite element analysis by W.A. Wahler and Associates (WA). WA calculated a maximum shear displacement of 8 to 9 feet, and predicted it would occur within the upstream foundation. We calculated slope deformations that range from 0.5 feet to 6 feet using the Makdisi-Seed and Newmark s procedures, but showed the largest displacements to potentially occur on the downstream side. For the San Andreas event, our preferred estimates of crest settlements range from 0.2 feet to 2.8 feet, and our mean estimate of 1.5 feet falls somewhat below the range predicted by WA (between 2 and 3 feet). Our range for maximum average lower / upper bound estimates of crest settlements (2.6 to 3 feet) is consistent with the Wahler studies. F-7 GEI Consultants Project #
266 The San Andreas response spectrum specified in this study and the WA s response spectrum for that event are somewhat similar at the periods of interest to the dam response ( sec), but the WA spectrum is more conservative at high frequencies (period less than 0.5 sec), see Figure 4.4 in the main text of this report. GEI s Hayward and LRV response spectra are more demanding than the WA Hayward spectrum, in that same range of periods. F-8 GEI Consultants Project #
267 REFERENCES APPENDIX F Bureau, G. (1999), Seismic Analysis and Safety Evaluation of Embankment Dams, Proceedings, Second US-Japan Workshop on Advanced Research on Dam Earthquake Engineering, UJNR/JSDE, Tokyo, Japan, May 8-11, 16 pp. Bureau, G. (1997), Evaluation Methods and Acceptability of Seismic Deformations in Embankment Dams, XIX th ICOLD Congress, Florence, Italy, Proceedings, pp Bureau, G. (1996), Numerical Analysis and Seismic Safety Evaluation of Embankment Dams", Boston Society of Civil Engineers Section of ASCE (BSCES), Seminar on "Dam Inspection, Analysis and Rehabilitation", November 2, Bentley College, Waltham, MA, Proceedings, 54 pp. Bureau. G.; Edwards, R.; Blumel, A.S. (1994), Seismic Design of Stage IV Raising, Los Leones Dam, Chile", 1994 Annual Conference, The Association of State Dam Safety Officials, Sep , Boston, Massachusetts, in Proceedings Supplement, pp , and ASDSO Newsletter, Vol. 9, No.5, September, pp Bureau, G.; Inel, S.; Davis, C.A.; and Roth, W. H. (1996) Seismic Response of Los Angeles Dam, CA During the 1994 Northridge Earthquake", (co-authors: W.H. Roth, Sinan Inel & George Brodt), USCOLD Annual Meeting and Lecture, July 22-26, Proceedings., pp Bureau, G.; Volpe, R.L.; Roth, W.R.; Udaka, T. (1985), "Seismic Analysis of Concrete Face Rockfill Dams", ASCE Int. Symp. on CFRD's, Detroit, Oct. 21, in "Concrete Face Rockfill Dams - Design, Construction and Performance", pp , and Closure (1987), ASCE Journal of the Geotechnical Eng. Div., Vol. 113, No. 10, October, pp Idriss, I.M. Dynamic Stability Review of Lafayette Dam, Letter-Report to GEI Consultants, Inc., August 31, 2004, Draft 2, 9 pp. Jansen, R.B. (1987), "The Concrete Face Rockfill Dam. Performance of Cogoti Dam under Seismic Loading", discussion of a paper presented at ASCE's Symposium on Concrete Face Rockfill Dams, ASCE Journal of the Geotech. Engineering Div., Vol. 113, No. 10, October. Makdisi, F.; Seed, H.B. (1977), "A simplified Procedure for Estimating Earthquake-Induced Deformations in Dams and Embankments" U. of California, Berkeley, EERC Report No. UCB/EERC-77/19, 33 pp. plus Appendices. Makdisi, F.I., and Seed, H.B., (1978). "Simplified Procedure for Estimating Dam and Embankment Earthquake Induced Deformations". Journal of Geotechnical Engineering, ASCE, July. Makdisi, F.I., and Seed, H.B., (1979). "Simplified Procedure for Evaluating Earthquake Response". Journal of Geotechnical Engineering, ASCE, December. F-9 GEI Consultants Project #
268 Newmark, N.M. (1965), "Effects of Earthquakes on Dams and Embankments", Rankine Lecture, Geotechnique 15, No. 2, pp Roth, W.H.; Bureau, G.; Brodt, G. (1991), Pleasant Valley Dam: An Approach to Quantifying the Effects of Foundation Liquefaction, 17 th ICOLD, Vienna, Austria, June, Proceedings, pp Sarma, S.K. (1975), "Seismic Stability of Earth Dams and Embankments", Geotechnique 25, No. 4, pp Seed, H.B.; Idriss, I.M. (1970), "Soil Moduli and Damping Factors for Dynamic Response Analysis", University of California, Berkeley, Report No. EERC/70-10, December, 15 pp. Seed, H.B., and Idriss, I.M. (1982) "Ground Motions and Soil Liquefaction During Earthquakes", Earthquake Engineering Research Institute, Monograph Series. Swaisgood, J.R. (1995), "Estimating Deformation of Embankment Dams Caused by Earthquakes", ASDSO Western Regional Conference, Red Lodge, Montana, May Swaisgood, J.R. (1998), Seismically-Induced Deformation of Embankment Dams, 6 th U.S. National Conference on Earthquake Engineering, Seattle, Washington, June Vrymoed, J.L. (1996), "Seismic Safety Evaluation of Two Earth Dams", in "Earthquake Engineering For Dams", Western Regional Technical Seminar, Association of State Dam Safety Officials, April 11-12, Sacramento, pp F-10 GEI Consultants Project #

269

270
Date: April 2, 2014 Project No.: Prepared For: Mr. Adam Kates CLASSIC COMMUNITIES 1068 E. Meadow Circle Palo Alto, California 94303
 City of Newark - 36120 Ruschin Drive Project Draft Initial Study/Mitigated Negative Declaration Appendix C: Geologic Information FirstCarbon Solutions H:\Client (PN-JN)\4554\45540001\ISMND\45540001 36120
GEOLOGY, SOILS, AND SEISMICITY
 4.9 GEOLOGY, SOILS, AND SEISMICITY 4.9.1 Introduction Information about the geological conditions and seismic hazards in the study area was summarized in the FEIR, and was based on the Geotechnical Exploration
WHAT SEISMIC HAZARD INFORMATION THE DAM ENGINEERS NEED FROM SEISMOLOGISTS AND GEOLOGISTS?
 WHAT SEISMIC HAZARD INFORMATION THE DAM ENGINEERS NEED FROM SEISMOLOGISTS AND GEOLOGISTS? Martin WIELAND 1 ABSTRACT For large dam projects a site-specific seismic hazard analysis is usually recommended.
Converse Consultants Geotechnical Engineering, Environmental & Groundwater Science, Inspection & Testing Services
 Converse Consultants Geotechnical Engineering, Environmental & Groundwater Science, Inspection & Testing Services Ms. Rebecca Mitchell Mt. San Antonio College Facilities Planning & Management 1100 North
STRUCTURAL STABILITY ASSESSMENT
 STRUCTURAL STABILITY ASSESSMENT CFR 257.73(d) Bottom Ash Pond Complex Cardinal Plant Brilliant, Ohio October, 2016 Prepared for: Cardinal Operating Company Cardinal Plant Brilliant, Ohio Prepared by: Geotechnical
CCR Rule Annual Inspection Report (cont.) 2
 2") The inspection findings consisted of maintenance items and items that were not observed to be signs or potential signs of significant structural weakness. No deficiencies or disrupting conditions that
The inspection findings consisted of maintenance items and items that were not observed to be signs or potential signs of significant structural weakness. No deficiencies or disrupting conditions that
LIQUEFACTION OF EARTH EMBANKMENT DAMS TWO CASE HISTORIES: (1) LIQUEFACTION OF THE EMBANKMENT SOILS, AND (2) LIQUEFACTION OF THE FOUNDATIONS SOILS
 LIQUEFACTION OF THE EMBANKMENT SOILS, AND (2) LIQUEFACTION OF THE FOUNDATIONS SOILS") LIQUEFACTION OF EARTH EMBANKMENT DAMS TWO CASE HISTORIES: (1) LIQUEFACTION OF THE EMBANKMENT SOILS, AND (2) LIQUEFACTION OF THE FOUNDATIONS SOILS Antonio Fernandez, Ph.D. 1 ABSTRACT Paul C. Rizzo Associates,
LIQUEFACTION OF EARTH EMBANKMENT DAMS TWO CASE HISTORIES: (1) LIQUEFACTION OF THE EMBANKMENT SOILS, AND (2) LIQUEFACTION OF THE FOUNDATIONS SOILS Antonio Fernandez, Ph.D. 1 ABSTRACT Paul C. Rizzo Associates,
STEVENS CREEK DAM SEISMIC STABILITY EVALUATIONS OF CHESBRO, LENIHAN, STEVENS CREEK, AND UVAS DAMS (SSE2) PHASE A: STEVENS CREEK AND LENIHAN DAMS
 PHASE A: STEVENS CREEK AND LENIHAN DAMS") SEISMIC STABILITY EVALUATIONS OF CHESBRO, LENIHAN, STEVENS CREEK, AND UVAS DAMS (SSE2) PHASE A: STEVENS CREEK AND LENIHAN DAMS STEVENS CREEK DAM COMPILATION REPORT (REPORT No. SSE2A-SC) Prepared for SANTA
SEISMIC STABILITY EVALUATIONS OF CHESBRO, LENIHAN, STEVENS CREEK, AND UVAS DAMS (SSE2) PHASE A: STEVENS CREEK AND LENIHAN DAMS STEVENS CREEK DAM COMPILATION REPORT (REPORT No. SSE2A-SC) Prepared for SANTA
Guidelines for Site-Specific Seismic Hazard Reports for Essential and Hazardous Facilities and Major and Special-Occupancy Structures in Oregon
 Guidelines for Site-Specific Seismic Hazard Reports for Essential and Hazardous Facilities and Major and Special-Occupancy Structures in Oregon By the Oregon Board of Geologist Examiners and the Oregon
Numerical analysis of effect of mitigation measures on seismic performance of a liquefiable tailings dam foundation
 Numerical analysis of effect of mitigation measures on seismic performance of a liquefiable tailings dam foundation Yong-Beom Lee, Jorge Castillo Ausenco, USA Aurelian C. Trandafir Fugro GeoConsulting
design, construction, operation, and maintenance of the BAP is consistent with recognized and generally accepted good engineering standards.
 design, construction, operation, and maintenance of the BAP is consistent with recognized and generally accepted good engineering standards. In addition to the field inspection, Associated Engineers, Inc.
This report was prepared by Klohn Crippen Consultants Ltd. for Alberta Transportation Central Region under Contract No. CE053/2000.
 Alberta Transportation Central Region #401, 4902 51 Street Red Deer, Alberta T4N 6K8 June 7, 2002 Mr. Melvin Mayfield, P.Eng. Project Engineer Dear Mr. Mayfield: Central Region Landslide Assessment Site
GEOLOGY AND SOILS. This chapter summarizes geologic and geotechnical aspects of the site as they relate to the Project.
 9 GEOLOGY AND SOILS INTRODUCTION This chapter summarizes geologic and geotechnical aspects of the site as they relate to the Project. This chapter utilizes information from the following reports prepared
Seismic Design of a Hydraulic Fill Dam by Nonlinear Time History Method
 Seismic Design of a Hydraulic Fill Dam by Nonlinear Time History Method E. Yıldız & A.F. Gürdil Temelsu International Engineering Services Inc., Ankara, Turkey SUMMARY: Time history analyses conducted
SLOPE STABILITY EVALUATION AND ACCEPTANCE STANDARDS
 INFORMATION BULLETIN / PUBLIC - BUILDING CODE REFERENCE NO.: LAMC 98.0508 Effective: 1-26-84 DOCUMENT NO. P/BC 2002-049 Revised: 11-1-02 Previously Issued As: RGA #1-84 SLOPE STABILITY EVALUATION AND ACCEPTANCE
SLOPE STABILITY EVALUATION AND ACCEPTANCE STANDARDS
 INFORMATION BULLETIN / PUBLIC - BUILDING CODE REFERENCE NO.: LABC 7006.3, 7014.1 Effective: 01-01-2017 DOCUMENT NO.: P/BC 2017-049 Revised: 12-21-2016 Previously Issued As: P/BC 2014-049 SLOPE STABILITY
RESERVOIR DRAWDOWN RATES/RESERVOIR DRAWDOWN TEST Iron Gate, Copco (I & II), and JC Boyle Dams
, and JC Boyle Dams") TECHNICAL MEMORANDUM No. 1 TO: Michael Bowen California Coastal Conservancy Geotechnical & Earthquake Engineering Consultants CC: Eric Ginney Philip Williams & Associates PREPARED BY: Paul Grant SUBJECT:
TECHNICAL MEMORANDUM No. 1 TO: Michael Bowen California Coastal Conservancy Geotechnical & Earthquake Engineering Consultants CC: Eric Ginney Philip Williams & Associates PREPARED BY: Paul Grant SUBJECT:
Phase II Report: Project Definition Options. Dam Safety
 OSHPC BARKI TOJIK Phase II Report: Project Definition Options Dam Safety Part 1: Basic data & Dam Design DAM Safety 2 Geology / Geotechnics...: Tectonics / Seismicity : DAM Design - Dam Location - Type
LANDSLIDES IN THE WHITE MOUNTAIN (GEOTECHNICAL STUDIES AND ENGINEERING TESTS)
") J. Al Azhar University Gaza 2004, Vol. 7, NO. 2 P 15-26 LANDSLIDES IN THE WHITE MOUNTAIN (GEOTECHNICAL STUDIES AND ENGINEERING TESTS) Isam G. Jardaneh (1), Jalal Al-Dabeek (2), Abdel hakeem Al-Jawhari
J. Al Azhar University Gaza 2004, Vol. 7, NO. 2 P 15-26 LANDSLIDES IN THE WHITE MOUNTAIN (GEOTECHNICAL STUDIES AND ENGINEERING TESTS) Isam G. Jardaneh (1), Jalal Al-Dabeek (2), Abdel hakeem Al-Jawhari
Ground Motions and Liquefaction Potential
 Missouri University of Science and Technology Scholars' Mine International Conferences on Recent Advances in Geotechnical Earthquake Engineering and Soil Dynamics 2010 - Fifth International Conference
Seismic Evaluation of Tailing Storage Facility
 Australian Earthquake Engineering Society 2010 Conference, Perth, Western Australia Seismic Evaluation of Tailing Storage Facility Jonathan Z. Liang 1, David Elias 2 1 Senior Geotechnical Engineer, GHD
Evaluation of Geotechnical Hazards
 Evaluation of Geotechnical Hazards by Geoffrey R. Martin Appendix B: Evaluation of Geotechnical Hazards Describes Evaluation Procedures Soil Liquefaction Soil Settlement Surface Fault Rupture Flooding
IV. ENVIRONMENTAL IMPACT ANALYSIS G. GEOLOGY AND SOILS
 IV. ENVIRONMENTAL IMPACT ANALYSIS G. GEOLOGY AND SOILS The following section is a summary of the geotechnical report conducted for the proposed project. The Report of Geotechnical Investigation Proposed
ENGINEER S CERTIFICATION OF FAULT AREA DEMONSTRATION (40 CFR )
") PLATTE RIVER POWER AUTHORITY RAWHIDE ENERGY STATION BOTTOM ASH TRANSFER (BAT) IMPOUNDMENTS LARIMER COUNTY, CO ENGINEER S CERTIFICATION OF FAULT AREA DEMONSTRATION (40 CFR 257.62) FOR COAL COMBUSTION RESIDUALS
PLATTE RIVER POWER AUTHORITY RAWHIDE ENERGY STATION BOTTOM ASH TRANSFER (BAT) IMPOUNDMENTS LARIMER COUNTY, CO ENGINEER S CERTIFICATION OF FAULT AREA DEMONSTRATION (40 CFR 257.62) FOR COAL COMBUSTION RESIDUALS
HISTORY OF CONSTRUCTION FOR EXISTING CCR SURFACE IMPOUNDMENT PLANT GASTON ASH POND 40 CFR (c)(1)(i) (xii)
(1)(i) (xii)") HISTORY OF CONSTRUCTION FOR EXISTING CCR SURFACE IMPOUNDMENT PLANT GASTON ASH POND 40 CFR 257.73(c)(1)(i) (xii) (i) Site Name and Ownership Information: Site Name: E.C. Gaston Steam Plant Site Location:
HISTORY OF CONSTRUCTION FOR EXISTING CCR SURFACE IMPOUNDMENT PLANT GASTON ASH POND 40 CFR 257.73(c)(1)(i) (xii) (i) Site Name and Ownership Information: Site Name: E.C. Gaston Steam Plant Site Location:
2. Initial Summary of Preliminary Expert Opinion of Converse and Psomas Reports
 UNITED WALNUT TAXPAYERS PRELIMINARY REVIEW OF NEGATIVE GEOTECHNICAL AND GEOLOGICAL ASPECTS OF CONSTRUCTING EARTHFILL PAD FOR A SOLAR FARM ON THE WEST PARCEL - DRAFT 1. Introduction A licensed Engineering
Impact : Changes to Existing Topography (Less than Significant)
") 4.2 Land Resources 4.2.1 Alternative A Proposed Action Impact 4.2.1-1: Changes to Existing Topography (Less than Significant) Development of the project site would involve grading and other earthwork as
4.2 Land Resources 4.2.1 Alternative A Proposed Action Impact 4.2.1-1: Changes to Existing Topography (Less than Significant) Development of the project site would involve grading and other earthwork as
Liquefaction assessments of tailings facilities in low-seismic areas
 Page 1 Liquefaction assessments of tailings facilities in low-seismic areas Holly Rourke SRK Consulting, Perth, WA, Australia Caroline Holmes SRK Consulting, Perth, WA, Australia This paper was first presented
STEVENS CREEK DAM SEISMIC STABILITY EVALUATIONS OF CHESBRO, LENIHAN, STEVENS CREEK, AND UVAS DAMS (SSE2) PHASE A: STEVENS CREEK AND LENIHAN DAMS
 PHASE A: STEVENS CREEK AND LENIHAN DAMS") SEISMIC STABILITY EVALUATIONS OF CHESBRO, LENIHAN, STEVENS CREEK, AND UVAS DAMS (SSE2) PHASE A: STEVENS CREEK AND LENIHAN DAMS STEVENS CREEK DAM ENGINEERING ANALYSES (REPORT No. SC-3) Prepared for SANTA
SEISMIC STABILITY EVALUATIONS OF CHESBRO, LENIHAN, STEVENS CREEK, AND UVAS DAMS (SSE2) PHASE A: STEVENS CREEK AND LENIHAN DAMS STEVENS CREEK DAM ENGINEERING ANALYSES (REPORT No. SC-3) Prepared for SANTA
3.0 SUMMARY OF POTENTIAL GEOTECHNICAL IMPACTS AND MITIGATION MEASURES
 3.0 SUMMARY OF POTENTIAL GEOTECHNICAL IMPACTS AND MITIGATION MEASURES This section summarizes the principal geotechnical conditions that occur in the project area. The potential impact that each condition
FRIENDS OF THE EEL RIVER
 FRIENDS OF THE EEL RIVER Working for the recovery of our Wild & Scenic River, its fisheries and communities. Frank Blackett, Regional Engineer Office of Energy Projects Division of Dam Safety and Inspections
Evaluating the Seismic Coefficient for Slope Stability Analyses
 Evaluating the Seismic Coefficient for Slope Stability Analyses by Edward Kavazanjian, Jr., Ph.D., P.E.,D.GE., NAE Ira A. Fulton Professor of Geotechnical Engineering School of Sustainable Engineering
14 Geotechnical Hazards
 Volume 2: Assessment of Environmental Effects 296 14 Geotechnical Hazards Overview This Chapter provides an assessment of the underlying geotechnical conditions to identify: any potential liquefaction
SOME OBSERVATIONS RELATED TO LIQUEFACTION SUSCEPTIBILITY OF SILTY SOILS
 SOME OBSERVATIONS RELATED TO LIQUEFACTION SUSCEPTIBILITY OF SILTY SOILS Upul ATUKORALA 1, Dharma WIJEWICKREME 2 And Norman MCCAMMON 3 SUMMARY The liquefaction susceptibility of silty soils has not received
Setting MOUNTAIN HOUSE NEIGHBORHOODS I AND J INITIAL STUDY 5. ENVIRONMENTAL CHECKLIST 6. GEOLOGY AND SOILS. Issue
 Issue Less Than Significant or No Impact Potential Significant Impact Adequately Addressed in MEIR MEIR Required Additional Review: No Significant Impact Less Than Significant Impact Due to Mitigation
Slope Stability Evaluation Ground Anchor Construction Area White Point Landslide San Pedro District Los Angeles, California.
 Slope Stability Evaluation Ground Anchor Construction Area White Point Landslide San Pedro District Los Angeles, California Submitted To: Mr. Gene Edwards City of Los Angeles Department of Public Works
PROBLEMS AND SOLUTIONS THAT MAY EMERGE IN THE FOUNDATION AND BODY OF A HOMOGENEOUS FILL DAM ON A WEAK CLAYEY-SILTY-SANDY FORMATION ÇIKRIKÇI DAM
 PROBLEMS AND SOLUTIONS THAT MAY EMERGE IN THE FOUNDATION AND BODY OF A HOMOGENEOUS FILL DAM ON A WEAK CLAYEY-SILTY-SANDY FORMATION ÇIKRIKÇI DAM Esen Yalım KARADUMAN BAR-SU Eng. & Conc. Inc. Ankara Turkey
Geosynthetics Applications and Performance Reviews Select Case Histories
 Geosynthetics Applications and Performance Reviews Select Case Histories Debora J. Miller, Ph.D., P.E.; Dean B. Durkee,, Ph.D., P.E.; Michael A. Morrison, P.E., David B. Wilson, P.E., and Kevin Smith,
IV. ENVIRONMENTAL IMPACT ANALYSIS E. GEOLOGY AND SOILS
 IV. ENVIRONMENTAL IMPACT ANALYSIS E. GEOLOGY AND SOILS INTRODUCTION This section evaluates potential impacts related to geology, including seismicity, and soils associated with development of the proposed
Liquefaction and Foundations
 Liquefaction and Foundations Amit Prashant Indian Institute of Technology Gandhinagar Short Course on Seismic Design of Reinforced Concrete Buildings 26 30 November, 2012 What is Liquefaction? Liquefaction
IV. ENVIRONMENTAL IMPACT ANALYSIS E. GEOLOGY AND SOILS
 IV. ENVIRONMENTAL IMPACT ANALYSIS E. GEOLOGY AND SOILS The following analysis is based on the Geotechnical Investigation Report, Proposed Mid-Rise Multi- Family Residential Development Project Wetherly
Geology, Soils, and Seismicity
 Section 3.8 Geology, Soils, and Seismicity Introduction This section generally evaluates the effects of the alternatives analyzed in this Supplemental DEIS with regard to geology, soils and seismicity.
Section Forces Within Earth. 8 th Grade Earth & Space Science - Class Notes
 Section 19.1 - Forces Within Earth 8 th Grade Earth & Space Science - Class Notes Stress and Strain Stress - is the total force acting on crustal rocks per unit of area (cause) Strain deformation of materials
This is a digital document from the collections of the Wyoming Water Resources Data System (WRDS) Library.
 Library.") This is a digital document from the collections of the Wyoming Water Resources Data System (WRDS) Library. For additional information about this document and the document conversion process, please contact
This is a digital document from the collections of the Wyoming Water Resources Data System (WRDS) Library. For additional information about this document and the document conversion process, please contact
Seismic Stability of Tailings Dams, an Overview
 Seismic Stability of Tailings Dams, an Overview BY Gonzalo Castro, Ph.D., P.E. Principal International Workshop on Seismic Stability of Tailings Dams Case Western Reserve University, November 2003 Small
January 17, 2008 File:
 January 17, 2008 File: 15-85-73 Alberta Infrastructure and Transportation Room 301, Provincial Building 9621-96 Avenue Peace River, Alberta T8S 1T4 Attention: Mr. Ed Szmata PEACE REGION (SWAN HILLS AREA)
Review of static and seismic stability of a cross-valley sand tailings embankment in a high rainfall, high seismicity setting
 Tailings and Mine Waste Management for the 21 st Century 2015 Paper Number: 52 Review of static and seismic stability of a cross-valley sand tailings embankment in a high rainfall, high seismicity setting
Mitigation of Liquefaction Potential Using Rammed Aggregate Piers
 ASCE 2011 557 Mitigation of Liquefaction Potential Using Rammed Aggregate Piers R.W. Rudolph, M. ASCE, G.E. 1, B. Serna, M. ASCE, P.E. 2, and T. Farrell, M. ASCE, G.E. 3 1 Principal Consultant, ENGEO,
Sacramento Modesto Roseville Pleasanton September 19, 2013 Marcia Medina GHD Inc. 417 Montgomery Street, Suite 700 San Francisco, CA Subject: GE
 Sacramento Modesto Roseville Pleasanton September 19, 2013 Marcia Medina GHD Inc. 417 Montgomery Street, Suite 700 San Francisco, CA 94104 Subject: GEOTECHNICAL REPORT AMENDMENT Stonybrook Creek Crossings
Lecture # 6. Geological Structures
 1 Lecture # 6 Geological Structures ( Folds, Faults and Joints) Instructor: Dr. Attaullah Shah Department of Civil Engineering Swedish College of Engineering and Technology-Wah Cantt. 2 The wavy undulations
Evaluation of soil liquefaction using the CPT Part 2
 Evaluation of soil liquefaction using the CPT Part 2 P.K. Robertson 2013 Definitions of Liquefaction Cyclic (seismic) Liquefaction Zero effective stress (during cyclic loading) Flow (static) Liquefaction
IV. ENVIRONMENTAL IMPACT ANALYSIS E. GEOLOGY AND SOILS
 IV. ENVIRONMENTAL IMPACT ANALYSIS E. GEOLOGY AND SOILS The following section is a summary of the geotechnical report conducted for the Proposed Project. The Geotechnical Engineering Investigation (the
4.10 GEOLOGY, SOILS, AND SEISMICITY
 4.10 GEOLOGY, SOILS, AND SEISMICITY 4.10.1 INTRODUCTION This section describes the geology of the SVRTC and the susceptibility of site soils to seismically induced hazards. Faults in the corridor and past
BRIEFING MEMO ON RESERVOIR TRIGGERED SEISMICITY (RTS)
") BRIEFING MEMO ON RESERVOIR TRIGGERED SEISMICITY (RTS) 1. General. The issue of reservoir-triggered seismicity (RTS) has been controversial, and hotly debated, for many decades. There has been general recognition
BRIEFING MEMO ON RESERVOIR TRIGGERED SEISMICITY (RTS) 1. General. The issue of reservoir-triggered seismicity (RTS) has been controversial, and hotly debated, for many decades. There has been general recognition
Seismic Analysis of Siri Dam Using Pseudo-Static Approach
 Seismic Analysis of Siri Dam Using Pseudo-Static Approach Shabbir Ahmed Osmani 1, Md. Jahir Bin Alam 2 1 Department of Civil Engineering, Leading University, Bangladesh 2 Department of Civil and Environmental
Numerical model comparison on deformation behavior of a TSF embankment subjected to earthquake loading
 Numerical model comparison on deformation behavior of a TSF embankment subjected to earthquake loading Jorge Castillo, Yong-Beom Lee Ausenco, USA Aurelian C. Trandafir Fugro GeoConsulting Inc., USA ABSTRACT
Instructor : Dr. Jehad Hamad. Chapter (7)
") Instructor : Dr. Jehad Hamad Chapter (7) 2017-2016 Soil Properties Physical Properties Mechanical Properties Gradation and Structure Compressibility Soil-Water Relationships Shear Strength Bearing Capacity
Instructor : Dr. Jehad Hamad Chapter (7) 2017-2016 Soil Properties Physical Properties Mechanical Properties Gradation and Structure Compressibility Soil-Water Relationships Shear Strength Bearing Capacity
Should you have any questions regarding this clarification, please contact the undersigned at or (925)
") October 8, 2015 Revised October 13, 2015 Contra Costa Community College District 500 Court Street Martinez, CA 94553 Attention: Ron Johnson Subject: Clarification of Grading Requirements Diablo Valley
October 8, 2015 Revised October 13, 2015 Contra Costa Community College District 500 Court Street Martinez, CA 94553 Attention: Ron Johnson Subject: Clarification of Grading Requirements Diablo Valley
Seepage Analysis for Shurijeh Reservoir Dam Using Finite Element Method. S. Soleymani 1, A. Akhtarpur 2
 Seepage Analysis for Shurijeh Reservoir Dam Using Finite Element Method S. Soleymani 1, A. Akhtarpur 2 1 Group of Dam Construction, Toossab Company, P.O. Box 917751569, Mashhad City, Iran, PH (+98) 511-7684091;
CONCEPTUAL DAM DESIGN
 II. CONCEPTUAL DAM DESIGN The geologic assessment resulted in moving the dam site several thousand feet upstream from the original proposed location. The most favorable of the sites considered, from a
IV. ENVIRONMENTAL IMPACT ANALYSIS E. GEOLOGY/SOILS
 IV. ENVIRONMENTAL IMPACT ANALYSIS E. GEOLOGY/SOILS Except where otherwise noted, the following Section is based on the Preliminary Geotechnical Investigation, Proposed Medical Office Buildings and Mixed-Use
3.12 Geology and Topography Affected Environment
 3 Affected Environment and Environmental Consequences 3.12 Geology and Topography 3.12.1 Affected Environment 3.12.1.1 Earthquakes Sterling Highway MP 45 60 Project Draft SEIS The Kenai Peninsula is predisposed
U-Shaped Sediment Traps
 U-Shaped Sediment Traps SEDIMENT CONTROL TECHNIQUE Type 1 System Sheet Flow Sandy Soils Type 2 System Concentrated Flow Clayey Soils [1] Type 3 System Supplementary Trap Dispersive Soils [1] Generally
CPT Applications - Liquefaction 2
 CPT Applications - Liquefaction 2 Peter K. Robertson CPT in Geotechnical Practice Santiago, Chile July, 2014 Definitions of Liquefaction Cyclic (seismic) Liquefaction Zero effective stress (during cyclic
[1] Performance of the sediment trap depends on the type of outlet structure and the settling pond surface area.
![[1] Performance of the sediment trap depends on the type of outlet structure and the settling pond surface area.](/thumbs/76/74245181.jpg "[1] Performance of the sediment trap depends on the type of outlet structure and the settling pond surface area.") Sediment Trench SEDIMENT CONTROL TECHNIQUE Type 1 System Sheet Flow Sandy Soils Type 2 System [1] Concentrated Flow Clayey Soils Type 3 System [1] Supplementary Trap Dispersive Soils [1] Performance of
Sediment Trench SEDIMENT CONTROL TECHNIQUE Type 1 System Sheet Flow Sandy Soils Type 2 System [1] Concentrated Flow Clayey Soils Type 3 System [1] Supplementary Trap Dispersive Soils [1] Performance of
Dam Safety Aspects of Reservoir-Triggered Seismicity
 Dam Safety Aspects of Reservoir-Triggered Seismicity Dr. Martin Wieland Chairman, Committee on Seismic Aspects of Dam Design, International Commission on Large Dams (ICOLD) Poyry Energy Ltd., Zurich, Switzerland
DATA REPORT GEOTECHNICAL INVESTIGATION GALVESTON CRUISE TERMINAL 2 GALVESTON, TEXAS
 DATA REPORT GEOTECHNICAL INVESTIGATION GALVESTON CRUISE TERMINAL 2 GALVESTON, TEXAS SUBMITTED TO PORT OF GALVESTON 123 ROSENBERG AVENUE, 8TH FLOOR GALVESTON, TEXAS 77553 BY HVJ ASSOCIATES, INC. HOUSTON,
Downtown Anchorage Seismic Risk Assessment & Land Use Regulations to Mitigate Seismic Risk
 Prepared for: The Municipality of Anchorage Planning Department and the Geotechnical Advisory Commission Downtown Anchorage Seismic Risk Assessment & Land Use Regulations to Mitigate Seismic Risk Prepared
Geotechnical Aspects of the Seismic Update to the ODOT Bridge Design Manual. Stuart Edwards, P.E Geotechnical Consultant Workshop
 Geotechnical Aspects of the Seismic Update to the ODOT Bridge Design Manual Stuart Edwards, P.E. 2017 Geotechnical Consultant Workshop Changes Role of Geotechnical Engineer Background Methodology Worked
GEOLOGIC REVIEW AND RECONNAISSANCE
 GEOTECHNICAL ENVIRONMENTAL WATER RESOURCES CONSTRUCTION SERVICES June 1, 2012 Project No. 9472.000.000 Ms. Ginger Zhang East Bay Municipal Utility District (EBMUD) 375 Eleventh Street Oakland, CA 94607
Cyclic Triaxial Testing of Water-Pluviated Fly Ash Specimens
 2013 World of Coal Ash (WOCA) Conference - April 22-25, 2013 in Lexington, KY http://www.flyash.info/ Cyclic Triaxial Testing of Water-Pluviated Fly Ash Specimens Jeffrey S. Dingrando 1, Michael E. Kalinski
November 20, 2003 Project
 November 20, 2003 Project 032810 1021 Main Street Winchester, MA 01890-1970 781.721.4000 781.721.4073 fax Mr. Bobby Van Cleave Geotechnical Engineer Little Rock District Federal Building, 7th Floor 700
Preliminary Geotechnical Evaluation Gooseberry Point Pedestrian Improvements Whatcom County, Washington SITE AND PROJECT DESCRIPTION
 File No. 12-100 Geotechnical & Earthquake Engineering Consultants Mr. Kevin Brown, P.E. Gray & Osborne, Inc. 3710 168 th Street NE, Suite B210 Arlington, Washington 98223 Subject: Draft Report Preliminary
Converse Consultants Geotechnical Engineering, Environmental & Groundwater Science, Inspection & Testing Services
 Converse Consultants Geotechnical Engineering, Environmental & Groundwater Science, Inspection & Testing Services July 27, 2017 Ms. Rebecca Mitchell Mt. San Antonio College Facilities Planning & Management
APPENDIX J. Dynamic Response Analysis
 APPENDIX J Dynamic Response Analysis August 25, 216 Appendix J Dynamic Response Analysis TABLE OF CONTENTS J1 INTRODUCTION... 1 J2 EARTHQUAKE TIME HISTORIES... 1 J3 MODEL AND INPUT DATA FOR SITE RESPONSE
(THIS IS ONLY A SAMPLE REPORT OR APPENDIX OFFERED TO THE USERS OF THE COMPUTER PROGRAM
 C A U T I O N!! (THIS IS ONLY A SAMPLE REPORT OR APPENDIX OFFERED TO THE USERS OF THE COMPUTER PROGRAM EQLique&Settle2. THE AUTHOR IS HEREBY RELEASED OF ANY LIABILITY FOR ANY INCORRECT USE OF THIS SAMPLE
Geotechnical Engineering
 Geotechnical Engineering CE 4348 Lecture 1: Introduction Instructor: Reza Ashtiani, Ph.D. Fall 2015 Physical Science Bldg., Room 314 Lecture Sessions : MW 12:30-1:20 pm Laboratory Sessions: MW 1:30-4:30
1 PROJECT BACKGROUND. August 14, Alberta Transportation Central Region #401, Street Red Deer, Alberta T4N 6K8
 August 14, 2013 Alberta Transportation Central Region #401, 4902 51 Street Red Deer, Alberta T4N 6K8 Mr. Dennis Grace, P.Eng. Construction Engineer Dear Mr. Grace: Central Region Geohazard Assessment 2013
Rock & Aggregate Drop Inlet Protection
 Rock & Aggregate Drop Inlet Protection SEDIMENT CONTROL TECHNIQUE Type 1 System Sheet Flow Sandy Soils Type 2 System [1] Concentrated Flow Clayey Soils Type 3 System Supplementary Trap Dispersive Soils
9. GEOLOGY, SOILS, AND MINERALS
 June 28, 2018 Page 9-1 9. GEOLOGY, SOILS, AND MINERALS This EIR chapter describes the existing geological, soil, and mineral conditions in the planning area. The chapter includes the regulatory framework
CEMEX Eliot Quarry. Lake A Evaluation Report. Alameda County, California
 May 7, 2015 May 7, 2015 Project No. GT13-16 Prepared for: CEMEX 5180 Golden Foothills, Parkway El Dorado Hills, California 95762 7400 Shoreline Drive, Ste. 6 Stockton, California 95219 Tel: 209-472-1822
appendix e: geologic and seismic hazards
 appendix e: geologic and seismic hazards CONTENTS: E-2 Fault Rupture E-3 Ground Shaking E-5 Seismic Ground Deformation E-5 Liquification E-6 Seismically Induces Landslide E-6 Landslide Hazard E The following
PRINCIPLES OF GEOTECHNICAL ENGINEERING
 PRINCIPLES OF GEOTECHNICAL ENGINEERING Fourth Edition BRAJA M. DAS California State University, Sacramento I(T)P Boston Albany Bonn Cincinnati London Madrid Melbourne Mexico City New York Paris San Francisco
IV. ENVIRONMENTAL IMPACT ANALYSIS E. GEOLOGY/SOILS
 IV. ENVIRONMENTAL IMPACT ANALYSIS E. GEOLOGY/SOILS The following discussion is based upon information contained in the Hollywood Redevelopment Plan Amendment EIR and a letter prepared by Geotechnologies,
Safety analyses of Srinagarind dam induced by earthquakes using dynamic response analysis method.
 Safety analyses of Srinagarind dam induced by earthquakes using dynamic response analysis method. S. Soralump Assistance Professor, Faculty of Engineering, Kasetsart University, Thailand. K. Tansupo Ph.D.
IZMIT BAY BRIDGE SOUTH APPROACH VIADUCT: SEISMIC DESIGN NEXT TO THE NORTH ANATOLIAN FAULT
 Istanbul Bridge Conference August 11-13, 2014 Istanbul, Turkey IZMIT BAY BRIDGE SOUTH APPROACH VIADUCT: SEISMIC DESIGN NEXT TO THE NORTH ANATOLIAN FAULT A. Giannakou 1, J. Chacko 2 and W. Chen 3 ABSTRACT
Mr. Michael Malone CPS Energy 145 Navarro Street San Antonio, Texas Project No
 January 17, 2018 Mr. Michael Malone 145 Navarro Street San Antonio, Texas 78205 Project No. 0337367 Environmental Resources Management CityCentre Four 840 West Sam Houston Pkwy N. Suite 600 Houston, Texas
J. Paul Guyer, P.E., R.A.
 J. Paul Guyer, P.E., R.A. Paul Guyer is a registered mechanical engineer, civil engineer, fire protection engineer and architect with over 35 years experience in the design of buildings and related infrastructure.
Case History of Observed Liquefaction-Induced Settlement Versus Predicted Settlement
 Case History of Observed Liquefaction-Induced Settlement Versus Predicted Settlement M. Lew and L. Tran AMEC Environment & Infrastructure, Inc., Los Angeles, CA USA SUMMARY: A comparison of the predicted
Dynamic Analysis Contents - 1
 Dynamic Analysis Contents - 1 TABLE OF CONTENTS 1 DYNAMIC ANALYSIS 1.1 Overview... 1-1 1.2 Relation to Equivalent-Linear Methods... 1-2 1.2.1 Characteristics of the Equivalent-Linear Method... 1-2 1.2.2
Evaluation of soil liquefaction using the CPT Part 1
 Evaluation of soil liquefaction using the CPT Part 1 Dr. Peter K. Robertson Webinar #7 2013 CPT Guide 5 th Edition Download FREE copy from: Robertson & Cabal (Robertson) 5 th Edition 2012 www.greggdrilling.com
Climate effects on landslides
 GEORAMP ONE DAY SYMPOSIUM Climate effects on landslides E. E. Alonso, M. Sondón, N. M. Pinyol Universitat Politècnica de Catalunya October 14th, 2016. UPC, Barcelona Infiltration (evaporation) and slope
Landslide FE Stability Analysis
 Landslide FE Stability Analysis L. Kellezi Dept. of Geotechnical Engineering, GEO-Danish Geotechnical Institute, Denmark S. Allkja Altea & Geostudio 2000, Albania P. B. Hansen Dept. of Geotechnical Engineering,
DYNAMIC RESPONSE APPROACH AND METHODOLOGY
 DYNAMIC RESPONSE APPROACH AND METHODOLOGY Traditional seismic stability procedures vs coupled effective-stress approach. Traditional seismic stability procedures: Empirical and laboratory corrections and
VERIFICATION OF MATERIAL PARAMETERS OF EARTHEN DAMS AT DIAMOND VALLEY LAKE USING GEODETIC MEASUREMENTS
 VERIFICATION OF MATERIAL PARAMETERS OF EARTHEN DAMS AT DIAMOND VALLEY LAKE USING GEODETIC MEASUREMENTS Anna SZOSTAK-CHRZANOWSKI, Canada, Michel MASSIERA, Canada, Adam CHRZANOWSKI, Canada, Fabien LE HOAN,
DCPP Seismic FAQ s Geosciences Department 08/04/2011 GM1) What magnitude earthquake is DCPP designed for?
 What magnitude earthquake is DCPP designed for?") GM1) What magnitude earthquake is DCPP designed for? The new design ground motions for DCPP were developed after the discovery of the Hosgri fault. In 1977, the largest magnitude of the Hosgri fault was
GM1) What magnitude earthquake is DCPP designed for? The new design ground motions for DCPP were developed after the discovery of the Hosgri fault. In 1977, the largest magnitude of the Hosgri fault was
Deep Foundations 2. Load Capacity of a Single Pile
 Deep Foundations 2 Load Capacity of a Single Pile All calculations of pile capacity are approximate because it is almost impossible to account for the variability of soil types and the differences in the
J.H. Campbell Generating Facility Pond A - Location Restriction Certification Report
 J.H. Campbell Generating Facility Pond A - Location Restriction Certification Report Pursuant to: 40 CFR 257.60 40 CFR 257.61 40 CFR 257.62 40 CFR 257.63 40 CFR 257.64 Submitted to: Consumers Energy Company
3.18 GEOLOGY AND SOILS
 3.18 GEOLOGY AND SOILS This section discusses geologic resource concerns as they relate to the environment, public safety, and project design both during construction and after completion of the project.
An Overview of Geotechnical Earthquake Engineering
 An Overview of Geotechnical Earthquake Engineering Sudhir K Jain Slide 1 Outline Introduction to Seismic Design Principle Dynamic Soil Properties Site Effects Soil Structure Interaction Issues for Foundation