Department of Natural Resources Geological Survey. Exploring the Geoscience Atlas
|
|
|
- Myles Neal
- 5 years ago
- Views:
Transcription
1 Department of Natural Resources Geological Survey Exploring the Geoscience Atlas Updated November, 2016
2 Hyperlinked Contents Background: Browser Setup Browser Setup allow pop-ups Geoscience Online Geoscience Atlas start Disclaimer Geoscience Atlas - overview Navigating (zoom and pan) Groups and Layers: Map Layers: Map Labels Drill Core Mineral Occurrences NTS MapSheet Grid UTM Grid Lines UTM Zones 19 to 22 Road Network Forest Access Roads Water Lines, Border, Contours Coastal Information: Coastal Monitoring, Indices and Characterization Indexes: Index Bedrock Geology Maps Index Geochemical Surveys Index Airborne Geophysical Surveys Groups and Layers: Land Use: Labrador Inuit Lands and Settlement Areas Public Water Supplies, Municipal Boundaries and Planning Areas Mineral Lands: Map Staked Claims, Mineral Rights Cancelled, Notices Gazetted and Mineral Tenure Historical Claims Quarries Geochemistry: Plutonic Rocks Volcanic Rocks Till Sediment Surveys Detailed Lake Sediment / Water Sites Regional Lake Sediment Sites Regional Lake Sediment Contours / Images Regional Stream Sediment Sites Detailed Stream Sediment Sites Bedrock Geology: 1:1 Million Faults/Contacts & Polygons Detailed Lines and Polygons (Nfld2616 v7) Hydro Geology Groups and Layers: Surficial Geology: Regional and Detailed Geology Age Dates, Striations, Landforms, Aggregate Striations Definition Geophysics: Regional and Detailed Geophysics Tools: Tools Menu Draw Graphics Spatial Search Download Data vector features Download Data raster images Attribute Query Custom Query Base Maps Measure Print Bookmarks Help Other: Projection Information Transverse Mercator vs. Geographic Geoid, Ellipsoid, Datum Definitions Contact Information
3 Geoscience OnLine Browser Setup: -use recent versions of Internet Explorer, Google Chrome or Mozilla Firefox (other browsers, such as Apple Safari, work with most tools) -allow pop-ups and cookies for this site (geoatlas.gov.nl.ca) -ad blockers will cause problems so disable for this site -may need to clear history, cache and possibly cookies if Atlas becomes glitchy (be careful not to lose any saved login passwords or filled forms)


4 Browser Setup > allow Pop-ups Example: Internet Explorer 11 Go to Tools > Internet Options > Privacy tab Allow pop-ups for Atlas. Enter Addresses: gis.geosurv.gov.nl.ca geoatlas.gov.nl.ca

5 GeoScience Online Keep an eye on announcements Check out What s New Contact Us Link to Stake a Claim Links to Other Information and Forms


6 GeoScience OnLine
7 GeoScience OnLine


8 GeoScience OnLine


9 GeoScience OnLine > How to Start the Geoscience Atlas Click to enter The Atlas
10 Disclaimer Read Disclaimer, then Click to Enter The Atlas
")
11 Scale Slider (1:9 million to 1:9,000) Geoscience Atlas Overview Map Service/ Group Layers Map Viewer Window Blue-underlined text linked to help file for that layer or group Overview Window Scale Bar Cursor Coordinates (NAD27) Close Overview
12 Overview The Contents panel now contains expandable/collapsible groups and subgroups. Ad blockers, on your internet browser, need to be disabled for this to work. The Atlas will remember the settings (i.e., which groups are open and which layers are active) the next time the Atlas is opened.
13 Navigating (Zoom and Pan) Navigating around the Map Viewer Window: 1. Hold down the shift key and drag a box on the map to zoom in 2. Hold down Ctrl+Shift to zoom out 3. Double click to zoom in 4. Use the mouse roller to zoom in/out 5. Drag the scale slider to zoom in/out 6. Click and drag the mouse to pan the map 7. Click the shaded box in the overview window and drag it to a new location to quickly pan the map.


14 Map Layers > Map Labels More labels appear as you zoom in


15 Map Layers > Drill Core Click on some drill core sites.

16 Map Layers > Drill Core Help In the Contents panel, click on the Drill Core text to access the Help file. The Help file provides contact information and maps of Core Storage Libraries St. John s core-storage library is on the Torbay Road side of St. John's Airport, just off RCAF Road


17 Map Layers > Mineral Occurrences Zoom in to display MODS labels 3 Click on a mineral occurrence Zoom in


18 Map Layers > NTS MapSheet Grid Click on a square to determine the NTS sheet number Zoom in to display NTS labels


19 Map Layers > UTM Grid Lines UTM Grid Lines are only available as a layer when you zoom in. Note the change in grid lines between UTM Zone 21 and UTM Zone 22. Zoom in further to display more detailed lines. UTM Zone 21 UTM Zone 22

20 Map Layers > UTM Grid Lines There are 4 UTM Zones covering Newfoundland and Labrador: Zone 19: western Labrador Zone 20: central Labrador Zone 21: eastern Labrador and most of Newfoundland Zone 22: eastern Newfoundland Note the UTM Easting value, in the Cursor Coordinates bar, changes from 700,000 s to 200,000 s as you move east across the UTM Zone boundary.


21 Map Layers > Road Network The Road Network will be visible when you zoom in (available to download from Geobase NRN NL) Zoom in further to display more detailed streets

22 Map Layers > Forest Access Roads The Help file provides a link to the Resource Access Roads website. Some roads which are deemed no longer necessary are deactivated The Department can also close roads during times of poor operating conditions

23 Map Layers > Water Lines, Provincial Border, and Contours Water Lines and the Labrador/Quebec Provincial Border are provided for spatial reference on raster images. These cannot be downloaded. The contours are displayed at larger scales only. Click on a contour to determine the elevation in feet or metres ( imperial indicates contours in feet).

24 Coastal Information > Monitoring, Indices and Characterization The Coastal Monitoring layers provide information on erosion rates and coastal sensitivity.


25 Indexes > Bedrock Geology Maps Alternative


26 Indexes > Geochemical Surveys Report and data available for download

27 Indexes > Airborne Geophysical Surveys Digital geophysical surveys provide links to download the data

28 Land Use Group Claims cannot be staked in some areas, and will have more restrictions in other areas.


29 Mineral Lands > Map Staked Claims, Notices Gazetted, Mineral Tenure etc. Click on Mineral Lands text to see the help file for a description of each layer

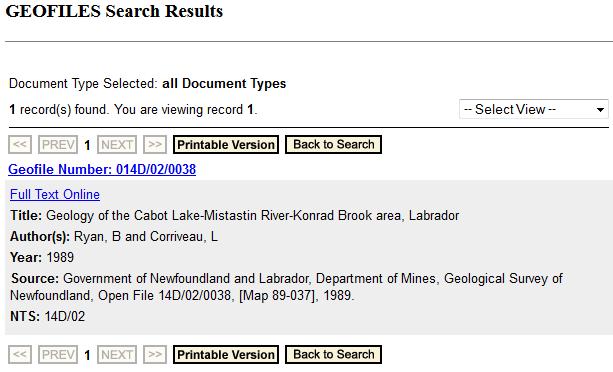
30 Mineral Lands > Historical Claims Click on a claim then click on Links > Geofiles Search and Full Text Online to view the digital pdf assessment report


31 Mineral Lands > Quarries


32 Geochemistry > Plutonic Rocks Plutonic rocks are intrusive igneous rocks that formed from magma cooling slowly below the surface of the Earth. They contain large crystals. Granites are an example of a plutonic rock.

33 Geochemistry > Volcanic Rocks Volcanic rocks are extrusive igneous rocks that formed from magma cooling quickly on the surface of the Earth. They contain glass and/or small crystals. Basalts are an example of a volcanic rock.

34 Geochemistry > Till Sediment Surveys All Till Surveys Click on the drop-down list to select an element dot plot, such as Copper

35 Geochemistry > Detailed Lake Sediment / Lake Water Detailed Lake Sediment and Water geochemistry surveys are in separate layers Searh Results Links provide a link to Geofiles; more recent reports are linked to pdf files and csv data files

36 Geochemistry > Regional Lake Sediment Click on the drop-down list to select an element dot plot, such as Copper

37 Geochemistry > Regional Lake Sediment Contours and Images

38 Geochemistry > Regional Stream Sediment

39 Geochemistry > Detailed Stream Sediment

40 Bedrock Geology > 1:1 Million

41 Bedrock Geology > Detailed Lines and Polygons (NFLD2616 v7) Contacts and Faults are available as symbolized and non-symbolized lines.

42 Bedrock Geology > Hydro Geology The Hydro Geology layer indicates the relative amount of groundwater available in the rocks.

43 Surficial Geology > Regional and Detailed Detailed Surficial Geology Regional Surficial Geology


44 Surficial Geology > other layers Age Dates of mud, shell, charcoal etc. Striations Indicate glacial direction Aggregate Landforms
 displays a large anomaly.")

45 Surficial Geology > Striations The lake sediment geochemistry image for lead (Pb) displays a large anomaly. Exploring in the up-ice direction, southwest of the anomaly, may result in finding the source of this anomaly. Striations: Indicate glacial direction is from the southwest to the northeast


46 Geophysics Group Detailed Geophysics Regional Geophysics


47 Tools Menu TOOLS MENU

48 Tools > Draw Graphics -add points, lines, polylines, polygons and text to your map -when printing, these graphics are only included using the Quick Map > Print Image option - Save Image and Save Image as PDF include the graphics but not the text -drawn graphics cannot be saved and are not retained if you refresh the screen

49 Tools > Spatial Search Spatial Search is based on the overlap of i) a drawn graphic (e.g., intersecting a line or within a polygon), or ii) current results (i.e., current selection in a Search Results window) Buffer Distance can be used around either Graphic or Current Results. Example: What mineral occurrences are within 10km of Corner Brook? 3 1 2
. Save the.zip file to your computer. The data are in latitude-longitude, datum NAD27 coordinate system.")
50 Tools > Download Data Choose the layer from the drop-down list (vector features or raster images). The layer does not have to be turned on. Base maps cannot be downloaded. Features (i.e., point, line or polygon vector features) within the current window extents are downloaded in the chosen format (.shp or.gdb). Save the.zip file to your computer. The data are in latitude-longitude, datum NAD27 coordinate system.
, the whole image is downloaded in the chosen format (.jpg,.tif, or.png).")
51 Tools > Download Data For Raster images (e.g., geophysics raster images, lake seds element images), the whole image is downloaded in the chosen format (.jpg,.tif, or.png). The layer does not have to be turned on. The downloaded raster images are in UTM, datum NAD27 coordinate system.

52 Tools > Attribute Query Select the layer and field (attribute) of interest; choose an operator and click on Get Sample Values for examples of values; select a value from the drop down list or enter a value in the box below; click on the Add to Query Expression and Run the Query; the records in the Search Results table will be highlighted on the map


53 Tools > Custom Query Select one of 17 Custom Query forms. Example: search for mafic Stratigraphic Units of the Victoria Lake Supergroup


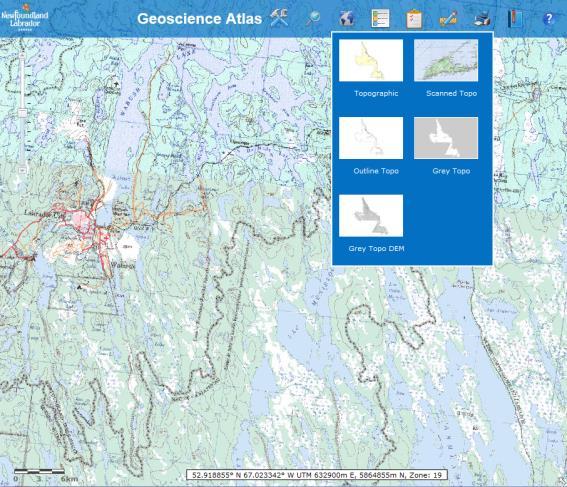
54 Base Maps Detail increases as scale is increased Topographic Scanned Topo Outline Topo Grey Topo Grey Topo DEM
.")

55 Measure Point Provides X/Y coordinates in Longitude/Latitude, based on the NAD27 datum. Values can be selected, copied and pasted. (UTM values will be added in the future). Polyline Click the arrow next to the polyline icon to choose a unit of measurement. On the map click to start drawing, click to add vertices and double click to finish. The length of the polyline displays in the unit of measurement chosen. The default unit is Kilometers. See Atlas Help file for Line and Polygon options, Clear and Close.


56 Print Custom Map Click the Print icon and choose from several printing options: Custom Map: Fill in the Map Title and choose a Map Layout from the drop down list. If you manually enter a different scale, the map will zoom in or out based on the centre of the preview image. Click the Create PDF button and open the PDF to view, save and print the map. Drawn graphics are not included. Map Layout Templates:

57 Print Quick Map Click the Print icon and choose the Quick Map printing option: Quick Map: Most drawn graphics are included 1. Print Image - prints the map as is with a scale bar 2. Save Image saves as a png or bmp depending on your browser 3. Save Image as PDF 4. Print Legend - lists feature symbols from the whole province for open layers; legend does not display base map info, road networks or image values.
 and using the Bookmarks tool, click Add Bookmark to save each project extent area.")
58 Bookmarks Bookmarks -a collection of direct links to predefined map extents -can create new ones, rename, and delete old ones -only saves the map extents, not which layers are turned on Example: Use Search Results to zoom to each map sheet area (i.e. 14D/01,08; 14D/15; 12A/10) and using the Bookmarks tool, click Add Bookmark to save each project extent area.
59 Help Atlas Help provides brief descriptions of all the tools, as well as Links to the Layers help file (description of all the layers), the Frequently Asked Questions (FAQ) and this Tutorial Contact Information: ; Home: link to the Department of Natural Resources web site About Atlas: provides Atlas version number and link to Tamarack website

 of")
60 Projection Information Transverse Mercator projection of the Geoscience Atlas map window Geographic projection (latitude-longitude, NAD27) of downloaded vector data

. It was based on manually surveying the continent, starting at the approximate centre in Kansas.")
61 Projection Information Projections are necessary in order to convert locations on a 3-dimensional Earth to a 2-dimensional piece of paper. How is this done? The earth s surface is represented by a GEOID, which is the surface representation if the earth was covered by water. The ELLIPSOID is a mathematical representation of the geoid. Local ellipsoids provide a better fit to the geoid. Prior to 1980 the Clarke_1866 ellipsoid was used to define the North American Datum of 1927 (NAD27). It was based on manually surveying the continent, starting at the approximate centre in Kansas. New local datums, such as NAD83, are based on satellite data and are more accurate. The WGS84 datum, used as the default by many GPS, is a global datum, similar to NAD83.
62 Projection Definitions Datum: A reference based on a model of the Earth s ellipsoid. The coordinates in the Geoscience Atlas are based on the North American Datum of 1927 (NAD27). Many GPS default to the World Geodetic System of 1984 (WGS84) datum, which is within a metre of another commonly used local datum - NAD83. NAD27 and NAD83 UTM values differ by about 60m in the east direction and 225m in the north direction in Newfoundland and Labrador. Universal Transverse Mercator Projection: The earth is divided into 60 zones, each is 6 wide this allows each area to be represented more accurately as a flat surface. Each zone is assigned a Zone number. Zones 19, 20, 21 and 22 cover Newfoundland and Labrador. The central x-value, or Easting, of each zone is defined as 500,000m E and the y-value, or Northing, is measured in metres from the equator. UTM coordinates are based on a datum the Geoscience Atlas provides UTM coordinates based on the NAD27 datum. Latitude/Longitude Coordinate System: Provides a spherical numbering system, in degrees, to define a location on the earth s surface. Newfoundland and Labrador ranges from to west of the 0 Prime Meridian in England, and to north of the equator. Latitude and longitude coordinates are also based on a datum the Geoscience Atlas provides latitude/longitude coordinates based on the NAD27 datum.
63 Contact Information Contact Information: Check out Atlas Help: PDF of slides available from Pat O Neill, (709) matty@gov.nl.ca
Department of Natural Resources Geological Survey. Exploring the Geoscience Atlas
 Department of Natural Resources Geological Survey Exploring the Geoscience Atlas Updated November, 2015 Hyperlinked Contents Background: Browser Setup Browser Setup allow pop-ups Geoscience Online Geoscience
OneStop Map Viewer Navigation
 OneStop Map Viewer Navigation» Intended User: Industry Map Viewer users Overview The OneStop Map Viewer is an interactive map tool that helps you find and view information associated with energy development,
GIS: Introductory Guide to MapPlace. Workshop Agenda. How the Maps Work. Geographic Information Systems. -The MapPlace is a web GIS application
 1 Introductory Guide to MapPlace Workshop 2007 Larry Jones MapPlace & Geoscience Databases Pat Desjardins Corporate GIS Gib McArthur Manager, Resource Information Kirk Hancock MINFILE Geologist Ward Kilby
Buffer Data Capture. Exercise 4:
 Buffer Data Capture Exercise 4: This example demonstrates some available navigation tools to locate an area of interest and apply some analysis tools to the area. The area of interest is the Baldy Batholith
Map My Property User Guide
 Map My Property User Guide Map My Property Table of Contents About Map My Property... 2 Accessing Map My Property... 2 Links... 3 Navigating the Map... 3 Navigating to a Specific Location... 3 Zooming
Outline. What is MapPlace? MapPlace Toolbar & PopUp Menu. Geology Themes 1:5M 1:1M BCGS 1:250,000. Terranes
 Outline BRITISH COLUMBIA Overview and Explore MapPlace Website Data Delivery & Map Themes Data Sources & Updates Feature Topics New Data & Maps New MINFILE Online Exploration Assistant with Image Analysis
Curriculum Support Maps for the Study of Indiana Coal (Student Handout)
") Curriculum Support Maps for the Study of Indiana Coal (Student Handout) Introduction In this lesson you will learn how to use a geographic information system (GIS) program (IndianaMap) to investigate coal
Curriculum Support Maps for the Study of Indiana Coal (Student Handout) Introduction In this lesson you will learn how to use a geographic information system (GIS) program (IndianaMap) to investigate coal
Module 7, Lesson 1 Water world
 Module 7, Lesson 1 Water world Imagine that the year is 2100. Scientists have determined that the rapidly warming climate of the earth will cause the ice sheets of Antarctica to break apart and melt at
GIS Workshop UCLS_Fall Forum 2014 Sowmya Selvarajan, PhD TABLE OF CONTENTS
 TABLE OF CONTENTS TITLE PAGE NO. 1. ArcGIS Basics I 2 a. Open and Save a Map Document 2 b. Work with Map Layers 2 c. Navigate in a Map Document 4 d. Measure Distances 4 2. ArcGIS Basics II 5 a. Work with
DGS Digital Geologic Information Resource (DGIR) User Guide
 User Guide") DGS Digital Geologic Information Resource (DGIR) User Guide Developed by the Delaware Geological Survey. Revised January 2012. TABLE OF CONTENTS I. INTRODUCTION II. DGIR LAYOUT III. TOOLBARS IV. USING
DGS Digital Geologic Information Resource (DGIR) User Guide Developed by the Delaware Geological Survey. Revised January 2012. TABLE OF CONTENTS I. INTRODUCTION II. DGIR LAYOUT III. TOOLBARS IV. USING
D.T.M: TRANSFER TEXTBOOKS FROM ONE SCHOOL TO ANOTHER
 Destiny Textbook Manager allows users with full access to transfer Textbooks from one school site to another and receive transfers from the warehouse In this tutorial you will learn how to: Requirements:
REPLACE DAMAGED OR MISSING TEXTBOOK BARCODE LABEL
 Destiny Textbook Manager allows users to create and print replacement barcode labels for textbooks. In this tutorial you will learn how to: Replace damaged textbook barcode label(s) Replace missing textbook
THE DIGITAL TERRAIN MAP LIBRARY: AN EXPLORATIONIST S RESOURCE
 THE DIGITAL TERRAIN MAP LIBRARY: AN EXPLORATIONIST S RESOURCE By I.C.L. Webster, P.J. Desjardins and W.E. Kilby KEYWORDS: digital terrain maps, digital terrain stability maps, surficial geology, GIS, raster
Import Digital Spatial Data (Shapefiles) into OneStop
 into OneStop") Import Digital Spatial Data (Shapefiles) into OneStop» Intended User: Pipeline Licence Applicants Overview To apply for a pipeline or pipeline installation licence, applicants must upload the proposed
Import Digital Spatial Data (Shapefiles) into OneStop» Intended User: Pipeline Licence Applicants Overview To apply for a pipeline or pipeline installation licence, applicants must upload the proposed
Lab 1: Importing Data, Rectification, Datums, Projections, and Coordinate Systems
 Lab 1: Importing Data, Rectification, Datums, Projections, and Coordinate Systems Topics covered in this lab: i. Importing spatial data to TAS ii. Rectification iii. Conversion from latitude/longitude
Geography 281 Map Making with GIS Project Eight: Comparing Map Projections
 Geography 281 Map Making with GIS Project Eight: Comparing Map Projections In this activity, you will do a series of projection comparisons using maps at different scales and geographic extents. In this
Topographic Maps and Landforms Geology Lab
 Topographic Maps and Landforms Geology Lab Ray Rector: Instructor Today s Lab Activities 1) Discussion of Last Week s Lab 2) Lecture on Topo Maps and Elevation Contours 3) Construct Topographic Maps and
The CSC Interface to Sky in Google Earth
 The CSC Interface to Sky in Google Earth CSC Threads The CSC Interface to Sky in Google Earth 1 Table of Contents The CSC Interface to Sky in Google Earth - CSC Introduction How to access CSC data with
Learning ArcGIS: Introduction to ArcCatalog 10.1
 Learning ArcGIS: Introduction to ArcCatalog 10.1 Estimated Time: 1 Hour Information systems help us to manage what we know by making it easier to organize, access, manipulate, and apply knowledge to the
Outline Brief Overview MapPlace Website Data Delivery & Map Themes Digital Geology
 BRITISH COLUMBIA GEOLOGICAL SURVEY Kirk Hancock Pat Desjardins Nick Massey BRITISH COLUMBIA Ministry of Energy and Mines Ward Kilby acknowledged developer of MapPlace Outline Brief Overview MapPlace Website
Watershed Modeling Orange County Hydrology Using GIS Data
 v. 10.0 WMS 10.0 Tutorial Watershed Modeling Orange County Hydrology Using GIS Data Learn how to delineate sub-basins and compute soil losses for Orange County (California) hydrologic modeling Objectives
CREATING A REPORT ON FIRE (April 2011)
") CREATING A REPORT ON FIRE (April 2011) The Fire Report feature on the NAFI website lets you create simple summaries of fire activity for areas of land in far northern Australia (north of 20 degrees where
CREATING A REPORT ON FIRE (April 2011) The Fire Report feature on the NAFI website lets you create simple summaries of fire activity for areas of land in far northern Australia (north of 20 degrees where
Introducing IMS. v) Select the Zoom to Full Extent tool. Did you return to the original view?
 Select the Zoom to Full Extent tool. Did you return to the original view?") Ocean/ENVIR 260, Winter 2006 Lab 1, Get to Know the Puget Sound Watershed Name Introducing IMS 1) Open your web browser and navigate to http://128.208.23.127/website/lab1. (This link can be found on the
Ocean/ENVIR 260, Winter 2006 Lab 1, Get to Know the Puget Sound Watershed Name Introducing IMS 1) Open your web browser and navigate to http://128.208.23.127/website/lab1. (This link can be found on the
Investigation 5: What happens when plates move sideways past each other?
 Tectonics Investigation 5: Teacher Guide Investigation 5: What happens when plates move sideways past each other? Plates move sideways past each other at transform boundaries. At these boundaries, the
Mapping coordinate systems
 Mapping coordinate systems 1. The Earth's Graticule Latitude and Longitude The graticule is the imaginary grid of lines running east-west (lines of latitude = parallels) and north-south lines of longitude
Pasco project ground magnetics
 Pasco project ground magnetics Survey information Magnetic results Comments Conclusions General data information 13 June 2017 Piura Trujillo Lima Pasco Cusco Arequipa Survey information General geographic
3D Molecule Viewer of MOGADOC (JavaScript)
") 3D Molecule Viewer of MOGADOC (JavaScript) Movement of the Molecule Rotation of the molecule: Use left mouse button to drag. Translation of the molecule: Use right mouse button to drag. Resize the molecule:
3D Molecule Viewer of MOGADOC (JavaScript) Movement of the Molecule Rotation of the molecule: Use left mouse button to drag. Translation of the molecule: Use right mouse button to drag. Resize the molecule:
Module 7, Lesson 1 Water world
 Module 7, Lesson 1 Water world Imagine that the year is 2100. Scientists have determined that the rapidly warming climate of the earth will cause the ice sheets of Antarctica to break apart and melt at
ENV101 EARTH SYSTEMS
 ENV101 EARTH SYSTEMS Practical Exercise 2 Introduction to ArcMap and Map Projections 1. OVERVIEW This practical is designed to familiarise students with the use of ArcMap for visualising spatial data and
An Instructional Module. FieldScope Unit 1. Introduction to National Geographic Society s FieldScope Program.
 An Instructional Module FieldScope Unit 1 www.budburst.org/fieldscope Introduction to National Geographic Society s FieldScope Program Unit Contents Overview 3 Learning Objectives Time Commitment Technical
Intro to GIS Fall 2010 Georeferencing & Map Projections
 Intro to GIS Fall 2010 Georeferencing & Map Projections SHAPE OF THE EARTH Earth's Shape Geoid: shape of earth minus topographic features (irregular due to local variations in gravity) Ellipsoid: elongated
Curriculum Support Maps for the Study of Indiana Coal
 Curriculum Support Maps for the Study of Indiana Coal By Walt Gray Targeted Age: High School/Middle School Activity Structure: Individual Assignment or Group Project Indiana Standards and Objectives: E.S.
Lab 1: Importing Data, Rectification, Datums, Projections, and Output (Mapping)
") Lab 1: Importing Data, Rectification, Datums, Projections, and Output (Mapping) Topics covered in this lab: i. Importing spatial data to TAS ii. Rectification iii. Conversion from latitude/longitude to
Lab 1: Importing Data, Rectification, Datums, Projections, and Output (Mapping) Topics covered in this lab: i. Importing spatial data to TAS ii. Rectification iii. Conversion from latitude/longitude to
Lauren Jacob May 6, Tectonics of the Northern Menderes Massif: The Simav Detachment and its relationship to three granite plutons
 Lauren Jacob May 6, 2010 Tectonics of the Northern Menderes Massif: The Simav Detachment and its relationship to three granite plutons I. Introduction: Purpose: While reading through the literature regarding
1. Double-click the ArcMap icon on your computer s desktop. 2. When the ArcMap start-up dialog box appears, click An existing map and click OK.
 Module 2, Lesson 1 The earth moves In this activity, you will observe worldwide patterns of seismic activity (earthquakes) and volcanic activity (volcanoes). You will analyze the relationships of those
12/26/2012. Geographic Information Systems * * * * GIS (... yrezaei
 ( - Geographic Information Systems ( ( 1 2 3 Information System Data base DB IS IS DB (Knowledge ( ( (System (Information System - (Georefrence Analysis Data + Knowledge ======== Information 4 5 ( < 10%
Catchment Delineation Workflow
 Catchment Delineation Workflow Slide 1 Given is a GPS point (Lat./Long.) for an outlet location. The outlet could be a proposed Dam site, a storm water drainage culvert on a rural highway, or any other
BOUNDARY MAP USER GUIDE
 BOUNDARY MAP USER GUIDE Get Exploring. Boundaries. The Northern Ontario Boundary Map provides users with the ability to explore the many community, administrative and service provider boundaries in the
Gis Unit TropMed Mahidol U.
 Gis Unit TropMed Mahidol U. Database Information System Database Concepts 1. Non-Spatial Database table, document.. 2. Spatial Database locational databases (geographic) + attribute databases Gis Unit
Lecture 9: Reference Maps & Aerial Photography
 Lecture 9: Reference Maps & Aerial Photography I. Overview of Reference and Topographic Maps There are two basic types of maps? Reference Maps - General purpose maps & Thematic Maps - maps made for a specific
Create Satellite Image, Draw Maps
 Create Satellite Image, Draw Maps 1. The goal Using Google Earth, we want to create and import a background file into our Adviser program. From there, we will be creating paddock boundaries. The accuracy
ESCI 121 Physical Geology
 Observing Streams & Rivers in Google Earth Dr. Jennifer L. Piatek Dept. of Physics and Earth Sciences Central Connecticut State University 506 Copernicus Hall 1615 Stanley Street New Britain, CT 06050
Lesson Plan 2 - Middle and High School Land Use and Land Cover Introduction. Understanding Land Use and Land Cover using Google Earth
 Understanding Land Use and Land Cover using Google Earth Image an image is a representation of reality. It can be a sketch, a painting, a photograph, or some other graphic representation such as satellite
NMR Predictor. Introduction
 NMR Predictor This manual gives a walk-through on how to use the NMR Predictor: Introduction NMR Predictor QuickHelp NMR Predictor Overview Chemical features GUI features Usage Menu system File menu Edit
The MapPlace Using Web-Based Mineral Exploration Data as an Environmental Tool
 The MapPlace Using Web-Based Mineral Exploration Data as an Environmental Tool David Tupper PGeo Pottinger Gaherty Environmental Consultants Ltd Ward Kilby PGeo Cal Data Ltd Larry Jones PGeo BC Ministry
How to Create Stream Networks using DEM and TauDEM
 How to Create Stream Networks using DEM and TauDEM Take note: These procedures do not describe all steps. Knowledge of ArcGIS, DEMs, and TauDEM is required. TauDEM software ( http://hydrology.neng.usu.edu/taudem/
Contour Line Overlays in Google Earth
 Overview: Students download a section of a topographic map of their community from the ATEP website. This file will overlay the Google Earth satellite imagery. Students use the path tool to trace a contour
Resilient Landscapes Fund
 Resilient Landscapes Fund Definitions and Map Guide 2017 This document includes definitions of key terms and instructions for developing maps for application to OSI s Resilient Landscapes Fund. INTRODUCTION
Koenji. Using ARCGIS Online to explore a place
 Koenji Using ARCGIS Online to explore a place ArcGIS Online is a GIS program that can be opened at http://www.arcgis.com/home/ You can click on Sign-up now or Make a map to get started. It is free to use
Studying Topography, Orographic Rainfall, and Ecosystems (STORE)
") Introduction Studying Topography, Orographic Rainfall, and Ecosystems (STORE) Lesson: Using ArcGIS Explorer to Analyze the Connection between Topography, Tectonics, and Rainfall GIS-intensive Lesson This
Introduction Studying Topography, Orographic Rainfall, and Ecosystems (STORE) Lesson: Using ArcGIS Explorer to Analyze the Connection between Topography, Tectonics, and Rainfall GIS-intensive Lesson This
Data Structures & Database Queries in GIS
 Data Structures & Database Queries in GIS Objective In this lab we will show you how to use ArcGIS for analysis of digital elevation models (DEM s), in relationship to Rocky Mountain bighorn sheep (Ovis
Chapter 3 Models of the Earth. 3.1 Finding Locations on the Earth. 3.1 Objectives
 Chapter 3 Models of the Earth 3.1 Finding Locations on the Earth 3.1 Objectives Explain latitude and longitude. How can latitude and longitude be used to find locations on Earth? How can a magnetic compass
Student Activity Sheet- Denali Topo Map
 Student Activity Sheet- Denali Topo Map Directions: Follow the steps in order and answer the associated questions as you proceed through the activity. The first part of the activity will be guided by your
Google Earth. Overview: Targeted Alaska Grade Level Expectations: Objectives: Materials: Grades 5-8
 Overview: Students become familiar with using the Google Earth interface to navigate around the planet. Using the zoom and tilt features, students practice moving around the planet with the navigation
Great Lakes Online Watershed Interface W. Elliot, Research Engineer USDA Forest Service Rocky Mountain Research Station, Moscow, ID March, 2016
 Great Lakes Online Watershed Interface W. Elliot, Research Engineer USDA Forest Service Rocky Mountain Research Station, Moscow, ID March, 2016 Guidelines for using the Web WEPP Watershed Tool to Support
Lab 2: Projecting Geographic Data
 Lab 2: Projecting Geographic Data What you ll Learn: Basic methods for map projections in ArcMap. What You ll Produce: A map of Minnesota in three different statewide projections, a map of reprojected
WindNinja Tutorial 3: Point Initialization
 WindNinja Tutorial 3: Point Initialization 6/27/2018 Introduction Welcome to WindNinja Tutorial 3: Point Initialization. This tutorial will step you through the process of downloading weather station data
The map document opens, and you see a physical map of the world with the Saudi Arabian Peninsula outlined in red.
 Module 5, Lesson 2 A line in the sand The ever-changing map of the world reflects the forces of conflict and cooperation among nations and peoples of the world. In this activity, you will explore one of
How to Make or Plot a Graph or Chart in Excel
 This is a complete video tutorial on How to Make or Plot a Graph or Chart in Excel. To make complex chart like Gantt Chart, you have know the basic principles of making a chart. Though I have used Excel
M E R C E R W I N WA L K T H R O U G H
 H E A L T H W E A L T H C A R E E R WA L K T H R O U G H C L I E N T S O L U T I O N S T E A M T A B L E O F C O N T E N T 1. Login to the Tool 2 2. Published reports... 7 3. Select Results Criteria...
Consents Resource Consents Map
 Consents Resource Consents Map Select the map from the Maps introduction page http://www.waikatoregion.govt.nz/maps/ If you have the map browser open the Resource Consents map will also display when selected
Task 1: Start ArcMap and add the county boundary data from your downloaded dataset to the data frame.
 Exercise 6 Coordinate Systems and Map Projections The following steps describe the general process that you will follow to complete the exercise. Specific steps will be provided later in the step-by-step
Delineation of Watersheds
 Delineation of Watersheds Adirondack Park, New York by Introduction Problem Watershed boundaries are increasingly being used in land and water management, separating the direction of water flow such that
Georeferencing. Where on earth are we? Critical for importing and combining layers for mapping
 Georeferencing Where on earth are we? Critical for importing and combining layers for mapping 1. The Geoid Earth is not a perfect sphere, it is ellipsoidal.. earth is the 'Geoid'. The difference between
Create A Watershed Profile
 Name Date Follow the steps below with Chesapeake Bay FieldScope to create a watershed profile for your location. Part 1. Take a trip down your tributaries. Create A Watershed Profile 1. Find your field
ch02.pdf chap2.pdf chap02.pdf
 Introduction to Geographic Information Systems 8th Edition Karl Solutions Manual Full Download: http://testbanklive.com/download/introduction-to-geographic-information-systems-8th-edition-karl-solutions-manu
Geographical Information Systems
 Geographical Information Systems Geographical Information Systems (GIS) is a relatively new technology that is now prominent in the ecological sciences. This tool allows users to map geographic features
Child Opportunity Index Mapping
 Child Opportunity Index Mapping A partnership project of How to Use and Interpret the Child Opportunity Index Maps How to Use the Child Opportunity Index Maps Getting Started: How to Find and Open a Child
Mapping Census Data in ArcView 3.x
 Mapping Census Data in ArcView 3.x Nancy Lemay University of Ottawa Barbara Znamirowski Trent University Workshop Outline Defining certain concepts and terms: Map scale, coordinate systems, datum and projections.
Basic Map Skills for the Outdoors
 Geography 80-20 80% of what there is to know, for 20% of the sweat Basic Map Skills for the Outdoors Map Scale Map source: US Geological Survey Four ways to indicate map scale: Representative fraction
Part 1: GIS Data from the Web: Downloading and Projecting Digital Elevation Models (DEM) and BTS Road data
 and BTS Road data") Field Geology I Hometown GIS, Part 1 October 03, 2005 Lab Exercise 2.1 Part 1: GIS Data from the Web: Downloading and Projecting Digital Elevation Models (DEM) and BTS Road data 1. Introduction a. GIS
Field Geology I Hometown GIS, Part 1 October 03, 2005 Lab Exercise 2.1 Part 1: GIS Data from the Web: Downloading and Projecting Digital Elevation Models (DEM) and BTS Road data 1. Introduction a. GIS
NEW HOLLAND IH AUSTRALIA. Machinery Market Information and Forecasting Portal *** Dealer User Guide Released August 2013 ***
 NEW HOLLAND IH AUSTRALIA Machinery Market Information and Forecasting Portal *** Dealer User Guide Released August 2013 *** www.cnhportal.agriview.com.au Contents INTRODUCTION... 5 REQUIREMENTS... 6 NAVIGATION...
Water Information Portal User Guide. Updated July 2014
 Water Information Portal User Guide Updated July 2014 1. ENTER THE WATER INFORMATION PORTAL Launch the Water Information Portal in your internet browser via http://www.bcogc.ca/public-zone/water-information
Elephant Rocks State Park (Missouri) Virtual Trip
 Virtual Trip") Elephant Rocks State Park (Missouri) Virtual Trip Objectives 1. Explain how the observed shapes, textures, and patterns of rock indicate the age of the earth and the large scale of geologic time. 2. Describe
Elephant Rocks State Park (Missouri) Virtual Trip Objectives 1. Explain how the observed shapes, textures, and patterns of rock indicate the age of the earth and the large scale of geologic time. 2. Describe
Downloading GPS Waypoints
 Downloading Data with DNR- GPS & Importing to ArcMap and Google Earth Written by Patrick Florance & Carolyn Talmadge, updated on 4/10/17 DOWNLOADING GPS WAYPOINTS... 1 VIEWING YOUR POINTS IN GOOGLE EARTH...
Lightcloud Application
 Controlling Your Lightcloud System Lightcloud Application Lightcloud Application Navigating the Application Devices Device Settings Organize Control Energy Scenes Schedules Demand Response Power Up State
(THIS IS AN OPTIONAL BUT WORTHWHILE EXERCISE)
") PART 2: Analysis in ArcGIS (THIS IS AN OPTIONAL BUT WORTHWHILE EXERCISE) Step 1: Start ArcCatalog and open a geodatabase If you have a shortcut icon for ArcCatalog on your desktop, double-click it to start
PART 2: Analysis in ArcGIS (THIS IS AN OPTIONAL BUT WORTHWHILE EXERCISE) Step 1: Start ArcCatalog and open a geodatabase If you have a shortcut icon for ArcCatalog on your desktop, double-click it to start
The Geodatabase Working with Spatial Analyst. Calculating Elevation and Slope Values for Forested Roads, Streams, and Stands.
 GIS LAB 7 The Geodatabase Working with Spatial Analyst. Calculating Elevation and Slope Values for Forested Roads, Streams, and Stands. This lab will ask you to work with the Spatial Analyst extension.
Using the Stock Hydrology Tools in ArcGIS
 Using the Stock Hydrology Tools in ArcGIS This lab exercise contains a homework assignment, detailed at the bottom, which is due Wednesday, October 6th. Several hydrology tools are part of the basic ArcGIS
caused displacement of ocean water resulting in a massive tsunami. II. Purpose
 I. Introduction The Great Sumatra Earthquake event took place on December 26, 2004, and was one of the most notable and devastating natural disasters of the decade. The event consisted of a major initial
EOS 102: Dynamic Oceans Exercise 1: Navigating Planet Earth
 EOS 102: Dynamic Oceans Exercise 1: Navigating Planet Earth YOU MUST READ THROUGH THIS CAREFULLY! This exercise is designed to familiarize yourself with Google Earth and some of its basic functions while
Search for the Gulf of Carpentaria in the remap search bar:
 This tutorial is aimed at getting you started with making maps in Remap (). In this tutorial we are going to develop a simple classification of mangroves in northern Australia. Before getting started with
Adding point data. Account not required
 Adding point data Find patterns in mountains of data You begin to get a strong sense of what maps can do from this lesson. The image shows a total of 58,000 airline routes on one map. The Web Mercator
GEOREFERENCING, PROJECTIONS Part I. PRESENTING DATA Part II
 Week 7 GEOREFERENCING, PROJECTIONS Part I PRESENTING DATA Part II topics of the week Georeferencing Coordinate systems Map Projections ArcMap and Projections Geo-referencing Geo-referencing is the process
Electric Fields and Equipotentials
 OBJECTIVE Electric Fields and Equipotentials To study and describe the two-dimensional electric field. To map the location of the equipotential surfaces around charged electrodes. To study the relationship
Pegaso map viewer workshop
 PEGASO / 05 Deliverable Plan 2010-12-23 Pegaso Project People for Ecosystem based Governance in Assessing Sustainable development of Ocean and coast Funded by the European Union under FP7 ENV.2009.2.2.1.4
MAR-E1004 Basics of GIS: Georeferencing Jaakko Madetoja Slides adopted from Paula Ahonen-Rainio
 MAR-E1004 Basics of GIS: Georeferencing Jaakko Madetoja Slides adopted from Paula Ahonen-Rainio Learning goals In this session you will learn To describe the basics of different types of referencing systems
IDENTIFYING THE TYPE OF COORDINATE SYSTEM FOR DATA USING ARCMAP
 CHAPTER 1 IDENTIFYING THE TYPE OF COORDINATE SYSTEM FOR DATA USING ARCMAP I got a parcel shapefile from the county, but it doesn t line up with my other data in ArcMap. My boss told me to make a map using
OCEAN/ESS 410 Lab 4. Earthquake location
 Lab 4. Earthquake location To complete this exercise you will need to (a) Complete the table on page 2. (b) Identify phases on the seismograms on pages 3-6 as requested on page 11. (c) Locate the earthquake
Exercise 4. Watershed and Stream Network Delineation
 Exercise 4. Watershed and Stream Network Delineation GIS in Water Resources, Fall 2014 Prepared by David G Tarboton and David R. Maidment Purpose The purpose of this exercise is to illustrate watershed
SoilMapp for ipad is a free app that provides soil information at any location in Australia. You can use SoilMapp to:
 About SoilMapp What is SoilMapp? SoilMapp for ipad is a free app that provides soil information at any location in Australia. You can use SoilMapp to: learn about the soil on your property view maps, photographs,
v WMS Tutorials GIS Module Importing, displaying, and converting shapefiles Required Components Time minutes
 v. 11.0 WMS 11.0 Tutorial Importing, displaying, and converting shapefiles Objectives This tutorial demonstrates how to import GIS data, visualize it, and convert it into WMS coverage data that could be
Geographers Perspectives on the World
 What is Geography? Geography is not just about city and country names Geography is not just about population and growth Geography is not just about rivers and mountains Geography is a broad field that
GET TO KNO W A NATIO NAL
 Your web browser (Safari 7) is out of date. For more security, comfort and the best experience on this site: Update your browser Ignore GET TO KNO W A NATIO NAL PARK W ITH FIEL DSCO PE Explore one of the
Presenting Tree Inventory. Tomislav Sapic GIS Technologist Faculty of Natural Resources Management Lakehead University
 Presenting Tree Inventory Tomislav Sapic GIS Technologist Faculty of Natural Resources Management Lakehead University Suggested Options 1. Print out a Google Maps satellite image of the inventoried block
EOSC 110 Reading Week Activity, February Visible Geology: Building structural geology skills by exploring 3D models online
 EOSC 110 Reading Week Activity, February 2015. Visible Geology: Building structural geology skills by exploring 3D models online Geological maps show where rocks of different ages occur on the Earth s
Lesson 5: Map Scale and Projections
 Organizing Data and Information Lesson 5: Map Scale and Projections Map Scales Projections Information can be organized as lists, numbers, tables, text, pictures, maps, or indexes. Clusters of information
Working with ArcGIS: Classification
 Working with ArcGIS: Classification 2 Abbreviations D-click R-click TOC Double Click Right Click Table of Content Introduction The benefit from the use of geographic information system (GIS) software is
GeoWEPP Tutorial Appendix
 GeoWEPP Tutorial Appendix Chris S. Renschler University at Buffalo - The State University of New York Department of Geography, 116 Wilkeson Quad Buffalo, New York 14261, USA Prepared for use at the WEPP/GeoWEPP
The data for this lab comes from McDonald Forest. We will be working with spatial data representing the forest boundary, streams, roads, and stands.
 GIS LAB 6 Using the Projection Utility. Converting Data to Oregon s Approved Lambert Projection. Determining Stand Size, Stand Types, Road Length, and Stream Length. This lab will ask you to work with