NEW HOLLAND IH AUSTRALIA. Machinery Market Information and Forecasting Portal *** Dealer User Guide Released August 2013 ***
|
|
|
- Randell Washington
- 5 years ago
- Views:
Transcription

1 NEW HOLLAND IH AUSTRALIA Machinery Market Information and Forecasting Portal *** Dealer User Guide Released August 2013 ***
2 Contents INTRODUCTION... 5 REQUIREMENTS... 6 NAVIGATION... 6 LOG IN... 7 FORECASTING... 8 EQUIPMENT TYPES... 9 TRACTORS FORECAST YEAR & BRANCH FORECASTING FOR NEXT CALENDAR YEAR Forecasting TIV Market Size Forecasting TIV Market Size by Power Breaks Forecasting TIV Market Size by Power Breaks by month Forecasting Market Share Forecasting Market Share by Power Breaks Forecasting Market Share by Power Breaks by Family by Model Forecasting Tyres Percentage by Family Forecasting Final Report for next Calendar Year FORECASTING FOR CURRENT CALENDAR YEAR Select Forecast Year & Branch Forecasting TIV Forecasting Market Share by Power Breaks by Family by Model Forecasting Tyres Percentage by Family Forecasting Final Report for Current Calendar Year COMBINES FORECASTING FOR NEXT CALENDAR YEAR Selecting Forecast Year & Branch Forecasting TIV Market Size Forecasting TIV market size by month Forecasting Market Share
3 Forecast Market Share by Model Forecasting Market Share by Model by Month Forecasting Combine Front Forecasting Final Report for next Calendar Year FORECASTING FOR CURRENT CALENDAR YEAR Select Forecast Year & Branch Forecasting TIV Forecasting Market Share by Power Breaks by Family by Model Forecasting Combine Front Forecasting Final Report for Current Calendar Year BALERS FORECASTING FOR NEXT CALENDAR YEAR Selecting Forecast Year & Branch Forecasting TIV Market Size Forecasting TIV Market Size by Baler type Forecasting TIV Market Size by Baler type by month Forecasting Market Share Forecasting Market Share by Baler type Forecasting Market Share by Baler type by Model Forecasting Final Report for Next Calendar Year FORECASTING FOR CURRENT CALENDAR YEAR Select Forecast Year & Branch Forecasting TIV Forecasting Market Share by Power Breaks by Family by Model Forecasting Final Report for Current Calendar Year DOLLAR VALUE REPORT GROUP REPORTS View Group Forecast Report View Group dollar value Report SAVING REPORT PRIOR TO SUBMIT TO CNH GOOGLE CHROME INTERNET EXPLORER
4 PRINTING FORECAST GOOGLE CHROME INTERNET EXPLORER PRINTING / SAVING TO ADOBE REPORTS OPENING A REPORT MAPS CHANGING PASSWORD
5 Introduction The New Holland dealer sales portal is include a Forecasting Module. This is a vital feature that will not only provide New Holland with regular grass roots market intelligence on industry trends and product requirements but can also be a constructive tool within the dealership to enhance the overall management of the dealership (eg ensuring prospects are matched to forecast sales). During the course of the year the dealership will be required to forecast for the current calendar year and the upcoming calendar year. Forecasting Schedule (NOTE: Schedule may be subject to change at CNH discretion). Forecast Month December March June September Forecast Year Next Current Current & next Current & next The dealership will be advised via when the forecast is available to be commenced, usually around the middle of the month after the sales reports are completed. The dealership then has the balance of the month to complete and submit their completed forecast to CNH. Prior to commencing a forecast it is recommended that the following reports are printed from the Reports Menu. 1. Dealer QTR Industry Sales Report 2. Industry Sales Report for Dealer These reports will provide supplementary historical data that will aid with the forecasting. Once a forecast is completed it is highly recommended that a copy is saved to the local computer, or at the very least a hard copy printed and filed for future reference. A suggested structure is to create a folder under my documents and then separate quarterly folders and separate folders for each equipment type, see right. 5

6 Requirements The NEW HOLLAND MARKET DATA & FORECASTING website has been designed to run on most web browsers. For optimum performance Agriview utilise Google Chrome. Google Chrome 16 above Firefox 4.0 and above Internet Explorer 8 and above Navigation To navigate around the site use your mouse. To navigate around the individual forecast forms you can either use your Tab key or the arrow keys. Using the arrow keys is the most efficient. You can also use your mouse to navigate the forms, however it can be cumbersome. 6

7 Log In In browser enter URL cnhportal.agriview.com.au Save as Bookmark for future use Enter your username and password as provided If checked, you will be automatically logged in on the CNH Portal Web site when you return in the future, unless you log out during your session. NOTE: User Name and password are case sensitive Your user name and password are the same as the current Market Information Reporting Portal 7

8 Forecasting Select Forecast option 8

9 Equipment Types Select the equipment you wish to forecast Prior to commencing a forecast it is recommended that the following reports are printed from the Reports Menu. 1. Dealer QTR Industry Sales Report 2. Industry Sales Report for Dealer These reports will provide supplementary historical data that will aid with the forecasting. 9
10 Tractors Forecast Year & Branch 1. Select the year to forecast 2. Select the Branch to forecast 3. Once year and Branch have been selected click on Start a new Forecast TIV Year There are two different forecasts, the first is a Current forecast for the calendar year you are currently in. The second is for the upcoming calendar year. In this example 2014 is the future Branch If you have more than one branch each branch will have to be forecast separately, select one branch at a time from the drop down list. If you have previously opened a forecast the option will be replaced with option. 10
11 Forecasting for Next Calendar Year Forecasting TIV Market Size In the below example the forecast is for the next year. On this screen, you are asked to forecast the Total Industry Volume (TIV) for your PMA for the full calendar year (in this case 2014) using your knowledge of the business and the historical data provided. Actual sales data 1. Enter the TIV forecast for Branch 5 Yr Ave - Is the sum of TIV sales for the previous 5 years divided by five (completed calendar years) Your Forecast Enter the TIV for your branch Actual sales:- FY-LY = Full Year Last Year (eg if completing the forecast in January 2014, this will show full year 2013 TIV). YTD-TH = Year to Date for the year currently in YTD-LY = Year to Date for the previous year R12M = Sum of the previous 12 months excluding the month currently in (eg: if currently in November 2013, R12M would include November 2012 to October 2013 sales) 2. Click Next to proceed 11
12 Forecasting TIV Market Size by Power Breaks On this screen, you are asked to forecast the segmentation of the TIV for your PMA into the respective HP categories using your knowledge of the business and the historical data provided. This column shows the average proportion of the TIV represented by this HP segment over the past 5 years Actual sales data This column shows an average of the last 5 years TIV Out of Balance displays the amount of units over/under to be entered to balance with Total TIV entered on previous screen. MUST BE ZERO TO PROCEED 1. Enter the TIV forecast for Branch split by Hp Power Breaks. Enter either units (on left) or percentage (on right) 2. Click Next to proceed. Note: Next will not be available until Out of Balance is zero 12

13 Forecasting TIV Market Size by Power Breaks by month On this screen you are asked to calendarise your forecast TIV by HP segment. Your forecast from previous screen Total of 12 months Jan-Dec 1. Enter the TIV forecast by month by Hp Power Breaks. Difference between full year total and your forecast NOTE: Monthly spread by Hp Power Breaks have been pre-populated based on the sales data from the previous five years. This is information intended as a guide only. Some variances may occur due to rounding. 13

14 2. Click Next to proceed. Note: Next will not be available until Total & Forecast are in balance TIV FORECASTING IS NOW COMPLETE PROCEED TO FORECAST YOUR MARKET SHARE 14
15 Forecasting Market Share On this screen you are asked to forecast your market share (either as units or % share) based on your business objectives and the historical data provided. 1. Enter YOUR forecast Market Share for full year. Enter as unit (on right) or percentage (on left) 5 Yr Ave M/S % - Is the sum of Brand sales for the previous 5 years divided by five (completed calendar years) 2. Click Next to proceed Your Forecast M/S Enter your forecasted Market Share either as units or share Actual sales:- LY = Full Year Last Year YTD-TH = Year to Date for the year currently in YTD-LY = Year to Date for the previous year R12M = Sum of the previous 12 months excluding the month currently in (eg: if currently in November 2013, R12M would include November 2011 to October 2013 sales) 15

16 Forecasting Market Share by Power Breaks As above (Step 3, page 10), you are asked to forecast your market share (units) by HP segment using your knowledge of the business, your business objectives and the historical data provided. 1. Enter your Market Share forecast for Branch split by Hp Power Breaks. 2. Click Next to proceed 16

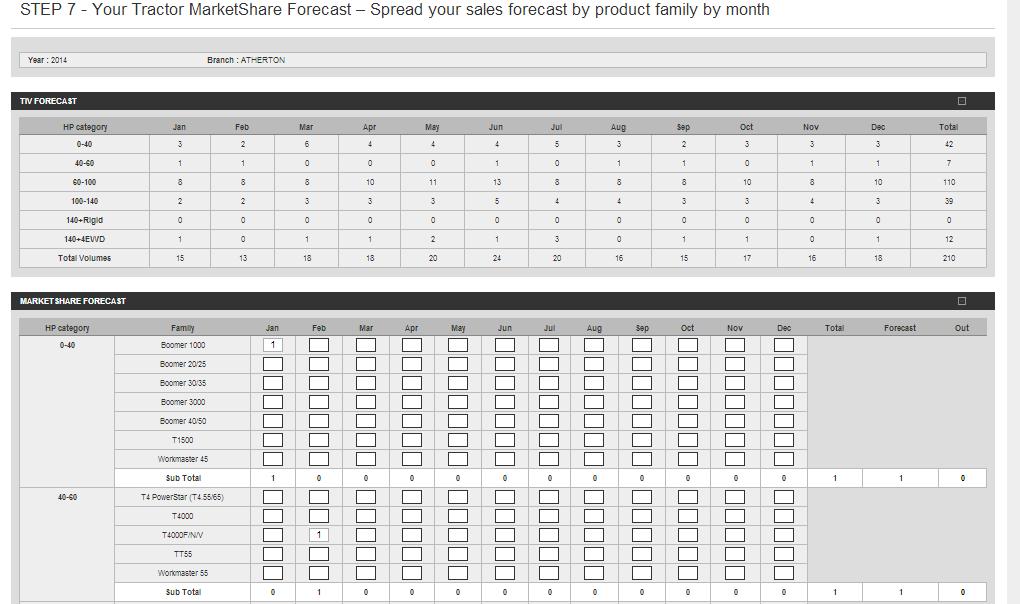
17 Forecasting Market Share by Power Breaks by Family by Model On this screen you are asked to calendars your forecasted volumes for each HP segment by product family. Window can be minimised if not required This is the monthly TIV spread entered earlier. Use this information to forecast your market share by family/model 1. Enter your forecast sales by family by month This is the volume you forecasted for this HP segment in the previous step 17

18 When input market forecast figures, a yellow floating bar will pop out displays corresponding TIV segment forecast. This pop-up window is only available in future forecasting. The quantity will be reset to 0 if you attempt to enter data in a family where no TIV has been forecast or the volume exceeds the TIV forecasted 18
19 19

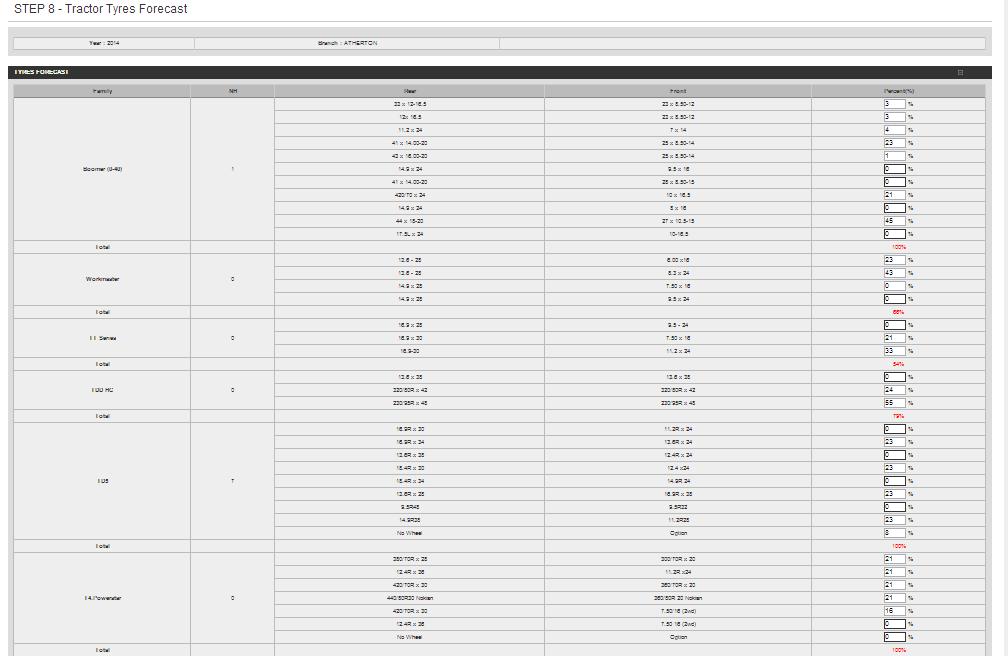
20 2. When complete click Next to proceed Forecasting Tyres Percentage by Family 20

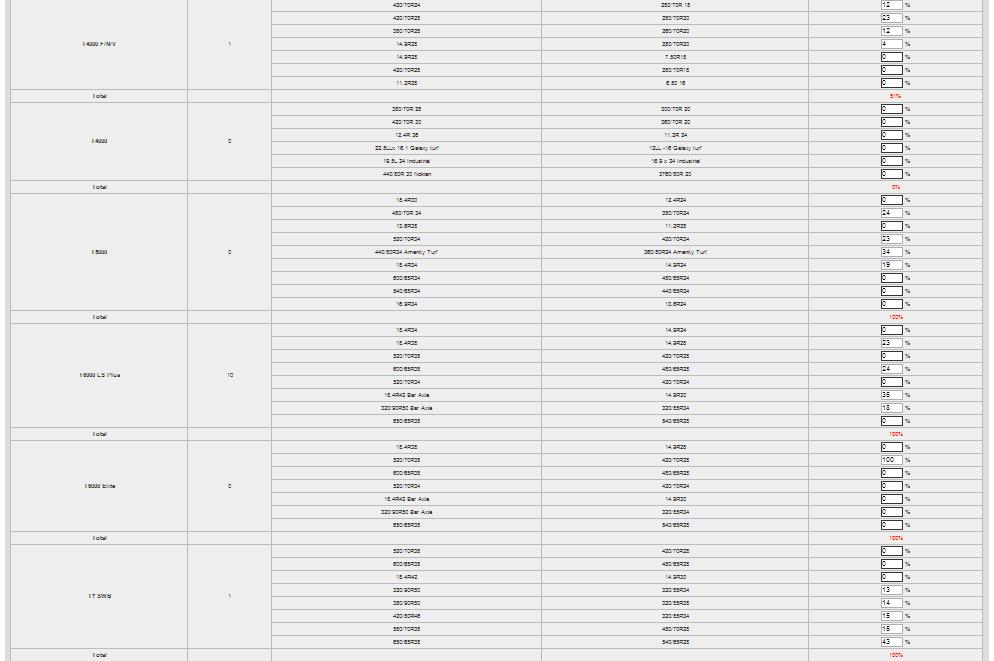
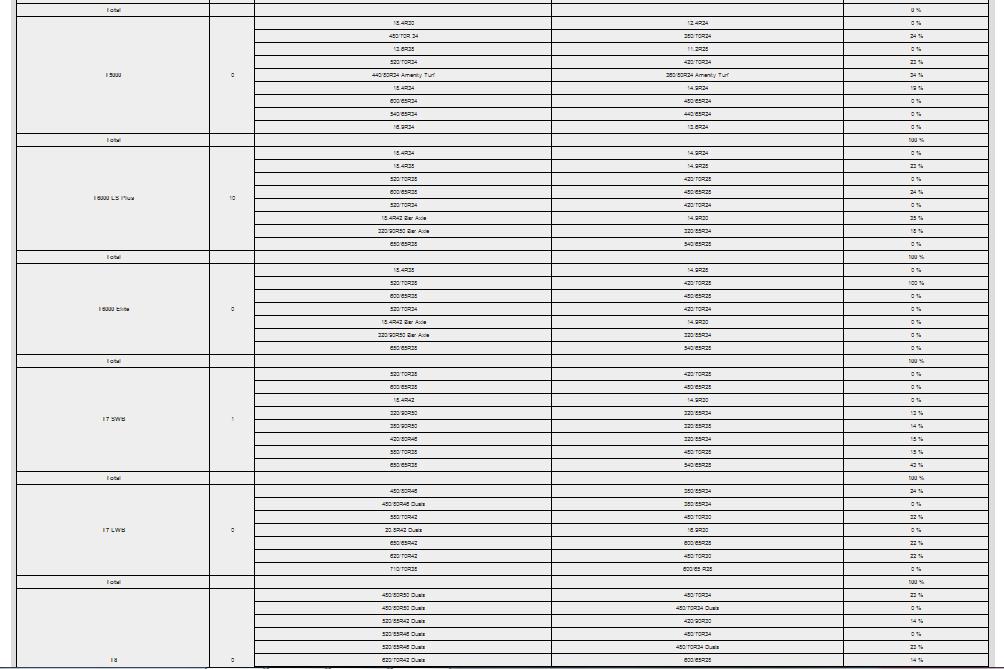
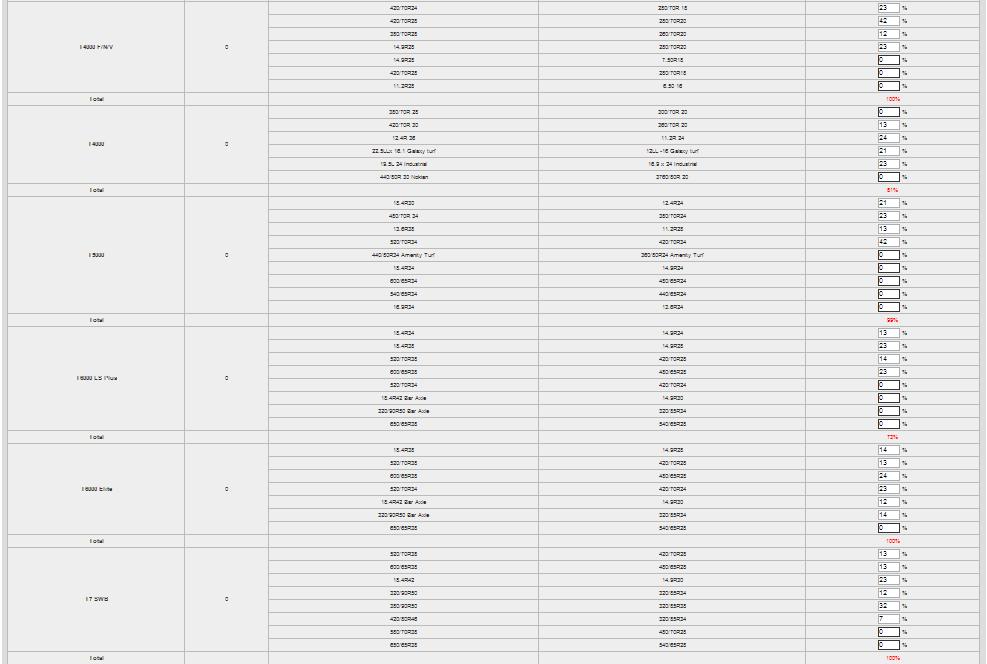
21 On this screen you are asked to input tyre percentages for each tyre styles by product family 1. Input the percentage of the tyre combination. The sum of the percentage should be equal to or less than 100%, if the forecast % exceeds 100% it will be highlighted in Red and you need to correct it before you can submit.. Note that this can be left as 0% if you intend to fit tyres that are not listed. 21
22 22
23 23

24 24 2. When complete click Next to proceed

25 Forecasting Final Report for next Calendar Year This screen is a summary of the completed forecast for your review prior to submission. 25
26 26
27 27

28 1. Review final report. Ensure a copy is printed for your records 2. After reviewing, print, save and submit to CNH 28
29 Forecasting for Current Calendar Year Select Forecast Year & Branch 1. Select the year to forecast 2. Select the Branch to forecast 3. Once year and Branch have been selected click on Open current Forecast 29

30 Forecasting TIV On this screen you are asked to forecast the TIV by HP segment for the balance of the year based on your knowledge of the business, actual YTD sales and your previous forecasted TIV by HP segment. In this example the TIV sales for January to March are actual sales 1. Enter total revised forecast sales total of actual and updated forecast months 2. Enter forecast sales for remaining months to balance with revised forecast 3. Click Next to proceed If you are out of balance the values will be shown in RED in the Out column on the right you can correct this by adjusting the sales by month to equal your revised forecast or adjust the revised forecast number. Actual sales will be automatically populated for the completed months. 30

31 Forecasting Market Share by Power Breaks by Family by Model On this screen you are asked to forecast your sales by product family for the balance of the year based on your knowledge of the business, your retail order bank, anticipated delivery timing and overall marketing objectives. 1. Adjust forecast sales for remaining months by family/model 2. Adjust Revised Forecast sales for remaining months for family 3. Click Next to proceed 31

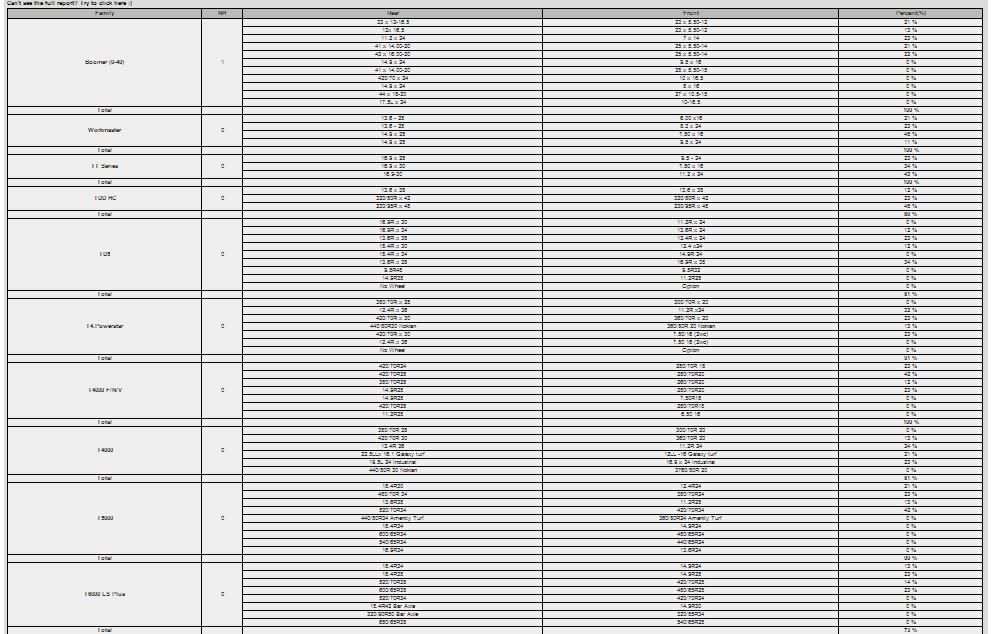
32 Forecasting Tyre Percentage by Family On this screen you are asked to input tyre percentages for each tyre styles by product family 32
33 33

34 1. Input the percentage of the tyre combination. 2. When complete click Next to proceed 34

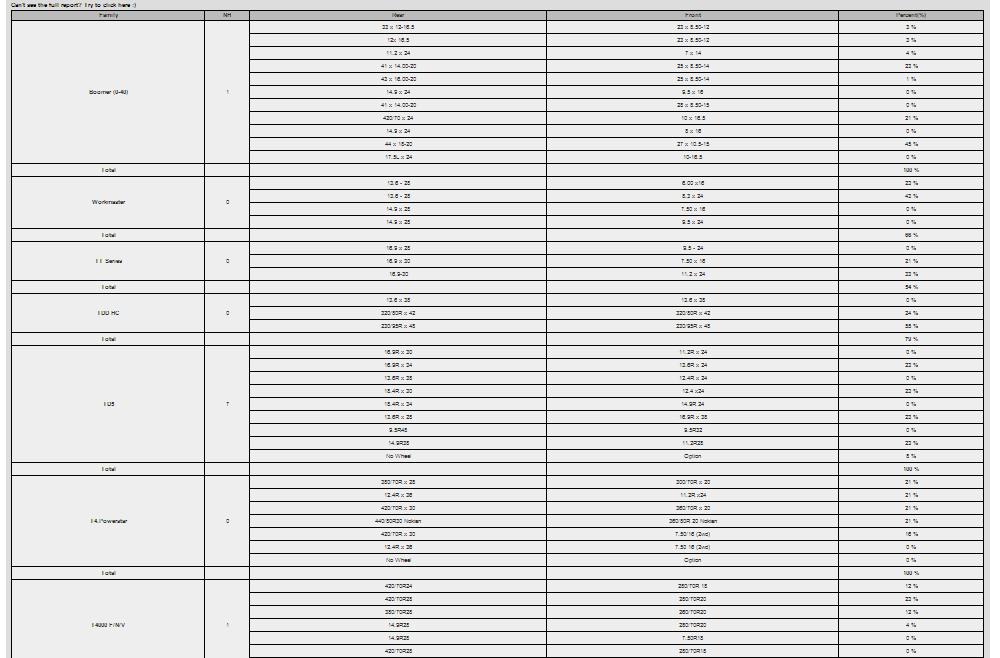
35 Forecasting Final Report for Current Calendar Year This screen is a summary of the completed forecast for your review prior to submission If the full report goes off the screen click here 35
36 36

37 1. Review final report. Ensure a copy is printed for your records Once forecast has been submitted to CNH it cannot be adjusted 2. After reviewing, print, save and submit to CNH 37
38 Combines Forecasting for Next Calendar Year Selecting Forecast Year & Branch 1. Select the year to forecast 2. Select the Branch to forecast 3. Once year and Branch have been selected click on Start a new Forecast Prior to commencing a forecast it is recommended that the following reports are printed from the Reports Menu. 1. Dealer QTR Industry Sales Report 2. Industry Sales Report for Dealer These reports will provide supplementary historical data that will aid with the forecasting 38
39 Forecasting TIV Market Size The process for forecasting combines is similar to that for tractors. Actual sales data 1. Enter the TIV forecast for Branch 2. Click Next to proceed 5 Yr Ave - Is the sum of TIV sales for the previous 5 years divided by five (completed calendar years) Your Forecast Enter the TIV for your branch Actual sales:- FY-LY = Full Year Last Year YTD-TH = Year to Date for the year currently in YTD-LY = Year to Date for the previous year R12M = Sum of the previous 12 months excluding the month currently in (eg: if currently in November 2013, R12M would include November 2012 to October 2013 sales) 39
40 Forecasting TIV market size by month Your forecast from previous screen Total of 12 months Jan-Dec 1. Enter the TIV forecast by month. Difference between full year total and your forecast NOTE: Monthly spread has been pre-populated based on the sales data from the previous five years. This is information intended as a guide only. Some variances may occur due to rounding. 40

41 2. Click Next to proceed. Note: Next will not be available until Total & Forecast are in balance TIV FORECASTING IS NOW COMPLETE PROCEED TO FORECAST YOUR MARKET SHARE 41
 Your Forecast M/S Enter your forecasted Market Share either as")
42 Forecasting Market Share 1. Enter YOUR forecast Market Share for full year. Enter as unit (on right) or percentage (on left) 2. Click Next to proceed 5 Yr Ave M/S % - Is the sum of Brand sales for the previous 5 years divided by five (completed calendar years) Your Forecast M/S Enter your forecasted Market Share either as units or share Actual sales:- LY = Full Year Last Year YTD-TH = Year to Date for the year currently in YTD-LY = Year to Date for the previous year R12M = Sum of the previous 12 months excluding the month currently in (eg: if currently in November 2013, R12M would include November 2012to October 2013 sales) 42

43 Forecast Market Share by Model 1. Enter your Market Share forecast for Branch by model 2. Click Next to proceed 43

44 Forecasting Market Share by Model by Month Window can be minimised if not required This is the monthly TIV spread entered earlier. Use this information to forecast your market share by family/model 1. Enter your forecast sales by month by model 2. Click Next to proceed 44
45 Forecasting Combine Front 1. Enter combine front forecast sales 2. Click Next to proceed 45

46 Forecasting Final Report for next Calendar Year 1. Review final report. Ensure a copy is printed for your records Once forecast has been submitted to CNH it cannot be adjusted After reviewing, print, save and submit to CNH

47 Forecasting for Current Calendar Year Select Forecast Year & Branch 1. Select the year to forecast 2. Select the Branch to forecast 3. Once year and Branch have been selected click on Open current Forecast 47

48 Forecasting TIV On this screen you are asked to forecast the TIV for the balance of the year based on your knowledge of the business, actual YTD sales and your previous forecasted TIV by HP segment. 1. Enter total revised forecast sales total of actual and updated forecast months In this example the TIV sales for January to March are actual sales 2. Enter forecast sales for remaining months to balance with revised forecast 3. Click Next to proceed Actual sales will be automatically populated for the completed months. 48

49 Forecasting Market Share by Power Breaks by Family by Model On this screen you are asked to forecast your sales by models for the balance of the year based on your knowledge of the business, your retail order bank, anticipated delivery timing and overall marketing objectives. 1. Adjust forecast sales for remaining months by family/model 2. Adjust Revised Forecast sales for remaining months for family 3. Click Next to proceed 49

50 Forecasting Combine Front 1. Input combine front numbers 2. When complete click Next to proceed 50

51 Forecasting Final Report for Current Calendar Year This screen is a summary of the completed forecast for your review prior to submission If the full report goes off the screen click here 2. After reviewing, print, save and submit to CNH 1. Review final report. Ensure a copy is printed for your records Once forecast has been submitted to CNH it cannot be adjusted 51
52 Balers Forecasting for Next Calendar Year Selecting Forecast Year & Branch 1. Select the year to forecast 2. Select the Branch to forecast 3. Once year and Branch have been selected click on Start a new Forecast 52
 Your Forecast Enter the TIV for your branch Actual sales:- FY-LY = Full")
53 Forecasting TIV Market Size On this screen you are asked to forecast the TIV for ALL balers (ie Round, Large Square & Small Square). Actual sales data 1. Enter the TIV forecast for Branch 2. Click Next to proceed 5 Yr Ave - Is the sum of TIV sales for the previous 5 years divided by five (completed calendar years) Your Forecast Enter the TIV for your branch Actual sales:- FY-LY = Full Year Last Year YTD-TH = Year to Date for the year currently in YTD-LY = Year to Date for the previous year R12M = Sum of the previous 12 months excluding the month currently in (eg: if currently in November 2013, R12M would include November 2012 to October 2013 sales) 53
 or percentage (on right) 2. Click Next to proceed.")
54 Forecasting TIV Market Size by Baler type Actual sales data Out of Balance displays the amount of units over/under to be entered to balance with Total TIV entered on previous screen. MUST BE ZERO TO PROCEED 1. Enter the TIV forecast for Branch split by Baler segment. Enter either units (on left) or percentage (on right) 2. Click Next to proceed. Note: Next will not be available until Out of Balance is zero 54

55 Forecasting TIV Market Size by Baler type by month Your forecast from previous screen Total of 12 months Jan-Dec 1. Enter the TIV forecast by month by Baler segment. Difference between full year total and your forecast NOTE: Monthly spread by Baler type has been pre-populated based on the sales data from the previous five years. This is information intended as a guide only. Some variances may occur due to rounding. 55
56 2. Click Next to proceed. Note: Next will not be available until Total & Forecast are in balance TIV FORECASTING IS NOW COMPLETE PROCEED TO FORECAST YOUR MARKET SHARE 56
57 Forecasting Market Share 1. Enter YOUR forecast Market Share for full year. Enter as unit (on right) or percentage (on left) 2. Click Next to proceed 5 Yr Ave M/S % - Is the sum of Brand sales for the previous 5 years divided by five (completed calendar years) Your Forecast M/S Enter your forecasted Market Share either as units or share Actual sales:- LY = Full Year Last Year YTD-TH = Year to Date for the year currently in YTD-LY = Year to Date for the previous year R12M = Sum of the previous 12 months excluding the month currently in (eg: if currently in November 2013, R12M would include November 2012 to October 2013 sales) 57

58 Forecasting Market Share by Baler type 1. Enter your Market Share forecast for Branch split by Type 2. Click Next to proceed 58

59 Forecasting Market Share by Baler type by Model This is the monthly TIV spread entered earlier. Use this information to forecast your market share by family/model 1. Enter your forecast sales by month by model 2. When complete click Next to proceed 59

60 Forecasting Final Report for Next Calendar Year 1. Review final report. Ensure a copy is printed for your records Once forecast has been submitted to CNH it cannot be adjusted 2. After reviewing, print, save and submit to CNH 60
61 Forecasting for Current Calendar Year Select Forecast Year & Branch 1. Select the year to forecast 2. Select the Branch to forecast 3. Once year and Branch have been selected click on Open current Forecast 61

62 Forecasting TIV On this screen you are asked to forecast the TIV by segment for the balance of the year based on your knowledge of the business, actual YTD sales and your previous forecasted TIV by HP segment. In this example the TIV sales for January to March are actual sales 1. Enter total revised forecast sales total of actual and updated forecast months 2. Enter forecast sales for remaining months to balance with revised forecast 3. Click Next to proceed Actual sales will be automatically populated for the completed months. 62

63 Forecasting Market Share by Power Breaks by Family by Model On this screen you are asked to forecast your sales by product family for the balance of the year based on your knowledge of the business, your retail order bank, anticipated delivery timing and overall marketing objectives. 1. Adjust forecast sales for remaining months by family/model 2. Adjust Revised Forecast sales for remaining months for family 3. Click Next to proceed 63

64 Forecasting Final Report for Current Calendar Year This screen is a summary of the completed forecast for your review prior to submission If the full report goes off the screen click here 1. Review final report. Ensure a copy is printed for your records Once forecast has been submitted to CNH it cannot be adjusted 2. After reviewing, print, save and submit to CNH 64
65 Dollar Value Report Once you finished all your Current or New forecast for all equipments(tractor, combine, baler) corresponding dollar value report will be available. Button turns to green indicates forecast for all equipments is done. Click to review the dollar value report. 65

66 Download the report The dollar value calculated based on your own market forecast. NOTE THAT THE DOLLAR VALUES ARE BASED ON $ 000, FOR EXAMPLE IN AUG THE TRACTOR VALUE IS LISTED AS 111, THIS REPRESENTS $111,

67 Group Reports View Group Forecast Report. Only when all dealers in the group finished their forecast the group forecast report becomes available to the group. Click to view group reports Group name List of Dealers in this group Button grey out indicates not all dealers finished forecast for the year. When all the dealers in the Group have finished their forecasts the button will be GREEN and the final report can be viewed. If the button is GRAYED OUT some or all of the dealers in the group have not completed their forecasts and the final report cannot be viewed. If one dealer has multiple branches they have to finish all branch forecasts before the dollar value report can be generated. 67

68 68 Save group forecast report.

69 View Group dollar value Report If all the dealers in this group finished their forecast then the dollar value report is available to view. Values are in $ 000 Save group dollar value report. 69
 to open 3/ Right click anywhere on report and select Save as The Save As window will open. 4/ Change the file name to allow for easy identification.")
70 Saving Report prior to submit to CNH Google Chrome 1/ Click on the button at bottom of page The report will download file to the bottom left of screen 2/ Click on the report name (report.html) to open 3/ Right click anywhere on report and select Save as The Save As window will open. 4/ Change the file name to allow for easy identification.. 5/ Save to relevant folder as advised to set up on page 4 of this document 70

71 Internet Explorer 1/ Click on the button at bottom of page The Download window will automatically appear 2/ Click on save 3/ Change the file name to allow for easy identification. 4/ Save to relevant folder as advised to set up on page 4 of this document. 71

72 Printing Forecast Google Chrome Click on the button 1. Select the printer 3. Print 2. Select the Layout 72


73 Internet Explorer Click on the button 1. Select the printer 2. Select Preference to change layout 3. Print 73


74 Printing / Saving to Adobe If you have Adobe loaded on your computer you will be able to save reports to a.pdf format 2. Select location to save to 1. Select the printer as ADOBE 3. Select file name 4. Save NOTE: There will be a save feature added to the portal to allow saving of final report directly to your PC. At time of printing this option was not finalised 74

75 Reports All reports are provided in Microsoft Excel (.xls) format and can be opened or saved to your computer s hard drive. Opening a report Click on the drop down arrow and select the dealer area you wish to look at from the list of dealer areas provided. Select the report which you wish to look at. You will be then prompted:- Do you want to open or save this file? Click Open report will open in Excel 75

76 Sample Report Reports can be printed or saved to your computer s hard disc for future reference. WARNING: Each month the reports are over written, they are not archived so if you want to retain these for future reference please save them each month. 76

77 Maps Both Comparison Maps and Prime Market Area Maps are provided for all dealer areas. At the top of the Navigation Panel is the Dealer Area drop down menu. Click on the drop down arrow and select the dealer area you wish to look at from the list of dealer areas provided then select either the Comparison Map or the Prime Market Area Map that you wish to view. Click Open 77

78 The map will open up in your default photo viewing software. All maps can be saved to your computer s hard drive or printed. WARNING: The Comparison Maps will be updated at the end of each quarter. Maps for previous periods are not archived and cannot be viewed once the new quarter s maps have been added. If you want to retain these for future reference; please save them prior to the end of each quarter. Prime Market Areas remain unchanged until there is redistribution. 78

79 Changing Password To change your password, select the Change Password option. 2. Enter current Password 3. Enter new Password 4. Enter new Password to confirm 1. Click Change Password 5. Click Change Password when ready NOTE: A password cannot be the same as one previously used 79
M E R C E R W I N WA L K T H R O U G H
 H E A L T H W E A L T H C A R E E R WA L K T H R O U G H C L I E N T S O L U T I O N S T E A M T A B L E O F C O N T E N T 1. Login to the Tool 2 2. Published reports... 7 3. Select Results Criteria...
Using the Budget Features in Quicken 2008
 Using the Budget Features in Quicken 2008 Quicken budgets can be used to summarize expected income and expenses for planning purposes. The budget can later be used in comparisons to actual income and expenses
REPLACE DAMAGED OR MISSING TEXTBOOK BARCODE LABEL
 Destiny Textbook Manager allows users to create and print replacement barcode labels for textbooks. In this tutorial you will learn how to: Replace damaged textbook barcode label(s) Replace missing textbook
Forecast User Manual FORECAST. User Manual. Version P a g e
 FORECAST Version 1.0 1 P a g e Version Created By Created On Verified By Verified On Description No Draft Mr. Jayendrasinh 22/04/2016 Gohil 1.0 Mr. Jayendrasinh Gohil 23/04/2016 Mr. Hemal Patel 2 P a g
SteelSmart System Cold Formed Steel Design Software Download & Installation Instructions
 Step 1 - Login or Create an Account at the ASI Portal: Login: https://portal.appliedscienceint.com/account/login Create Account: https://portal.appliedscienceint.com/account/register 2 0 1 7 A p p l i
TOP MARKET SURVEY INSTRUCTION SHEET. Requirements. Overview
 INSTRUCTION SHEET TOP SURVEY TOP SURVEY INSTRUCTION SHEET Overview For nearly 40 years, the ACA has surveyed member agencies and conducted the Top Collection Market Survey. This survey provides critical
D.T.M: TRANSFER TEXTBOOKS FROM ONE SCHOOL TO ANOTHER
 Destiny Textbook Manager allows users with full access to transfer Textbooks from one school site to another and receive transfers from the warehouse In this tutorial you will learn how to: Requirements:
Water Information Portal User Guide. Updated July 2014
 Water Information Portal User Guide Updated July 2014 1. ENTER THE WATER INFORMATION PORTAL Launch the Water Information Portal in your internet browser via http://www.bcogc.ca/public-zone/water-information
Bloomsburg University Weather Viewer Quick Start Guide. Software Version 1.2 Date 4/7/2014
 Bloomsburg University Weather Viewer Quick Start Guide Software Version 1.2 Date 4/7/2014 Program Background / Objectives: The Bloomsburg Weather Viewer is a weather visualization program that is designed
Using the FCMQ`s snowmobile trail interactive map
 Using the FCMQ`s snowmobile trail interactive map Recommended browsers: Google Chrome, Mozilla Firefox or Internet Explorer 10 or newer. The interactive map is compatible with any type of mobile device
LED Lighting Facts: Product Submission Guide
 LED Lighting Facts: Product Submission Guide NOVEMBER 2017 1 P a g e L E D L i g h t i n g F a c t s : M a n u f a c t u r e r P r o d u c t S u b m i s s i o n G u i d e TABLE OF CONTENTS Section 1) Accessing
Designing a Quilt with GIMP 2011
 Planning your quilt and want to see what it will look like in the fabric you just got from your LQS? You don t need to purchase a super expensive program. Try this and the best part it s FREE!!! *** Please
The CSC Interface to Sky in Google Earth
 The CSC Interface to Sky in Google Earth CSC Threads The CSC Interface to Sky in Google Earth 1 Table of Contents The CSC Interface to Sky in Google Earth - CSC Introduction How to access CSC data with
LED Lighting Facts: Manufacturer Guide
 LED Lighting Facts: Manufacturer Guide 2018 1 P a g e L E D L i g h t i n g F a c t s : M a n u f a c t u r e r G u i d e TABLE OF CONTENTS Section 1) Accessing your account and managing your products...
OneStop Map Viewer Navigation
 OneStop Map Viewer Navigation» Intended User: Industry Map Viewer users Overview The OneStop Map Viewer is an interactive map tool that helps you find and view information associated with energy development,
Demand Forecasting. for. Microsoft Dynamics 365 for Operations. User Guide. Release 7.1. April 2018
 Demand Forecasting for Microsoft Dynamics 365 for Operations User Guide Release 7.1 April 2018 2018 Farsight Solutions Limited All Rights Reserved. Portions copyright Business Forecast Systems, Inc. This
Search for the Gulf of Carpentaria in the remap search bar:
 This tutorial is aimed at getting you started with making maps in Remap (). In this tutorial we are going to develop a simple classification of mangroves in northern Australia. Before getting started with
Investigating Weather and Climate with Google Earth Teacher Guide
 Google Earth Weather and Climate Teacher Guide In this activity, students will use Google Earth to explore global temperature changes. They will: 1. Use Google Earth to determine how the temperature of
Quality Measures Green Light Report Online Management Tool. Self Guided Tutorial
 Quality Measures Green Light Report Online Management Tool Self Guided Tutorial 1 Tutorial Contents Overview Access the QM Green Light Report Review the QM Green Light Report Tips for Success Contact PointRight
CHEMICAL INVENTORY ENTRY GUIDE
 CHEMICAL INVENTORY ENTRY GUIDE Version Date Comments 1 October 2013 Initial A. SUMMARY All chemicals located in research and instructional laboratories at George Mason University are required to be input
Advanced Forecast. For MAX TM. Users Manual
 Advanced Forecast For MAX TM Users Manual www.maxtoolkit.com Revised: June 24, 2014 Contents Purpose:... 3 Installation... 3 Requirements:... 3 Installer:... 3 Setup: spreadsheet... 4 Setup: External Forecast
AFFH-T User Guide September 2017 AFFH-T User Guide U.S. Department of Housing and Urban Development
 AFFH-T User Guide Affirmatively Furthering Fair Housing Data and Mapping Tool v. 4.1 U.S. Department of Housing and Urban Development September 2017 Version 4.1 ❿ September 2017 Page 1 Document History
ON SITE SYSTEMS Chemical Safety Assistant
 ON SITE SYSTEMS Chemical Safety Assistant CS ASSISTANT WEB USERS MANUAL On Site Systems 23 N. Gore Ave. Suite 200 St. Louis, MO 63119 Phone 314-963-9934 Fax 314-963-9281 Table of Contents INTRODUCTION
BOUNDARY MAP USER GUIDE
 BOUNDARY MAP USER GUIDE Get Exploring. Boundaries. The Northern Ontario Boundary Map provides users with the ability to explore the many community, administrative and service provider boundaries in the
Decision 411: Class 3
 Decision 411: Class 3 Discussion of HW#1 Introduction to seasonal models Seasonal decomposition Seasonal adjustment on a spreadsheet Forecasting with seasonal adjustment Forecasting inflation Poor man
How to Perform a Site Based Plant Search
 PlantSelector Help Use PlantSelector to get detailed information and photos of plants by: Searching for plants that will grow well at your planting site. How do I do this? OR Searching for plants with
OpenWeatherMap Module
 OpenWeatherMap Module Installation and Usage Guide Revision: Date: Author(s): 1.0 Friday, October 13, 2017 Richard Mullins Contents Overview 2 Installation 3 Import the TCM in to accelerator 3 Add the
User Guide. Affirmatively Furthering Fair Housing Data and Mapping Tool. U.S. Department of Housing and Urban Development
 User Guide Affirmatively Furthering Fair Housing Data and Mapping Tool U.S. Department of Housing and Urban Development December, 2015 1 Table of Contents 1. Getting Started... 5 1.1 Software Version...
CREATING A REPORT ON FIRE (April 2011)
") CREATING A REPORT ON FIRE (April 2011) The Fire Report feature on the NAFI website lets you create simple summaries of fire activity for areas of land in far northern Australia (north of 20 degrees where
CREATING A REPORT ON FIRE (April 2011) The Fire Report feature on the NAFI website lets you create simple summaries of fire activity for areas of land in far northern Australia (north of 20 degrees where
Decision 411: Class 3
 Decision 411: Class 3 Discussion of HW#1 Introduction to seasonal models Seasonal decomposition Seasonal adjustment on a spreadsheet Forecasting with seasonal adjustment Forecasting inflation Poor man
New Zealand Population Distribution
 New Zealand Population Distribution Requirements: Internet access Web browser (e.g. Internet Explorer, Mozilla Firefox, Google Chrome)** An Esri Global Account **Please insure that pop ups are not blocked
Guide to Hydrologic Information on the Web
 NOAA s National Weather Service Guide to Hydrologic Information on the Web Colorado River at Lees Ferry Photo: courtesy Tim Helble Your gateway to web resources provided through NOAA s Advanced Hydrologic
Planning Softproviding Meat User Documentation
 Great ideas are always simple Softproviding simply makes them happen. Planning Softproviding Meat User Documentation Version: 1.00 Date: 24 August 2017 Release: v5.50 Softproviding AG Riehenring 175 CH-4058
3D Molecule Viewer of MOGADOC (JavaScript)
") 3D Molecule Viewer of MOGADOC (JavaScript) Movement of the Molecule Rotation of the molecule: Use left mouse button to drag. Translation of the molecule: Use right mouse button to drag. Resize the molecule:
3D Molecule Viewer of MOGADOC (JavaScript) Movement of the Molecule Rotation of the molecule: Use left mouse button to drag. Translation of the molecule: Use right mouse button to drag. Resize the molecule:
SuperCELL Data Programmer and ACTiSys IR Programmer User s Guide
 SuperCELL Data Programmer and ACTiSys IR Programmer User s Guide This page is intentionally left blank. SuperCELL Data Programmer and ACTiSys IR Programmer User s Guide The ACTiSys IR Programmer and SuperCELL
Multivariate Regression Model Results
 Updated: August, 0 Page of Multivariate Regression Model Results 4 5 6 7 8 This exhibit provides the results of the load model forecast discussed in Schedule. Included is the forecast of short term system
Decision 411: Class 3
 Decision 411: Class 3 Discussion of HW#1 Introduction to seasonal models Seasonal decomposition Seasonal adjustment on a spreadsheet Forecasting with seasonal adjustment Forecasting inflation Log transformation
Gridded Ambient Air Pollutant Concentrations for Southern California, User Notes authored by Beau MacDonald, 11/28/2017
 Gridded Ambient Air Pollutant Concentrations for Southern California, 1995-2014 User Notes authored by Beau, 11/28/2017 METADATA: Each raster file contains data for one pollutant (NO2, O3, PM2.5, and PM10)
Evaluating Physical, Chemical, and Biological Impacts from the Savannah Harbor Expansion Project Cooperative Agreement Number W912HZ
 Evaluating Physical, Chemical, and Biological Impacts from the Savannah Harbor Expansion Project Cooperative Agreement Number W912HZ-13-2-0013 Annual Report FY 2018 Submitted by Sergio Bernardes and Marguerite
Building Inflation Tables and CER Libraries
 Building Inflation Tables and CER Libraries January 2007 Presented by James K. Johnson Tecolote Research, Inc. Copyright Tecolote Research, Inc. September 2006 Abstract Building Inflation Tables and CER
New SPOT Program. Customer Tutorial. Tim Barry Fire Weather Program Leader National Weather Service Tallahassee
 New SPOT Program Customer Tutorial Tim Barry Fire Weather Program Leader National Weather Service Tallahassee tim.barry@noaa.gov Live Demonstration http://www.weather.gov/spot/ Live Demonstration http://www.weather.gov/spot/
Introduction to Google Drive Objectives:
 Introduction to Google Drive Objectives: Learn how to access your Google Drive account Learn to create new documents using Google Drive Upload files to store on Google Drive Share files and folders with
Account Setup. STEP 1: Create Enhanced View Account
 SpyMeSatGov Access Guide - Android DigitalGlobe Imagery Enhanced View How to setup, search and download imagery from DigitalGlobe utilizing NGA s Enhanced View license Account Setup SpyMeSatGov uses a
User Manuel. EurotaxForecast. Version Latest changes ( )
") User Manuel EurotaxForecast Version 1.23.0771- Latest changes (19.07.2003) Contents Preface 5 Welcome to Eurotax Forecast...5 Using this manual 6 How to use this manual?...6 Program overview 7 General
User Manuel EurotaxForecast Version 1.23.0771- Latest changes (19.07.2003) Contents Preface 5 Welcome to Eurotax Forecast...5 Using this manual 6 How to use this manual?...6 Program overview 7 General
Software BioScout-Calibrator June 2013
 SARAD GmbH BioScout -Calibrator 1 Manual Software BioScout-Calibrator June 2013 SARAD GmbH Tel.: ++49 (0)351 / 6580712 Wiesbadener Straße 10 FAX: ++49 (0)351 / 6580718 D-01159 Dresden email: support@sarad.de
Urban Canopy Tool User Guide `bo`
 Urban Canopy Tool User Guide `bo` ADMS Urban Canopy Tool User Guide Version 2.0 June 2014 Cambridge Environmental Research Consultants Ltd. 3, King s Parade Cambridge CB2 1SJ UK Telephone: +44 (0)1223
K D A A M P L I F I E R S F I R M W A R E U S E R G U I D E
 K D A A M P L I F I E R S F I R M W A R E U S E R G U I D E T A B L E O F C O N T E N T S S E C T I O N 1 : P R E PA R I N G Y O U R F I L E S Via Network Router 3 S E C T I O N 2 : A C C E S S I N G T
Name Date Class. Figure 1. The Google Earth Pro drop-down menu.
 GIS Student Walk-Through Worksheet Procedure 1. Import historical tornado and hurricane data into Google Earth Pro by following these steps: A. In the Google Earth Pro drop-down menu > click File > Import
ST-Links. SpatialKit. Version 3.0.x. For ArcMap. ArcMap Extension for Directly Connecting to Spatial Databases. ST-Links Corporation.
 ST-Links SpatialKit For ArcMap Version 3.0.x ArcMap Extension for Directly Connecting to Spatial Databases ST-Links Corporation www.st-links.com 2012 Contents Introduction... 3 Installation... 3 Database
Seismic/Eruption Teaching Modules
 0. Introduction to SeisVolE teaching Page 1 of 10 Seismic/Eruption Teaching Modules Lawrence W. Braile Sheryl J. Braile http://www.eas.purdue.edu/~braile/edumod/svintro/svintro.htm Seismic/Eruption Teaching
mylab: Chemical Safety Module Last Updated: January 19, 2018
 : Chemical Safety Module Contents Introduction... 1 Getting started... 1 Login... 1 Receiving Items from MMP Order... 3 Inventory... 4 Show me Chemicals where... 4 Items Received on... 5 All Items... 5
GIS Workshop UCLS_Fall Forum 2014 Sowmya Selvarajan, PhD TABLE OF CONTENTS
 TABLE OF CONTENTS TITLE PAGE NO. 1. ArcGIS Basics I 2 a. Open and Save a Map Document 2 b. Work with Map Layers 2 c. Navigate in a Map Document 4 d. Measure Distances 4 2. ArcGIS Basics II 5 a. Work with
How to Make or Plot a Graph or Chart in Excel
 This is a complete video tutorial on How to Make or Plot a Graph or Chart in Excel. To make complex chart like Gantt Chart, you have know the basic principles of making a chart. Though I have used Excel
Orange Visualization Tool (OVT) Manual
 Manual") Orange Visualization Tool (OVT) Manual This manual describes the features of the tool and how to use it. 1. Contents of the OVT Once the OVT is open (the first time it may take some seconds), it should
Orange Visualization Tool (OVT) Manual This manual describes the features of the tool and how to use it. 1. Contents of the OVT Once the OVT is open (the first time it may take some seconds), it should
Electric Fields and Equipotentials
 OBJECTIVE Electric Fields and Equipotentials To study and describe the two-dimensional electric field. To map the location of the equipotential surfaces around charged electrodes. To study the relationship
Contour Line Overlays in Google Earth
 Overview: Students download a section of a topographic map of their community from the ATEP website. This file will overlay the Google Earth satellite imagery. Students use the path tool to trace a contour
Standards-Based Quantification in DTSA-II Part II
 Standards-Based Quantification in DTSA-II Part II Nicholas W.M. Ritchie National Institute of Standards and Technology, Gaithersburg, MD 20899-8371 nicholas.ritchie@nist.gov Introduction This article is
Computer simulation of radioactive decay
 Computer simulation of radioactive decay y now you should have worked your way through the introduction to Maple, as well as the introduction to data analysis using Excel Now we will explore radioactive
An area chart emphasizes the trend of each value over time. An area chart also shows the relationship of parts to a whole.
 Excel 2003 Creating a Chart Introduction Page 1 By the end of this lesson, learners should be able to: Identify the parts of a chart Identify different types of charts Create an Embedded Chart Create a
Lesser Sunda - Banda Seascape Atlas
 Lesser Sunda - Banda Seascape Atlas Report prepared for the development of online interactive map for Lesser Sunda Banda Seascape by WorldFish December 2014 http://sbsatlas.reefbase.org Page 1 of 8 Table
Uta Bilow, Carsten Bittrich, Constanze Hasterok, Konrad Jende, Michael Kobel, Christian Rudolph, Felix Socher, Julia Woithe
 ATLAS W path Instructions for tutors Version from 2 February 2018 Uta Bilow, Carsten Bittrich, Constanze Hasterok, Konrad Jende, Michael Kobel, Christian Rudolph, Felix Socher, Julia Woithe Technische
PanosFX CALENDAR User guide. PanosFX CALENDAR. For Adobe Photoshop CC, CS6, CS5, CS4, CS3. PSD templates & language switcher actions.
 PanosFX CALENDAR For Adobe Photoshop CC, CS6, CS5, CS4, CS3 PSD templates & language switcher actions User Guide CONTENTS 1. THE BASICS... 1 1.1. Description... 1 1.2. How the files are organized... 2
Earth Mars Oppositions and Conjunctions
 Earth Mars Oppositions and Conjunctions 2001-2010 Bob Albrecht & George Firedrake StarshipGaia@aol.com Ahoy, Teachers. Elsewhere we have suggested that you and your students model the motions of Mercury,
Chemwatch How To. Create Labels for Chemicals, Products & Mixtures.
 Chemwatch How To. Create Labels for Chemicals, Products & Mixtures. Dr Ian Lane Radiation and Chemical Manager Faculty of Science Version 1.0, April 2017 Outline: (i) Important Note! Part A: Creating a
Sales Analysis User Manual
 Sales Analysis User Manual Confidential Information This document contains proprietary and valuable, confidential trade secret information of APPX Software, Inc., Richmond, Virginia Notice of Authorship
The GHG Reservoir Tool (G-res)
") UNESCO/IHA research project on the GHG status of freshwater reservoirs The GHG Reservoir Tool (G-res) User guidelines for the Earth Engine functionality United Nations Educational, Scientific and Cultural
UNESCO/IHA research project on the GHG status of freshwater reservoirs The GHG Reservoir Tool (G-res) User guidelines for the Earth Engine functionality United Nations Educational, Scientific and Cultural
Watershed Modeling Orange County Hydrology Using GIS Data
 v. 10.0 WMS 10.0 Tutorial Watershed Modeling Orange County Hydrology Using GIS Data Learn how to delineate sub-basins and compute soil losses for Orange County (California) hydrologic modeling Objectives
Synteny Portal Documentation
 Synteny Portal Documentation Synteny Portal is a web application portal for visualizing, browsing, searching and building synteny blocks. Synteny Portal provides four main web applications: SynCircos,
Using UNAVCO Real-Time CORS Data, a No-Cost Positioning Resource
 Using UNAVCO Real-Time CORS Data, a No-Cost Positioning Resource By: Mark Silver, ms@igage.com, +1-801-412-0011 Date: 19 August 2014 UNAVCO is a non-profit consortium of Universities that coordinates the
Date: Summer Stem Section:
 Page 1 of 7 Name: Date: Summer Stem Section: Summer assignment: Build a Molecule Computer Simulation Learning Goals: 1. Students can describe the difference between a molecule name and chemical formula.
SoilMapp for ipad is a free app that provides soil information at any location in Australia. You can use SoilMapp to:
 About SoilMapp What is SoilMapp? SoilMapp for ipad is a free app that provides soil information at any location in Australia. You can use SoilMapp to: learn about the soil on your property view maps, photographs,
INTEGRAL. Science Operations Centre. Announcement of Opportunity for Observing Proposals (AO-11) INT/OAG/ /Dc Issue 1.
 INT/OAG/ /Dc Issue 1.") Science Operations Centre Announcement of Opportunity for Observing Proposals (AO-11) INT/OAG/13-0383/Dc Issue 1.0 25 February 2013 Prepared by Miguel Arregui, Emilio Salazar Date: 25 February 2013 Page:
Science Operations Centre Announcement of Opportunity for Observing Proposals (AO-11) INT/OAG/13-0383/Dc Issue 1.0 25 February 2013 Prepared by Miguel Arregui, Emilio Salazar Date: 25 February 2013 Page:
Quick Reference Manual. Ver. 1.3
 Quick Reference Manual Ver. 1.3 1 EXASITE Voyage EXSITE Voyage is a web-based communication tool designed to support the following users; Ship operators who utilize Optimum Ship Routing (OSR) service in
Investigation 5: What happens when plates move sideways past each other?
 Tectonics Investigation 5: Teacher Guide Investigation 5: What happens when plates move sideways past each other? Plates move sideways past each other at transform boundaries. At these boundaries, the
Frequently Asked Questions
 Frequently Asked Questions Can I still get paid via direct deposit? Can I use e- wallet to pay for USANA auto ship orders? Can I use e- wallet to pay for USANA products? Can I use e- wallet to pay for
Ontario Flow Assessment Tool III
 Ontario Flow Assessment Tool III Quick Start Guide Ontario Flow Assessment Tools, version III (OFAT III) is an online, spatially-based application to automate a series of labourintensive technical hydrology
Zetasizer Nano-ZS User Instructions
 Zetasizer Nano-ZS User Instructions 1. Activate the instrument computer by logging in to CORAL. If needed, log in to the local instrument computer Username: zetasizer. Password: zetasizer. 2. Instrument
ncounter PlexSet Data Analysis Guidelines
 ncounter PlexSet Data Analysis Guidelines NanoString Technologies, Inc. 530 airview Ave North Seattle, Washington 98109 USA Telephone: 206.378.6266 888.358.6266 E-mail: info@nanostring.com Molecules That
CIMA Professional
 CIMA Professional 201819 Manchester Interactive Timetable Version 3.1 Information last updated 12/10/18 Please note: Information and dates in this timetable are subject to change. A better way of learning
CIMA Professional
 CIMA Professional 201819 Birmingham Interactive Timetable Version 3.1 Information last updated 12/10/18 Please note: Information and dates in this timetable are subject to change. A better way of learning
Virtual Beach Making Nowcast Predictions
 Virtual Beach 3.0.6 Making Nowcast Predictions In this module you will learn how to: A. Create a real-time connection to Web data services through EnDDaT B. Download real-time data to make a Nowcast prediction
ACCA Interactive Timetable & Fees
 ACCA Interactive Timetable & Fees 2018/19 Professional Version 2.1 Information last updated 01 November 2018 Please note: Information and dates in this timetable are subject to change. A better way of
THE BIOGRAPHY OF OUR AGE,ONE MONTH AT A TIME
 S P E C I A L A N N I V E R S A RY I S S U E! V. F. s First Century 1913 2013 Ka t e UPTON B LOWS OU T the C A N D L E, A N N I E L E I B OV I TZ S NA P S the PH OTO O C TO B E R 2013 Featuring KU RT A
Location Intelligence Infrastructure Asset Management. Confirm. Confirm Mapping Link to ArcMap Version v18.00b.am
 Location Intelligence Infrastructure Asset Management Confirm Confirm Mapping Link to ArcMap Version v18.00b.am Information in this document is subject to change without notice and does not represent a
A Plot of the Tracking Signals Calculated in Exhibit 3.9
 CHAPTER 3 FORECASTING 1 Measurement of Error We can get a better feel for what the MAD and tracking signal mean by plotting the points on a graph. Though this is not completely legitimate from a sample-size
Quality Measures (QM) Report. Self Guided Tutorial
 Report. Self Guided Tutorial") Quality Measures (QM) Report Self Guided Tutorial 1 Tutorial Contents Overview of the QM Online Report Facility Summary Report Resident Drill down Monthly Trend Report Resident Roster Report Printing Reports/Export
Quality Measures (QM) Report Self Guided Tutorial 1 Tutorial Contents Overview of the QM Online Report Facility Summary Report Resident Drill down Monthly Trend Report Resident Roster Report Printing Reports/Export
General Chemistry Lab Molecular Modeling
 PURPOSE The objectives of this experiment are PROCEDURE General Chemistry Lab Molecular Modeling To learn how to use molecular modeling software, a commonly used tool in chemical research and industry.
Measuring earthquake-generated surface offsets from high-resolution digital topography
 Measuring earthquake-generated surface offsets from high-resolution digital topography July 19, 2011 David E. Haddad david.e.haddad@asu.edu Active Tectonics, Quantitative Structural Geology, and Geomorphology
new interface and features
 Web version of SciFinder : new interface and features Bhawat Ruangying, CAS representative Updated at 22 Dec 2009 www.cas.org SciFinder web interface Technical aspects of SciFinder Web SciFinder URL :
Virtual Beach Building a GBM Model
 Virtual Beach 3.0.6 Building a GBM Model Building, Evaluating and Validating Anytime Nowcast Models In this module you will learn how to: A. Build and evaluate an anytime GBM model B. Optimize a GBM model
The Geodatabase Working with Spatial Analyst. Calculating Elevation and Slope Values for Forested Roads, Streams, and Stands.
 GIS LAB 7 The Geodatabase Working with Spatial Analyst. Calculating Elevation and Slope Values for Forested Roads, Streams, and Stands. This lab will ask you to work with the Spatial Analyst extension.
Map My Property User Guide
 Map My Property User Guide Map My Property Table of Contents About Map My Property... 2 Accessing Map My Property... 2 Links... 3 Navigating the Map... 3 Navigating to a Specific Location... 3 Zooming
Patrick: An Introduction to Medicinal Chemistry 5e MOLECULAR MODELLING EXERCISES CHAPTER 17
 MOLECULAR MODELLING EXERCISES CHAPTER 17 Exercise 17.6 Conformational analysis of n-butane Introduction Figure 1 Butane Me Me In this exercise, we will consider the possible stable conformations of butane
ACCA Interactive Timetable & Fees
 ACCA Interactive Timetable & Fees 2018/19 Professional Version 1.1 Information last updated tember 2018 Please note: Information and dates in this timetable are subject to change. A better way of learning
MDSS Functional Prototype Display System Preview April 2002
 MDSS Functional Prototype Display System Preview April 2002 Bill Mahoney National Center for Atmospheric Research Images shown are valid as of 15 April 2002 NCAR MDSS Display System - Overview The MDSS
Tutorial. Getting started. Sample to Insight. March 31, 2016
 Getting started March 31, 2016 Sample to Insight CLC bio, a QIAGEN Company Silkeborgvej 2 Prismet 8000 Aarhus C Denmark Telephone: +45 70 22 32 44 www.clcbio.com support-clcbio@qiagen.com Getting started
Possible Prelab Questions.
 Possible Prelab Questions. Read Lab 2. Study the Analysis section to make sure you have a firm grasp of what is required for this lab. 1) A car is travelling with constant acceleration along a straight
ACCA Interactive Timetable
 ACCA Interactive Timetable 2018 Professional Version 5.1 Information last updated 2nd May 2018 Please note: Information and dates in this timetable are subject to change. A better way of learning that
An Instructional Module. FieldScope Unit 1. Introduction to National Geographic Society s FieldScope Program.
 An Instructional Module FieldScope Unit 1 www.budburst.org/fieldscope Introduction to National Geographic Society s FieldScope Program Unit Contents Overview 3 Learning Objectives Time Commitment Technical
UNT FOLIOTEK FOR FACULTY FALL Alyssa Strong Foliotek Administrator
 UNT FOLIOTEK FOR FACULTY FALL 2018 Alyssa Strong Foliotek Administrator Alyssa.Strong@unt.edu 940-369-5157 Agenda What is Foliotek? Courses and Rubrics in Foliotek Best Practices Logging in Canvas/Blackboard