PRESERVING HISTORICAL AERIAL PHOTOGRAPHS TO PROTECT OKLAHOMA GROUNDWATER
|
|
|
- Ursula Burke
- 5 years ago
- Views:
Transcription


1 PRESERVING HISTORICAL AERIAL PHOTOGRAPHS TO PROTECT OKLAHOMA GROUNDWATER Madeline Dillner Presented by Kellie Duncan Oklahoma Corporation Commission John Harrington Association of Central Oklahoma Governments Pictured: Tulsa County, 1958
2 Road Map 1 ACOG surveyed the West Edmond Oilfield for patches of oilfield brine. 2 OCC used part of ACOG s white paper as a basis for the original historic dense oilfield (HDO) GIS project. 3 ACOG has used census data and shapefiles generated from the original HDO project to choose which areas for which to apply for an Area Wide Planning Grant from EPA to clean up the pollution. 4 After data quality analysis of the original HDO project, OCC is copying ACOG s original method of using historical aerial photos to more accurately identify areas of contamination around the state.


3 West Edmond Aerial Photo Survey Association of Central Oklahoma Governments Pictured: Tulsa County, 1958


4 WEST EDMOND OIL FIELD CIRCA 1945


5


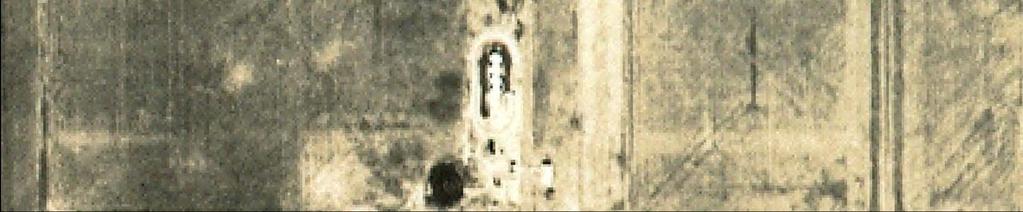
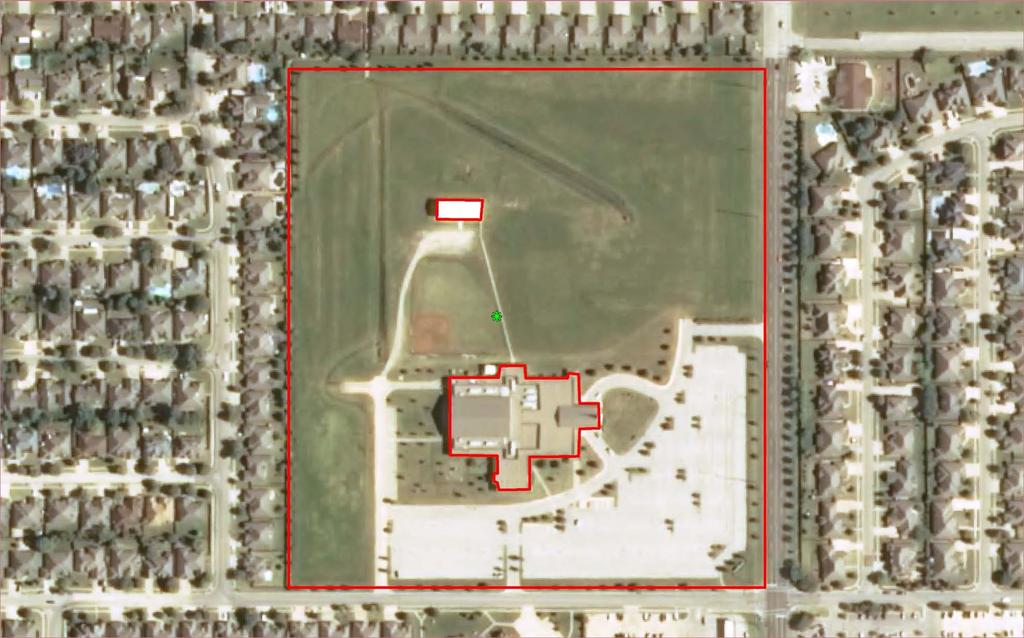
6 Where there were Oilfield Tank, now we have New Homes


7 Analysis of the Aerial Photos included coverages from 1941, 1951, 1957, 1963, and Not all coverages covered the same areas.


8 And Google Maps has now got some pretty interesting stuff too!

9 The Hot Spot Map showing anomalies. If a site showed up on 3 or more vintages of aerial photos, it was considered to be a persistent issue worthy of a brownfield.

10


11
12

13


14 Historic Dense Oilfield Project Oklahoma Corporation Commission

15 Creating Historic Dense Oilfield Maps for New Well Casing Rule OCC saw ACOG s white paper Decided to make maps of historic dense oilfields (HDOs) over aquifers to show areas that are at higher risk of being contaminated with oilfield brine In these areas, we will recommend that OWRB require water wells to have deeper cement casing to block subsurface brine from contaminating the aquifers


16 First Water Well Later Water Well SALT WATER IN PIPE 10 feet of cement casing Gravel pack 30 FEET HENNESSEY SHALE GARBER SANDSTONE AQUIFER

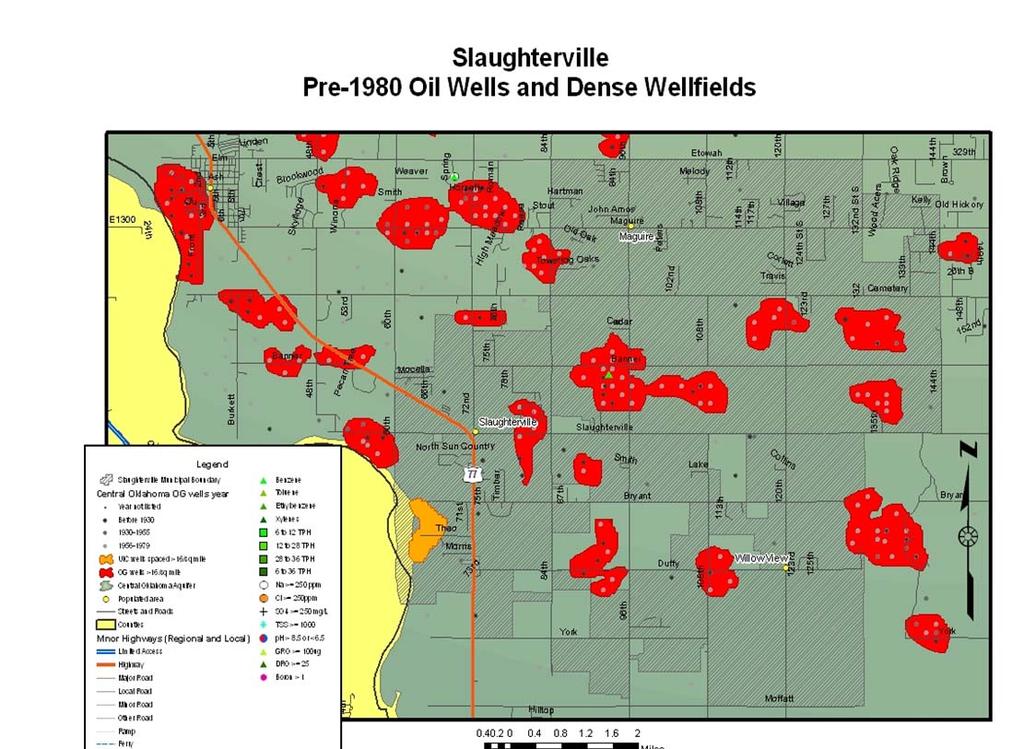
17 HDO Project Data: Point Shapefile Each point is an oil, gas, and/or injection well location GPS locations come from well records given to the OCC by operators over the years On these forms, locations are recorded by legal locations for old wells, legal locations and GPS for newer wells. OCC used a tool which converted legal locations to GPS coordinates by grabbing the coordinates of the centroid of the smallest unit of location recorded for the well. Chose to look at only wells completed before Jan. 1, 1980, because after 1980, OCC s environmental regulations changed. much stricter restrictions for well drilling started requiring pit liners doubled number of field inspectors to enforce the new rules.

18 HDO Project Data: Buffers Chose a density of 1 well/40 acres to define a historic dense oilfield 1 well/40 acres = 16 wells/square mile This means if you were driving down 1- mile a strip of country road, you would see 4 wells. There are 1,320 feet between wells at this density. Buffering each well with over half that distance will ensure wells at this distance overlap. 1,320/2 = foot buffers on each point

19 HDO Project Process Round 1 (The Hard Way) Still in college Still getting comfortable with the Toolbox Created shapefile by outlining the oilfields by hand Only discovered the streaming vertices method of creating a polygon halfway through Took months


20 Round 1 Maps
, dissolves, spatial joins (with sum function), and merges")

21 HDO Project Process Round 2 (The Easy Way) Old shapefile (green) New shapefile (red and gray) More familiar with ArcToolbox Created new shapefiles from a series of buffers, unions (with no gaps allowed), dissolves, spatial joins (with sum function), and merges New shapefile was streamlined and could be used to give area of land in historic dense oilfields 5,007,610 acres of wellfields at 1/40-acre spacing in OLD shapefile 2,512,121 acres of wellfields at 1/40-acre spacing in NEW shapefile much less daunting for rule-making


22 Round 2 Maps and metadata!


23 Area Grant Projects Association of Central Oklahoma Governments YEAR
24 ACOG is applying for an Area-wide Assessment Grant. However, the environmental justice requirement necessitates that we look at areas with lower income levels.
25 Assessment Grant 2014 Assessment Grant Proposal will target legacy oil and gas areas with low income census blocks. Oilfields with Census Blocks having lower than median income

26

27 Assessment Grant 2014 Leaking Oil Pipeline

28 Assessment Grant 2014 Leaking Oil Pipeline


29 HDO Data Analysis and New Project Direction Oklahoma Corporation Commission 2014 future!
30 Gathering Metadata We wanted some data on our data specifically: we wanted information about the quality of the well location data. We found There are inaccuracies: Sometimes people don t understand quarter calls and write them in backwards. We ve caught some of the errors, but there are a lot of wells. The locations are imprecise: Assuming that wells are located at the centroids of the legal location blocks can give errors of up to 3,733 feet.


31 Side Note: Legal Locations 101 PLSS Grid Legal locations in Oklahoma are based on the townshiprange grid of the Public Land Survey System TN-RW TS-RW TN-RE TS-RE Each square block is a township/range
 Each Section is divided into quarters (160 acres), which can also be split into quarters (40 acres), which can be split again into 10- acre and 2.")
32 Side Note: Legal Locations 101 Townships/Ranges and Sections Each township/range block is 6 miles x 6 miles, and contains 36 Sections Each Section is 1 mile x 1 mile (640 acres) Each Section is divided into quarters (160 acres), which can also be split into quarters (40 acres), which can be split again into 10- acre and 2.5-acre quarters.
33 Side Note: Legal Locations 101 Quarter Calls and Location Precision The amount of quarter calls we get for a well determines how accurate its GPS location is acr e 10- acr e 40- acre acre Section (640- acre) Townsh ip Rang e NE SW SE NW 28 T7N R3W NW 28 T7N R3W We know that this well is somewhere in 2.5 acres. We only know this well is somewhere in 160 acres.
34 How much imprecision? Maximum error values (in color) are based on assumption that the well in question had its GPS location calculated as center of block, but is actually located in the corner. Each additional quarter-call given cuts our potential maximum error for that well s location in half. 40 acres SW NE 10 Acres SE NE NE 2 qtrs given: 933 ft 233 ft 2.5 Acres SE NE NE NE 467 ft 160 acres SE 5,280 ft


35 So, How Precise is our Well Data? Section 1 quarter 2 quarters 3 quarters 4 quarters
36 How Accurate Is Our Well Data? As accurate as it can be, given the technology at the time the wells were drilled, and the number of well records that exist. But it could be better. We want the most accurate maps possible when suggesting people place extra casing in water wells in those areas. We don t want to cause people to spend money they don t have to, or miss areas that need protection!

37 Improving Accuracy of Maps of Potential Contamination Zones Using Historical Aerial Photographs OCC is going to copy ACOG s original study, in which they outlined brine spills on historical aerial photographs Since 2007, OCC has been collecting, digitizing, and georectifying historical aerial photographs from around the state. We currently have over 100,000 photographs For more information on this project: ADP%20newsletter% %20update.pdf (pictured on right)

 by design. We rectify oilfield counties first.")
38 Limited Project Range Obviously, we can only outline brine patches in areas for which we have historical aerial coverage. Our aerial coverage matches up fairly well to old oilfields (not so much gas, unfortunately) by design. We rectify oilfield counties first. Oil Gas Combination
39 Making the Georeferenced Extent Maps Started off pulling all georectified county-year.jpgs directly into ArcMap and creating a historical aerial photographs extent shapefile by outlining them by hand like the first HDO maps. Recognizing a pattern, did some research Learned about raster catalogs and wireframes! Pastels show what we have georectified. Reds are county-years whose georectification is in progress.

40 Extending the Project s Range with OKMAPS OCC has given all of our 100,000 historical aerial photographs to the Conservation Commission FTP site Data viewer, OKMAPS FREE PUBLIC DOWNLOAD. Hope: Crowdsource georectification of the aerial photographs We request that anyone who georectifies photographs from this source return them to Madeline Dillner at the Corporation Commission, so they can be added to our collection and OKMAPS University GIS classes could be powerful crowdsourcing partners.
41 In Conclusion 1. Oilfield brine is a common and persistent problem in Oklahoma due to extensive historic oil and gas exploration and production activity. 2. Brine patches can be identified in historical aerial photographs as asymmetrical white smears brine pits will be rectangular. 3. It is possible to make shapefile of where contamination is more likely to occur. This method is fast and gives people a general idea of where they need to be careful when drilling water wells or at least gives them the idea that they should be careful. It also gives governmental bodies a better idea of what areas in their jurisdiction may be most in need of environmental cleanup. 4. Crowdsourcing the georectification of the state s historical aerial photographs will allow the method of outlining brine patches on aerial photographs used in ACOG s West Edmond Oilfield Study to be applied across the state. 5. Knowing where brine contamination is across the state and requiring deeper cement casing on water wells in those areas will help protect Oklahoma s valuable groundwater resources from being contaminated with oilfield brine via the gravel-pack of water wells.

 234-2264 Contact:")

42 Questions? John Harrington (405) Contact: Madeline Dillner (405) Pictured: Area around Altus Dam, 1984
Preventing New Groundwater Pollution Problems from Old Oilfield Areas. Oklahoma Corporation Commission
 Preventing New Groundwater Pollution Problems from Old Oilfield Areas Patricia Billingsley, Brownfields Manager, Oklahoma Corporation Commission Last year I presented a case study about subdivision water
Old Oilfields vs. New Homes, Wells Case Studies, Proposed Solutions
 Old Oilfields vs. New Homes, Wells Case Studies, Proposed Solutions Patricia Billingsley, Brownfields Manager, Oklahoma Corporation Commission John Harrington, Director of Water Resources, Association
Introducing GIS analysis
 1 Introducing GIS analysis GIS analysis lets you see patterns and relationships in your geographic data. The results of your analysis will give you insight into a place, help you focus your actions, or
Chapter 6. Fundamentals of GIS-Based Data Analysis for Decision Support. Table 6.1. Spatial Data Transformations by Geospatial Data Types
 Chapter 6 Fundamentals of GIS-Based Data Analysis for Decision Support FROM: Points Lines Polygons Fields Table 6.1. Spatial Data Transformations by Geospatial Data Types TO: Points Lines Polygons Fields
Frequently Asked Questions about MnDOT s Railroad Map Conversion Project
 Frequently Asked Questions about MnDOT s Railroad Map Conversion Project What were the main objectives of the project? What are the results and end products? What can these railroad maps be used for? Who
Lab Topographic Maps. Name: Partner: Purpose. Background Information
 Lab Topographic Maps Name: Partner: Purpose The purpose of this lab is to familiarize you with graphic representations of the Earth s surface primarily maps. Simple line maps show the spatial relationship
COGCC Interim Policy for APDs. Tutorial December 2008
 COGCC Interim Policy for APDs Tutorial December 2008 Purpose of Interim Policy and Interim Policy Period The Interim Policy was requested by the Commission to gather data on the number of permits filed
Midterm Exam : Answer
 Midterm Exam : Answer Create a double-spaced document with answers to the questions below. File Name: LASTNAME_Midterm.pdf Make sure to include your Name, UWNetID, course number, quarter and year, and
Welcome to NR502 GIS Applications in Natural Resources. You can take this course for 1 or 2 credits. There is also an option for 3 credits.
 Welcome to NR502 GIS Applications in Natural Resources. You can take this course for 1 or 2 credits. There is also an option for 3 credits. The 1st credit consists of a series of readings, demonstration,
OKLAHOMA CORPORATION COMMISSION OIL & GAS CONSERVATION DIVISION P.O. BOX OKLAHOMA CITY, OK (Rule 165:10-3-1) PERMIT TO DRILL
 PERMIT TO DRILL") API NUMBER: 039 Horizontal Hole 22504 Oil & Gas OKLAHOMA CORPORATION COMMISSION OIL & GAS CONSERVATION DIVISION P.O. BOX 52000 OKLAHOMA CITY, OK 73152-2000 (Rule 165:10-3-1) Approval Date: 06/05/2017 Expiration
API NUMBER: 039 Horizontal Hole 22504 Oil & Gas OKLAHOMA CORPORATION COMMISSION OIL & GAS CONSERVATION DIVISION P.O. BOX 52000 OKLAHOMA CITY, OK 73152-2000 (Rule 165:10-3-1) Approval Date: 06/05/2017 Expiration
The Geodatabase Working with Spatial Analyst. Calculating Elevation and Slope Values for Forested Roads, Streams, and Stands.
 GIS LAB 7 The Geodatabase Working with Spatial Analyst. Calculating Elevation and Slope Values for Forested Roads, Streams, and Stands. This lab will ask you to work with the Spatial Analyst extension.
Electromagnetic Imaging (EMI) Representative Project Summaries
 Representative Project Summaries") Electromagnetic Imaging (EMI) Representative Project Summaries A Cost-Effective Tool for Site Characterization Marcellus Shale Water Group, LLC State College, PA Houston, TX Austin, TX Scanning the brain,
Electromagnetic Imaging (EMI) Representative Project Summaries A Cost-Effective Tool for Site Characterization Marcellus Shale Water Group, LLC State College, PA Houston, TX Austin, TX Scanning the brain,
Critical Area Mapping Update Project St. Mary s County Town Hall April 8th, :30 p.m.
 Critical Area Mapping Update Project St. Mary s County Town Hall April 8th, 2019 6:30 p.m. Critical Area Commission for the Chesapeake and Atlantic Coastal Bays St. Mary s County What Is the Critical Area
Introduction to Geographic Information Systems
 Introduction to Geographic Information Systems Lynn_Carlson@brown.edu 401-863-9917 The Environmental And Remote TecHnologies Lab MacMillan Hall, Room 105 http://www.brown.edu/research/earthlab/ Outline
GIS Lecture 5: Spatial Data
 GIS Lecture 5: Spatial Data GIS 1 Outline Vector Data Formats Raster Data Formats Map Projections Coordinate Systems US Census geographic files US Census data files GIS Data Sources GIS 2 Vector Data Formats
GIS CONCEPTS ARCGIS METHODS AND. 3 rd Edition, July David M. Theobald, Ph.D. Warner College of Natural Resources Colorado State University
 GIS CONCEPTS AND ARCGIS METHODS 3 rd Edition, July 2007 David M. Theobald, Ph.D. Warner College of Natural Resources Colorado State University Copyright Copyright 2007 by David M. Theobald. All rights
Urbanization factors in the Gilleland Creek watershed, Travis County, Texas. Michael Kanarek GEO386G Final Project Dec. 2, 2011
 Urbanization factors in the Gilleland Creek watershed, Travis County, Texas Michael Kanarek GEO386G Final Project Dec. 2, 2011 1 Introduction The watershed of Gilleland Creek, which flows through eastern
Geographic Information Systems. Introduction to Data and Data Sources
 Geographic Information Systems Introduction to Data and Data Sources Presented by John Showler, NJDA-SSCC NJ SCD GIS Training Session December 10, 209 The Objectives of this session are 3-fold: 1. Introduce
The Looming Threat of Rising Sea Levels to the Florida Keys
 The Looming Threat of Rising Sea Levels to the Florida Keys 1. Introduction Sea levels are rising, and possibly faster than we thought before. In a recent report in 2017 by the National Oceanic and Atmospheric
Introduction-Overview. Why use a GIS? What can a GIS do? Spatial (coordinate) data model Relational (tabular) data model
 data model Relational (tabular) data model") Introduction-Overview Why use a GIS? What can a GIS do? How does a GIS work? GIS definitions Spatial (coordinate) data model Relational (tabular) data model intro_gis.ppt 1 Why use a GIS? An extension
Introduction-Overview Why use a GIS? What can a GIS do? How does a GIS work? GIS definitions Spatial (coordinate) data model Relational (tabular) data model intro_gis.ppt 1 Why use a GIS? An extension
UNIT 1C. USING TOPOGRAPHIC MAPS WHERE IN THE WORLD... ARE YOU?
 UNIT 1C. USING TOPOGRAPHIC MAPS WHERE IN THE WORLD... ARE YOU? TIME 60-90 minutes LEVEL All BENCHMARKS Next Generation Science Standards MS-LS1.D Science & Engineering Practices Developing and Using Models
GIS Semester Project Working With Water Well Data in Irion County, Texas
 GIS Semester Project Working With Water Well Data in Irion County, Texas Grant Hawkins Question for the Project Upon picking a random point in Irion county, Texas, to what depth would I have to drill a
Acknowledgments xiii Preface xv. GIS Tutorial 1 Introducing GIS and health applications 1. What is GIS? 2
 Acknowledgments xiii Preface xv GIS Tutorial 1 Introducing GIS and health applications 1 What is GIS? 2 Spatial data 2 Digital map infrastructure 4 Unique capabilities of GIS 5 Installing ArcView and the
Modeling the Interconnection between Surface and Groundwater
 Modeling the Interconnection between Surface and Groundwater Andrew Warnock- GetWet, Colorado State University GetWet.Colostate.edu Three Explorations 1. Model two fundamentally different types of streams.
Mapping Your Land and Introduction to Web Soil Survey. Elizabeth Cook GIS Specialist USDA-NRCS (retired)
") Mapping Your Land and Introduction to Web Soil Survey Elizabeth Cook GIS Specialist USDA-NRCS (retired) Using Geographic Information Systems (GIS), Global Positioning System (GPS), digital aerial photography
Mapping Your Land and Introduction to Web Soil Survey Elizabeth Cook GIS Specialist USDA-NRCS (retired) Using Geographic Information Systems (GIS), Global Positioning System (GPS), digital aerial photography
GEO 105 Oil and Gas Exploration Project
 GEO 105 Oil and Gas Exploration Project Modified from: Friedman, G.M., Johnson, K.G., 1982, Exercises in Sedimentology, John Wiley, p. 208 (via Reames and Carrigan at Olivet University) Student Learning
What is fracking? An information flipbook on shale and tight gas drilling and fracking
 What is fracking? An information flipbook on shale and tight gas drilling and fracking Gas drilling, Queensland What is Fracking? Fracking is a new way of getting gas out of the ground by cracking the
How to Create Stream Networks using DEM and TauDEM
 How to Create Stream Networks using DEM and TauDEM Take note: These procedures do not describe all steps. Knowledge of ArcGIS, DEMs, and TauDEM is required. TauDEM software ( http://hydrology.neng.usu.edu/taudem/
Digital Tax Maps Westport Island Project Summary
 Digital Tax Maps Westport Island Project Summary Presented to the: Mid-Coast Regional Planning Commission Creating GIS-Based Digital Tax Maps And Linked Assessment Records For Small Towns on a Budget Dennis
Popular Mechanics, 1954
 Introduction to GIS Popular Mechanics, 1954 1986 $2,599 1 MB of RAM 2017, $750, 128 GB memory, 2 GB of RAM Computing power has increased exponentially over the past 30 years, Allowing the existence of
Outline. Chapter 1. A history of products. What is ArcGIS? What is GIS? Some GIS applications Introducing the ArcGIS products How does GIS work?
 Outline Chapter 1 Introducing ArcGIS What is GIS? Some GIS applications Introducing the ArcGIS products How does GIS work? Basic data formats The ArcCatalog interface 1-1 1-2 A history of products Arc/Info
Learning ArcGIS: Introduction to ArcCatalog 10.1
 Learning ArcGIS: Introduction to ArcCatalog 10.1 Estimated Time: 1 Hour Information systems help us to manage what we know by making it easier to organize, access, manipulate, and apply knowledge to the
IDENTIFYING THE TYPE OF COORDINATE SYSTEM FOR DATA USING ARCMAP
 CHAPTER 1 IDENTIFYING THE TYPE OF COORDINATE SYSTEM FOR DATA USING ARCMAP I got a parcel shapefile from the county, but it doesn t line up with my other data in ArcMap. My boss told me to make a map using
Analysis of Change in Land Use around Future Core Transit Corridors: Austin, TX, Eric Porter May 3, 2012
 Analysis of Change in Land Use around Future Core Transit Corridors: Austin, TX, 1990-2006 PROBLEM DEFINITION Eric Porter May 3, 2012 This study examines the change in land use from 1990 to 2006 in the
Hennepin GIS. Tree Planting Priority Areas - Analysis Methodology. GIS Services April 2018 GOAL:
 Hennepin GIS GIS Services April 2018 Tree Planting Priority Areas - Analysis Methodology GOAL: To create a GIS data layer that will aid Hennepin County Environment & Energy staff in determining where to
Office of Geographic Information Systems
 Office of Geographic Information Systems Print this Page Spring 2008 - Desktop GIS: Collecting Features from Orthos By Joe Sapletal, GISP Keeping up with the growth of our area over the last ten years
Location Suitability Analysis
 2010 Fall 406 Final Project Location Suitability Analysis New Burger stores in San Fernando Valley Presenter: Rich Lee I. Introduction In-N-Out Burger is famous in South West America. Established in 1948
User Guide: RADON POTENTIAL DATASET - England and Wales
 User Guide: RADON POTENTIAL DATASET - England and Wales This document provides information for users of the joint HPA-BGS RADON POTENTIAL DATASET for England and Wales. 1. Background to joint Health Protection
OKLAHOMA CORPORATION COMMISSION OIL & GAS CONSERVATION DIVISION P.O. BOX OKLAHOMA CITY, OK (Rule 165:10-3-1) PERMIT TO DRILL
 PERMIT TO DRILL") API NUMBER: 039 Horizontal Hole 22513 Oil & Gas OKLAHOMA CORPORATION COMMISSION OIL & GAS CONSERVATION DIVISION P.O. BOX 52000 OKLAHOMA CITY, OK 73152-2000 (Rule 165:10-3-1) Approval Date: 08/11/2017 Expiration
API NUMBER: 039 Horizontal Hole 22513 Oil & Gas OKLAHOMA CORPORATION COMMISSION OIL & GAS CONSERVATION DIVISION P.O. BOX 52000 OKLAHOMA CITY, OK 73152-2000 (Rule 165:10-3-1) Approval Date: 08/11/2017 Expiration
Summary of Legal Descriptions
 Perimeter Descriptions Bounds Descriptions - perimeter descriptions without a direction of travel. Metes Descriptions - perimeter descriptions with a direction of travel described by a series of measurements.
AN ARCHAEOLOGICAL SURVEY FOR THE DCP MIDSTREAM THREE RIVERS PLANT TO CGP 51 PROJECT IN LIVE OAK COUNTY, TEXAS
 AN ARCHAEOLOGICAL SURVEY FOR THE DCP MIDSTREAM THREE RIVERS PLANT TO CGP 51 PROJECT IN LIVE OAK COUNTY, TEXAS By William E. Moore Brazos Valley Research Associates Contract Report Number 251 2011 AN ARCHAEOLOGICAL
Lecture 1 Introduction to GIS. Dr. Zhang Spring, 2017
 Lecture 1 Introduction to GIS Dr. Zhang Spring, 2017 Topics of the course Using and making maps Navigating GIS Map design Working with spatial data Geoprocessing Spatial data infrastructure Digitizing
Lecture 9: Reference Maps & Aerial Photography
 Lecture 9: Reference Maps & Aerial Photography I. Overview of Reference and Topographic Maps There are two basic types of maps? Reference Maps - General purpose maps & Thematic Maps - maps made for a specific
Techniques for Science Teachers: Using GIS in Science Classrooms.
 Techniques for Science Teachers: Using GIS in Science Classrooms. After ESRI, 2008 GIS A Geographic Information System A collection of computer hardware, software, and geographic data used together for
GIS Monroe Geographic Information System March 14, 2018
 GIS Monroe Geographic Information System March 14, 2018 Goals Maintain Enterprise/County-wide geo-database Increase spatial accuracy of data Build and acquire more data layers Increase use of GIS; as another
Use of Non-Invasive Near-Surface Geophysics for Managing Brine Releases
 Use of Non-Invasive Near-Surface Geophysics for Managing Brine Releases Presented by: Brent W. Barker, Staff Geophysicist Remediation Technologies Symposium 2012 Imagine the result Co-Authors Boyce L.
Georeferencing the Lackawanna Synclinorium using GIS
 Georeferencing the Lackawanna Synclinorium using GIS Conservation Services, LLC 2/20/2010 Contact: Philip Pass 570.510.1758 Rick Marquardt 570-335-7525 Managing Partners: Conservation Services LLC Author:
GIS CONCEPTS ARCGIS METHODS AND. 2 nd Edition, July David M. Theobald, Ph.D. Natural Resource Ecology Laboratory Colorado State University
 GIS CONCEPTS AND ARCGIS METHODS 2 nd Edition, July 2005 David M. Theobald, Ph.D. Natural Resource Ecology Laboratory Colorado State University Copyright Copyright 2005 by David M. Theobald. All rights
Providing Public Access to King County GIS Data. Presented by: Michael Jenkins King County GIS Center Seattle, WA
 Providing Public Access to King County GIS Data Presented by: Michael Jenkins King County GIS Center Seattle, WA King County, Washington Microsoft Boeing Amazon.Com Starbucks Port of Seattle Weyerhauser
USING GIS TO MODEL AND ANALYZE HISTORICAL FLOODING OF THE GUADALUPE RIVER NEAR NEW BRAUNFELS, TEXAS
 USING GIS TO MODEL AND ANALYZE HISTORICAL FLOODING OF THE GUADALUPE RIVER NEAR NEW BRAUNFELS, TEXAS ASHLEY EVANS While the state of Texas is well-known for flooding, the Guadalupe River Basin is one of
Lauren Jacob May 6, Tectonics of the Northern Menderes Massif: The Simav Detachment and its relationship to three granite plutons
 Lauren Jacob May 6, 2010 Tectonics of the Northern Menderes Massif: The Simav Detachment and its relationship to three granite plutons I. Introduction: Purpose: While reading through the literature regarding
 Boone County GIS has the right to inquire about and investigate the use of any requested products and deny access to anyone based on concerns relating to privacy, security, public health, public safety,
Mapping the Badlands. Surveying and GIS Just Got Easier. >> By Deral Paulk, LS
 $4.95 Mapping the Badlands Surveying and GIS Just Got Easier Surveying and mapping here in southwestern Oklahoma can be a challenge. It s a rough-hewn landscape with rugged terrain features and plenty
NR402 GIS Applications in Natural Resources
 NR402 GIS Applications in Natural Resources Lesson 1 Introduction to GIS Eva Strand, University of Idaho Map of the Pacific Northwest from http://www.or.blm.gov/gis/ Welcome to NR402 GIS Applications in
Flood Hazard Zone Modeling for Regulation Development
 Flood Hazard Zone Modeling for Regulation Development By Greg Lang and Jared Erickson Pierce County GIS June 2003 Abstract The desire to blend current digital information with government permitting procedures,
Faculty Disclosures Center for Health Research / Loma Linda University Pramil N. Singh, Dr.PH. No relevant commercial interests.
 Faculty Disclosures Center for Health Research / Loma Linda University Pramil N. Singh, Dr.PH No relevant commercial interests. Geographic Information Systems for Health Care Research, Practice, and Management
Phase One Development of a Comprehensive GIS for the Mentor Marsh and its Proximal Watershed
 FINAL REPORT Phase One Development of a Comprehensive GIS for the Mentor Marsh and its Proximal Watershed Lake Erie Protection Fund SG 120-99 Ohio State University Research Foundation RF 738027 December
NR402 GIS Applications in Natural Resources. Lesson 9: Scale and Accuracy
 NR402 GIS Applications in Natural Resources Lesson 9: Scale and Accuracy 1 Map scale Map scale specifies the amount of reduction between the real world and the map The map scale specifies how much the
Lab#8: Working With Geodatabases. create a geodatabase with feature datasets, tables, raster datasets, and raster catalogs
 Lab#8: Geodatabase Concepts Page#1 of 25 In this lab, you will learn how to: Lab#8: Working With Geodatabases create a geodatabase with feature datasets, tables, raster datasets, and raster catalogs join
1. Which agency in your state is PRIMARILY responsible for archiving geospatial data and managing archived geo records? (choose one) nmlkj.
 nmlkj.") Survey Intro Kentucky, North Carolina, and Utah are partnering with the Library of Congress as part of the National Digital Information Infrastructure and Preservation Program (NDIIPP) to examine the current
Survey Intro Kentucky, North Carolina, and Utah are partnering with the Library of Congress as part of the National Digital Information Infrastructure and Preservation Program (NDIIPP) to examine the current
Enhancing Parcel Data In Colleton County. February 10, 2009
 Enhancing Parcel Data In Colleton County GIS & CAMA Conference February 10, 2009 Introductions Bruce T. Harper Technology Director Colleton County, SC Bill Wetzel National GIS Account Manager The Sidwell
In this exercise we will learn how to use the analysis tools in ArcGIS with vector and raster data to further examine potential building sites.
 GIS Level 2 In the Introduction to GIS workshop we filtered data and visually examined it to determine where to potentially build a new mixed use facility. In order to get a low interest loan, the building
Name NRS 509 Exam I. Right Map
 Read every question carefully. You may use a calculator if you wish. Conversion tables are provided at the end of the exam. If you have any questions, raise your hand. Be sure to show your work on computational
Unit 1, Lesson 2. What is geographic inquiry?
 What is geographic inquiry? Unit 1, Lesson 2 Understanding the way in which social scientists investigate problems will help you conduct your own investigations about problems or issues facing your community
Laboratory Exercise Possible Zara Locations in Utah
 Brigham Young University BYU ScholarsArchive Engineering Applications of GIS - Laboratory Exercises Civil and Environmental Engineering 2017 Laboratory Exercise Possible Zara Locations in Utah Garlick
Analyzing Suitability of Land for Affordable Housing
 Analyzing Suitability of Land for Affordable Housing Vern C. Svatos Jarrod S. Doucette Abstract: This paper explains the use of a geographic information system (GIS) to distinguish areas that might have
Mapping Earth. How are Earth s surface features measured and modeled?
 Name Mapping Earth How are Earth s surface features measured and modeled? Before You Read Before you read the chapter, think about what you know about maps Record your thoughts in the first column Pair
LAB N - FLUVIAL PROCESSES AND LANDSCAPES
 LAB N - FLUVIAL PROCESSES AND LANDSCAPES Introduction The objective of this lab is to familiarize the student with the work of running water (streams and rivers) and the landforms that they create. Materials
EOS 102: Dynamic Oceans Exercise 1: Navigating Planet Earth
 EOS 102: Dynamic Oceans Exercise 1: Navigating Planet Earth YOU MUST READ THROUGH THIS CAREFULLY! This exercise is designed to familiarize yourself with Google Earth and some of its basic functions while
Western Kentucky CO 2 Storage Test
 Western Kentucky CO 2 Storage Test Principal Investigators: Rick Bowersox - Lexington Dave Williams - Henderson KGS First Friday Seminar Lexington, Kentucky March 4, 2011 The project proceeded in two phases:
What Do You See? FOR 274: Forest Measurements and Inventory. Area Determination: Frequency and Cover
 What Do You See? Message of the Day: Many options exist to determine the size, area, or extent of a feature on a landscape FOR 274: Forest Measurements and Inventory Lecture 7: Measures of Land Area Frequency
BEFORE THE CORPORATION COMMISSION OF THE STATE OF OKLAHOMA
 BEFORE THE CORPORATION COMMISSION OF THE STATE OF OKLAHOMA APPLICANT: CONTINENTAL RESOURCES, INC. CAUSE CD NO. RELIEF SOUGHT: MULTIUNIT HORIZONTAL WELL 201208449 LANDS COVERED: SECTION 16, TOWNSHIP 7 NORTH,
GIS Lecture 4: Data. GIS Tutorial, Third Edition GIS 1
 GIS Lecture 4: Data GIS 1 Outline Data Types, Tables, and Formats Geodatabase Tabular Joins Spatial Joins Field Calculator ArcCatalog Functions GIS 2 Data Types, Tables, Formats GIS 3 Directly Loadable
Chapter 3 Geographic Location Systems
 Chapter 3 Geographic Location Systems In this chapter you will learn about: Latitude and longitude Universal Transverse Mercator (UTM) U.S. Public Land Survey Other geographic location systems Geographic
Display data in a map-like format so that geographic patterns and interrelationships are visible
 Vilmaliz Rodríguez Guzmán M.S. Student, Department of Geology University of Puerto Rico at Mayagüez Remote Sensing and Geographic Information Systems (GIS) Reference: James B. Campbell. Introduction to
a system for input, storage, manipulation, and output of geographic information. GIS combines software with hardware,
 Introduction to GIS Dr. Pranjit Kr. Sarma Assistant Professor Department of Geography Mangaldi College Mobile: +91 94357 04398 What is a GIS a system for input, storage, manipulation, and output of geographic
Road Scholar. Coaches Clinic
 Coaches Clinic Test Format Review of Individual Test Elements Items to Bring Tips Links General Test Format: Storyline Test Navigation Elements Identification of Landmarks, features, etc. Aerial/Satellite
Unit 1, Lesson 3 What Tools and Technologies Do Geographers Use?
 Unit 1, Lesson 3 What Tools and Technologies Do Geographers Use? Geographers use a variety of tools and technologies in investigating geographic questions. Maps and globes both represent the earth, but
ARCGIS TRAINING AT KU GIS LABS: INTRODUCTION TO GIS: EXPLORING ARCCATALOG AND ARCGIS TOOLS
 PHASE 1_4 th SESSION ARCGIS TRAINING AT KU GIS LABS: INTRODUCTION TO GIS: EXPLORING ARCCATALOG AND ARCGIS TOOLS 4 th SESSION REPORT: 30 TH JUNE - 2 ND JULY SCHOOL OF ENVIRONMENTAL STUDIES COMPUTER LAB
Coordinate Systems & Land Division
 Name Physical Geography Lab Activity #06 Due date Coordinate Systems & Land Division COR Objective 1, SLO 1,3 6.1. Introduction Latitude and longitude are great for sailing around the world, but can be
Watershed Modeling Orange County Hydrology Using GIS Data
 v. 10.0 WMS 10.0 Tutorial Watershed Modeling Orange County Hydrology Using GIS Data Learn how to delineate sub-basins and compute soil losses for Orange County (California) hydrologic modeling Objectives
A Framework for Incorporating Community Benefits Agreements into. 14 July
 A Framework for Incorporating Community Benefits Agreements into Brownfield Redevelopm ent Projects: The Case of Chelsea, Massachusetts I. Introduction to the Project 2010 ESRI User Conference 14 July
Mapping Historical Information Using GIS
 Mapping Historical Information Using GIS David Yun, GISP Troy Lawson ABSTRACT The City of San Luis Obispo, California, is rich with history. It is one of California s oldest communities that began with
Exercise 3: GIS data on the World Wide Web
 Exercise 3: GIS data on the World Wide Web These web sites are a few examples of sites that are serving free GIS data. Many other sites exist. Search in Google or other search engine to find GIS data for
Map your way to deeper insights
 Map your way to deeper insights Target, forecast and plan by geographic region Highlights Apply your data to pre-installed map templates and customize to meet your needs. Select from included map files
Illustrator: Vector base Each line/point store some sort of information Mapping Representation of the world
 Illustrator: Vector base Each line/point store some sort of information Mapping Representation of the world Photoshop Raster base Images can be overlaid Pixel vector data model: [data models] A representation
Computing error measures for migration distance estimates in historical linked data sets
 Computing error measures for migration distance estimates in historical linked data sets Rebecca Vick, Minnesota Population Center, University of Minnesota Sula Sarkar, Minnesota Population Center, University
Use of Government Land Office Surveys in Tribal GIS Land Management. Dustin Holt GIS Technician Choctaw Nation of Oklahoma
 Use of Government Land Office Surveys in Tribal GIS Land Management Dustin Holt GIS Technician Choctaw Nation of Oklahoma Ardmore Quadrangle - 1949 Different versions of the same map were printed in 1901,
SPATIAL DATA AND WEB-MAPPING APPLICATIONS OF PRODUCED WATER IN SOUTHEAST NEW MEXICO. Robert Sabie, Jr., Research Assistant.
 SPATIAL DATA AND WEB-MAPPING APPLICATIONS OF PRODUCED WATER IN SOUTHEAST NEW MEXICO By Robert Sabie, Jr., Research Assistant June 2016 New Mexico Water Resources Research Institute New Mexico State University
2. There is evidence of oil field waste discharged to an unnamed tributary to Bad Luck Creek. This is a violation of 40 CFR Part
 September 10, 2008 Bill Fowler Chesapeake Energy Corporation P.O. Box 18496 Oklahoma City, OK 73154 RE: Cooper 7-9, 2-5H, Authorization #2008953 Dear Mr. Fowler: On, September 9, 2008, Eric Fleming and
Volcanic Hazard Assessment of Southern Iceland Helper, GIS 327G
 Raeann Garcia 05/03/2018 Volcanic Hazard Assessment of Southern Iceland Helper, GIS 327G Introduction: Iceland is an island nation far in the northern hemisphere, with a portion of the country included
Reminder that we update the website: with new information, project updates, etc.
 1 Reminder that we update the website: http://www.njfishandwildlife.com/ensp/connectivity_proj.htm with new information, project updates, etc. regularly. Any suggestions are welcome on how to make the
GROUNDWATER MONITORING DATA 2016 SAMPLING EVENT HARSHAW CHEMICAL COMPANY FUSRAP SITE
 GROUNDWATER MONITORING DATA 2016 SAMPLING EVENT HARSHAW CHEMICAL COMPANY FUSRAP SITE U.S. Army Corps of Engineers Buffalo District Building Strong April 2017 ly Utilized Sites Remedial Action Program The
Lecture 5. GIS Data Capture & Editing. Tomislav Sapic GIS Technologist Faculty of Natural Resources Management Lakehead University
 Lecture 5 GIS Data Capture & Editing Tomislav Sapic GIS Technologist Faculty of Natural Resources Management Lakehead University GIS Data Input Surveying/GPS Data capture Facilitate data capture Final
NC Geospatial Data Archiving Project
 NC Geospatial Data Archiving Project 1. Frequency of Capture of Geospatial Data We seek your advice and experience in creating geospatial data snapshots for your archives -- versions of vector data and
BEFORE THE CORPORATION COMMISSION OF THE STATE OF OKLAHOMA CAUSE CD NO. APPLICANT: CONTINENTAL RESOURCES, INC.
 BEFORE THE CORPORATION COMMISSION OF THE STATE OF OKLAHOMA APPLICANT: CONTINENTAL RESOURCES, INC. CAUSE CD NO. RELIEF SOUGHT: MULTIUNIT HORIZONTAL WELL 201601055 LANDS COVERED: SECTIONS 33 AND 28, TOWNSHIP
Presented by: Bryan Bloch GIS Specialist DNREC Division of Watershed Stewardship
 Presented by: Bryan Bloch GIS Specialist DNREC Division of Watershed Stewardship Bryan Hall, AICP Sussex County Circuit Rider Planner, Office of State Planning Coordination, OMB November 19, 2012 UD Sustainable
GEOGRAPHIC INFORMATION SYSTEMS
 GEOGRAPHIC INFORMATION SYSTEMS 4-H Round-Up Community Transitions Workshop Daniel Hanselka June 14, 2011 Goals of the Workshop Answer the question: What is GIS? Uses of GIS. Some of the Common Terminology
PALS: Neighborhood Identification, City of Frederick, Maryland. David Boston Razia Choudhry Chris Davis Under the supervision of Chao Liu
 PALS: Neighborhood Identification, City of Frederick, Maryland David Boston Razia Choudhry Chris Davis Under the supervision of Chao Liu University of Maryland School of Architecture, Planning & Preservation
Aerial Photograph-Based Pavement Surface Distress Detection and Evaluation
 Aerial Photograph-Based Pavement Surface Distress Detection and Evaluation César Hernández Gracia Antonio Sahuquillo Piñero AF2913-Road Construction and Maintenance Table of Contents 1. Introduction 2.