SEMINAR AND EXAMINATION. MSc in Information Technology for Natural Resources Management Bogor Agricultural University
|
|
|
- Erika Cannon
- 5 years ago
- Views:
Transcription

1 SEMINAR AND EXAMINATION MSc in Information Technology for Natural Resources Management Bogor Agricultural University Name : Wen Wen Student ID : G Research Title : Wetland Change Prediction Using Markov Cellular Automata Model in Lore Lindu National Park Central Sulawesi Province, Indonesia The Advisory Board Supervisor : Dr. Yuli Suharnoto Co-Supervisor : Dr. Gatot H. Pramono External Examiner : Dr. I Wayan Astika Day / Date : Monday, January 14, 2008 Time : Place : Classroom A, MIT Building SEAMEO BIOTROP Jl. Raya Tajur Km 6, Bogor
2 WETLAND CHANGE PREDICTION USING MARKOV CELLULAR AUTOMATA MODEL IN LORE LINDU NATIONAL PARK CENTRAL SULAWESI PROVINCE, INDONESIA 1 Wen Wen 2, Yuli Suharnoto 3, Gatot H. Pramono 4, Tania June 5 Master of Science in Information Technology for Natural Resources Management Bogor Agricultural University ABSTRACT Lore Lindu National Park (LLNP) is located between East and South and administratively, located in Poso District and Donggala District, in Central Sulawesi Province, Indonesia. Topographically, Lore Lindu National Park has two enclaves: Lindu Enclave ( ha) and Besoa Enclave (5.085 ha). Lindu enclaves have high growing socio economic activities that can threaten Lore Lindu National Park as a tropical rainforest that requires the stability of rainforest margin area. If agricultural and built up area (settlement area) in Lindu enclaves is always increase every years then the water availability to support Lore Lindu National Park will decrease so the stability of rainforest becomes worst. Wetland as ecological component is important to be maintained, monitored and modeled to support the stability of rainforest margin area. Therefore, Wetland change prediction is needed to predict what will happen in the future. The objectives of this research are: 1) to identify the threatening factors affecting the wetland area in Lindu Enclave area & Lindu Lake, 2) to predict the changes of wetland area in Lindu Enclave area & Lindu Lake using Markov Cellular Automata Model. Land cover 1983 from aerial photography, Landsat TM 2002 and 2006 are used as the spatial model data. Image correction is also performed in order to acquire well ground spatial estimation. Afterward, markov chain is used to get rate value per years of wetland change area in Lindu area. Multicriteria evaluation for wetland area created with soil map, topography map, and land cover map as the variables for suitable wetland area criteria that will be used in cellular automata model. Finally, markov chain probability values for each class and multicriteria evaluation map is merged with cellular automata model with 3 x 3 cell neighbors analysis then spatial wetland change prediction map for 2021 can be created. The results of this research show that Lindu enclaves have two wetland types; natural wetland (marsh and bush land) and construction / man - made wetland (paddy field and fish pond). The changes of wetland area in Lindu enclave area for natural wetland (marsh) was hectares ( ) with 0.1 % annual change rate and hectares area for human made / construction wetland area (paddy field) with 1.0 % annual change rate. The suitable area for wetland was located in every enclave area, however the most suitable area was located at the Southern part of Lindu enclave area.the prediction of spatial distribution for natural wetland area in 2021 will disappear with an annual change rate of -0.1 %. However, human made wetland such as paddy field area has increased to 1, hectares in 2021 with 0.7 % annual change rate. Keyword: Lore Lindu National Park, Lindu Enclaves, Wetland, Markov Cellular Automata Model 1 The paper is a part of master thesis, submitted for seminar and examination of MIT Program 2 MIT Student, Bogor Agricultural University 3 Supervisor, Faculty of Technology Industry, Bogor Agricultural University 4 Co-Supervisor, National Mapping and Coordination Survey Agency 5 STORMA Counterpart, Faculty of Mathematics and Natural Resources, Bogor Agricultural University 2
3 1. Introduction 1.1 Background Lore Lindu National Park (LLNP) is located between East and South and administratively, located in Poso District and Donggala District, in Central Sulawesi Province, Indonesia. Topographically, Lore Lindu National Park has two enclaves: Lindu Enclave ( ha) and Besoa Enclave (5.085 ha). Lindu enclaves have high growing socio economic activities that can threaten Lore Lindu National Park as a tropical rainforest that requires the stability of rainforest margin area. If agricultural and built up area (settlement area) in Lindu enclaves is always increase every years then the water availability to support Lore Lindu National Park will decrease so the stability of rainforest becomes worst. Wetland as ecological component is important to be maintained, monitored and modeled to support the stability of rainforest margin area. Therefore, Wetland change prediction is needed to predict the changes in the future using Markov Cellular Automata Model. 1.2 Objectives The main objectives of this research are as follows: To identify the threatening factors affecting the wetland area in Lindu Enclave area & Lindu Lake To predict the changes of wetland area in Lindu Enclave area & Lindu Lake using Markov Cellular Automata Model 1.3 Research Questions Where are the spatial distributions of the wetland area in 1983 and 2002 classification map? How big the changes occurred to the wetland area in Lindu Enclaves & Lindu Lake from 1983 until 2002? Where are the suitable wetland community areas in Lindu Enclaves? Where are the predicted spatial distributions of wetland area in 2021 and how big the rate of the changes will occur from 2002 until 2021 in Lindu Enclaves? 2. Literature Review 2.1 Wetland Definition of Wetland Wetland definition given by (Cowardin 1979) meets lands transitional between terrestrial and aquatic systems where the water table is usually at or near the surface or the land is covered by shallow water. This definition includes a higher range of possible habitats than other classification systems that use with two basic criteria: vegetation and soil. The following figure 1 is the natural wetland area (marsh) in Lindu Enclaves area. 3

4 Figure 1 Wetland area (marsh type) in Lore Lindu Enclaves Types of Wetland In trying to categorize the wide range of wetlands encompassed by the Ramsar definition, Scott (1989) defined 30 groups of natural wetlands and nine man made ones. However, for illustrative purposes it is possible to identify five broad wetland systems: Estuaries: where rivers meet the sea and salinity is intermediate between salt and freshwater (e.g., deltas, mudflats, salt marshes) Marine: not influenced by river flows (e.g., shorelines and coral reefs) Riverine: land periodically inundated by river overtopping (e.g., water meadows, flooded forests, oxbow lakes) Palustrine: where there is more or less permanent water (e.g., papyrus swamp, marshes, and fen) Lacustrine: areas of permanent water with little flow (e.g., ponds, kettle lakes, volcanic crater lakes) Wetlands are dynamic ecosystems which are defined by federal regulating agencies as possessing three essential characteristics: (1) hydrophytic vegetation, (2) hydric soils, and (3) wetland hydrology, which are the driving force creating all wetlands (Federal Interagency Committee for Wetland Delineation, 1989). Under most circumstances, at least one positive field indicator of each parameter will be apparent at any given wetland. In the following section, each of these parameters will be examined individually. 2.2 Wetland Vegetation The vegetation criterion in wetland definitions requires an area to have over 50 percent of its dominant species classified within a broad range of wetland plants (Washington State Wetlands and Delineation Manual, 1997). 2.3 Wetland Soils Hydric soils are saturated, flooded or ponded long enough during the growing season to develop anaerobic conditions in the upper part. In just a few days to a week, flooding of soil causes a rapid depletion of oxygen and the onset of an anaerobic environment. The diffusion of dissolved oxygen in waterlogged soils is 10,000 times slower than in unflooded soils. If oxygen does make its way into a flooded soil, it is rapidly used by microbes that can use either oxygen or oxidized soil components to support their respiration. 4
5 2.4 Wetland Hydrology Wetland hydrology refers to conditions of permanent or periodic inundation, or soil saturation to the surface where hydrology conditions are the driving forces behind wetland formation. Numerous factors influence the wetness of an area, including precipitation, stratigraphy, topography, soil permeability, and plant cover (Federal Interagency Committee for Wetland Delineation, 1989). 2.5 Wetland Delineation Using Remote Sensing and Geographic Information System Remote Sensing is defined as the science and technology by which the characteristics of objects of interest can be identified, measured or analyzed the characteristics without direct contact (Hashimoto et al., 1993). Moreover, Geographic Information System (GIS) is defined as a powerful set of tools for collecting, storing, retrieving at will, transforming and displaying spatial data from the real world (Burrough, 1986). Based on these two definitions, remote sensing technology and GIS are expected to provide efficient tools for monitoring wetland environment with spatial approach and computer system. 2.6 Markov Chain A Markovian process is one in which the state of a system at time 2 can be predicted by the state of the system at time 1 given as matrix of transition probabilities from each cover class to every other cover class (Eastman 2003). 2.7 Cellular Automata Model Cellular Automata are dynamic models which operate in raster data spaces. States within the raster space can be defined as binary (for example, alive/dead), or as discrete, multilevel. Cellular automata are dynamic systems whose behavior is completely specified by local relationships (Toffoli and Margolus, 1987). The characteristic of cellular automata model is described with the five (5) characters (Sirakoulis et al., 2000): How many the spatial dimension (n) Width / distance for each side from a cell composition (w). Wj is the width from side to j from a cell composition, where j = 1, 2, 3,..n (total of the cells) j Width from the closest neigbour cell (d). dj is the closest neigbour distance along j side from j cell compostion. Each cell condition of cellular automata Cellular automata rule, as the arbitrary function F Cell X condition, at time t = 1, is calculated based on F. F is the function from cell X condition at time (t) and the condition of surrounding cells at time (t) is known with rule as the change transition. The simple description from the two dimension cellular automata (n = 2), with the nearest neighbored distance d1 = 3 and d2 = 3, as the follow (figure 2) i 1, j - 1 i 1, j i 1, j + 1 i, j - 1 (i,j) (i, j + 1) i + 1, j - 1 i + 1, j i + 1, j + 1 Figure 2 The nearest neighbored from cell (i,j) is formed from cell (i,j) itself and eight (8) cell at it the adjacent (Sirakoulis et al., 2000). 5
6 3. Methodology 3.1 Time and Study Area The research was conducted from March until August The study area is located in the surrounding of Lore Lindu Lake (0 50 S 2 04 S and E E) in the North part of Lore Lindu National Park, Central Sulawesi, Indonesia. Specifically, the study area is in Kulawi Sub District and Donggala District. There are four (4) surrounding villages bordering the study area namely Puroo, Langko, Tomado and Anca. The following figure 3 is the map of the study area, it shows the research area boundaries, roads, rivers, and the location of the villages. Figure 3 Study Area Map 3.2 Types of Data and Sources Table 1 Types of data and sources Data type 1. Digital Data Landsat 7 ETM+ path/row 114/61 Acquisition and Data source 28 Sept 2002 & 21 July 2006, USGS Description Multispectral image six (6) bands (visible, IR, middle-ir, far-ir) with spatial resolution 30 m, thermal image two (2) bands (band61 and band62) with spatial resolution 60 m 6
7 Land use/ land cover map scale 1 : Digital Elevation Model Topography map sheet , scale 1 : Soil map scale 1 : , National Mapping and Coordination Survey Agency. 2000, Shuttle Radar Topography Mission 1983, National Mapping and Coordination Survey Agency. Balai Besar Litbang Sumberdaya Lahan Pertanian and panchromatic image one (1) band with spatial resolution 15 m. Derived from Aerial Photographic 1983 Digital elevation data obtained from X/C bands, SRTM sensor, spatial resolution 90 m. 3.3 Hardware and Software The supporting tools in terms of software and hardware used include: a. Software GRASS (Geographic Resource Analysis Support System) is free open source software for image processing, GIS work, and spatial analysis (spatial model pre-processing). Idrisi Kilimanjaro V.14 is used for spatial model processing and spatial model validation. b. Hardware Notebook Centrino 1.7 MHz 256 MB RAM, Global Positioning System (GPS) for field work Printer for printing writing proposal, report, photo, and map 3.4 Methods The following Figure 4 illustrates the general framework and specific flowchart to explain the objectives and the research questions. 7
8 Problem Identification & Objectives Literature Review Field Work Data Collection Spatial Data Spatial Model Pre-Processing (Image Restoration & Classification) Spatial Model Processing (Markov Chain Analysis, Multi Criteria Evaluation, Cellular Automata Model) Spatial Model Validation (Kappa Statistic Value) Analysis Result Figure 4 General Research Methodology 8
9 Lindu Enclave area & Lindu Lake Landsat 2002 Landsat 2006 Radiometric Correction - Sensor Calibration - Dark Pixel Correction RBI Map derived from aerial photography 1983 Geometric Correction Training Area - Image Registration & Rectification Collect GCP Field Work No Image Supervised Classification Maximum Likelihood Accuracy assessment Yes Wetland Classification Map 2002 & 2006 Figure 5 Wetland Classification Maps Process (Image Pre-processing) 9
10 3.4.1 Markov Chain Analysis The general procedure of using Markov Chain Analysis for wetland area can be seen from the following flowchart (Figure 6). Wetland types Image classification For 1983 Wetland types Image classification For 2002 Transition Matrix Trend / Prediction Figure 6 Markov Chain Analyses Table 2 Transition Matrix of wetland area for 1983 until sum sum 2002 Table 3 Transition Probability Matrix of wetland area for 1983 until Multi Criteria Evaluation (MCE) Multi-Criteria Evaluation is concerned with how to combine the information from several criteria to form a single index of evaluation (Eastman 2003). A weight linear 10
11 combination is used to obtain suitability map for wetland area, the factors are combined by applying a weight to each followed by a summation of the results to yield a suitability map. S = Σ Wi Xi (Voogd, 1983). (1) Where S = suitability Wi = weight of factor i Xi = criterion score of factor i Based on this equation, the suitability map for wetland area was developed using several parameters for wetland area that are; topography map (slope map), soil map for wetland area, and the probability of land cover map for wetland area. S = X1 + X2 + X (2) Where S = suitability area for wetland X1 = Slope map derived from Digital Elevation Model (DEM) X2 = Soil map X3 = Land cover map for wetland area from 1983 until 2002 derived from Landsat image Cellular Automata Model The first step is the wetland area classification map derived from aerial photography 1983 which will be predicted until 2002, and then the result of prediction map for 2002 is validated using wetland classification map The second step is to predict again from 1983 until 2006 and is validated using wetland classification map 2006 after it has fulfilled the standard Kappa Index then wetland prediction model is created for Kappa index is used to check the results whether the model is true or not (usually the Kappa Index for the standard agreement is > 70 %). If the model has the Kappa Index less then 70 % then the suitability map for the wetland area should be repeated again based on several considerations, otherwise, if the model result is more than > 70 % then the last step is to create the spatial model for 2021.The following figure 7 is the markov cellular automata model for wetland change prediction area. Classification Wetland area 1983 Suitable area for Wetland based on MCE Markov Probability Markov and Cellular Automata simulation No KAPPA Validation < 70% Wetland change prediction map 2002 Validation Classification Wetland area 2002 Yes KAPPA Validation > 70% No Wetland change prediction map for 2006 Validation KAPPA Validation < 70% Classification Wetland area 2006 Wetland change prediction map for 2021 Yes KAPPA Validation > 70% Figure 7 Cellular Automata Model 11

12 4. Result and Discussion 4.1 Wetland in Lindu Enclaves Image Correction Due to atmospheric path, Landsat imageries were corrected as the atmospheric correction with dark pixel correction method. This method assumes that every dark pixel should have digital number value 0. The following figures 8a and 8b show the scatter plot that is displayed for Landsat imagery before and after atmospheric correction. (a) Before atmospheric correction (b) After atmospheric correction Figure 8 Atmospheric Correction The geo registration process was done in order to obtain good accurate image position for each class as the wetland change detection. Therefore, polynomial method was used as the geo coding type while polynomial order used linear transform. The following figures 9a, 9b and table 9 show geo registration process and RMS (Root Mean Square) error that have been done for these two imageries. (a) Land cover derived from aerial (b) Landsat TM 2002 photography 1983 Figure 9 Geo registration process 12
13 Total number of GCPs: 10 Number turned on : 10 Warp order : 1 GCP CORRECTED map projection details: Map Projection: SUTM51 Datum : WGS84 Rotation : Table 4 Root Mean Square table for geo registration process Point On Locked Cell-X Cell-Y To-X To-Y To-Z "1" Yes No "2" Yes No "3" Yes No "4" Yes No "5" Yes No "6" Yes No "7" Yes No "8" Yes No "9" Yes No "10" Yes No Average RMS error: Total RMS error: RMS error report: Warp Type - Polynomial -----ACTUAL PREDICTED--- Point Cell-X Cell-Y Cell-X Cell-Y RMS "1" "2" "3" "4" "5" "6" "7" "8" "9" "10" Based on the above tables, the RMS error for this geo registration is and the total RMS error is Analytically, it can be said that the result for this geo registration process still meets the standard geo registration process that should have minimum RMS error of 1. 13
14 4.1.2 Image Classification After geo registration process has been done, the next step is to classify the Landsat TM 2002 & Landsat TM 2006 with supervised classification. In this classification, the imagery is classified with maximum likelihood method. Training samples areas were collected based on field work ground check and minimum sample size per class is 70 pixels. The results of classification image based on maximum likelihood supervised method are displayed in the following figure 10a and 10b. a b Figure 10 Wetland Classification Maps 2002 & 2006 Table 5 Area calculation for Wetland Classification Map 2002 & 2006 Classification Class Hectares Water Body Non Wetland Area Natural Wetland Human Made Wetland (a) Wetland Classification Map 2002 Classification Class Hectares Water Body Non Wetland Area Natural Wetland Human Made Wetland (b) Wetland Classification Map 2006 On the other hand, classification map that has been obtained from aerial photography in 1983 is also portrayed in the following figure 11 and table 6 as 1983 wetland spatial distribution and area calculation. 14
15 Figure 11 Wetland Classification Map 1983 Table 6 Area calculation for Wetland Classification Map 1983 Classification Class Hectares Water Body Non Wetland Area Natural Wetland Human Made Wetland Graphic of Wetland area Calculation Area (Ha) Class Water Body Non Wetland Area Natural Wetland Human Made Wetland Figure 12 Graphic of Wetland area Calculation
16 Table 7 Area statistics for Wetland annual change rate in Lindu Enclave area Class Area 1983 (Ha) Area 2002 (Ha) Change % rel Change Annual Change Rate (%) Water Body Agriculture Marsh & Bush land Coffee Forest Paddy Field Settlement Based on the above tables and graphics, the forest area changed from 1983 until 2002: hectares to hectares or an annual change rate of 0.8 %. Natural wetland area (marsh) had also decreased from 1983 until 2002 (from hectares to hectares or an annual change rate of -0.1 %). Otherwise, settlement area has increased significantly from hectares to hectares or a significant annual change rate of 3.4 %. Agriculture has also increased from hectares into hectares or 2.5 % annual change rate. Human construction wetland (paddy field) from 1983 until 2002 has increased from hectares to hectares or 1 % annual change rate. Human intervention has affected Lindu enclaves. The changes are from forest to the wetland area especially construction wetland area. The change happened as the forest was converted to areas with more social economic value such as paddy field and fish ponds Multi Criteria Evaluations for Wetland Area The following figure will explain the result of the multi criteria evaluation model (MCE) as the suitable area for wetland. Multi criteria evaluation for wetland area was obtained from three variables that were overlaid together into one output suitable area. The three variables consist of slope (topography area), soil, and land cover area. The results of multi criteria evaluation model for Lindu Enclaves are shown in the following figures. (a) (b) 16

17 (c) (d) Figure 13 Wetland Suitability Areas in Lore Lindu Enclaves Markov Chain Analysis for Wetland Area Matrix transition probability that has been obtained from 1983 aerial photography and 2002 Landsat imagery classification is the reflection for 2021 of Lindu Enclaves activities. Matrix configuration was calculated with 19 years intervals. Furthermore, the result of matrix transition that as shown in the following table was also used as the basic wetland change prediction model simulation to predict the change that will occur within 19 years from Table 8 Probability Change Given : Probability of changing to : Cl. 1 Cl. 2 Cl. 3 Cl. 4 Cl. 5 Cl. 6 Cl. 7 Cl 1 Water : Cl 2 Agriculture : Cl 3 Marsh & Bush land : Cl 4 Coffee : Cl 5 Forest : Cl 6 Paddy Field : Cl 7 Settlement : Table 9 Cells/pixels expected to change Cl. 1 Cl. 2 Cl. 3 Cl. 4 Cl. 5 Cl. 6 Cl. 7 Cl 1 Water : Cl 2 Agriculture : Cl 3 Marsh & Bush land : Cl 4 Coffee : Cl 5 Forest : Cl 6 Paddy Field : Cl 7 Settlement :
18 4.1.5 Wetland Change Prediction Area Wetland change prediction area using markov cellular automata model was obtained from three variables that have been overlaid as markov cellular automata model process. It needs a few factors as the input files such as basis land cover image (Wetland classification map 1983 derived from aerial photography), markov transition areas file, transition suitability image, which is derived from Multicriteria evaluation process, number of projection year (i.e. 19 years), and cellular automata filter type (standard 3 x 3 contiguity filter). The result of the land cover change prediction area and wetland change prediction area based on markov cellular automata model can be seen in the following figure 12 which describes detailed information about Lindu Enclaves. (a) (b) (c) (d) Figure 14 Wetland Classification Maps 1983, 2002, 2006 and Wetland Change Prediction Map 2021 as Markov Cellular Automata Model Results 18
19 Table 10 Area statistics for Wetland annual change rate in Lindu Enclave area Class Area 2002 Area 2021 Change % rel Change Annual Change Rate (%) Water Body Agriculture Marsh & Bush land Coffee Forest Paddy Field Settlement Area (Ha) Year Water Agriculture Marsh & Bush land Coffe Forest Paddy Field Settlement (a) Settlement Paddy Field Forest Coffe Marsh & Bush land Agriculture Water Figure 15 Graphic of Wetland Change Area from (b) Based on the above spatial wetland model prediction 2021 and area calculation, the natural wetland area (marsh area) will decrease from 2, hectares to hectares in 2021 or -0.1 % annual change rate. Forest area was predicted to decrease in 2021 from hectares to hectares or -0.7 % annual change rate. In this case, forest has the 19
20 highest annual change rate and if this always occurs then forest area will disappear in Lindu enclaves as well as natural wetland area (marsh area) with -0.1 % annual change rate. On the other hand, construction (man - made) paddy field wetland area will increase from hectares to hectares or 0.7 % annual rate change in This will also happen to agricultural and cacao / coffee area that have an annual rate change of 1.1 % and 0.7 % per year. In addition, settlement area is predicted to increase each year from hectares to hectares or 1.2 % annual change rate. Annual change rate of 1.2% is the highest for Lindu enclave. Therefore, it can be concluded that settlement area always increases every year and social economic factor has high impact to increase social economic land use such as cacao / coffee and agriculture sector. Man -made wetland area (i.e. paddy field area) is also predicted to increase in 2021, assuming that paddy field area has high economic value for local people. On the contrary, marsh area as natural wetland area and forest area will decrease due to land conversion for higher socio economic valued agriculture by the local communities. 5. Conclusion and Recommendation 5.1 Conclusions Lindu enclaves have two wetland types; natural wetland (marsh and bush land) and construction / man - made wetland (paddy field and fish pond). It consists of 2, hectares of natural wetland area (marsh) and 1, hectares of man - made / construction wetland area (paddy field) in After that, in 2002 Lindu enclave area consists of 2, hectares of natural wetland area (marsh) and 1,450.2 hectares man - made / construction wetland area (paddy field). Natural wetland (marsh and bush land) dominated the spatial distribution in the Southern and Western parts of the Lindu enclave area. On the other side, man- made / construction wetland spreads in all areas, with the largest paddy field area located in Kanawu sub-district. (South Eastern area of Lindu Enclave). The changes of wetland area in Lindu enclave area for natural wetland (marsh) was hectares ( ) with 0.1 % annual change rate and hectares area for human made / construction wetland area (paddy field) with 1.0 % annual change rate. Therefore, construction wetland (paddy field) can be analyzed as having good socio economic value for local people but for ecological value it gives negative impacts. The same is true to natural wetland area (marsh) that will give positive impact from ecological side however this area always decreases every year. The suitable area for wetland was located in every enclave area, however the most suitable area was located at the Southern part of Lindu enclave area. The prediction of spatial distribution for natural wetland area in 2021 will disappear with an annual change rate of -0.1 %. Because Lindu enclave area has slow rate of change area both from socio economic and hydrologic factors. However, human made wetland such as paddy field area has increased to 1, hectares in 2021 with 0.7 % annual change rate. Markov Cellular automata model can be used to predict wetland change area in Lindu enclave area. The accuracy of simulation result was determined from Markov probability transition and existing spatial suitable area for wetland area. 5.2 Recommendation The result of this spatial simulation model for wetland area can be used as the base spatial planning map to predict what will happen in the future. Water availability for Lore 20
21 Lindu National Park can be assessed through its ecological and socio economic assessments. This model can be used for local government, stakeholders, and local people / community in Lindu Enclave. It is important to maintain and preserve natural resources in a sustainable way. 6. References Burrough, P. A., Principles of Geographic Information Systems for Land Resources Assessment, Oxford University Press, New York, 1986, 193 pp. Cowardin, L. M., & et. al. (1979). Classification of wetlands and deep water habitats of the United States. Washington, D.C: US Fish and Wildlife Service. 45 p Eastman, J. R. (2003). IDRISI Kilimanjaro: Guide to GIS and Image Processing. Worcester, MA: Graduate School of Geography, Clark University Federal Interagency Committee for Wetland Delineation, Federal Manual for Identifying and Delineating Jurisdictional Wetlands. U.S. Army Corps of Engineers, U.S. Environmental Protection Agency, U.S. Fish and Wildlife Service, and USDA Soil Conservation Service. Cooperative technical publication, 1987, 76 pp. plus appendices. Hashimoto, T., M. Takagi, K. Kajiwara and C. Fucino. (Eds) Remote Sensing Note. Japan Association on Remote Sensing. Scott, D.A Design of Wetland Data Sheet for Database on Ramsar Sites. Mimeographed report to Ramsar Convention Bureau, Gland, Switzerland. Washington State Wetlands and Delineation Manual, Wetland Delineation Manual. Sirakoulis, G. Ch., I, Karafyllidis, A, Thanailakis A Cellular Automaton Model for the Effects of Population Movement and Vaccination on Epidemic Propagation. Ecological Modelling. 133 : Toffoli, T. and Margolus, N Cellular Automata Machines: A New Environment for Modeling, Cambridge, MA: The MIT Press 21
22 STATEMENT I, Wen Wen, here by stated that this thesis entitled: Wetland Change Prediction Using Markov Cellular Automata Model in Lore Lindu National Park, Central Sulawesi Province, Indonesia are results of my own work during the period of January 2007 until December 2007 and that it has not been published before. The content of the thesis has been examined by the advising committee and the external examiner. Bogor, January 2008 Wen Wen i
23 ACKNOWLEDGMENT First, I would like to express my grateful to my GOD for everything that has been given to me. And I would like also to give my highly appreciation to STORMA (Stability of Rainforest Margin in Indonesia) as an Indonesian German collaboration research funded by German Research Foundation (FDG) to support my research in Lore Lindu National Park and for the following people that give a high contribution and help to finish my thesis: 1. Dr. Yuli Suharnoto as my supervisor, Dr. Gatot Haryo Pramono as my cosupervisor and Dr. Tania June as my STORMA Counterpart for their guidance, help, idea, comment and constructive criticism during my research. 2. Dr. Surya Tarigan, Dr. Adam Malik and Mr. Wolfram Lorentz as the STORMA coordinators of IPB, Untad and German for their assistance during the implementation of research. 3. Pak Sudarmin and his family for their kind assistance during my field work in Lindu. 4. My friend in MIT IPB for helping and supporting me in finishing my thesis. 5. MIT secretariat and all staff for helping me to arrange the administration, technical and facilities. 6. The Nature Conservancy Coral Triangle Center Staff, Sanur Bali for their help and facility during finishing my research. Finally, I would like to give my special thanks to my father, my mother, my sister and all of my family for all of their support during finishing my master degree. ii

24 CURRICULUM VITAE Wen Wen was born in Belinyu, on 15 May He received his undergraduate degree from Department of Geography, Faculty of Mathematics and Science, University of Indonesia in He has worked with PT. Earthline Consultant and did several GIS & Remote Sensing project for private and government organization as Remote Sensing & GIS Specialist. In years of 2006, He continued his study to pursue his master degree at Information Technology Program at Bogor Agricultural University. He also has received research grant from STORMA (Stability of Rainforest Marginal) for his thesis with the research title is: Wetland Change Prediction Using Markov Cellular Automata Model in Lore Lindu National Park, Central Sulawesi Province, Indonesia. Since August 2007, he has joined with The Nature Conservancy Coral Triangle Center Program (Non Government Organization) as Information System Officer. iii
25 ABSTRACT Wen Wen (2008) Wetland Change Prediction Using Markov Cellular Automata Model in Lore Lindu National Park, Central Sulawesi Province, Indonesia. Lore Lindu National Park (LLNP) is located between East and South and administratively, located in Poso District and Donggala District, in Central Sulawesi Province, Indonesia. Topographically, Lore Lindu National Park has two enclaves: Lindu Enclave ( ha) and Besoa Enclave (5.085 ha). Lindu enclaves have high growing socio economic activities that can threaten Lore Lindu National Park as a tropical rainforest that requires the stability of rainforest margin area. If agricultural and built up area (settlement area) in Lindu enclaves always increase every year then the water availability to support Lore Lindu National Park will decrease so the stability of rainforest is threaten. Wetland as ecological component is important to be maintained, monitored and modeled to support the stability of rainforest margin area. Therefore, wetland change prediction is needed to predict what will happen in the future so that it can help decision maker in designing a strategies plan. The objectives of this research are: 1) to evaluate and asses the wetland area in Lindu Enclave area & Lindu Lake, 2) to predict the changes of wetland area in Lindu Enclave area & Lindu Lake using Markov Cellular Automata Model. Land cover 1983 from aerial photography, Landsat TM 2002 and 2006 are used as the spatial model data. Input image correction is also performed in order to acquire well ground spatial estimation. Afterward, markov chain is used to get rate value per years of wetland change area in Lindu area. Multicriteria evaluation for wetland area created with soil map, topography map, and land cover map as the variables for suitable wetland area criteria that will be used in cellular automata model. Finally, markov chain probability values for each class and multicriteria evaluation map are merged with cellular automata model with 3 x 3 cell neighbors analysis then spatial wetland change prediction map for 2021 can be determined. The results of this research show that Lindu enclaves have two wetland types; natural wetland (marsh and bush land) and construction / man - made wetland (paddy field and fish pond). The changes of wetland area in Lindu enclave area for natural wetland (marsh) was hectares ( ) with 0.1 % annual change rate and hectares area for human made / construction wetland area (paddy field) with 1.2 % annual change rate. The suitable area for wetland was located in every enclave area, however the most suitable area was located at the Southern part of Lindu enclave area. The prediction of spatial distribution for natural wetland area in 2021 will decrease with an annual change rate of -0.1 %. However, human made wetland such as paddy field area has increased to hectares in 2021 with 0.7 % annual change rate. iv
26 v
27 TABLE OF CONTENTS STATEMENT... i ACKNOWLEDGMENT... iii CURRICULUM VITAE... iii ABSTRACT... iv TABLE OF CONTENTS... vi LIST OF FIGURE... vii LIST OF TABLE... viii LIST OF APPENDIX... ix 1. INTRODUCTION Background Objectives Research Questions LITERATURE REVIEW Wetland Definition of Wetland Wetland Vegetation Wetland Soils Wetland Hydrology Wetland Delineation using Remote Sensing & Geographic Information System (GIS) Markov Chain Cellular Automata Model METHODOLOGY Time and Study Area Types of Data and Sources Hardware and Software Methods Spatial Model Pre-Processing Spatial Model Processing Spatial Model Validation RESULT & DISCUSSION Wetland in Lindu Enclaves Image Correction Image Classification Accuracy Assessment Multi Criteria Evaluations for Wetland Area Markov Chain Analysis for Wetland Area Wetland Change Prediction Area CONCLUSIONS & RECOMMENDATION REFERENCES...69 APPENDIX...74 vi
28 LIST OF FIGURE Figure 1 Wetland area at Banc d'arguin National Park, Mauritania. (Photo: J. Trotignon, Ramsar Library)... 6 Figure 2 The different sources of water and possible outflows from a hypothetical wetland Figure 3 The nearest neighbored from cell (i,j) is formed from cell (i,j) itself and eight (8) cell at it the adjacent (Sirakoulis et al., 2000) Figure 4 Study Area Map Figure 5 Lore Lindu Lake Figure 6 General Research Methodology Figure 7 Wetland Classification Maps Process (Image Pre-processing) Figure 8 Markov Chain Model for Wetland Classification Figure 9 Markov Cellular Automata Model Figure 10 Atmospheric Correction Figure 11 Geo registration process Figure 12 Supervised Classification with Maximum Likelihood method for Land cover / Land use classification map 2002 & Figure 13 Area calculations for land cover / land use classification map 2002 & Figure 14 Wetland Classification Maps 2002 and Figure 15 Area calculations wetland classification map 2002 & Figure 16 Classification Map 1983 derived from aerial photography Figure 17 Area calculation for Land Cover / Land Use Area 1983 derived from aerial photography Figure 18 Wetland Classification Map Figure 19 Area calculations for Wetland Classification Map Figure 20 Suitable Slope for Wetland area Figure 21 Suitable Soil for Wetland area Figure 22 Suitable Land Cover for Wetland area Figure 23 Wetland Suitability Areas in Lore Lindu Enclaves Figure 24 Land Cover / Land Use classification map 2002 and Simulation Model Land Cover / Land Use Figure 25 Wetland classification map 2002 and Simulation Model Wetland Figure 26 Land Cover / Land Use Classification Maps 1983, 2002, 2006 and Land Cover / Land Use Change Prediction Map 2021 as Markov Cellular Automata Model Results Figure 27 Wetland Classification Maps 1983, 2002, 2006 and Wetland Change Prediction Map 2021 as Markov Cellular Automata Model Results Figure 28 Graphic of Land Cover / Land Use Change Area from 1983 to Figure 29 Cut forest area for agriculture and cacao/coffee area vii
29 LIST OF TABLE Table 1 Marine/Coastal Wetland types... 8 Table 2 Inland Wetland types... 9 Table 3 Human-made wetland types Table 4 Tabulations of Wetland Type characteristics for Marine / Coastal Table 5 Tabulations of Wetland Type characteristics for Inland area Table 6 Types of data and sources Table 7 Cells/pixels expected to change of wetland area for 1983 until Table 8 Transition Probability Matrix of wetland area for 1983 until Table 9 Root Mean Square table for geo registration process Table 10 Area calculation for Land cover / Land use Classification Map 2002 & Table 11 Area calculation for Wetland Classification Map 2002 & Table 12 Area calculation for Classification Map Table 13 Area Calculation Wetland Classification Map Table 14 Area statistics for Wetland annual change rate in Lindu Enclave area Table 15 Land Cover / Land Use Classification 2002 Accuracy Assessment Table 16 Land covers / Land use classification types Table 17 Probability Change Table 18 Cells/pixels expected to change Table 19 Area statistics for Wetland annual change rate in Lindu Enclave area viii
30 LIST OF APPENDIX Appendix 1 Study Area Map Appendix 2 Wetland Classification Map Appendix 3 Wetland Classification Map Appendix 4 Wetland Prediction Area Appendix 5 Wetland Prediction Area Appendix 6 Wetland Type in Lindu Enclave Appendix 7 Socio economic activities in Lindu Enclave Appendix 8 Land cover / Land use in Lindu Enclave Appendix 9 Soil types in Lindu Enclave Appendix 10 Soil data collection sheet Appendix 11 Land Cover type data collection sheet Appendix 12 Wetland types data collection sheet ix
31 1. INTRODUCTION 1.1. Background Lore Lindu National Park (LLNP) was declared as the National Park in 1993 (The Nature Conservancy, 2001). Geographically, it is located between East and South and administratively, located in Poso District and Donggala District, in Central Sulawesi Province, Indonesia. The total area of the National Park is ,90 ha. Lore Lindu National Park is one of the tropical rainforests in Indonesia of which 90 % of its canopy cover is still intact. It has not suffered from illegal logging and exploitation compared to other parks in Indonesia. Topographically, Lore Lindu National Park has two enclaves: Lindu Enclave ( ha) and Besoa Enclave (5.085 ha). Lindu enclave is a plain area that was formed by lacustrine area in the surrounding of Lore Lindu Lake. Lindu enclave area is surrounded by Lore Lindu National Park margin area. Lindu enclave has four villages that are located in the areas as follows: Langko, Anca, Puroo and Tomado. Lindu enclaves have high growing socio economic activities that can threaten Lore Lindu National Park as a tropical rainforest that requires the stability of rainforest margin area. If agricultural and built up area (settlement area) in Lindu enclaves always increase every year then the water availability to support Lore Lindu National Park will decrease so the stability of rainforest becomes worst. Therefore, spatial prediction model is needed to create good spatial planning map for this area with protected areas should not be converted into socio 1
32 economic area, through this spatial prediction model in this research then the spatial problem can be solved in this area. There are three parts of stability component namely ecological, social, and economic dimensions. Wetland as ecological component is important to be maintained, monitored and modeled to support the stability of rainforest margin area. Wetland area can become an ecosystem balance for Lore Lindu National Park. Wetlands are rich ecosystems that provide refuge to high concentrations of fauna and flora species, therefore, Lore Lindu Lake and Lindu Enclave area as wetland areas inside the national park should be monitored and need to be protected and conserved as ecological component area. Wetland area has many benefits, among others: flood control, water purification, shore erosion protection, control of nutrient cycles, accumulation of sediment, and supply of detritus for the aquatic food web (Herdendorf et al., 1986). In this research, Lore Lindu Lake and Lindu Enclave are chosen as research area for prediction model that incorporated GIS (Geographic Information System) and remotely sensed data using spatial model approach. Remote sensing as a process of gathering data of the earth surface and the environment taken from a distance, usually used aircraft or space sensors (Jensen 1986) is very useful to create new land cover and land use map. While GIS is a special case of information systems where the database consists of observations on spatially distributed features, activities, or events, which could be defined in space as points, lines, or areas also will be used as spatial analysis in wetland area. GIS can be used to manipulate data: points, lines, and areas and to retrieve data for ad hoc queries and analyses (Dueker 1979). 2
33 In his study Lyon (1979) has analyzed and attempted to predict wetland changes, and to gain a better understanding of vegetation class relationship by using remote sensing technologies and GIS in St. Clair Flats; while the result shows that the wetland area can be delineated from Landsat MSS data and the changed area in St. Clair Flats can be observed without disturbing the wetland area. Furthermore, Paredes (2004) studied a spatial model to represent potential effects on wetland habitats by management alternatives to be adopted, through the use of remote sensing and geographical information system in the Fúquene Lake, Colombia. The result in Fúquene Lake showed that the model can be used for wetland areas with three different scenarios using water level increase. In this research, Markov Cellular Automata model is used as a spatial application model in the GIS that has spatial dynamic result and can be used to predict the changes of wetland area in Lore Lindu Lake and Lindu Enclave areas. The integration of the Markov transition probabilities and the Cellular Automata concept is known as Markov Cellular Automata Approach (Veldkamp and Lambin 2001). This relatively new model attempts to integrate the spatial aspect and statistics probabilistic approach to describe the dynamic changes occurring in the earth surface Objectives The main objectives of this research are as follows: To evaluate and asses the wetland area in Lindu Enclave area & Lindu Lake 3
34 To predict the changes of wetland area in Lindu Enclave area & Lindu Lake using Markov Cellular Automata Model 1.3. Research Questions Where are the spatial distributions of the wetland area in 1983 and 2002 classification map? How big the changes occurred to the wetland area in Lindu Enclaves & Lindu Lake from 1983 until 2002? Where are the suitable wetland areas in Lindu Enclaves? Where are the predicted spatial distributions of wetland area in 2021 and how big the rate of the changes will occur from 2002 until 2021 in Lindu Enclaves? 4
35 2. LITERATURE REVIEW 2.1. Wetland Definition of Wetland Wetland occupies the transitional zone between permanently wet and generally dry environments. They exhibit enormous diversity according to their genesis, geographical location, water regime and chemistry, dominant plants and soil or sediment characteristics. There may be considerable variation within a single wetland area and many different types of wetland may be found in close proximity, forming not just different ecosystems, but wholly different landscapes. The Ramsar Convention adopts an extremely broad approach in determining the "wetlands" which come under its aegis. Wetlands are defined as: "areas of marsh, fen, peat land or water; whether natural or artificial, permanent or temporary, with water that is static or flowing, fresh, brackish or salt, including areas of marine water the depth of which at low tide does not exceed six meters". In addition, the Convention provides that wetlands: "may incorporate riparian and coastal zones adjacent to the wetlands, and islands or bodies of marine water deeper than six meters at low tide lying within the wetlands". Wetland definition given by Cowardin (1979) meets lands transitional between terrestrial and aquatic systems where the water table is usually at or near the surface or the land is covered by shallow water. This definition includes a higher range of possible habitats than other classification systems that use with two basic criteria: vegetation and soil. 5

36 Since a geographical perspective, the Mediterranean Wetlands Initiative (MedWet), defines wetland habitats as the minimal describing unit of wetland that is easily recognizable and allows recording detailed data of the wetland site. Indeed, attributes that allow describing habitats according to the MedWet methodology are hydrology, soil and vegetation. Furthermore, nutrients, water depth, and sediments may complement a better description of wetland habitats. MedWet also states that the specialization level of habitats depends mainly on vegetation types as well as its extent and distribution (Farinha 1996). Consequently, MedWet adjusted and established the following criteria to define wetland habitats: i) Habitats where, at least periodically, land predominantly supports hydrophytes plants; ii). The substrate is predominantly undrained hydric soil; iii). The substrate is non-soil and is saturated with water, or covered by shallow water at some time during the growing season of each year (Farinha 1996). Figure 1 Wetland area at Banc d'arguin National Park, Mauritania. (Photo: J. Trotignon, Ramsar Library) 6
37 Types of Wetland In trying to categorize the wide range of wetlands encompassed by the Ramsar definition, Scott (1989) defined 30 groups of natural wetlands and nine man made ones. However, for illustrative purposes it is possible to identify five broad wetland systems: Estuaries: where rivers meet the sea and salinity is intermediate between salt and freshwater (e.g., deltas, mudflats, salt marshes) Marine: Riverine: not influenced by river flows (e.g., shorelines and coral reefs) land periodically inundated by river overtopping (e.g., water meadows, flooded forests, oxbow lakes) Palustrine: where there is more or less permanent water (e.g., papyrus swamp, marshes, and fen) Lacustrine: areas of permanent water with little flow (e.g., ponds, kettle lakes, volcanic crater lakes) To assist in identification of the correct Wetland Types, the Ramsar site has provided tabulations for Marine/Coastal Wetlands, Inland Wetlands of some of the characteristics of each Wetland Type and Human-made wetland types (see Tables 1, 2 and 3). 7
38 Table 1 Marine/Coastal Wetland types (Source; Ramsar Convention, 1971) A Permanent shallow marine waters in most cases less than six metres deep at low tide; includes sea bays and straits. B Marine subtidal aquatic beds; includes kelp beds, sea grass beds, and tropical marine meadows. C Coral reefs. D Rocky marine shores; includes rocky offshore islands, sea cliffs. E Sand, shingle or pebble shores; includes sand bars, spits and sandy islets; includes dune systems and humid dune slacks. F Estuarine waters; permanent water of estuaries and estuarine systems of deltas. G Intertidal mud, sand or salt flats. H Intertidal marshes; includes salt marshes, salt meadows, saltings, raised salt marshes; includes tidal brackish and freshwater marshes. I Intertidal forested wetlands; includes mangrove swamps, nipah swamps and tidal freshwater swamp forests. J Coastal brackish/saline lagoons; brackish to saline lagoons with at least one relatively narrow connection to the sea. K Coastal freshwater lagoons; includes freshwater delta lagoons. K(a) Karst and other subterranean hydrological systems, marine/coastal 8
39 Table 2 Inland Wetland types (Source; Ramsar Convention, 1971) L Permanent inland deltas. M Permanent rivers/streams/creeks; includes waterfalls. N Seasonal/intermittent/irregular rivers/streams/creeks. O Permanent freshwater lakes (over 8 ha); includes large oxbow lakes. P Seasonal/intermittent freshwater lakes (over 8 ha); includes floodplain lakes. Q Permanent saline/brackish/alkaline lakes. R Seasonal/intermittent saline/brackish/alkaline lakes and flats. Sp Permanent saline/brackish/alkaline marshes/pools. Ss Seasonal/intermittent saline/brackish/alkaline marshes/pools. Tp Permanent freshwater marshes/pools; ponds (below 8 ha), marshes and swamps on inorganic soils; with emergent vegetation water logged for at least most of the growing season. Ts Seasonal/intermittent freshwater marshes/pools on inorganic soils; includes sloughs, potholes, seasonally flooded meadows, sedge marshes. U Non forested peatlands; includes shrub or open bogs, swamps, fens Va Alpine wetlands; includes alpine meadows, temporary waters from snowmelt. Vt Tundra wetlands; includes tundra pools, temporary waters from snowmelt. W Shrub dominated wetlands; shrub swamps, shrub dominated freshwater marshes, shrub carr, alder thicket on inorganic soils. Xf Freshwater, tree dominated wetlands; includes freshwater swamp forests, seasonally flooded forests, wooded swamps on inorganic soils. Xp Forested peatlands; peatswamp forests. Y Freshwater springs; oases. Zg Geothermal wetlands Zk(b) arst and other subterranean hydrological systems, inland 9
40 Table 3 Human-made wetland types (Source; Ramsar Convention, 1971) 1 Aquaculture (e.g., fish/shrimp) ponds 2 Ponds; includes farm ponds, stock ponds, small tanks; (generally below 8 ha). 3 Irrigated land; includes irrigation channels and rice fields. 4 Seasonally flooded agricultural land (including intensively managed or grazed wet meadow or pasture). 5 Salt exploitation sites; salt pans, salines, etc. 6 Water storage areas; reservoirs/barrages/dams/impoundments (generally over 8 ha). 7 Excavations; gravel/brick/clay pits; borrow pits, mining pools. 8 Wastewater treatment areas; sewage farms, settling ponds, oxidation basins, etc. 9 Canals and drainage channels, ditches. Zk (c) Karst and other subterranean hydrological systems, human made Based on Scott (1989) categorization, Lore Lindu Lake can be included in lacustrine areas characterized by permanent water with little flow. Furthermore, according to the classification system for wetlands as has been proposed by the Ramsar Convention, Lore Lindu Lake belongs to an inland wetland of type O, namely, a permanent freshwater lake whose extent surpasses 8 hectares. Moreover, in Lindu Enclaves, the classification system of the wetland area based on Ramsar Convention is a man -made wetland, where the Lindu Enclaves consists of agriculture area (paddy field), fish pond and etc. 10
41 Table 4 Tabulations of Wetland Type characteristics for Marine / Coastal (Source; Ramsar Convention, 1971) Saline water Permanent < 6 m deep A Underwater Vegetation B Coral reefs C Shores Rocky D Sand, shingle or pebble E Saline or brackish Intertidal water Flats (mud, sand G or salt) Marshes H Forested I Lagoons J Estuarine waters F Saline, brackish or Subterranean Zk(a) fresh water Fresh water Lagoons K 11
42 Table 5 Tabulations of Wetland Type characteristics for Inland area (Source; Ramsar Convention, 1971) Fresh water Saline, brackish or alkaline water Fresh, saline, brackish or alkaline water Flowing water Lakes pools and Marshes on inorganic soils Marshes on peat soils Marshes on inorganic or peat soils Lakes Permanent Seasonal/intermittent Coral reefs Rivers, streams, creeks Deltas Springs, oases Rivers, streams, creeks M L Y Permanent > 8 ha O < 8 ha Tp Seasonal/intermittent > 8 ha P < 8 ha Ts Permanent Herbdominated Tp Permanent/Seasonal/intermittent Shrubdominated W Treedominated Xf Seasonal/intermittent Herbdominated Ts Permanent Nonforested U Forested Xp High altitude (alpine) Va Tundra Vt Permanent Q Seasonal / intermittent R Marshes & Permanent Sp pools Seasonal / intermittent Ss Geothermal Subterranean N Zg Zk(b) Wetlands are dynamic ecosystems which are defined by federal regulating agencies as possessing three essential characteristics: (1) hydrophytic vegetation, (2) hydric soils, and (3) wetland hydrology, which are the driving force creating 12
43 all wetlands (Federal Interagency Committee for Wetland Delineation, 1989). Under most circumstances, at least one positive field indicator of each parameter will be apparent at any given wetland. In the following section, each of these parameters will be examined individually Wetland Vegetation The vegetation criterion in wetland definitions requires an area to have over 50 percent of its dominant species classified within a broad range of wetland plants (Washington State Wetlands and Delineation Manual, 1997). It is important to note that some plants are adapted to both wetland and upland conditions. The mere presence of a particular plant does not indicate wetland conditions unless the vegetation dominance, hydrology and soils criteria explained here are satisfied. Wetland plants are adapted to conditions in which their roots are submerged at least periodically, and the oxygen in the pore spaces of the soil is displaced by water, creating an anaerobic environment. Unfortunately, wet site adaptations are not always recognizable in the field, so it is important to learn to identify some of the most common wetland species in our area Wetland Soils Hydric soils are saturated, flooded or ponded long enough during the growing season to develop anaerobic conditions in the upper part. In just a few days to a week, flooding of soil causes a rapid depletion of oxygen and the onset of an anaerobic environment. The diffusion of dissolved oxygen in waterlogged soils is 10,000 times slower than in unflooded soils. If oxygen does make its way 13
44 into a flooded soil, it is rapidly used by microbes that can use either oxygen or oxidized soil components to support their respiration. The anaerobic conditions under which hydric soils form can give the soils one or more distinct characteristics, which can often be seen quite easily in the field. Hydric soils can be organic (derived from living organisms) or mostly minerals. The use of moist soils when determining color and small changes in the micro topography of a site can be reflected by soil characteristics. Such variations should be considered when delineating wetland boundaries of the three criteria that are used to define wetlands (hydrology, vegetation and soils) the defining characteristics of wetland soils are most likely to undergo some revision in the near future. Research on soil color, soil temperature and duration of saturation may eventually yield new guidelines for hydric soil definition Wetland Hydrology Wetland hydrology refers to conditions of permanent or periodic inundation, or soil saturation to the surface where hydrology conditions are the driving forces behind wetland formation. Numerous factors influence the wetness of an area, including precipitation, stratigraphy, topography, soil permeability, and plant cover (Federal Interagency Committee for Wetland Delineation, 1989). The term wetland hydrology generally refers to the inflow and outflow of water through a wetland and its interaction with other site factors. Land is characterized as having wetland hydrology when, under normal circumstances, the land surface is either inundated or the upper portion of the soil is saturated at a sufficient frequency and duration to create anaerobic conditions. The presence or 14
45 absence of wetland hydrology may be determined through the on-site identification of established field indicators. While field indicators of wetland hydrology are at times difficult to identify, it is essential to determine that the area is periodically inundated or has saturated soils in order for the area to be characterized as meeting the wetland definition. For sites where there is a predominance of wetland plant species but there is no direct visible evidence that water is, or has been, at or above the soil surface, directs to the MDEQ to use the characteristics of soils to verify the presence or absence of wetland hydrology. Soils and field indicators of wetland soils are discussed. If field indicators of hydrology are absent, such as in disturbed areas, evidence of hydrology may need to be established through the evaluation of recorded hydrologic data. Wetland conditions occur where topographic and hydrogeology conditions are favorable and a sufficient, long-term source of water exists. Favorable topographic conditions refer generally to the presence of land-surface depressions in the drainage basin. These depressions may be located in upland areas, along hillsides where there may be a change in slope or geology, in floodplains of streams or rivers, or along the margins of lakes. Geologic conditions which may be favorable for wetland development include areas that have fine textured surficial soils with low hydraulic conductivity and sufficient thickness to store water. Also, the presence of impermeable bedrock near the land surface may favor the development of wetland hydrology. The development of wetland conditions requires a persistent, long-term source of water. Figure 2 shows the different sources of water and possible outflows from a hypothetical wetland. The source of water may be precipitation (P) which falls directly on the wetland, surface water 15
, groundwater inflow to the wetland (GWI), or a combination of any, or all, of these sources.")
46 runoff during rainfall or snowmelt events within the catchments area surrounding the wetland (surface water inflow, or SWI), periodic flooding caused by elevated water levels in nearby surface water bodies (also SWI), groundwater inflow to the wetland (GWI), or a combination of any, or all, of these sources. Water may be lost from a wetland by evaporation from standing water or saturated soils (E), transpiration from plants (T), or surface water or groundwater outflow (SWD or GWD). The development of wetland conditions depends on a long-term balance between water inflow to the wetland and outflow from the wetland. During dry climatic periods, the rate of water inflow to the wetland (precipitation, groundwater inflow, and surface or near-surface inflow) may greatly diminish. In this instance, the amount of water loss through evapotranspiration may exceed the rate of all water inflow to the wetland. Water losses through evapotranspiration can result in extreme declines in the water table and a de-saturation of the wetland. Figure 2 The different sources of water and possible outflows from a hypothetical wetland (Source, Federal Interagency Committee for Wetland Delineation, 1989) 16
47 Wetland Delineation using Remote Sensing & Geographic Information System (GIS) Remote Sensing is defined as the science and technology by which the characteristics of objects of interest can be identified, measured or analyzed the characteristics without direct contact (Hashimoto et al., 1993). Moreover, Geographic Information System (GIS) is defined as a powerful set of tools for collecting, storing, retrieving at will, transforming and displaying spatial data from the real world (Burrough, 1986). Based on these two definitions, remote sensing technology and GIS are expected to provide efficient tools for monitoring wetland environment with spatial approach and computer system. Several researches using remote sensing and GIS technology have been done for delineation and monitoring of wetland area. Yasuoka et al. (1995) investigate remote sensing technology for monitoring actual vegetation distribution and its change in wetland by utilizing microwave sensor (SAR) data from ERS1 and JERS-1 together with optical sensor data from Landsat TM, JERS-1 OPS and SPOT HRV. The wetland resources mapping in West Bengal, India using remotely sensed data also have been done by Sharafat Ali et al. (1991), moreover, Tamura et al. (1995) used SPOT/HRV image to observe the western Siberian wetlands area by using remote sensing techniques and the result showed that SPOT/HRV image can be used to classify wetland area into several wetland classes and the ground truth data can also improve the image classification accuracy. Vegetation mapping for wetland area in Northeast Hokkaido, Japan also has been done by Miyamoto et al. (1995) and the result exhibited that aerial balloon 17
48 photographs can be used to map the wetland vegetation and also the data can be transformed into computer based as the vector data Markov Chain A Markovian process is one in which the state of a system at time 2 can be predicted by the state of the system at time 1 given as matrix of transition probabilities from each cover class to every other cover class (Eastman 2003). Lambin (1994) defined the hypothesis for markov process that the prediction for land cover map or land use map can be simulated based on the past condition and existing condition. Furthermore, Bell and Hinojosa (1977) also stated that the probability map of the land cover map/ land use map condition in the future will rely on the existing condition. The markov chain probabilities mechanism are Pij as likelihood transition or the changing from i to j condition at time interval, where i and j are the certain class location to simulate landscape change (Brown 1970). The markov chain model output is displayed as the land cove / land use transition matrix configuration from 1 time to another time ( t + 1), where this can be used as the base to project in the future time. In the probability terminology for X(t) and X(t+1) Markov probabilities are expressed as the follow; P [ X (t+1) = j X (t) = i ].. (1) Where; i and j are the Markov index from a system (Bell 1974) Markov chain model have been used by several researchers. Collin (1970) and Bell (1974 and 1977) used the model to analyze the company pattern distribution, population migration and land use change analysis. Moreover, Aavikson (1995) used Markov chain model to simulate the dynamic of the 18
49 vegetation map. Logsdon et al. (1997) also used markov chain model to map the land use change probabilities. The results showed that markov chain model is capable to describe the land use change and to predict land use change distribution in the future. However, markov chain model has the limitation to explain about the interaction between the changes that occurs. Another limitation is that the model cannot answer the question why the changes occur. Markov model only can be used to determine when and what type of land use or land cover will change (Lambin 1994). Markov chain model has been combined into GIS (Geographic Information System) (Brown et al. 2000; Lopez et al. 2001; Hathout 2002; Weng 2002) through the integration of the remote sensing technology and GIS spatial data. Weng (2002) has succeeded to analyze trend, rate, and spatial pattern for land use / land cover change using the integration of remote sensing and GIS. The integration of the GIS based on markov model and cellular automata can represent spatial interaction for land cover and land use change and can also be used to determine or predict the land use change in the spatial dimension. Based on the above many of the researches used markov chain model to model the land use or land cover change, however, this research will focus on the wetland change prediction using markov model in Lore Lindu area to describe how the wetland type as the spatial dimension also can use the markov model Cellular Automata Model Cellular Automata are dynamic models which operate in raster data spaces. States within the raster space can be defined as binary (for example, 19
50 alive/dead), or as discrete, multilevel. Cellular automata are dynamic systems whose behavior is completely specified by local relationships (Toffoli and Margolus, 1987). The best-known example of a cellular automation model is Conway s game of Life (Couclelis, 1985; Gardner, 1970) Life, as defined in Conway game, takes place in a binary raster space seeded with ones ( alive cells) in a field of zeros ( dead cells). The cellular automata is a model which has spatial characteristics based on cell or parcels where the changes depend on each surrounding cells or the closest parcels. A cell or parcel will live if three (3) or more than the surrounding cells are still alive. Otherwise, the cell will die if 3 or more of the closest cells die. Batty (1998) defined the cellular automata as the dynamic model where discrete at time dimension, place and condition. Moreover, Irwin (2001) also stated that a cellular automata entity is various as the independent, where the existing condition is rely on by the past condition through independent. Based on this, it is clear that markov model has the similarity with the cellular automata model theory. The difference is to determine the changing transition that is cellular automata model not only based on the past condition but also based on the existing condition of the surrounding cells. Based on this, cellular automata have spatial aspect, while the markov chain model did not present the spatial aspect. Up to present several researches have been conducted to develop the integration model from cellular automata model with GIS especially to apply in spatial aspects that have dynamic ways. Through the integration of cellular automata model with markov chain model, it raster base characteristics can be developed and modeled for the spatial changing model as the dynamic system. 20
51 The characteristic of cellular automata model is described with the five (5) characters (Sirakoulis et al., 2000): How many the spatial dimension (n) Width / distance for each side from a cell composition (w). Wj is the width from side to j from a cell composition, where j = 1, 2, 3,..n (total of the cells) j Width from the closest neigbour cell (d). dj is the closest neigbour distance along j side from j cell composition. Each cell condition of cellular automata Cellular automata rule, as the arbitrary function F Cell X condition, at time t = 1, is calculated based on F. F is the function from cell X condition at time (t) and the condition of surrounding cells at time (t) is known with rule as the change transition. The simple description from the two dimension cellular automata (n = 2), with the nearest neighbored distance d1 = 3 and d2 = 3, as the follow (figure 3) i 1, j - 1 i 1, j i 1, j + 1 i, j - 1 (i,j) (i, j + 1) i + 1, j - 1 i + 1, j i + 1, j + 1 Figure 3 The nearest neighbored from cell (i,j) is formed from cell (i,j) itself and eight (8) cell at it the adjacent (Sirakoulis et al., 2000). 21
52 3. METHODOLOGY 3.1. Time and Study Area The research was conducted from March until August The study area is located in the surrounding of Lore Lindu Lake (0 50 S 2 04 S and E E) in the North part of Lore Lindu National Park, Central Sulawesi, Indonesia. Specifically, the study area is in Kulawi Sub District and Donggala District. There are four (4) surrounding villages bordering the study area namely Puroo, Langko, Tomado and Anca. The following Figure 4 is the map of the study area, it shows the research area boundaries, roads, rivers, and the location of the villages. The detail of the map is shown in Appendix 1. Figure 4 Study Area Map The study area is 6,408 ha and categorized as the Lindu Enclave where 26 % from the enclave area is covered by the Lore Lindu Lake. It has an elevation of 22


53 m asl with the topography as the lacustrine area. The lithology area is formed from the alluvium and new Lacustrine Riverine. The following Figure 5 is the Lore Lindu Lake area. Figure 5 Lore Lindu Lake 23
54 3.2. Types of Data and Sources The following is the table to describe types data and source that were used in this research for wetland spatial data model. Table 6 Types of data and sources Data type Acquisition and Data source 1. Digital Data Landsat 7 ETM+ 28 Sept 2002 & 21 path/row 114/61 July 2006, USGS Land use/ land cover map 1983, National scale 1 : Coordinating Agency for Survey & Mapping. Digital Elevation Model 2000, Shuttle Radar Topography Mission Topography map sheet 1983, National , scale 1 : Coordinating Agency for Survey & Mapping. Soil map scale 1 : Balai Besar Litbang Sumberdaya Lahan Pertanian Description Multispectral image six (6) bands (visible, IR, middle-ir, far-ir) with spatial resolution 30 m, thermal image two (2) bands (band61 and band62) with spatial resolution 60 m and panchromatic image one (1) band with spatial resolution 15 m. Derived from Aerial Photographic 1983 Digital elevation data obtained from X/C bands, SRTM sensor, spatial resolution 90 m. 24
55 3.3. Hardware and Software The supporting tools in terms of software and hardware used include: a. Software GRASS (Geographic Resource Analysis Support System) is free open source software for spatial image preprocessing (radiometric correction, geo registration and image classification). Idrisi Kilimanjaro V.14 is used for spatial model processing (markov matrix analysis, Multi Criteria Evaluation (MCE), cellular automata model) and spatial model validation. b. Hardware Notebook Centrino 1.7 MHz 256 MB RAM, Global Positioning System (GPS) for field work Printer for printing writing proposal, report, photo, and map 3.4. Methods The following Figure 6 illustrates the general framework and specific flowchart to explain the objectives and the research questions. 25
56 Problem Identification & Objectives Literature Review Field Work Data Collection Spatial Data Spatial Model Pre-Processing (Image Restoration & Classification) Spatial Model Processing (Markov Chain Analysis, Multi Criteria Evaluation, Cellular Automata Model) Spatial Model Validation (Kappa Statistic Value) Wetland Change Prediction Analysis Result Figure 6 General Research Methodology 26
57 Spatial Model Pre-Processing Land Cover / Land Use Wetland Areas Image Processing a. Image Correction Landsat 7 ETM+ 28 Sept 2002 & 21 July 2006 were corrected by two categories of image correction: (1) radiometric correction and (2) geometric correction. The correction term is used as a means how to return the original conditions of the satellite imagery as well as the ground measurement, because the two satellite imageries will be compared to obtain land cover classification that can be used to show the change detection using markov chain model in the study area. The radiometric correction was used to restore the image by using sensor calibration concerned with ensuring uniformity of output across the face of the image, and across time. Radiance Calibration was used to convert DN (Digital Number) to absolute radiance values that are important for comparative analysis of several images taken by different sensors (MSS and ETM imagery). The equation relating to DN in remotely sensed data to radiance is as follows: RTM i L max i = Biasi + Qcal max i L min Qcal min i i DN i (2) (Markham & Barker 1986): Where: RTMi is the radiance value for band i; Lmin = Bias is the minimum spectral radiance (the spectral radiance that is scaled to QCALMIN in watts/(meter squared * ster * μm) can be seen from the header file; Lmax is the maximum spectral radiance ((the spectral radiance that is scaled to QCALMAX in 27
58 watts/(meter sq)) can be seen from the header file; DN is the digital number; Qcalmax = 255; and Qcalmin = 1. Two of Landsat satellite imagery were taken in this classification process as the data source for wetland classification map. These Landsat satellite imageries have acquisition date 2002 and Before these imageries were classified then are needed to rectify using radiometric correction in order to remove atmospheric noise. Geo registration process to rectify these two imageries with the same position each other is also done using polynomial method. After rectification process is finished then image classification process was created using maximum likelihood method. The following figure 7 explains the flowchart to obtain wetland classification map in the research area. 28
59 Lindu Enclave area & Lindu Lake Landsat 2002 Landsat 2006 Radiometric Correction - Sensor Calibration - Dark Pixel Correction RBI Map derived from aerial photography 1983 Geometric Correction Training Area - Image Registration & Rectification Collect GCP Field Work No Image Supervised Classification Maximum Likelihood Accuracy assessment Yes Wetland Classification Map 2002 & 2006 Figure 7 Wetland Classification Maps Process (Image Pre-processing) 29
60 Atmospheric correction using dark pixel correction method was also used to remove path radiance due to atmospheric scattering. The Dark Pixel Correction (DPC) is used to minimize the DN value to zero for all the dark objects The geometric correction was done for Landsat MSS and Landsat TM imagery. Image rectification was applied to Landsat TM image with Ground Control Point (GCP) that are obtained from the GPS (Global Positioning System), after that image registration was also done for the Landsat TM image to the 1983 aerial photography land use as the rectified image. This geometric correction is performed to obtain good accuracy if the two Landsat images are overlaid then the change detection area can be detected as well as the earlier image. b. Field Work / Ground Check Field work or ground check process was conducted in the Lore Lindu Lake area to obtain Ground Control Point (GCP) for Image Rectification process, Land Cover check to compare with the accuracy of image classification result, soil map was crosschecked in the field with the existing soil map. Furthermore, field observation was also performed to observe the type of the wetland area in the study area so the plotting of the geographic location can be known for each wetland type that can be inputted into the image classification type. c. Image Classification Classification is the process of developing spatial model map from Landsat TM 2006 image. As a consequence, classification is perhaps the most important aspect of image processing to obtain spatial model map as the input in markov chain and cellular automata process. 30
61 The processes to obtain land cover and wetlands classification map consist of; Define training sites The first step in undertaking a supervised classification is to define the areas that will be used as training sites for each land cover class and wetland types. In general, the training sites are taken at least 10 times as many pixels for each training class of each band will be classified. Thus, for a Landsat TM image with seven bands, at least 70 pixels per training class. Signature Extraction After the training site areas have been collected, the next step is to create statistical characterizations of each informational class. The signature file will contain a variety of information about the land cover classes they describe. These include the names of the image bands from which the statistical characterization was taken, the minimum, maximum and mean values on each band, and the full variance/covariance matrix associated with that multispectral image band set for that class. This statistical data could be used to analyze the training sites whether it can be used or not to classify the image. Classify the image Finally, after the training sites for each land cover class fulfilled the ground check result then the next step is to create image classification using maximum likelihood classification method. d. Accuracy Assessment The final stage of the classification process usually involves an accuracy assessment. Traditionally this is done by generating a random set of locations 31
62 through ground check for verification of the true land cover type. A simple value file is then made to record the true land cover class (by its integer index number) for each of these locations. This value file is then used with the vector file of point locations to create a raster image of the true classes found at the locations examined. This raster image is then compared to the classified map. The tabulation is the relationship between true land cover classes and the classes as mapped. It also tabulates errors of omission and errors of commission as well as the overall proportional error. The size of the sample (n) to be used in accuracy assessment can be estimated using the following formula: n = z2 pq / e2 (3) Where; z is the standard score required for the desired level of confidence (e.g., 1.96 for 95% confidence, 2.58 for 99%, etc.) in the assessment e is the desired confidence interval (e.g., 0.01 for 10%) p is the a priori estimated proportional error, and q = 1 p Topography Image Processing a. Slope Map The slope class or gradient, of each portion of a landscape can be derived from an analysis of SRTM (Shuttle Radar Topography Mission) with spatial resolution of 90 meters. The slope class values are measurements that indicate the steepness of a landscape. The slope map was created to attain the possibility of the wetland area that usually occurs in the low slope area and then this slope map was 32
63 classified from the low to the high scale suitable map for wetland area that will be used in Multicriteria Criteria Evaluation (MCE) methods Spatial Model Processing Markov Chain Analysis The general procedure of using Markov Chain Analysis for wetland area can be seen from the following flowchart (Figure 8). Wetland types Image classification For 1983 Wetland types Image classification For 2002 Transition Matrix Trend / Prediction Figure 8 Markov Chain Model for Wetland Classification The markov chain is one application of change detection that can be used to predict future changes of wetland area in Lore Lindu Lake area based on the rates of past changes and on the probability that a given piece of wetland will change from one mutually exclusive state to another. These probabilities are generated from past changes and then applied to predict future changes. The first step is to create a matrix cell/pixels expected to change between classes. The result is the cell/pixels expected to change from a class in 1983 to another class in 2002 out of all possible changes. The next step is to create a transition matrix probability change of pixels in each wetland class for two time 33
64 periods using Landsat data imagery. This is accomplished by dividing each cell value by its row total and basically the same as the cross-tabulation matrix that can be used for accuracy assessment. The main diagonal of the matrix contains pixels that have no changes, while other cells contain pixels that have changed. Table 7 Cells/pixels expected to change of wetland area for 1983 until Class Class Class Class Class sum1983 Class 1 Class 2 Class 3 Class Class 5 sum 2002 Table 8 Transition Probability Matrix of wetland area for 1983 until Class 1 Class 2 Class 3 Class 4 Class 5 Class 1 Class 2 Class 3 Class Class 5 34
65 Multi Criteria Evaluation (MCE) Multi-Criteria Evaluation is concerned with how to combine the information from several criteria to form a single index of evaluation (Eastman 2003). A weight linear combination is used to obtain suitability map for wetland area, the factors are combined by applying a weight to each followed by a summation of the results to yield a suitability map. S = Σ Wi Xi (Voogd, 1983). (4) Where S = suitability Wi = weight of factor i Xi = criterion score of factor i Based on this equation, the suitability map for wetland area was developed using several parameters for wetland area that are; topography map (slope map), soil map for wetland area, and the probability of land cover map for wetland area. S = ax1 + bx2 + cx3.... (5) Where S = suitability area for wetland X1 = Slope map derived from Digital Elevation Model (DEM) X2 = Soil map X3 = Land cover map for wetland area from 1989 until 2002 derived from Landsat image a, b, c = Weighting factors for each variable After getting the suitability map of wetland area using MCE method then the next step is to create the cellular automata model process. For spatial simulation, the Lore Lindu Lake was created as the constraint area assuming that the area will not change for the time period of 19 years from now. 35
66 Cellular Automata Model By definition, a cellular automaton is an agent or object that has the ability to change its state based upon the application of a rule that relates to the new state to its previous state and those of its neighbors (Eastman 2003). Based on this definition, markov probability transition matrix and the suitability map for wetland area obtained from MCE model was inputted into Cellular Automata model to attain the spatial prediction map for wetland area. A cellular automaton not only depends on the previous state (Markovian process), but also on the state of the local neighborhood so the filter class 3 X 3 will be used in this case. Due to the use of Conway s Game of Life rules for cellular automata so the alive or dead automata follow the criteria as mentioned below: A cell assumed as the wetland area becomes alive if there are three living automata as wetland areas in the 3x3 neighborhood (known as the Moore neighborhood) surrounding the cell. The cell will stay alive so long as there are 2 or 3 living neighbors. Fewer than that, it dies from loneliness or it can be said that wetland area will change to another land cover type if only one cell is assumed as the wetland area; in addition it will compete with other resources. Cellular automata model needs the wetland classification map as the input that will be projected, while the transition area file was produced by markov analysis from analysis of 1983 aerial photography land use and Landsat TM 2002 images. Furthermore, the suitability map for wetland area obtained from MCE model is also used as the suitability map expressing the suitability of a pixel for wetland area under several considerations. 36
67 The first step is the wetland area classification map derived from aerial photography 1983 which will be predicted until 2002, and then the result of prediction map for 2002 is validated using wetland classification map The second step is to predict again from 1983 until 2006 and is validated using wetland classification map 2006 after it has fulfilled the standard Kappa Index then wetland prediction model is created for Kappa index is used to check the results whether the model is true or not (usually the Kappa Index for the standard agreement is > 70 %). If the model has the Kappa Index less then 70 % then the suitability map for the wetland area should be repeated again based on several considerations, otherwise, if the model result is more than > 70 % then the last step is to create the spatial model for 2021.The following figure 9 is the markov cellular automata model for wetland change prediction area. Classification Wetland area 1983 Suitable area for Wetland based on MCE Markov Probability Markov and Cellular Automata simulation No KAPPA Validation < 70% Wetland change prediction map 2002 Validation Classification Wetland area 2002 No Yes KAPPA Validation > 70% KAPPA Validation < 70% Wetland change prediction map for 2006 Validation Classification Wetland area 2006 Wetland change prediction map for 2021 KAPPA Validation > 70% Yes Figure 9 Markov Cellular Automata Model 37
68 Spatial Model Validation As mentioned previously, an important stage in the development of any predictive change model is validation. Typically, the power of the model is used to predict some period of time when the land cover conditions are known. This is then used as a test for validation. The comparative analysis on the basis of the Kappa Index of Agreement is used as the base for validation. Kappa is essentially a statement of proportional accuracy, adjusted for chance agreement. However, unlike the traditional Kappa statistic, the validation is generated into several components, each with a special form of Kappa or associated statistic (based on the work of Pontius (2000)): Kappa for no information = Kno Kappa for location = Klocation Kappa for quantity = Kquantity Kappa standard = Kstandard Value of Perfect Information of Location = VPIL Value of Perfect Information of Quantity = VPIQ Based on this, the spatial prediction model from cellular automata for wetland 2002 and 2006 classification map are validated using Kappa Statistic Validation (same as above) to evaluate the spatial model that is satisfy or not. 38
69 4. RESULT & DISCUSSION Wetland area in Lore Lindu enclave was classified by three different acquisition dates of imagery data, there are aerial photography 1983, Landsat TM 2002 and Landsat TM As mentioned in the previous chapter, the three images were obtained from three classification maps of the same wetland areas with different time series. Afterwards, multi criteria evaluation process was done to obtain suitable area for wetland area and followed by markov chain analysis. Finally, spatial model for wetland change prediction would be created with cellular automata model. The result of cellular automata model would be used as spatial distribution prediction for wetland change area in Lindu Enclave area. In each of the sub-chapter, more details would be described as the results of wetland change prediction area process Wetland in Lindu Enclaves Image Correction Due to atmospheric path, Landsat imageries were corrected as the atmospheric correction with dark pixel correction method. This method assumes that every dark pixel should have digital number value 0. The following figures 10a and 10b show the scatter plot that is displayed for Landsat imagery before and after atmospheric correction. 39
70 (a) Before atmospheric correction (b) After atmospheric correction Figure 10 Atmospheric Correction After atmospheric correction has been done, the next step was to do geo registration between aerial photography 1983, Landsat TM 2002 and Landsat TM 2006 imagery. The geo registration process was done in order to obtain good accurate image position for each class as the wetland change detection. Therefore, polynomial method was used as the geo coding type while polynomial order used linear transform. The following Figures 11a, 11b and table 9 show geo registration 40
71 process and RMS (Root Mean Square) error that have been done for these two imageries. (a) Land cover derived from aerial photography 1983 (b) Landsat TM 2002 Figure 11 Geo registration process 41
72 Total number of GCPs: 10 Number turned on : 10 Warp order : 1 GCP CORRECTED map projection details: Map Projection: SUTM51 Datum : WGS84 Rotation : Table 9 Root Mean Square table for geo registration process Point On Locked Cell-X Cell-Y To-X To-Y To-Z "1" Yes No "2" Yes No "3" Yes No "4" Yes No "5" Yes No "6" Yes No "7" Yes No "8" Yes No "9" Yes No "10" Yes No RMS error report: Warp Type - Polynomial -----ACTUAL PREDICTED--- Point Cell-X Cell-Y Cell-X Cell-Y RMS "1" "2" "3" "4" "5" "6" "7" "8" "9" "10" Average RMS error: Total RMS error:
73 Based on the above tables, the RMS error for this geo registration is and the total RMS error is Analytically, it can be said that the result for this geo registration process still meets the standard geo registration process that should have minimum RMS error of 1. On the other hand, The Landsat TM 2006 also has good RMS error for this geo registration process is about as well as Landsat TM After this geo registration process, the 1983 land cover can be overlaid with the Landsat TM 2002 and Landsat TM 2006 to observe the wetland change detection between these two imageries Image Classification After geo registration process has been done, the next step is to classify the Landsat TM 2002 & Landsat TM 2006 with supervised classification. In this classification, the imagery is classified with maximum likelihood method. Training samples areas were collected based on field work ground check and minimum sample size per class is 70 pixels. The results of classification image based on maximum likelihood supervised method are displayed in the following Figure 12a and 12b. 43

74 (a) Figure 12 Supervised Classification with Maximum Likelihood method for Land cover / Land use classification map 2002 & 2006 (b) 44
75 The following are the area calculation tables and the graphics of the area calculation for 2002 & 2006 Land cover / Land use map: Table 10 Area calculation for Land cover / Land use Classification Map 2002 & 2006 Classification Class Area (ha) Water Body Agriculture Marsh and Bush land (natural wetland) Coffee Forest Paddy Field (Human made wetland) Settlement (a) Area Calculation 2002 Classification Class Area (ha) Water Body Agriculture Marsh and Bush land (natural wetland) Coffee Forest Paddy Field (Human made wetland) Settlement (b) Area Calculation
76 (a) Graphic of Land cover / Land use area Calculation 2002 Area (Ha) Class Water Body Agriculture Marsh Coffee Forest Paddy Field Settlement (b) Graphic of Land cover / Land use area Calculation 2006 Area (Ha) Class Water Body Agriculture Marsh Coffee Forest Paddy Field Settlement Figure 13 Area calculations for land cover / land use classification map 2002 & 2006 After Land Cover / Land Use classification has been obtained, and then the next step is to classify them into wetland classification map with four main class categories which are natural wetland, human made wetland, non wetland area and water. The following Figures 14 show the wetland classification map of 2002 & 46

77 2006 followed by area calculation and transforming into the graphic of wetland classification area of 2002 & (a) Figure 14 Wetland Classification Maps 2002 and 2006 (b) 47
78 Table 11 Area calculation for Wetland Classification Map 2002 & 2006 Classification Class Area (ha) Water Body Non Wetland Area Natural Wetland Human Made Wetland (a) Wetland Classification Map 2002 Classification Class Area (ha) Water Body Non Wetland Area Natural Wetland Human Made Wetland (b) Wetland Classification Map 2006 Graphic of Wetland area Calculation Area (Ha) Class Water Body Non Wetland Area Natural Wetland Human Made Wetland (a) 48
 Figure 15 Area calculations wetland classification map 2002 & 2006 On the other hand,")

79 Graphic of Wetland area Calculation 2006 Area (Ha) Class Water Body Non Wetland Area Natural Wetland Human Made Wetland (b) Figure 15 Area calculations wetland classification map 2002 & 2006 On the other hand, classification map that has been obtained from aerial photography in 1983 is also portrayed in the following Figure 16 and Table 12 as 1983 wetland spatial distribution and area calculation. Figure 16 Classification Map 1983 derived from aerial photography 49
80 Table 12 Area calculation for Classification Map 1983 Classification Class Area (ha) Water Body Agriculture Marsh and Bush land (natural wetland) Coffee Forest Paddy Field (Human made wetland) Settlement Graphic of Land Cover / Land Use Area Calculation 1983 Area (Ha) Class Water Body Agriculture Marsh Coffee Forest Paddy Field Settlement Figure 17 Area calculation for Land Cover / Land Use Area 1983 derived from aerial photography 50
81 Figure 18 Wetland Classification Map 1983 Table 13 Area Calculation Wetland Classification Map 1983 Classification Class Area (ha) Water Body Non Wetland Area Natural Wetland Human Made Wetland
82 Graphic of Wetland area Calculation 1983 Area (Ha) Class Water Body Non Wetland Area Natural Wetland Human Made Wetland Figure 19 Area calculations for Wetland Classification Map 1983 Table 14 Area statistics for Wetland annual change rate in Lindu Enclave area Class Area Area Change % rel Annual Change Change (ha) (ha) Rate (%) Water Body Agriculture Marsh & Bush land Coffee Forest Paddy Field Settlement
83 Based on the above tables and graphics, the forest area changed from 1983 until 2002: hectares to hectares or an annual change rate of 0.8 %. Natural wetland area (marsh) had also decreased from 1983 until 2002 (from hectares to hectares or an annual change rate of -0.1 %). Otherwise, settlement area has increased significantly from hectares to hectares or a significant annual change rate of 3.4 %. Agriculture has also increased from hectares into hectares or 2.5 % annual change rate. Human construction wetland (paddy field) from 1983 until 2002 has increased from hectares to hectares or 1 % annual change rate. Human intervention has affected Lindu enclaves. The changes are from forest to the wetland area especially construction wetland area. The change happened as the forest was converted to areas with more social economic value such as paddy field and fish ponds Accuracy Assessment The results of the wetland classification maps were checked with accuracy assessment method in order to obtain the level of map accuracy. As mentioned previously, standard map accuracy is more than 70 %. It can be said that these maps have been classified with good training samples area, represent good wetland and ground areas, which were then transformed into digital paper maps. The following Table 15 shows the results of the accuracy assessment using kappa index of agreement (KIA) for Land Cover / Land Use classification map in
84 Table 15 Land Cover / Land Use Classification 2002 Accuracy Assessment Category KIA 1 Water Agriculture Marsh and Bush land Coffee Forest Paddy Field Settlement Overall Kappa = Based on the two tables above, Land Cover / Land Use map classification for 2002 can be processed or used for markov cellular automata model. This map has overall Kappa Index > +/- 90 % and for error commission more than 90 %. This means that training samples area based on ground truth has fulfilled classification method to obtain good classification maps. In this classification process, there are two difficulties to get high overall kappa index and error commission. The first difficulty is cacao and coffee area which can not be easily classified based on spectral base. The reason is forest vegetation, cacao and coffee areas always have the same digital values. Therefore, the ground truth area and classification results for cacao and coffee area are always misplaced with forest area. The second difficulty is the stripping area and cloud cover for Landsat TM This is also an obstacle for wetland classification process because stripping area has reduced the image quality. Therefore, the result of the map also misses several parts. Furthermore, cloud 54
85 cover is also the main problem for identification of all imagery classes. With the presence of the clouds, the terrain data that contain the land cover data cannot be recorded for the purpose of image processing. 4.2 Multi Criteria Evaluations for Wetland Area The following figure will explain the result of the multi criteria evaluation model (MCE) as the suitable area for wetland. Multi criteria evaluation for wetland area was obtained from three variables that were overlaid together into one output suitable area. The three variables consist of slope (topography area), soil, and land cover area. The result of multi criteria evaluation model for Lindu Enclaves is shown in the following figure. Figure 20 Suitable Slope for Wetland area 55
86 Figure 21 Suitable Soil for Wetland area Figure 22 Suitable Land Cover for Wetland area 56
87 Figure 23 Wetland Suitability Areas in Lore Lindu Enclaves Based on the above wetland suitability map that has been created with Multicriteria evaluation model, the high suitability area for wetland area is located in the South East of Lindu enclave area or this location was occupied by natural wetland area which is marsh area. However, the existing forest areas have low suitability for wetland because it has steep slope that cannot be occupied by water as one of the wetland parameters. Furthermore, settlement and agricultural areas have moderate suitability for wetland based on the topography and soil map. 57
88 4.3 Markov Chain Analysis for Wetland Area Matrix transition probability of markov change model was calculated against all Land Cover / Land Use classification class based on 1983 and 2002 classification map. Types of Land Cover / Land Use classification map consist of: Table 16 Land covers / Land use classification types 1. Water Body 2. Paddy Field 3. Agriculture 4. Forest 5. Marsh and Bush land 6. Coffee 7. Settlement Matrix cells/pixels expected to change and matrix transition probability that have been obtained from 1983 aerial photography and 2002 Landsat imagery classification is the reflection for 2021 of Lindu Enclaves activities. Matrix configuration was calculated with 19 years intervals. Furthermore, the result of matrix transition that as shown in the following table were also used as the basic wetland change prediction model simulation to predict the change that will occur within 19 years from
89 Table 17 Cells/pixels expected to change Cl. 1 Cl. 2 Cl. 3 Cl. 4 Cl. 5 Cl. 6 Cl. 7 Class 1 : Water Class 2 : Agriculture Class 3 : Marsh and Bush land Class 4 : Coffee Class 5 : Forest Class 6 : Paddy Field Class 7 : Settlement Table 18 Probability Change Cl. 1 Cl. 2 Cl. 3 Cl. 4 Cl. 5 Cl. 6 Cl. 7 Class 1: Water Class 2: Agriculture Class 3: Marsh and Bush land Class 4: Coffee Class 5: Forest Class 6: Paddy Field Class 7: Settlement Wetland Change Prediction Area Wetland change prediction area using markov cellular automata model was obtained from three variables that have been overlaid as markov cellular automata model process. It needs a few factors as the input files such as basis land cover image (Wetland classification map 1983 derived from aerial photography), markov transition areas file, transition suitability image, which is derived from Multicriteria evaluation process, number of projection year (i.e. 19 years), and cellular automata filter type (standard 3 x 3 contiguity filter). The result of the land cover change prediction area and wetland change prediction area based on markov cellular automata model can be seen in the following Figure 24 and 25 which describe detailed information about Lindu Enclaves. 59
 Classification wetland 2002 from Landsat TM 2002 (b) Simulation Model Wetland classification 2002 Figure 25 Wetland classification map 2002 and")
90 (a) Land Cover / Land Use Classification map 2002 from Landsat TM 2002 (b) Simulation Model Land Cover / Land Use classification 2002 Figure 24 Land Cover / Land Use classification map 2002 and Simulation Model Land Cover / Land Use 2002 (a) Classification wetland 2002 from Landsat TM 2002 (b) Simulation Model Wetland classification 2002 Figure 25 Wetland classification map 2002 and Simulation Model Wetland
91 Based on wetland map 1983 as the basis map, suitability wetland area and Markov transition area, the simulation model was created to predict 2002 wetland map as the wetland simulation model. The result of the model was then compared with classification map that has been derived from Landsat TM 2002 using Kappa index. It was used to check the results whether the model it is true or not (usually the Kappa Index for the standard agreement is > 70 %). In this model, the Kappa Index simulation model is 72 % so this Markov cellular automata model can be used further to predict wetland change prediction model for The following Figures 26a, 26b, 26c, 26d display Land Cover / Land Use change prediction model from 1983, 2002, 2006 and (a) (b) 61
. (a) (b) 62")
92 (c) (d) Figure 26 Land Cover / Land Use Classification Maps 1983, 2002, 2006 and Land Cover / Land Use Change Prediction Map 2021 as Markov Cellular Automata Model Results The following Figures 27a, 27b, 27c, and 27d display Wetland change prediction model from 1983, 2002, 2006 and 2021 (for detail map display see Appendix 2, 3, 4 and 5). (a) (b) 62
93 (c) (d) Figure 27 Wetland Classification Maps 1983, 2002, 2006 and Wetland Change Prediction Map 2021 as Markov Cellular Automata Model Results 63
94 Table 19 Area statistics for Wetland annual change rate in Lindu Enclave area Class Area Area Change % rel Annual Change Change (ha) (ha) (ha) Rate (%) Water Body Agriculture Marsh & Bush land Coffee Forest Paddy Field Settlement Land Cover / Land Use Change Area Area (Ha) Water Agriculture Marsh & Bush land Coffe Forest Paddy Field Settlement Year (a) 64
95 Settlement Paddy Field Forest Coffe Marsh & Bush land Agriculture Water (b) Figure 28 Graphic of Land Cover / Land Use Change Area from 1983 to 2021 Based on the above spatial wetland model prediction 2021 and area calculation, the natural wetland area (marsh area) will decrease from 2, hectares to hectares in 2021 or -0.1 % annual change rate. Forest area was predicted to decrease in 2021 from hectares to hectares or -0.7 % annual change rate. In this case, forest has the highest annual change rate and if this always occurs then forest area will disappear in Lindu enclaves as well as natural wetland area (marsh area) with -0.1 % annual change rate. On the other hand, construction (man - made) paddy field wetland area will increase from hectares to hectares or 0.7 % annual rate change in This will also happen to agricultural and cacao / coffee area that have an annual rate change of 1.1 % and 0.6 % per year. In addition, settlement area is predicted to increase each year from hectares to hectares or 1.2 % annual change rate. Annual change rate of 1.2% is the highest for Lindu enclave. Therefore, it can be concluded that settlement area always increases every year and social economic factor has high impact to increase social economic land use 65

")


96 such as cacao / coffee and agriculture sector. Man -made wetland area (i.e. paddy field area) is also predicted to increase in 2021, assuming that paddy field area has high economic value for local people. On the contrary, marsh area as natural wetland area and forest area will decrease due to land conversion for higher socio economic valued agriculture by the local communities. Figure 29 Cut forest area for agriculture and cacao/coffee area 66
97 5. CONCLUSIONS & RECOMMENDATION 5.1 Conclusion Lindu enclaves have two wetland types; natural wetland (marsh and bush land) and construction / man - made wetland (paddy field and fish pond). It consists of 2, hectares of natural wetland area (marsh) and 1, hectares of man - made / construction wetland area (paddy field) in After that, in 2002 Lindu enclave area consists of 2, hectares of natural wetland area (marsh) and 1,450.2 hectares man - made / construction wetland area (paddy field). Natural wetland (marsh and bush land) dominated the spatial distribution in the Southern and Western parts of the Lindu enclave area. On the other side, man- made / construction wetland spreads in all areas, with the largest paddy field area located in Kanawu sub-district. (South Eastern area of Lindu Enclave). The changes of wetland area in Lindu enclave area for natural wetland (marsh) was hectares ( ) with 0.1 % annual change rate and hectares area for human made / construction wetland area (paddy field) with 1.2 % annual change rate. Therefore, construction wetland (paddy field) can be analyzed as having good socio economic value for local people but for ecological value it gives negative impacts. The same is true to natural wetland area (marsh) that will give positive impact from ecological side however this area always decreases every year. The suitable area for wetland was located in every enclave area, however the most suitable area was located at the Southern part of Lindu enclave area. The prediction of spatial distribution for natural wetland area in 2021 will decrease with an annual change rate of -0.1 %. Because Lindu enclave area has 67
98 slow rate of change area both from socio economic and hydrologic factors. However, human made wetland such as paddy field area will increase to hectares in 2021 with 0.7 % annual change rate. Markov Cellular automata model can be used to predict wetland change area in Lindu enclave area. The accuracy of simulation result was determined from Markov probability transition and existing spatial suitable area for wetland area. 5.2 Recommendation The result of this spatial simulation model for wetland area can be used as the base spatial planning map to predict what will happen in the future. Water availability for Lore Lindu National Park can be assessed through its ecological and socio economic assessments. This model can be used for local government, stakeholders, and local people / community in Lindu Enclave. It is important to maintain and preserve natural resources in a sustainable way. 68
99 6. REFERENCES Aaviksoon, K Simulating Vegetation Dynamics and Land Use in a Mire Landscape Using a Markov Model. Landscape and Urban Planning, 31 : Batty, M Urban Evolution on the Desktop : Simulation with The Use of Extended Cellular Automata. Environment and Planning, A.30 : Bell, E.J Markov Analysis of Land Use Change an Application of Stochastic to Remotely Sensed Data. Geographical Analysis, 28(1): Bell, E.J Markov Analysis of Land Use Change: Continuous Time and Stationary Process. Socio-Econ Planning Science, 11: Bell, E.J. and Hinojosa, R.C Markov Analysis of Land Use Change: Continuous Time and Stationary Process. Socio-Econ Planning Science, 11:13-17 Brown, L.A On the Use of Markov Chains in Movement Research. Economic Geography, 46: Brown, D.G., B.G, Pijanowski and J.D., Duh Modelling the Relationships Between Land Use and Land Cover on Private Lands in the Upper Midwest, USA. Journal of Environmental management, 59: Burrough, P. A., Principles of Geographic Information Systems for Land Resources Assessment, Oxford University Press, New York, 1986, 193 pp. Collin, Clark Industrial Size Distributions and Stochastic Process. Progress in Geography, 5: Couclelis, H Cellular worlds: a framework for modeling micro-macro dynamics, Environment and Planning A, 17,
100 Cowardin, L. M., & et. al. (1979). Classification of wetlands and deep water habitats of the United States. Washington, D.C: US Fish and Wildlife Service. 45 p Dueker, K. J Land resource information systems: a review of fifteen years experience. Geo-Processing 1: Eastman, J. R. (2003). IDRISI Kilimanjaro: Guide to GIS and Image Processing. Worcester, MA: Graduate School of Geography, Clark University Farinha, J. C., Costa, L. T., Zalidis, G., Mantzavelas, A., Fitoka, E., Hecker, N., & Tomas Vives, P. (Eds.). (1996). Mediterranean Wetland Inventory: A Reference Manual. (Vol. III): MedWet / Instituto da Conservacao da Natureza / Wetlands International Publication. Federal Interagency Committee for Wetland Delineation, Federal Manual for Identifying and Delineating Jurisdictional Wetlands. U.S. Army Corps of Engineers, U.S. Environmental Protection Agency, U.S. Fish and Wildlife Service, and USDA Soil Conservation Service. Cooperative technical publication, 1987, 76 pp. plus appendices. Gardner, M The fantastic combinations of John Conway s new solitaire game of Life, Scientific American, 223(4), Hashimoto, T., M. Takagi, K. Kajiwara and C. Fucino. (Eds) Remote Sensing Note. Japan Association on Remote Sensing. Hathout, S The Use of GIS for Monitoring and Predicting Urban Growth in East and West St. Paul, Winnepeg, Manitoba, Canada. Journal of Environmental Management, 66:
101 Herdendorf, C, E., Raphael, C. N., and Jaworski, E. The Ecological of Lake St. Clair Wetlands: A Community Profile. U. S. Fish and Wildlife Service. Biological Report 85 (7.7), 1986, 187 pp Irwin, E.G., Geoghegan Jacqueline Theory, Data and Methods : Developing Spatially Explicit Economic Models of Land Use Change. Agriculture Ecosystem and Environment, 85 : Jensen, J.R. (1986) Introductory digital image processing: a remote sensing perspective, Englewood Cliffs: Prentice-Hall. Lambin, E. F Modeling Deforestation Processes. A Review. TREES SERIES B. Research Report No. 1, Luxembourg. Logsdon, M. G, Earl J. B and Frank V.W Probability Mapping of Land Use Change: A GIS Interface for Visualizing Transition Probabilities. Computers, Environment and Urban Systems, 20(6) : Lillesand, T. M and Kiefer, R. W., Remote Sensing and Image Interpretation, John Wiley & Sons, New York, 1987 Lyon, J., Analyses of Coastal Wetland Communities: The St. Clair Flats, Michigan, M.S. Thesis, School of Natural Resources, Univ. Of Michigan, Ann Arbor, MI, 1979, 80 pp. Miyamoto, M., K, Yoshino., K, Kushida., Y,Sato Vegetation Mapping of Kushiro Wetland in Northeast Hokkaido, Japan: Application of SPOT images, Aerial Ballon Photographs and airbone color near infrared (CNIR) Images for Classification. ACRS proceeding. Paredes, M., M., I Modelling Of Wetland Habitat Availability And Distribution Under Management Alternatives (A case study of the Fúquene 71
102 Lake, Colombia). Msc Thesis of International Institute for Aerospace Survey and Earth Sciences (ITC). Netherlands. Pontius Jr., R.G., Quantification error versus location error in comparison of categorical maps. Photogrammetric Engineering and Remote Sensing. 66(8) pp Ramsar. (2003). Convention on Wetlands (Ramsar, Iran, 1971). Ramsar secretariat. Retrieved , 2007, Scott, D.A Design of Wetland Data Sheet for Database on Ramsar Sites. Mimeographed report to Ramsar Convention Bureau, Gland, Switzerland. Sharafat Ali, Saha N.C. and Suraj Bhan (1991). Wetland resources mapping in West Bengal using remotely sensed data. Nat. Symp. Remote Sensing of Environment. Dec , 1991, Madras. pp.39. Sirakoulis, G. Ch., I, Karafyllidis, A, Thanailakis A Cellular Automaton Model for the Effects of Population Movement and Vaccination on Epidemic Propagation. Ecological Modelling. 133 : Tamura, M., Y, Yasuoka., K, Tokumura Observation of western Siberian Wetlands by using remote sensing techniques: Estimation of methane emission. ACRS Proceeding. The Nature Conservancy Lore Lindu National Park Central Sulawesi, A visitor s guide. Directorate General of Forest Protections and Nature Conservation. Toffoli, T. and Margolus, N Cellular Automata Machines: A New Environment for Modeling, Cambridge, MA: The MIT Press 72
103 Veldkamp and Lambin E.F Predicting Land Use Change. Agriculture, ecosystem and Environement. 85: 1-6 Washington State Wetlands and Delineation Manual, Wetland Delineation Manual. Weng, Q Land Use Change Analysis in the Zhujiang Delta of China using Satellite Remote Sensing, GIS and Stochastic Modeling. Journal of Environmental Management. 64: Yasuoka, Y., Y, Yamagata., M, Tamura., M, Sugita., J, Pornprasertchai., S, Polngam., R, Sripumin., H, Oguma., and X, LI Monitoring of Wetland Vegetation Distribution and Change by Using Microvave Sensor Data. 73
104 APPENDIX 74
105 Appendix 1 Study Area Map 75
106 Appendix 2 Wetland Classification Map
107 Appendix 3 Wetland Classification Map
108 Appendix 4 Wetland Prediction Area
109 Appendix 5 Wetland Prediction Area


110 Appendix 6 Wetland Type in Lindu Enclave Figure Lore Lindu Lake Figure Marsh area with bird (Natural Wetland) 80

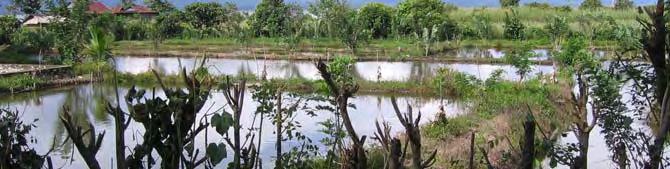


111 Figure Fish Pond (Constructed Wetland Human Made) Figure Paddy field (Constructed Wetland Human made) 81


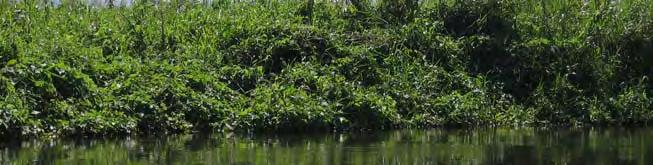

112 Figure Paddy field change to marsh / shrubs Figure Wetland Vegetation type 82


113 Appendix 7 Socio economic activities in Lindu Enclave Figure Mujair fish that were taken from Lore Lindu Lake Figure Fisheries as major local community activities 83


114 Appendix 8 Land cover / Land use in Lindu Enclave Coffee Cacao 84

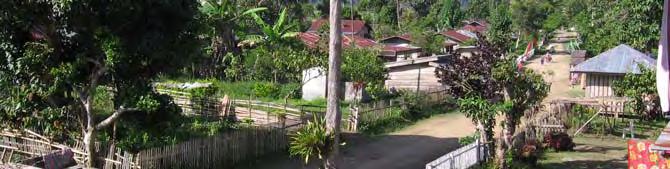


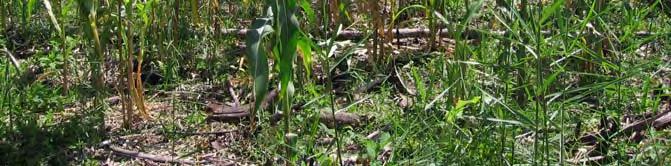
115 Corn Settlement 85


116 Forest area, grass land and shrub 86


117 Appendix 9 Soil types in Lindu Enclave Figure Alluvial Hidromorf / Brown Forest and Podsolik Soil types 87
DEVELOPMENT OF LAND SUITABILITY EVALUATION SYSTEM FOR COASTAL AQUACULTURE USING ARTIFICIAL NEURAL NETWORK AND GEOGRAPHICAL INFORMATION SYSTEMS
 DEVELOPMENT OF LAND SUITABILITY EVALUATION SYSTEM FOR COASTAL AQUACULTURE USING ARTIFICIAL NEURAL NETWORK AND GEOGRAPHICAL INFORMATION SYSTEMS Case Study: Mahakam Delta, East Kalimantan I KETUT SUTARGA
RESEARCH METHODOLOGY
 III. RESEARCH METHODOLOGY 3.1. Time and Research Area The field work was taken place in primary forest around Toro village in Lore Lindu National Park, Indonesia. The study area located in 120 o 2 53 120
SEMINAR AND EXAMINATION. MSc in Information Technology for Natural Resource Management Bogor Agricultural University
 SEMINAR AND EXAMINATION MSc in Information Technology for Natural Resource Management Bogor Agricultural University Name : Candra Dewi Student ID : G051060021 Research Tittle : Spatial Multi Criteria Analysis
Quick Response Report #126 Hurricane Floyd Flood Mapping Integrating Landsat 7 TM Satellite Imagery and DEM Data
 Quick Response Report #126 Hurricane Floyd Flood Mapping Integrating Landsat 7 TM Satellite Imagery and DEM Data Jeffrey D. Colby Yong Wang Karen Mulcahy Department of Geography East Carolina University
Coastal Landuse Change Detection Using Remote Sensing Technique: Case Study in Banten Bay, West Java Island, Indonesia
 Kasetsart J. (Nat. Sci.) 39 : 159-164 (2005) Coastal Landuse Change Detection Using Remote Sensing Technique: Case Study in Banten Bay, West Java Island, Indonesia Puvadol Doydee ABSTRACT Various forms
Application of Remote Sensing Techniques for Change Detection in Land Use/ Land Cover of Ratnagiri District, Maharashtra
 IOSR Journal of Applied Geology and Geophysics (IOSR-JAGG) e-issn: 2321 0990, p-issn: 2321 0982.Volume 3, Issue 6 Ver. II (Nov. - Dec. 2015), PP 55-60 www.iosrjournals.org Application of Remote Sensing
Copyright is owned by the Author of the thesis. Permission is given for a copy to be downloaded by an individual for the purpose of research and
 Copyright is owned by the Author of the thesis. Permission is given for a copy to be downloaded by an individual for the purpose of research and private study only. The thesis may not be reproduced elsewhere
UNITED NATIONS E/CONF.96/CRP. 5
 UNITED NATIONS E/CONF.96/CRP. 5 ECONOMIC AND SOCIAL COUNCIL Eighth United Nations Regional Cartographic Conference for the Americas New York, 27 June -1 July 2005 Item 5 of the provisional agenda* COUNTRY
Modeling the Change of Mangrove Forests in Irrawaddy Delta, South Myanmar
 International Journal of Sciences: Basic and Applied Research (IJSBAR) ISSN 2307-4531 (Print & Online) http://gssrr.org/index.php?journal=journalofbasicandapplied ---------------------------------------------------------------------------------------------------------------------------
Harrison 1. Identifying Wetlands by GIS Software Submitted July 30, ,470 words By Catherine Harrison University of Virginia
 Harrison 1 Identifying Wetlands by GIS Software Submitted July 30, 2015 4,470 words By Catherine Harrison University of Virginia cch2fy@virginia.edu Harrison 2 ABSTRACT The Virginia Department of Transportation
CHAPTER 6 & 7 VOCABULARY
 CHAPTER 6 & 7 VOCABULARY 1. Biome 2. Climate 3. Latitude 4. Altitude 5. Emergent layer 6. Epiphyte 7. Understory 8. Permafrost 9. Wetland 10.Plankton 11.Nekton 12.Benthos 13.Littoral zone 14.Benthic zone
Pierce Cedar Creek Institute GIS Development Final Report. Grand Valley State University
 Pierce Cedar Creek Institute GIS Development Final Report Grand Valley State University Major Goals of Project The two primary goals of the project were to provide Matt VanPortfliet, GVSU student, the
Summary Description Municipality of Anchorage. Anchorage Coastal Resource Atlas Project
 Summary Description Municipality of Anchorage Anchorage Coastal Resource Atlas Project By: Thede Tobish, MOA Planner; and Charlie Barnwell, MOA GIS Manager Introduction Local governments often struggle
Minimum Standards for Wetland Delineations
 Minimum Standards for Wetland Delineations Jason Gipson Chief, Utah/Nevada Regulatory Branch Sacramento District Regulatory Program Workshop 16 Mar 2016 US Army Corps of Engineers Delineation Report Minimum
GIS and Remote Sensing
 Spring School Land use and the vulnerability of socio-ecosystems to climate change: remote sensing and modelling techniques GIS and Remote Sensing Katerina Tzavella Project Researcher PhD candidate Technology
Technical Drafting, Geographic Information Systems and Computer- Based Cartography
 Technical Drafting, Geographic Information Systems and Computer- Based Cartography Project-Specific and Regional Resource Mapping Services Geographic Information Systems - Spatial Analysis Terrestrial
Resolution XIII.23. Wetlands in the Arctic and sub-arctic
 13th Meeting of the Conference of the Contracting Parties to the Ramsar Convention on Wetlands Wetlands for a Sustainable Urban Future Dubai, United Arab Emirates, 21-29 October 2018 Resolution XIII.23
VILLAGE INFORMATION SYSTEM (V.I.S) FOR WATERSHED MANAGEMENT IN THE NORTH AHMADNAGAR DISTRICT, MAHARASHTRA
 FOR WATERSHED MANAGEMENT IN THE NORTH AHMADNAGAR DISTRICT, MAHARASHTRA") VILLAGE INFORMATION SYSTEM (V.I.S) FOR WATERSHED MANAGEMENT IN THE NORTH AHMADNAGAR DISTRICT, MAHARASHTRA Abstract: The drought prone zone in the Western Maharashtra is not in position to achieve the agricultural
VILLAGE INFORMATION SYSTEM (V.I.S) FOR WATERSHED MANAGEMENT IN THE NORTH AHMADNAGAR DISTRICT, MAHARASHTRA Abstract: The drought prone zone in the Western Maharashtra is not in position to achieve the agricultural
Overview of Remote Sensing in Natural Resources Mapping
 Overview of Remote Sensing in Natural Resources Mapping What is remote sensing? Why remote sensing? Examples of remote sensing in natural resources mapping Class goals What is Remote Sensing A remote sensing
Appendix E: Cowardin Classification Coding System
 Appendix E: Cowardin Classification Coding System The following summarizes the Cowardin classification coding system and the letters and numbers used to define the USFWS NWI wetland types and subtypes:
Manitoba s Elevation (LiDAR) & Imagery Datasets. Acquisition Plans & Opportunities for Collaboration
 & Imagery Datasets. Acquisition Plans & Opportunities for Collaboration") Manitoba s Elevation (LiDAR) & Imagery Datasets Acquisition Plans & Opportunities for Collaboration Manitoba Planning Conference May 2017 Presentation Outline Manitoba s Elevation (LiDAR) and Imagery Datasets
Manitoba s Elevation (LiDAR) & Imagery Datasets Acquisition Plans & Opportunities for Collaboration Manitoba Planning Conference May 2017 Presentation Outline Manitoba s Elevation (LiDAR) and Imagery Datasets
SAN FRANCISCO DISTRICT INFORMATION REQUESTED FOR VERIFICATION OF CORPS JURISDICTION
 DEPARTMENT OF THE ARMY SAN FRANCISCO DISTRICT, U.S. ARMY CORPS OF ENGINEERS 1455 MARKET STREET SAN FRANCISCO, CALIFORNIA 94103-1398 SAN FRANCISCO DISTRICT INFORMATION REQUESTED FOR VERIFICATION OF CORPS
DEPARTMENT OF GEOGRAPHY B.A. PROGRAMME COURSE DESCRIPTION
 DEPARTMENT OF GEOGRAPHY B.A. PROGRAMME COURSE DESCRIPTION (3 Cr. Hrs) (2340100) Geography of Jordan (University Requirement) This Course pursues the following objectives: - The study the physical geographical
USING HYPERSPECTRAL IMAGERY
 USING HYPERSPECTRAL IMAGERY AND LIDAR DATA TO DETECT PLANT INVASIONS 2016 ESRI CANADA SCHOLARSHIP APPLICATION CURTIS CHANCE M.SC. CANDIDATE FACULTY OF FORESTRY UNIVERSITY OF BRITISH COLUMBIA CURTIS.CHANCE@ALUMNI.UBC.CA
Using Geographic Information Systems and Remote Sensing Technology to Analyze Land Use Change in Harbin, China from 2005 to 2015
 Using Geographic Information Systems and Remote Sensing Technology to Analyze Land Use Change in Harbin, China from 2005 to 2015 Yi Zhu Department of Resource Analysis, Saint Mary s University of Minnesota,
Statewide wetland geospatial inventory update
 Statewide wetland geospatial inventory update Factsheet 1: Outcomes from the statewide wetland geospatial inventory update 1 Introduction In 2011 the Victorian Department of Environment and Primary Industries
Land Use MTRI Documenting Land Use and Land Cover Conditions Synthesis Report
 Colin Brooks, Rick Powell, Laura Bourgeau-Chavez, and Dr. Robert Shuchman Michigan Tech Research Institute (MTRI) Project Introduction Transportation projects require detailed environmental information
7.1 INTRODUCTION 7.2 OBJECTIVE
 7 LAND USE AND LAND COVER 7.1 INTRODUCTION The knowledge of land use and land cover is important for many planning and management activities as it is considered as an essential element for modeling and
GLOBWETLAND AFRICA TOOLBOX
 The GlobWetland Africa Toolbox is an open source and free-of-charge software toolbox for inventorying, mapping, monitoring and assessing wetlands. The toolbox comes with end-to-end processing workflows
ASSESSING THEMATIC MAP USING SAMPLING TECHNIQUE
 1 ASSESSING THEMATIC MAP USING SAMPLING TECHNIQUE University of Tehran, Faculty of Natural Resources, Karaj-IRAN E-Mail: adarvish@chamran.ut.ac.ir, Fax: +98 21 8007988 ABSTRACT The estimation of accuracy
Hazard Mapping Along the Dead Sea Shoreline
 FIG Working Week in Marrakech, Morocco 18-22 May 2011 Hazard Mapping Along the Dead Sea Shoreline Rami Al-Ruzouq, Abdullah Al-Zuobi, AbdEl-Rahman Abueladas, Emad Akkawi Department of Surveying and Geomatics
USING GIS CARTOGRAPHIC MODELING TO ANALYSIS SPATIAL DISTRIBUTION OF LANDSLIDE SENSITIVE AREAS IN YANGMINGSHAN NATIONAL PARK, TAIWAN
 CO-145 USING GIS CARTOGRAPHIC MODELING TO ANALYSIS SPATIAL DISTRIBUTION OF LANDSLIDE SENSITIVE AREAS IN YANGMINGSHAN NATIONAL PARK, TAIWAN DING Y.C. Chinese Culture University., TAIPEI, TAIWAN, PROVINCE
TEST NAME: Biome Test 10/7 TEST ID: GRADE:05 - Fifth Grade SUBJECT:Life and Physical Sciences TEST CATEGORY: My Classroom
 TEST NAME: Biome Test 10/7 TEST ID:1239163 GRADE:05 - Fifth Grade SUBJECT:Life and Physical Sciences TEST CATEGORY: My Classroom Biome Test 10/7 Page 1 of 8 10/07/16, Biome Test 10/7 Student: Class: Date:
Moreton Bay and Key Geographic Concepts Worksheet
 Moreton Bay and Key Geographic Concepts Worksheet The Australian Curriculum: Geography draws on seven key geographic concepts: place scale space environment change interconnection sustainability They are
EAGLES NEST AND PIASA ISLANDS
 EAGLES NEST AND PIASA ISLANDS HABITAT REHABILITATION AND ENHANCEMENT PROJECT MADISON AND JERSEY COUNTIES, ILLINOIS ENVIRONMENTAL MANAGEMENT PROGRAM ST. LOUIS DISTRICT FACT SHEET I. LOCATION The proposed
Hydrologic Modelling of the Upper Malaprabha Catchment using ArcView SWAT
 Hydrologic Modelling of the Upper Malaprabha Catchment using ArcView SWAT Technical briefs are short summaries of the models used in the project aimed at nontechnical readers. The aim of the PES India
An Introduction to Geographic Information System
 An Introduction to Geographic Information System PROF. Dr. Yuji MURAYAMA Khun Kyaw Aung Hein 1 July 21,2010 GIS: A Formal Definition A system for capturing, storing, checking, Integrating, manipulating,
APPLICATION OF GIS FOR ASSESSING PRAWN FARM DEVELOPMENT IN TULLY-CARDWELL, NORTH QUEENSLAND. Zainul Hidayah
 APPLICATION OF GIS FOR ASSESSING PRAWN FARM DEVELOPMENT IN TULLY-CARDWELL, NORTH QUEENSLAND Zainul Hidayah Department of Marine Science and Technology Trunojoyo University Jl. Raya Telang No 2 Kamal Bangkalan
Remote Sensing and Geospatial Application for Wetlands Mapping, Assessment, and Mitigation
 Remote Sensing and Geospatial Application for Wetlands Mapping, Assessment, and Mitigation Hydrology Soils MSU Seminar Series Remote Sensing and Geospatial Applications September 4, 2002 Vegetation NEPA
TASMANIAN SEAGRASS COMMUNITIES
 TASMANIAN SEAGRASS COMMUNITIES by Christopher Grant Rees, B.Ed (}Ions.) Submitted in partial fulfilment of the requirement for the degree of Master of Environmental Studies (By Coursework) Centre for Environmental
Lab 1: Importing Data, Rectification, Datums, Projections, and Coordinate Systems
 Lab 1: Importing Data, Rectification, Datums, Projections, and Coordinate Systems Topics covered in this lab: i. Importing spatial data to TAS ii. Rectification iii. Conversion from latitude/longitude
1.1 What is Site Fingerprinting?
 Site Fingerprinting Utilizing GIS/GPS Technology 1.1 What is Site Fingerprinting? Site fingerprinting is a planning tool used to design communities where protection of natural resources is the primary
Spatial Analysis and Modeling of Urban Land Use Changes in Lusaka, Zambia: A Case Study of a Rapidly Urbanizing Sub- Saharan African City
 Spatial Analysis and Modeling of Urban Land Use Changes in Lusaka, Zambia: A Case Study of a Rapidly Urbanizing Sub- Saharan African City January 2018 Matamyo SIMWANDA Spatial Analysis and Modeling of
MEMORANDUM FOR SWG
 MEMORANDUM FOR SWG-2007-1623 Subject: Jurisdictional Determination (JD) for SWG-2007-1623 on Interdunal Wetlands Adjacent to Traditional Navigable Waters (TNWs) Summary The U.S. Environmental Protection
Lab 1: Importing Data, Rectification, Datums, Projections, and Output (Mapping)
") Lab 1: Importing Data, Rectification, Datums, Projections, and Output (Mapping) Topics covered in this lab: i. Importing spatial data to TAS ii. Rectification iii. Conversion from latitude/longitude to
Lab 1: Importing Data, Rectification, Datums, Projections, and Output (Mapping) Topics covered in this lab: i. Importing spatial data to TAS ii. Rectification iii. Conversion from latitude/longitude to
VISUALIZATION URBAN SPATIAL GROWTH OF DESERT CITIES FROM SATELLITE IMAGERY: A PRELIMINARY STUDY
 CO-439 VISUALIZATION URBAN SPATIAL GROWTH OF DESERT CITIES FROM SATELLITE IMAGERY: A PRELIMINARY STUDY YANG X. Florida State University, TALLAHASSEE, FLORIDA, UNITED STATES ABSTRACT Desert cities, particularly
Evaluating Wildlife Habitats
 Lesson C5 4 Evaluating Wildlife Habitats Unit C. Animal Wildlife Management Problem Area 5. Game Animals Management Lesson 4. Evaluating Wildlife Habitats New Mexico Content Standard: Pathway Strand: Natural
Monitoring of Forest Cover Change in Sundarban mangrove forest using Remote sensing and GIS
 Monitoring of Forest Cover Change in Sundarban mangrove forest using Remote sensing and GIS By Mohammed Monirul Alam April 2008 Content 1: INTRODUCTION 2: OBJECTIVES 3: METHODOLOGY 4: RESULTS & DISCUSSION
Chesapeake Bay Remote Sensing Pilot Executive Briefing
 Chesapeake Bay Remote Sensing Pilot Executive Briefing Introduction In his Executive Order 13506 in May 2009, President Obama stated The Chesapeake Bay is a national treasure constituting the largest estuary
INTERNATIONAL JOURNAL OF GEOMATICS AND GEOSCIENCES Volume 2, No 1, 2011
 INTERNATIONAL JOURNAL OF GEOMATICS AND GEOSCIENCES Volume 2, No 1, 2011 Copyright 2010 All rights reserved Integrated Publishing services Research article ISSN 0976 4380 Spatio-Temporal changes of Land
Simulation of Wetlands Evolution Based on Markov-CA Model
 Simulation of Wetlands Evolution Based on Markov-CA Model ZHANG RONGQUN 1 ZHAI HUIQING 1 TANG CHENGJIE 2 MA SUHUA 2 1 Department of Geography informantion science, College of information and Electrical
Satellite Remote Sensing for Ocean
 Satellite Remote Sensing for Ocean August 17, 2017 Masatoshi Kamei RESTEC All rights reserved RESTEC 2015 Contents 1. About RESTEC and Remote Sensing 2. Example of Remote Sensing Technology 3. Remote Sensing
Home About Us Articles Press Releases Image Gallery Contact Us Media Kit Free Subscription 10/5/2006 5:56:35 PM
 Home About Us Articles Press Releases Image Gallery Contact Us Media Kit Free Subscription 10/5/2006 5:56:35 PM Industry Resources Industry Directory NASA Links Missions/Launches Calendar Human development
SWOS (The Satellite-based Wetland Observation Service) Satellite images for peatland monitoring and management Kathrin Weise, Jena-Optronik GmbH
 Satellite images for peatland monitoring and management Kathrin Weise, Jena-Optronik GmbH") This project has received funding from the European Union s Horizon 2020 research and innovation programme under grant agreement No 642088 SWOS (The Satellite-based Wetland Observation Service) Satellite
This project has received funding from the European Union s Horizon 2020 research and innovation programme under grant agreement No 642088 SWOS (The Satellite-based Wetland Observation Service) Satellite
Environmental Science
 Environmental Science A Study of Interrelationships Cui Jiansheng Hebei University of Science and Technology CH06 Kinds of Ecosystems and Communities Chapter Objectives After reading this chapter, you
A Thesis. The Department of Oceanography and Coastal Sciences. by Lauren Land B.S., University of Maryland College Park, 2008 December 2010
 PHYSICAL AND MICROBIAL RESPONSES OF DREDGED SEDIMENT TO TWO SOIL- STABILIZING AMENDMENTS, XANTHAN GUM AND GUAR GUM, FOR USE IN COASTAL WETLAND RESTORATION A Thesis Submitted to the Graduate Faculty of
Project Leader: Project Partners:
 UTILIZING LIDAR TO MAP HIGH PRIORITY WOODLAND HABITAT IN ARKANSAS DEVELOPING METHODOLOGY AND CONDUCTING A PILOT PROJECT IN THE OZARK HIGHLANDS TO MAP CURRENT EXTENT, SIZE AND CONDITION Project Summary
GEOMATICS. Shaping our world. A company of
 GEOMATICS Shaping our world A company of OUR EXPERTISE Geomatics Geomatics plays a mayor role in hydropower, land and water resources, urban development, transport & mobility, renewable energy, and infrastructure
EO Information Services. Assessing Vulnerability in the metropolitan area of Rio de Janeiro (Floods & Landslides) Project
 Project") EO Information Services in support of Assessing Vulnerability in the metropolitan area of Rio de Janeiro (Floods & Landslides) Project Ricardo Armas, Critical Software SA Haris Kontoes, ISARS NOA World
EO Information Services in support of Assessing Vulnerability in the metropolitan area of Rio de Janeiro (Floods & Landslides) Project Ricardo Armas, Critical Software SA Haris Kontoes, ISARS NOA World
Fig 1. Steps in the EcoValue Project
 Assessing the Social and Economic Value of Ecosystem Services in the Northern Forest Region: A Geographic Information System (GIS) Approach to Landscape Valuation Principal Investigator(s): Dr. Matthew
Name: Date: Class: Louisiana: Our History, Our Home Chapter 1: Louisiana s Geography - Section 2: Natural Regions Guided Reading
 Instructions: Read the section and complete each item with words from the passages in this section. 1. The diversity of Louisiana s can surprise residents and visitors alike. 2. Physical geography is concerned
Virginia Shoreline Mapping Tools
 Virginia Shoreline Mapping Tools December 15, 2017 Karen Duhring Center for Coastal Resources Management Virginia Institute of Marine Science College of William & Mary Virginia Shoreline Mapping Tools
United States Department of the Interior NATIONAL PARK SERVICE Northeast Region
 United States Department of the Interior NATIONAL PARK SERVICE Northeast Region June 17, 2017 REQUEST FOR STATEMENTS OF INTEREST and QUALIFICATIONS Project Title: ASSESSMENT OF NATURAL RESOURCE CONDITION
Evaluating Urban Vegetation Cover Using LiDAR and High Resolution Imagery
 Evaluating Urban Vegetation Cover Using LiDAR and High Resolution Imagery Y.A. Ayad and D. C. Mendez Clarion University of Pennsylvania Abstract One of the key planning factors in urban and built up environments
Chapter 52 An Introduction to Ecology and the Biosphere
 Chapter 52 An Introduction to Ecology and the Biosphere Ecology The study of the interactions between organisms and their environment. Ecology Integrates all areas of biological research and informs environmental
Display data in a map-like format so that geographic patterns and interrelationships are visible
 Vilmaliz Rodríguez Guzmán M.S. Student, Department of Geology University of Puerto Rico at Mayagüez Remote Sensing and Geographic Information Systems (GIS) Reference: James B. Campbell. Introduction to
Use of Geospatial data for disaster managements
 Use of Geospatial data for disaster managements Source: http://alertsystemsgroup.com Instructor : Professor Dr. Yuji Murayama Teaching Assistant : Manjula Ranagalage What is GIS? A powerful set of tools
PHOTOGRAMMETRY AND GIS TECHNOL 1 OGIES FOR MONITORING COASTAL EROSION ALONG DAR ES SALAAM COASTLINE. By: Z.Y Masele, S.D Mayunga1.
 PHOTOGRAMMETRY AND GIS TECHNOL 1 OGIES FOR MONITORING COASTAL EROSION ALONG DAR ES SALAAM COASTLINE. By: Z.Y Masele, S.D Mayunga1 Abstract Dar Es salaam coastline is seriously suffering from coastal soil
Appendix J Vegetation Change Analysis Methodology
 Appendix J Vegetation Change Analysis Methodology Regional Groundwater Storage and Recovery Project Draft EIR Appendix-J April 2013 APPENDIX J- LAKE MERCED VEGETATION CHANGE ANALYSIS METHODOLOGY Building
Wetlands and Riparian Mapping Framework Technical Meeting
 Wetlands and Riparian Mapping Framework Technical Meeting Meghan Burns Landscape Ecologist Linda Vance Senior Ecologist Why wetland and riparian mapping? Preliminary site assessment for the presence of
Biosphere Biome Ecosystem Community Population Organism
 Ecology ecology - The study of living things and how they relate to their environment Levels of Organization in Ecology organism lowest level one living thing population collection of organisms of the
NOTES: CH 4 Ecosystems & Communities
 NOTES: CH 4 Ecosystems & Communities 4.1 - Weather & Climate: WEATHER = day-to-day conditions of Earth s atmosphere CLIMATE= refers to average conditions over long periods; defined by year-afteryear patterns
Digital Change Detection Using Remotely Sensed Data for Monitoring Green Space Destruction in Tabriz
 Int. J. Environ. Res. 1 (1): 35-41, Winter 2007 ISSN:1735-6865 Graduate Faculty of Environment University of Tehran Digital Change Detection Using Remotely Sensed Data for Monitoring Green Space Destruction
Coastal Environment. Introduction. 4.1 Coastal Environment. Extent of Coastal Environment
 4 The primary objective (set out in Chapter 2) to be implemented by this Chapter is Objective 2.4 ; the following objectives are also relevant due to the objectives integrated nature: 2.1 Tāngata whenua
Introduction. Ecology is the scientific study of the interactions between organisms and their environment.
 Introduction Ecology is the scientific study of the interactions between organisms and their environment. 1. The interactions between organisms and their environments determine the distribution and abundance
Principals and Elements of Image Interpretation
 Principals and Elements of Image Interpretation 1 Fundamentals of Photographic Interpretation Observation and inference depend on interpreter s training, experience, bias, natural visual and analytical
THE REVISION OF 1:50000 TOPOGRAPHIC MAP OF ONITSHA METROPOLIS, ANAMBRA STATE, NIGERIA USING NIGERIASAT-1 IMAGERY
 I.J.E.M.S., VOL.5 (4) 2014: 235-240 ISSN 2229-600X THE REVISION OF 1:50000 TOPOGRAPHIC MAP OF ONITSHA METROPOLIS, ANAMBRA STATE, NIGERIA USING NIGERIASAT-1 IMAGERY 1* Ejikeme, J.O. 1 Igbokwe, J.I. 1 Igbokwe,
Remote Sensing and GIS Applications for Hilly Watersheds SUBASHISA DUTTA DEPARTMENT OF CIVIL ENGINEERING IIT GUWAHATI
 Remote Sensing and GIS Applications for Hilly Watersheds SUBASHISA DUTTA DEPARTMENT OF CIVIL ENGINEERING IIT GUWAHATI Deciding Alternative Land Use Options in a Watershed Using GIS Source: Anita Prakash
Hydric Rating by Map Unit Harrison County, Mississippi. Web Soil Survey National Cooperative Soil Survey
 89 9' 7'' W 89 8' 38'' W 30 34' 13'' N 30 33' 57'' N 3383480 3383560 3383640 3383720 3383800 3383880 3383960 293640 293720 293800 293880 293960 294040 294120 294200 294280 294360 3383480 3383560 3383640
Defining the Limit of Regulated Areas. C.1 Defining the River or Stream Flood Hazard 138. C.2 Defining the River or Stream Erosion Hazard 139
 C.1 Defining the River or Stream Flood Hazard 138 C.2 Defining the River or Stream Erosion Hazard 139 C.3 Defining Watercourses 141 C.4 Defining the Lake Ontario Shoreline Flood, Erosion and Dynamic Beach
UK NEA Economic Analysis Report Cultural services: Mourato et al. 2010
 Appendix A Hedonic regressions: Further data description The environmental data used to construct variables for the hedonic regressions come from the Centre for Ecology and Hydrology, the Generalised Land
MISSOURI LiDAR Stakeholders Meeting
 MISSOURI LiDAR Stakeholders Meeting East-West Gateway June 18, 2010 Tim Haithcoat Missouri GIO Enhanced Elevation Data What s different about it? Business requirements are changing.fast New data collection
Current and Future Technology Applications for Coastal Zone Management. Bruce K. Carlisle, Acting Director Office of Coastal Zone Management
 Current and Future Technology Applications for Coastal Zone Management Bruce K. Carlisle, Acting Director Office of Coastal Zone Management The Massachusetts Coastal Zone Management Program Approved in
Pee Dee Explorer. Science Standards
 Science Standards About Pee Dee Explorer What does it mean when someone says they are from the "Pee Dee" of South Carolina? A place is bigger than its physical geography. A "sense of place" weaves together
Investigation of the Effect of Transportation Network on Urban Growth by Using Satellite Images and Geographic Information Systems
 Presented at the FIG Congress 2018, May 6-11, 2018 in Istanbul, Turkey Investigation of the Effect of Transportation Network on Urban Growth by Using Satellite Images and Geographic Information Systems
U.S. ARMY CORPS OF ENGINEERS
 CORPS FACTS Regulating Mississippi River Navigation Pools U.S. ARMY CORPS OF ENGINEERS BUILDING STRONG Historical Background Federal improvements in the interest of navigation on the Mississippi River
Global reviews of wetland inventory, classification and delineation
 Max Finlayson Institute for Land, Water & Society Charles Sturt University Albury, Australia Global reviews of wetland inventory, classification and delineation Initiatives/meetings over two decades have
Kyoto and Carbon Initiative - the Ramsar / Wetlands International perspective
 Kyoto and Carbon Initiative - the Ramsar / Wetlands International perspective (the thoughts of Max Finlayson, as interpreted by John Lowry) Broad Requirements Guideline(s) for delineating wetlands (specifically,
RESEARCH METHODOLOGY
 III. RESEARCH METHODOLOGY 3.1 Time and Location This research has been conducted in period March until October 2010. Location of research is over Sumatra terrain. Figure 3.1 show the area of interest of
PROPOSED UNESCO FUNDY BIOSPHERE RESERVE
 OVERVIEW PROPOSED UNESCO FUNDY BIOSPHERE RESERVE NEW BRUNSWICK, CANADA NOMINATION DOCUMENT April 10, 2007 The United Nations Educational, Scientific and Cultural Organization (UNESCO) Man and the Biosphere
Required Documents. Title: Number: AEP Administration 2017 No. 1. Provincial Wetlands and Water Boundaries Section. Effective Date: September 1, 2017
 Title: Number: Program Name: Provincial Wetlands and Water Boundaries Section Effective Date: September 1, 2017 This document was updated on: August 25, 2017 The Provincial Wetlands and Water Boundaries
Geo-spatial Analysis for Prediction of River Floods
 Geo-spatial Analysis for Prediction of River Floods Abstract. Due to the serious climate change, severe weather conditions constantly change the environment s phenomena. Floods turned out to be one of
ESTIMATING LAND VALUE AND DISASTER RISK IN URBAN AREA IN YANGON, MYANMAR USING STEREO HIGH-RESOLUTION IMAGES AND MULTI-TEMPORAL LANDSAT IMAGES
 ESTIMATING LAND VALUE AND DISASTER RISK IN URBAN AREA IN YANGON, MYANMAR USING STEREO HIGH-RESOLUTION IMAGES AND MULTI-TEMPORAL LANDSAT IMAGES Tanakorn Sritarapipat 1 and Wataru Takeuchi 1 1 Institute
LAND COVER CLASSIFICATION OF ALOS DATA USING BACK-PROPAGATION NEURAL NETWORK MODELS ARIANI ANDAYANI
 LAND COVER CLASSIFICATION OF ALOS DATA USING BACK-PROPAGATION NEURAL NETWORK MODELS ARIANI ANDAYANI GRADUATE SCHOOL BOGOR AGRICULTURAL UNIVERSITY BOGOR 2008 STATEMENT Hereby I, Ariani Andayani, do declare
Temporal Mapping and Prediction of Coastal Biomass for Keti Bunder.
 Temporal Mapping and Prediction of Coastal Biomass for Keti Bunder. Muhammad A. Sohl 1* ; Anser Mehmood 1 ; Muhammad H. Mazher 1 ; Najam 1 ; Urooj Saeed 2 ; and Hafiz M. Rafique 3 1 Department of Space
International Journal of Scientific & Engineering Research, Volume 6, Issue 11, November ISSN
 International Journal of Scientific & Engineering Research, Volume 6, Issue 11, November-2015 42 Geospatial Mapping of Fish Farms in Anambra State Using GIS Approach Ojiako, J.C., Okafor, C. M., Igbokwe,
ESTIMATION OF LANDFORM CLASSIFICATION BASED ON LAND USE AND ITS CHANGE - Use of Object-based Classification and Altitude Data -
 ESTIMATION OF LANDFORM CLASSIFICATION BASED ON LAND USE AND ITS CHANGE - Use of Object-based Classification and Altitude Data - Shoichi NAKAI 1 and Jaegyu BAE 2 1 Professor, Chiba University, Chiba, Japan.
LAND COVER CATEGORY DEFINITION BY IMAGE INVARIANTS FOR AUTOMATED CLASSIFICATION
 LAND COVER CATEGORY DEFINITION BY IMAGE INVARIANTS FOR AUTOMATED CLASSIFICATION Nguyen Dinh Duong Environmental Remote Sensing Laboratory Institute of Geography Hoang Quoc Viet Rd., Cau Giay, Hanoi, Vietnam
Native species (Forbes and Graminoids) Less than 5% woody plant species. Inclusions of vernal pools. High plant diversity
 Less than 5% woody plant species. Inclusions of vernal pools. High plant diversity") WILLAMETTE VALLEY WET-PRAIRIE RESTORATION MODEL WHAT IS A WILLAMETTE VALLEY WET-PRAIRIE Hot Spot s Native species (Forbes and Graminoids) Rare plant species Less than 5% woody plant species Often dominated
WILLAMETTE VALLEY WET-PRAIRIE RESTORATION MODEL WHAT IS A WILLAMETTE VALLEY WET-PRAIRIE Hot Spot s Native species (Forbes and Graminoids) Rare plant species Less than 5% woody plant species Often dominated
Watershed Classification with GIS as an Instrument of Conflict Management in Tropical Highlands of the Lower Mekong Basin
 Page 1 of 8 Watershed Classification with GIS as an Instrument of Conflict Management in Tropical Highlands of the Lower Mekong Basin Project Abstract The University of Giessen is actually planning a research