TRAVEL PATTERNS IN INDIAN DISTRICTS: DOES POPULATION SIZE MATTER?
|
|
|
- Toby Hensley
- 6 years ago
- Views:
Transcription
1 TRAVEL PATTERNS IN INDIAN DISTRICTS: DOES POPULATION SIZE MATTER? Deepty Jain Lecturer Department of Energy and Environment TERI University Delhi Dr. Geetam Tiwari Professor Department of Civil Engineering IIT CODATU 4 th 6 th November 2017
, Commuting travel time and population density, 35 cities of China Urban form and Travel behaviour High")

2 Source: Song et al. (2017), Commuting travel time and population density, 35 cities of China Urban form and Travel behaviour High Density is correlated with share of short distance trips (+) Source: Lee and Gordon (2011), drive alone mode Study of 79 largest U.S. metro areas High density is correlated with NMT share (+) High mix land use intensity is correlated with less car use (-) High mix land use intensity is correlated with short distance trips (-)

3 Source: LSE cities 2014
4 In India Only few examples of studies exists MOUD Wilbur Smiths Report on 30 Indian cities Exclusive studies for Ahmedabad Rajkot Vishakhapatnam Delhi Mumbai Agartala No comprehensive comparison of travel behavior with respect to socio-economic structure of cities Relevant travel behavior data collected by Census of India (2011) is available at district level Other workers Only for work trips
5 Cumulative Frequency Need for the research Delhi Hyderabad Pune 40 Patna 20 0 < 2 km 2-5 km 5-10 km km Trip length > 15 km Chandigarh Vizag Rajkot Cities classification based on area weighted mean shape index; area weighted mean patch fractal dimension; compactness index; compactness index of the largest Patch and ratio of open space; Source: Huang et al. 2007
6 Aim Research question and objectives To understand the variation in travel behavior across districts in India Objectives Null Hypothesis 1: The trip length does not significantly varies by population in India If in case 1, null hypothesis is rejected then; Null Hypothesis 2: Trip length does not significantly varies with respect to the socio-economic structure of the cities
7 Methodology Identification of data set and variables Collating data Source of data Census of India 2011 District stats of India District census handbook Correlation analysis Economic variables Classification of entities Population ANOVA test Multi-variate regression analysis


8 Variables and dataset Population density varies between 0.35 persons per ha and 265 persons per ha with mean = 9.31 persons per ha and s = persons per ha Index of economic activities with mean of and standard deviation of No travel share ranges between 10% and 59% with mean of 33% and standard deviation of 9%
9 Population density Bi-variate correlation analysis Population density 1 Percapita income Index of economic activities Contribution of secondary sector to district GDP Contribution of tertiary sector to district GDP percentage urban population Per-capita income 1 Index of economic activities Contribution of secondary sector to district GDP Contribution of tertiary sector to district GDP Income < INR per month Income between INR per month Income > INR per month Percentage urban population Work participation rate
10 Classifying districts Level of urbanization Variables Population size Economic variables Index of economic activities Per capita income Classification procedure Two-step cluster Contribution of tertiary sector to the district GDP Distribution of population by income K-mean cluster
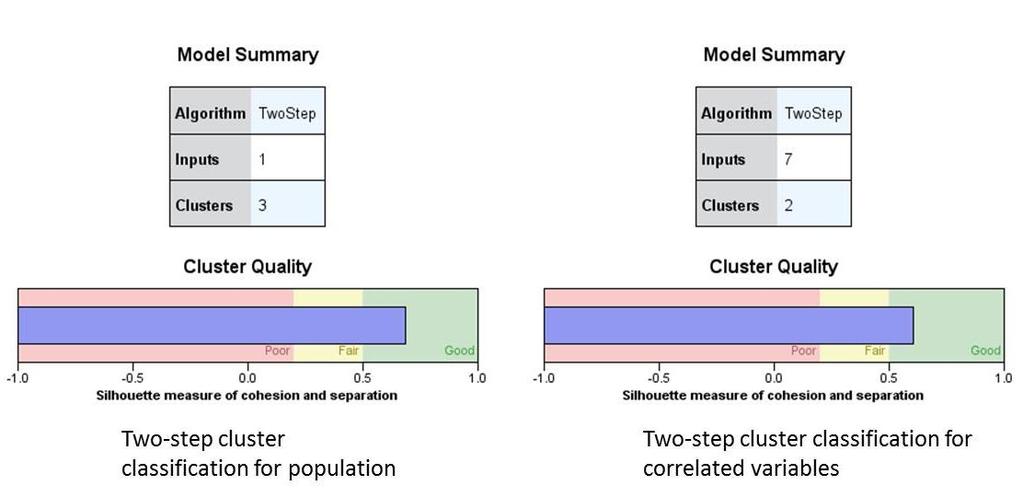
11 Cluster classifications
12 Cluster classifications type 1 Based on population Statistics Mean Std. Minimum Maximum (in millions) Deviation (in millions) (in millions) Cluster (in millions) No. Valid cases Large Medium Small Totals 359
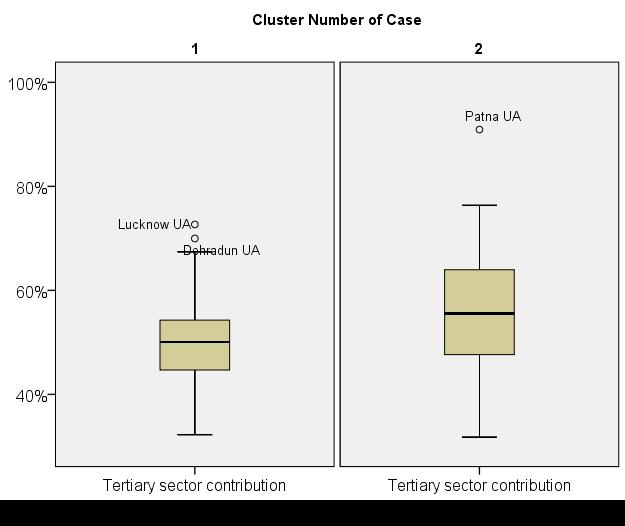
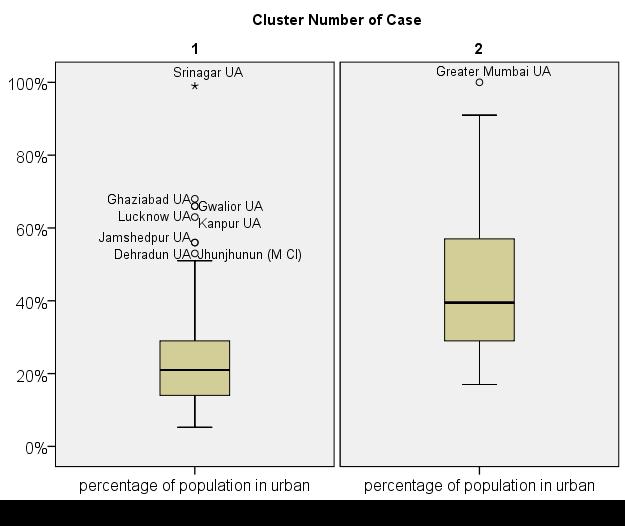
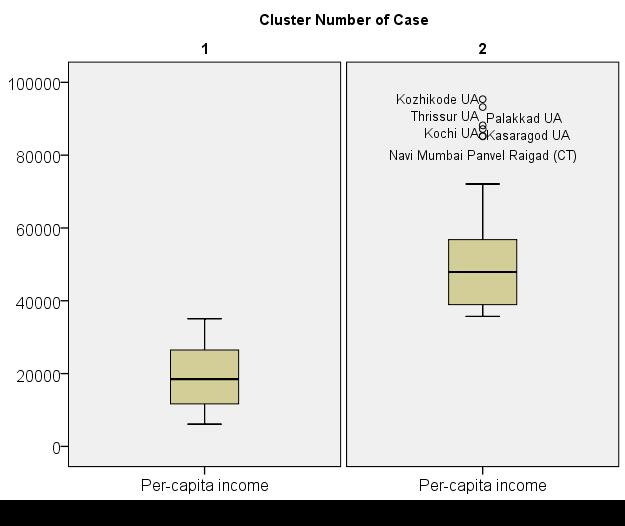
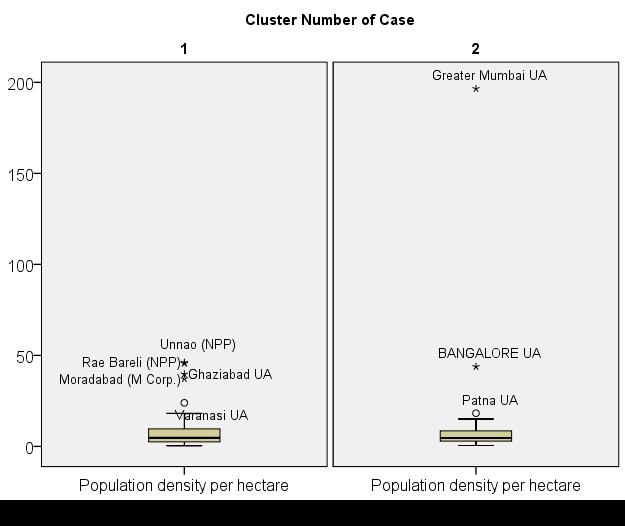
13 Cluster classifications type 2 Based on socio-economic variables Cluster Number of Case Tertiary sector contribution Per-capita income (INR) Index of economic activities (2007) Percentage of population in urban Population density (per hectare) Percentage of population with income < INR 12,000 Percentage of population with INR Cluster classification N Mean Std. Deviation Minimum Maximum % 8% 32% 73% % 11% 32% 91% % 14% 5% 99% % 19% 17% 100% % 27% 82% 99% 66 88% 72% 59% 97% % 2% 6% 11% 66 7% 4% 2% 22%
14
15 Correlation between socio-economic factors and trip length frequency distribution No travel Trips between 0-1 km Trips > 5 km Cluster type 1(1 = large, 2 = medium and 3 = small) Cluster type 2 (1 = low economic, 2 = high economic) Contribution of secondary sector to district GDP Percentage of total workers Population density Dependent variables R Square Model summary Adjusted R Square Root MSE No travel share Anova df F Sig. 6,
16 Regression analysis and results Coefficients No travel share Share of trips TL < 1 km Share of trips TL > 5 km Secondary sector contribution Work participation rate Population density Cluster type 1 (base= large) Medium Small Cluster type 2 (base =2) Constant No travel share is more in districts of small size, less urbanization rate, tertiary sector contribution to the district GDP and per capita income. Share of short trips does not varies significantly with population size, population density and economic performance of the districts. Share of long distance trips is likely to increase with population size, secondary sector contribution to the district GDP and work participation
17 Findings and Conclusions Travel behavior has been analysed for multiple districts in India Trip length frequency distribution can be significantly explained by economic, socio-economic and development related variables Increasing population size of Indian districts is resulting in increasing share of long distance trips. Small size districts are likely to have more mix land use intensity thereby explaining high share of no travel Share of Short distance trips cannot be explained by the population size of districts. Policy implications for sustainable transport policy Adoption of appropriate development policies to discourage long distance trips in large size districts High economic performance of districts is associated with long distance trips need for appropriate PT infrastructure Adoption of NMT and development policy to retain the existing share of short distance trips
18 Limitations and way forward Limitations Dataset ranges between Of the total 361 districts identified complete data is available for only 232 districts Future research Need to explore the underlying pattern in modal share The impact of number of employees by establishment type, transport infrastructure availability and vehicle ownership also need to be studied.
19 THANK YOU
Behavioural Analysis of Out Going Trip Makers of Sabarkantha Region, Gujarat, India
 Behavioural Analysis of Out Going Trip Makers of Sabarkantha Region, Gujarat, India C. P. Prajapati M.E.Student Civil Engineering Department Tatva Institute of Technological Studies Modasa, Gujarat, India
A Micro-Analysis of Accessibility and Travel Behavior of a Small Sized Indian City: A Case Study of Agartala
 A Micro-Analysis of Accessibility and Travel Behavior of a Small Sized Indian City: A Case Study of Agartala Moumita Saha #1, ParthaPratim Sarkar #2,Joyanta Pal #3 #1 Ex-Post graduate student, Department
Development of modal split modeling for Chennai
 IJMTES International Journal of Modern Trends in Engineering and Science ISSN: 8- Development of modal split modeling for Chennai Mr.S.Loganayagan Dr.G.Umadevi (Department of Civil Engineering, Bannari
Travel Parameter Modelling for Indian Cities- Regression Approach
 Travel Parameter Modelling for Indian Cities- Regression Approach 1 V.M.Naidu, 2 CSRK Prasad, 3 M.Srinivas 1 Assistant Professor, 2,3 Professor 1,3 Civil Engineering Department-GVPCOE, Visakhapatnam, India
Travel behavior of low-income residents: Studying two contrasting locations in the city of Chennai, India
 Travel behavior of low-income residents: Studying two contrasting locations in the city of Chennai, India Sumeeta Srinivasan Peter Rogers TRB Annual Meet, Washington D.C. January 2003 Environmental Systems,
Simulating Mobility in Cities: A System Dynamics Approach to Explore Feedback Structures in Transportation Modelling
 Simulating Mobility in Cities: A System Dynamics Approach to Explore Feedback Structures in Transportation Modelling Dipl.-Ing. Alexander Moser [amoser@student.tugraz.at] IVT Tagung 2013 - Kloster Kappel
CREATING LIVEABLE & SAFE CITIES FOR ALL
 CREATING LIVEABLE & SAFE CITIES FOR ALL Taking Transit to people s door steps PRERNA V. MEHTA, MANAGER, WRI INDIA RAJEEV G. MALAGI, SR. PROJECT ASSOCIATE, WRI INDIA A product of WRI Ross Center for Sustainable
Impact of Metropolitan-level Built Environment on Travel Behavior
 Impact of Metropolitan-level Built Environment on Travel Behavior Arefeh Nasri 1 and Lei Zhang 2,* 1. Graduate Research Assistant; 2. Assistant Professor (*Corresponding Author) Department of Civil and
A Joint Tour-Based Model of Vehicle Type Choice and Tour Length
 A Joint Tour-Based Model of Vehicle Type Choice and Tour Length Ram M. Pendyala School of Sustainable Engineering & the Built Environment Arizona State University Tempe, AZ Northwestern University, Evanston,
New insights about the relation between modal split and urban density: the Lisbon Metropolitan Area case study revisited
 Urban Transport 405 New insights about the relation between modal split and urban density: the Lisbon Metropolitan Area case study revisited J. de Abreu e Silva 1, 2 & F. Nunes da Silva 1 1 CESUR Centre
Estimation of Travel demand from the city commuter region of Muvattupuzha municipal area Mini.M.I 1 Dr.Soosan George.T 2 Rema Devi.M.
 Estimation of Travel demand from the city commuter region of Muvattupuzha municipal area Mini.M.I 1 Dr.Soosan George.T 2 Rema Devi.M. 3 Professor, Department of Civil Engg., M.A.College of Engg, Kothamangalam,
The Spatial Structure of Cities: International Examples of the Interaction of Government, Topography and Markets
 Module 2: Spatial Analysis and Urban Land Planning The Spatial Structure of Cities: International Examples of the Interaction of Government, Topography and Markets Alain Bertaud Urbanist Summary What are
Might using the Internet while travelling affect car ownership plans of Millennials? Dr. David McArthur and Dr. Jinhyun Hong
 Might using the Internet while travelling affect car ownership plans of Millennials? Dr. David McArthur and Dr. Jinhyun Hong Introduction Travel habits among Millennials (people born between 1980 and 2000)
Motorization in Asia: 14 countries and three metropolitan areas. Metin Senbil COE Researcher COE Seminar
 Motorization in Asia: 14 countries and three metropolitan areas Metin Senbil COE Researcher COE Seminar - 2006.10.20 1 Outline Background Motorization in Asia: 14 countries Kuala Lumpur, Manila, Jabotabek
The Built Environment, Car Ownership, and Travel Behavior in Seoul
 The Built Environment, Car Ownership, and Travel Behavior in Seoul Sang-Kyu Cho, Ph D. Candidate So-Ra Baek, Master Course Student Seoul National University Abstract Although the idea of integrating land
Traffic Generation Model For Delhi Urban Area Using Artificial Neural Network
 BIJIT - BVICAM s International Journal of Information Technology Bharati Vidyapeeth s Institute of Computer Applications and Management (BVICAM), New Delhi Traffic Generation Model For Delhi Urban Area
Data Collection. Lecture Notes in Transportation Systems Engineering. Prof. Tom V. Mathew. 1 Overview 1
 Data Collection Lecture Notes in Transportation Systems Engineering Prof. Tom V. Mathew Contents 1 Overview 1 2 Survey design 2 2.1 Information needed................................. 2 2.2 Study area.....................................
Seaport Status, Access, and Regional Development in Indonesia
 Seaport Status, Access, and Regional Development in Indonesia Muhammad Halley Yudhistira Yusuf Sofiyandi Institute for Economic and Social Research (LPEM), Faculty of Economics and Business, University
Impact of Proposed Modal Shift from Private Users to Bus Rapid Transit System: An Indian City Case Study
 Impact of Proposed Modal Shift from Private Users to Bus Rapid Transit System: An Indian City Case Study Rakesh Kumar, Fatima Electricwala Abstract One of the major thrusts of the Bus Rapid Transit System
transportation research in policy making for addressing mobility problems, infrastructure and functionality issues in urban areas. This study explored
 ABSTRACT: Demand supply system are the three core clusters of transportation research in policy making for addressing mobility problems, infrastructure and functionality issues in urban areas. This study
Secondary Towns, Population and Welfare in Mexico
 Public Disclosure Authorized Public Disclosure Authorized Public Disclosure Authorized Secondary Towns, Population and Welfare in Mexico Isidro Soloaga Department of Economics, Universidad Iberoamericana,
Effects of a non-motorized transport infrastructure development in the Bucharest metropolitan area
 The Sustainable City IV: Urban Regeneration and Sustainability 589 Effects of a non-motorized transport infrastructure development in the Bucharest metropolitan area M. Popa, S. Raicu, D. Costescu & F.
Multi scale and multi sensor analysis of urban cluster development and agricultural land loss in China and India
 Multi scale and multi sensor analysis of urban cluster development and agricultural land loss in China and India Karen C. Seto, PI, Yale Michail Fragkias, Co I, Arizona State Annemarie Schneider, Co I,
BUILDING SOUND AND COMPARABLE METRICS FOR SDGS: THE CONTRIBUTION OF THE OECD DATA AND TOOLS FOR CITIES AND REGIONS
 BUILDING SOUND AND COMPARABLE METRICS FOR SDGS: THE CONTRIBUTION OF THE OECD DATA AND TOOLS FOR CITIES AND REGIONS STATISTICAL CAPACITY BUILDING FOR MONITORING OF SUSTAINABLE DEVELOPMENT GOALS Lukas Kleine-Rueschkamp
Spatial profile of three South African cities
 Spatial Outcomes Workshop South African Reserve Bank Conference Centre Pretoria September 29-30, 2009 Spatial profile of three South African cities by Alain Bertaud September 29 Email: duatreb@msn.com
The Scope and Growth of Spatial Analysis in the Social Sciences
 context. 2 We applied these search terms to six online bibliographic indexes of social science Completed as part of the CSISS literature search initiative on November 18, 2003 The Scope and Growth of Spatial
Secondary Towns and Poverty Reduction: Refocusing the Urbanization Agenda
 Secondary Towns and Poverty Reduction: Refocusing the Urbanization Agenda Luc Christiaensen and Ravi Kanbur World Bank Cornell Conference Washington, DC 18 19May, 2016 losure Authorized Public Disclosure
URBAN TRANSPORTATION SYSTEM (ASSIGNMENT)
") BRANCH : CIVIL ENGINEERING SEMESTER : 6th Assignment-1 CHAPTER-1 URBANIZATION 1. What is Urbanization? Explain by drawing Urbanization cycle. 2. What is urban agglomeration? 3. Explain Urban Class Groups.
BRANCH : CIVIL ENGINEERING SEMESTER : 6th Assignment-1 CHAPTER-1 URBANIZATION 1. What is Urbanization? Explain by drawing Urbanization cycle. 2. What is urban agglomeration? 3. Explain Urban Class Groups.
Urban Hydrology - A Case Study On Water Supply And Sewage Network For Madurai Region, Using Remote Sensing & GIS Techniques
 RESEARCH INVENTY: International Journal of Engineering and Science ISBN: 2319-6483, ISSN: 2278-4721, Vol. 1, Issue 8 (November 2012), PP 07-12 www.researchinventy.com Urban Hydrology - A Case Study On
Simulating urban growth in South Asia: A SLEUTH application
 Simulating urban growth in South Asia: A SLEUTH application Gargi Chaudhuri* 1 1 1725 State St., 2022 Cowley Hall, Department of Geography and Earth Science, University of Wisconsin-La Crosse *Email: gchaudhuri@uwlax.edu
URBAN PATTERN ANALYSIS -MAJOR CITIES IN INDIA.
 URBA PATTER AALYSIS -MAJOR CITIES I IDIA. Sowmyashree. M.V 1,3, T.V. Ramachandra 1,2,3. 1 Centre for Ecological Science. 2 Centre for Sustainable Technology. 3 Centre for infrastructure, Sustainable Transportation
Households or locations? Cities, catchment areas and prosperity in India
 Households or locations? Cities, catchment areas and prosperity in India Yue Li and Martin Rama World Bank July 13, 2015 Motivation and approach (Some) cities are drivers of prosperity in India Because
River North Multi-Modal Transit Analysis
 River North Multi-Modal Transit Analysis November 7, 2006 Dan Meyers, AICP URS Corporation 612-373-6446 / dan_meyers@urscorp.com River North Study Area Reasons for initiating the study Downtown areas north
UNIVERSITY OF NAIROBI COLLEGE OF HUMANITIES AND SOCIAL SCIENCES FACULTY OF ARTS & SCHOOL OF PHYSICAL SCIENCES
 UNIVERSITY OF NAIROBI COLLEGE OF HUMANITIES AND SOCIAL SCIENCES FACULTY OF ARTS & SCHOOL OF PHYSICAL SCIENCES Department of Geography and Environmental Studies TEACHING MODULE CGP/SGP 321: ECONOMIC GEOGRAPHY
URBAN CHANGE DETECTION OF LAHORE (PAKISTAN) USING A TIME SERIES OF SATELLITE IMAGES SINCE 1972
 USING A TIME SERIES OF SATELLITE IMAGES SINCE 1972") URBAN CHANGE DETECTION OF LAHORE (PAKISTAN) USING A TIME SERIES OF SATELLITE IMAGES SINCE 1972 Omar Riaz Department of Earth Sciences, University of Sargodha, Sargodha, PAKISTAN. omarriazpk@gmail.com ABSTRACT
URBAN CHANGE DETECTION OF LAHORE (PAKISTAN) USING A TIME SERIES OF SATELLITE IMAGES SINCE 1972 Omar Riaz Department of Earth Sciences, University of Sargodha, Sargodha, PAKISTAN. omarriazpk@gmail.com ABSTRACT
A s i a n J o u r n a l o f M u l t i d i m e n s i o n a l R e s e a r c h KUZNETS CURVE: THE CASE OF THE INDIAN ECONOMY
 P u b l i s h e d b y : T R A N S A s i a n R e s e a r c h J o u r n a l s AJMR: A s i a n J o u r n a l o f M u l t i d i m e n s i o n a l R e s e a r c h (A Do u b le B lind Re fe r e e d & Re v ie
HORIZON 2030: Land Use & Transportation November 2005
 PROJECTS Land Use An important component of the Horizon transportation planning process involved reviewing the area s comprehensive land use plans to ensure consistency between them and the longrange transportation
Regional Snapshot Series: Transportation and Transit. Commuting and Places of Work in the Fraser Valley Regional District
 Regional Snapshot Series: Transportation and Transit Commuting and Places of Work in the Fraser Valley Regional District TABLE OF CONTENTS Complete Communities Daily Trips Live/Work Ratio Commuting Local
JOB DESCRIPTION. Research Associate - Urban Economy and Employment
 JOB DESCRIPTION Research Associate - Urban Economy and Employment 2 Research Associate Urban Economy and Employment About Us The Indian Institute for Human Settlements (IIHS) is a national education institution
Assessing spatial distribution and variability of destinations in inner-city Sydney from travel diary and smartphone location data
 Assessing spatial distribution and variability of destinations in inner-city Sydney from travel diary and smartphone location data Richard B. Ellison 1, Adrian B. Ellison 1 and Stephen P. Greaves 1 1 Institute
DEFINING AND MEASURING WORLD-METRO REGIONS FOR INTERNATIONAL COMPARISONS
 DEFINING AND MEASURING WORLD-METRO REGIONS FOR INTERNATIONAL COMPARISONS Mario Piacentini, OECD 27th Scorus Conference, 11-13 August 2010, Latvia Why we need comparable measures of city performance Growing
VALIDATING THE RELATIONSHIP BETWEEN URBAN FORM AND TRAVEL BEHAVIOR WITH VEHICLE MILES TRAVELLED. A Thesis RAJANESH KAKUMANI
 VALIDATING THE RELATIONSHIP BETWEEN URBAN FORM AND TRAVEL BEHAVIOR WITH VEHICLE MILES TRAVELLED A Thesis by RAJANESH KAKUMANI Submitted to the Office of Graduate Studies of Texas A&M University in partial
INSTITUTE OF TOWN PLANNERS, INDIA TOWN PLANNING EXAMINATION BOARD ASSOCIATESHIP EXAMINATION
 SUBJECT: C.1.1. Planning Theory Maximum Marks: 20 1. What is Rational Planning Model? Discuss its main features. 2. Discuss the salient features of Advocacy Planning Theory. 3. Discuss David Harvey s contribution
ANALYSING THE DIVERSITY OF DEPRIVED AREAS IN MUMBAI, INDIA
 ANALYSING THE DIVERSITY OF DEPRIVED AREAS IN MUMBAI, INDIA MONIKA KUFFER (M.KUFFER@UTWENTE.NL) KARIN PFEFFER, RICHARD SLIUZAS, ISA BAUD, MARTIN VAN MAARSEVEEN Source: Google Earth CONTENT OF PRESENTATION
Infill and the microstructure of urban expansion
 Infill and the microstructure of urban expansion Stephen Sheppard Williams College Homer Hoyt Advanced Studies Institute January 12, 2007 Presentations and papers available at http://www.williams.edu/economics/urbangrowth/homepage.htm
DEVELOPING DECISION SUPPORT TOOLS FOR THE IMPLEMENTATION OF BICYCLE AND PEDESTRIAN SAFETY STRATEGIES
 DEVELOPING DECISION SUPPORT TOOLS FOR THE IMPLEMENTATION OF BICYCLE AND PEDESTRIAN SAFETY STRATEGIES Deo Chimba, PhD., P.E., PTOE Associate Professor Civil Engineering Department Tennessee State University
THE LEGACY OF DUBLIN S HOUSING BOOM AND THE IMPACT ON COMMUTING
 Proceedings ITRN2014 4-5th September, Caulfield and Ahern: The Legacy of Dublin s housing boom and the impact on commuting THE LEGACY OF DUBLIN S HOUSING BOOM AND THE IMPACT ON COMMUTING Brian Caulfield
Trip Generation Model Development for Albany
 Trip Generation Model Development for Albany Hui (Clare) Yu Department for Planning and Infrastructure Email: hui.yu@dpi.wa.gov.au and Peter Lawrence Department for Planning and Infrastructure Email: lawrence.peter@dpi.wa.gov.au
Abstract. 1 Introduction
 Urban density and car and bus use in Edinburgh Paul Dandy Department of Civil & Transportation Engineering, Napier University, EH10 5DT, United Kingdom EMail: p.dandy@napier.ac.uk Abstract Laissez-faire
TRIP GENERATION MODEL FOR THE CORE AREA OF THIRUVANANTHAPURAM CITY
 ISSN (Online) : 2319-8753 ISSN (Print) : 2347-6710 International Journal of Innovative Research in Science, Engineering and Technology An ISO 3297: 2007 Certified Organization, Volume 2, Special Issue
Does city structure cause unemployment?
 The World Bank Urban Research Symposium, December 15-17, 2003 Does city structure cause unemployment? The case study of Cape Town Presented by Harris Selod (INRA and CREST, France) Co-authored with Sandrine
Labour Market Areas in Italy. Sandro Cruciani Istat, Italian National Statistical Institute Directorate for territorial and environmental statistics
 Labour Market Areas in Italy Sandro Cruciani Istat, Italian National Statistical Institute Directorate for territorial and environmental statistics Workshop on Developing European Labour Market Areas Nuremberg,
Cities in Bad Shape: Urban Geometry in India
 Cities in Bad Shape: Urban Geometry in India Mariaflavia Harari MIT IGC Cities Research Group Conference 21 May 2015 Introduction Why Study City Shape A wide range of factors determine intra-urban commuting
Forecasting Regional Employment in Germany: A Review of Neural Network Approaches. Objectives:
 Forecasting Regional Employment in Germany: A Review of Neural Network Approaches Peter Nijkamp, Aura Reggiani, Roberto Patuelli Objectives: To develop and apply Neural Network (NN) models in order to
A Review of Concept of Peri-urban Area & Its Identification
 A Review of Concept of Peri-urban Area & Its Identification Ar. Manita Saxena Research Scholar Department of Architecture and Planning M.A.N.I.T, Bhopal Dr. Supriya Vyas Assistant Professor, Department
Date: June 19, 2013 Meeting Date: July 5, Consideration of the City of Vancouver s Regional Context Statement
 Section E 1.5 To: From: Regional Planning and Agriculture Committee Lee-Ann Garnett, Senior Regional Planner Planning, Policy and Environment Department Date: June 19, 2013 Meeting Date: July 5, 2013 Subject:
Cities in Bad Shape: Urban Geometry in India
 Cities in Bad Shape: Urban Geometry in India Mariaflavia Harari presented by Federico Curci September 15, 2015 Harari Cities in Bad Shape September 15, 2015 1 / 19 Research question Estimate effect of
What is a compact city? How could it be measured?
 What is a compact city? How could it be measured? Madhu Singh Transport Planner Directorate of Urban Land Transport, Bangalore Guided By: Professor H. M. Shivanand Swamy CEPT University, Ahmedabad Cities
The effects of impact fees on urban form and congestion in Florida
 The effects of impact fees on urban form and congestion in Florida Principal Investigators: Andres G. Blanco Ruth Steiner Presenters: Hyungchul Chung Jeongseob Kim Urban and Regional Planning Contents
Typical information required from the data collection can be grouped into four categories, enumerated as below.
 Chapter 6 Data Collection 6.1 Overview The four-stage modeling, an important tool for forecasting future demand and performance of a transportation system, was developed for evaluating large-scale infrastructure
CIV3703 Transport Engineering. Module 2 Transport Modelling
 CIV3703 Transport Engineering Module Transport Modelling Objectives Upon successful completion of this module you should be able to: carry out trip generation calculations using linear regression and category
2. Discussion of urban railway demand change The railway traffic demand for urban area is analyzed in the population decline society in the study. In
 The traffic demand analysis for urban railway networks in population declining society Yoshiyuki Yasuda a, Hiroaki Inokuchi b, Takamasa Akiyama c a Division of Science and Engineering, Graduate school
Advancing Transportation Performance Management and Metrics with Census Data
 Advancing Transportation Performance Management and Metrics with Census Data Authors: Ivana Tasic, University of Utah, Department of Civil and Environmental Engineering, 110 Central Campus Drive, Salt
Regional Performance Measures
 G Performance Measures Regional Performance Measures Introduction This appendix highlights the performance of the MTP/SCS for 2035. The performance of the Revenue Constrained network also is compared to
SPATIO-TEMPORAL ANALYSIS OF URBAN POPULATION GROWTH AND DISTRIBUTION IN AURANGABAD CITY
 International Journal of Research in Social Sciences Vol. 8 Issue 3, March 2018, ISSN: 2249-2496 Impact Factor: 7.081 Journal Homepage: Double-Blind Peer Reviewed Refereed Open Access International Journal
TRANSPORT MODE CHOICE AND COMMUTING TO UNIVERSITY: A MULTINOMIAL APPROACH
 TRANSPORT MODE CHOICE AND COMMUTING TO UNIVERSITY: A MULTINOMIAL APPROACH Daniele Grechi grechi.daniele@uninsubria.it Elena Maggi elena.maggi@uninsubria.it Daniele Crotti daniele.crotti@uninsubria.it SIET
The impact of residential density on vehicle usage and fuel consumption*
 The impact of residential density on vehicle usage and fuel consumption* Jinwon Kim and David Brownstone Dept. of Economics 3151 SSPA University of California Irvine, CA 92697-5100 Email: dbrownst@uci.edu
Regional Performance Measures
 G Performance Measures Regional Performance Measures Introduction This appendix highlights the performance of the MTP/SCS for 2035. The performance of the Revenue Constrained network also is compared to
Assessing the Employment Agglomeration and Social Accessibility Impacts of High Speed Rail in Eastern Australia: Sydney-Canberra-Melbourne Corridor
 Assessing the Employment Agglomeration and Social Accessibility Impacts of High Speed Rail in Eastern Australia: Sydney-Canberra-Melbourne Corridor Professor David A. Hensher FASSA Founding Director Institute
Matthew McKibbin. Manidis Roberts Pty Ltd, Level 9, 17 York Street, Sydney NSW for correspondence:
 Australasian Transport Research Forum 2011 Proceedings 28-30 September 2011, Adelaide, Australia Publication website: http://www.patrec.org/atrf.aspx The influence of the built environment on mode choice
Land Use/Cover Changes & Modeling Urban Expansion of Nairobi City
 Land Use/Cover Changes & Modeling Urban Expansion of Nairobi City Overview Introduction Objectives Land use/cover changes Modeling with Cellular Automata Conclusions Introduction Urban land use/cover types
The Impact of Residential Density on Vehicle Usage and Fuel Consumption: Evidence from National Samples
 The Impact of Residential Density on Vehicle Usage and Fuel Consumption: Evidence from National Samples Jinwon Kim Department of Transport, Technical University of Denmark and David Brownstone 1 Department
Land Use Modeling at ABAG. Mike Reilly October 3, 2011
 Land Use Modeling at ABAG Mike Reilly michaelr@abag.ca.gov October 3, 2011 Overview What and Why Details Integration Use Visualization Questions What is a Land Use Model? Statistical relationships between
Spatial Variation in Local Road Pedestrian and Bicycle Crashes
 2015 Esri International User Conference July 20 24, 2015 San Diego, California Spatial Variation in Local Road Pedestrian and Bicycle Crashes Musinguzi, Abram, Graduate Research Assistant Chimba,Deo, PhD.,
IMPACTS OF SPATIAL MISMATCH ON COMMUTING TIME OF URBAN RESIDENTS IN CHINA
 DANWEN BAO E-mail: baodanwen_sci@163.com College of Civil Aviation Nanjing University of Aeronautics and Astronautics Nanjing 210016, China TANGYI GUO E-mail: guotangyi_sci@163.com School of Automation
How the science of cities can help European policy makers: new analysis and perspectives
 How the science of cities can help European policy makers: new analysis and perspectives By Lewis Dijkstra, PhD Deputy Head of the Economic Analysis Unit, DG Regional and European Commission Overview Data
Changes in the Spatial Distribution of Mobile Source Emissions due to the Interactions between Land-use and Regional Transportation Systems
 Changes in the Spatial Distribution of Mobile Source Emissions due to the Interactions between Land-use and Regional Transportation Systems A Framework for Analysis Urban Transportation Center University
A Simplified Travel Demand Modeling Framework: in the Context of a Developing Country City
 A Simplified Travel Demand Modeling Framework: in the Context of a Developing Country City Samiul Hasan Ph.D. student, Department of Civil and Environmental Engineering, Massachusetts Institute of Technology,
A/Prof. Mark Zuidgeest ACCESSIBILITY EFFECTS OF RELOCATION AND HOUSING PROJECT FOR THE URBAN POOR IN AHMEDABAD, INDIA
 A/Prof. Mark Zuidgeest ACCESSIBILITY EFFECTS OF RELOCATION AND HOUSING PROJECT FOR THE URBAN POOR IN AHMEDABAD, INDIA South African Cities Network/University of Pretoria, 09 April 2018 MOBILITY Ability
Discerning sprawl factors of Shiraz city and how to make it livable
 Discerning sprawl factors of Shiraz city and how to make it livable 1. Introduction: Iran territory has now been directly affected by urban land-uses which are shaping landscapes in cities and around them.
FHWA Planning Data Resources: Census Data Planning Products (CTPP) HEPGIS Interactive Mapping Portal
 HEPGIS Interactive Mapping Portal") FHWA Planning Data Resources: Census Data Planning Products (CTPP) HEPGIS Interactive Mapping Portal Jeremy Raw, P.E. FHWA, Office of Planning, Systems Planning and Analysis August 2017 Outline Census
FHWA Planning Data Resources: Census Data Planning Products (CTPP) HEPGIS Interactive Mapping Portal Jeremy Raw, P.E. FHWA, Office of Planning, Systems Planning and Analysis August 2017 Outline Census
Migration and Urban Decay
 Migration and Urban Decay Asian Experiences Shekhar Mukherji RAWAT PUBLICATIONS Jaipur New Delhi Bangalore Mumbai Contents Preface List of Tables List of Figures ix xv xix Introduction 1 Very Crucial Urban
The socio-economic effects of the metro line U3 in Vienna (Austria) evaluated under the European research project TranSEcon (www.transecon.
 evaluated under the European research project TranSEcon (www.transecon.") The socio-economic effects of the metro line U3 in Vienna (Austria) evaluated under the European research project TranSEcon (www.transecon.org) This paper is addressed to workshop 1a - Traffic, environment
The socio-economic effects of the metro line U3 in Vienna (Austria) evaluated under the European research project TranSEcon (www.transecon.org) This paper is addressed to workshop 1a - Traffic, environment
Traffic Demand Forecast
 Chapter 5 Traffic Demand Forecast One of the important objectives of traffic demand forecast in a transportation master plan study is to examine the concepts and policies in proposed plans by numerically
Economic Growth and Human Development: An Empirical Analysis of Major States of India During the Period to
 Economic Affairs: 59(1): 11-21 March, 2014 DOI Number 10.5958/J.0976-4666.59.1.002 Economic Growth and Human Development: An Empirical Analysis of Major States of India During the Period 1993-94 to 2004-05
Subject: Note on spatial issues in Urban South Africa From: Alain Bertaud Date: Oct 7, A. Spatial issues
 Page 1 of 6 Subject: Note on spatial issues in Urban South Africa From: Alain Bertaud Date: Oct 7, 2009 A. Spatial issues 1. Spatial issues and the South African economy Spatial concentration of economic
The Governance of Land Use
 The planning system Levels of government and their responsibilities The Governance of Land Use Country fact sheet Germany Germany is a federal country with four levels of government. Below the national
Vanessa Nadalin Lucas Mation IPEA - Institute for Applied Economic Research Regional Studies Association Global Conference Fortaleza 2014
 Spatial distribution of sanitation and income inequality in Brazilian Slums Vanessa Nadalin Lucas Mation IPEA - Institute for Applied Economic Research Regional Studies Association Global Conference Fortaleza
Research on the Influence Factors of Urban-Rural Income Disparity Based on the Data of Shandong Province
 International Journal of Managerial Studies and Research (IJMSR) Volume 4, Issue 7, July 2016, PP 22-27 ISSN 2349-0330 (Print) & ISSN 2349-0349 (Online) http://dx.doi.org/10.20431/2349-0349.0407003 www.arcjournals.org
Financing Urban Transport. UNESCAP-SUTI Event
 Financing Urban Transport UNESCAP-SUTI Event October 2017 Urban Transport in Context 2 The spiky urban economy of global cities 3 Mass transit networks converge towards a characteristic structure with
Environmental & Socio-economic impacts of mass rapid transit using GIS
 Environmental & Socio-economic impacts of mass rapid transit using GIS BITS Pilani Pilani Campus Dr. Rajiv Gupta, Senior Professor, Department of Civil Engineering, Birla Institute of Technology and Science
Multi-scale and multi-sensor analysis of urban cluster development and agricultural land loss in India
 Multi-scale and multi-sensor analysis of urban cluster development and agricultural land loss in India Karen C. Seto, PI, Yale Michail Fragkias, Co-I, Arizona State Annemarie Schneider, Co-I, U of Wisconsin
DEVELOPMENT OF LAND USE BY HMDA USING REGRESSION MODEL
 DEVELOPMENT OF LAND USE BY HMDA USING REGRESSION MODEL T. Saikrishna Bharadwaj 1, Mohammed Ibrahim 2, B. Prasad 3, Arumulla Raju 4 1 PG Student, Dept. of Civil Engineering, Mallareddy Institute of Technology
Multiple Regression and Model Building (cont d) + GIS Lecture 21 3 May 2006 R. Ryznar
 + GIS Lecture 21 3 May 2006 R. Ryznar") Multiple Regression and Model Building (cont d) + GIS 11.220 Lecture 21 3 May 2006 R. Ryznar Model Summary b 1-[(SSE/n-k+1)/(SST/n-1)] Model 1 Adjusted Std. Error of R R Square R Square the Estimate.991
Multiple Regression and Model Building (cont d) + GIS 11.220 Lecture 21 3 May 2006 R. Ryznar Model Summary b 1-[(SSE/n-k+1)/(SST/n-1)] Model 1 Adjusted Std. Error of R R Square R Square the Estimate.991
How Geography Affects Consumer Behaviour The automobile example
 How Geography Affects Consumer Behaviour The automobile example Murtaza Haider, PhD Chuck Chakrapani, Ph.D. We all know that where a consumer lives influences his or her consumption patterns and behaviours.
Analysis on Competitiveness of Regional Central Cities:
 Int. Statistical Inst.: Proc. 58th World Statistical Congress, 2011, Dublin (Session IPS031) p.476 Analysis on Competitiveness of Regional Central Cities: the case of Yangtze River Delta Xiaolin Pang,
WORLD COUNCIL ON CITY DATA
 WORLD COUNCIL ON CITY DATA WCCD ISO 37120 STANDARDIZED CITY DATA TO MEET UN SDG TARGETS UN WORLD DATA FORUM Presented by: James Patava www.dataforcities.org @wccitydata PUBLICATION OF THE FIRST ISO STANDARD
Global Atmospheric Circulation. Past climate change and natural causes. Global climate change and human activity
 GCSE Geography Edexcel B Revision Checklist Paper 1. Global Geographical Issues Topic 1. Hazardous Earth Key Idea I know/ understand The world s climate system Global Atmospheric Circulation Past climate
Vulnerability Mapping for Disaster Assessment Using ArcGIS Tools and Techniques for Mumbai City, India
 Vulnerability Mapping for Disaster Assessment Using ArcGIS Tools and Techniques for Mumbai City, India Reshma Raskar-Phule Assistant Professor, Department of Civil Engineering, Sardar Patel College of
Variance Decomposition and Goodness of Fit
 Variance Decomposition and Goodness of Fit 1. Example: Monthly Earnings and Years of Education In this tutorial, we will focus on an example that explores the relationship between total monthly earnings