Remote Sensing Techniques for Characterizing Distribution of Impact Area Energetic Compounds
|
|
|
- Lilian Sanders
- 6 years ago
- Views:
Transcription
1 Remote Sensing Techniques for Characterizing Distribution of Impact Area Energetic Compounds Mr. Mark R. Graves US Army Engineer R&D Center Environmental Laboratory Vicksburg, MS ,
2 Project Description and Objectives Description Application of innovative techniques to develop predictive models of load and spatial distribution of explosive contaminants on impact areas Objectives Focus on the use of geospatial technologies (remote sensing and GIS) to measure surrogate factors which may be related to distribution of explosive contaminants Determine the strength of these relationships using valid statistical techniques Develop a model which can then be used as a non sitespecific methodology for characterizing the spatial distribution of HE residues across impact areas
3 Energetic Compounds TNT RDX Tetryl 1,3,5-TNB 4-Am-DNT 2-Am-DNT NG 2,4-DNT HMX
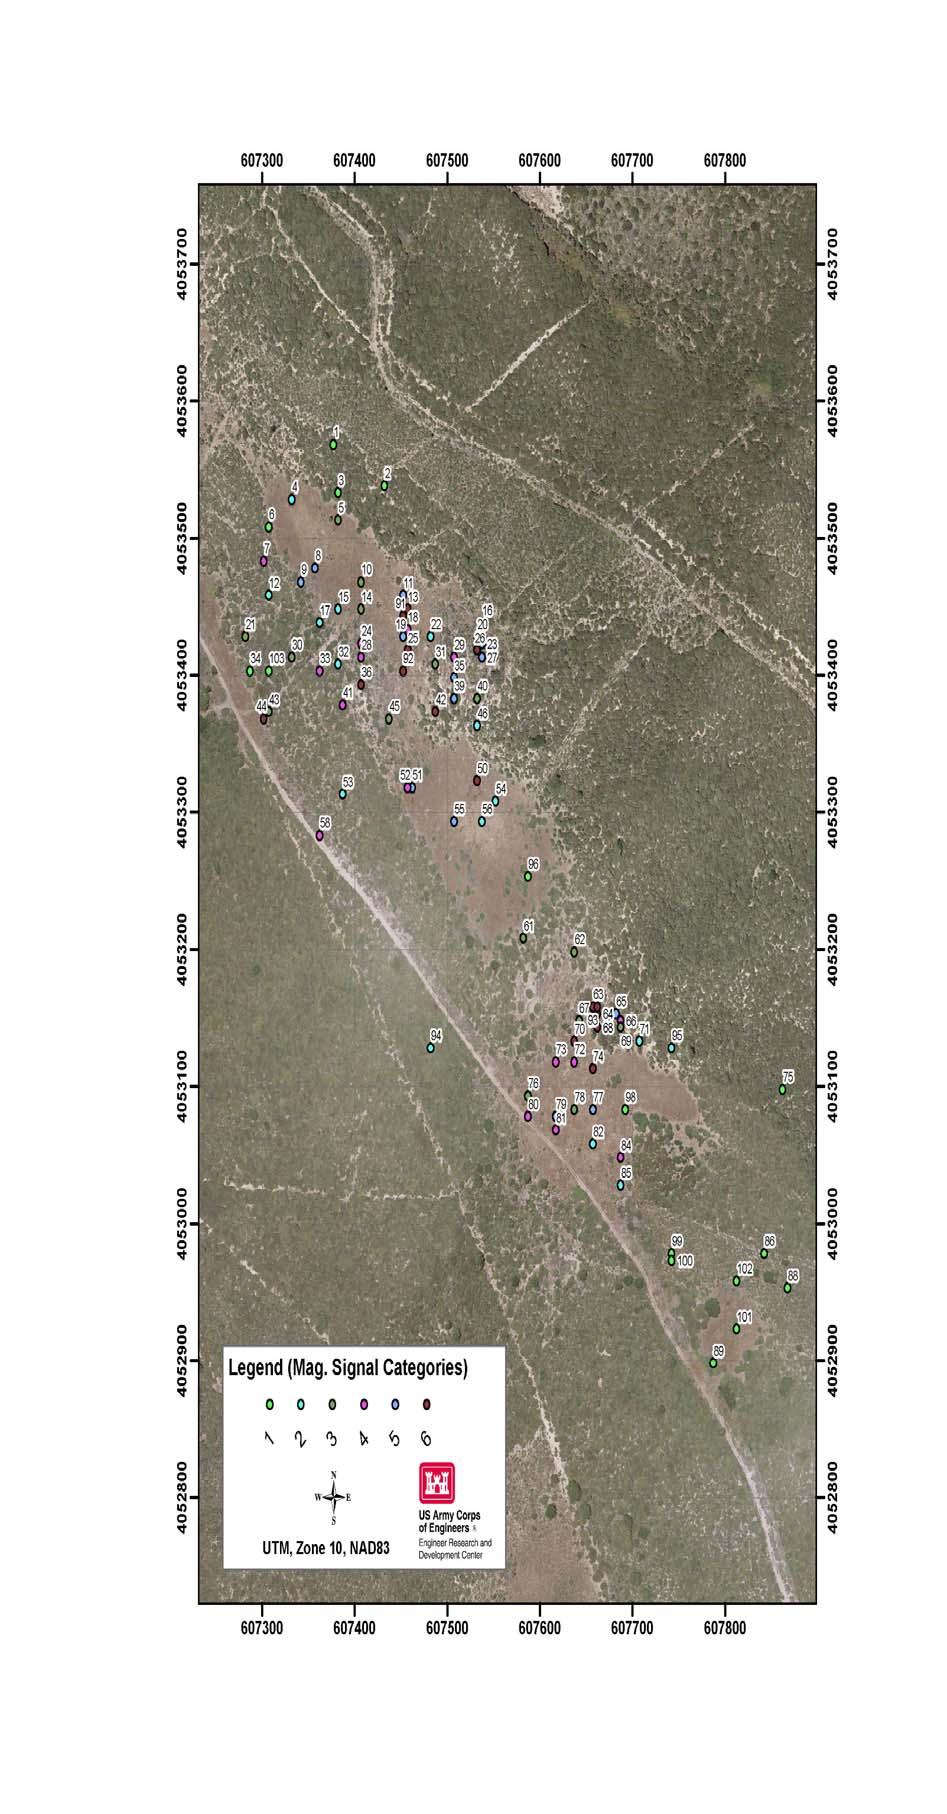
4 Survey Area and Remote Ft. Ord,, CA Sensing Strategy 2603 ha including boundary roads survey area consisted of 2562 embedded hectares within this area Remote Sensing Helicopter-based magnetometer and EM data transect sampling at 50% density height of 2 to 5.5 meters

5 Remote Sensing Data Collection

6 Data Collection in Progress

7 Remote Sensing Data Collection

8 Magnetometer Data Analytic Signal


9 Magnetometer Data Analytic Signal Classes developed using Jenks Natural Breaks Method -minimizes within class difference and maximizes between class difference

10 Magnetometer Data Analytic Signal
11 Magnetometer Data Analytic Signal

12 Magnetometer Data Analytic Signal
13
14 Soil Sampling Site center located using GPS 5m Using pre-cut ropes and compass, corner points were established 25 samples gathered using shovel and/or special shovel device 5m North


15 Soil Sampling
16 Soil Sampling Protocols Soil samples were collected from a 5m by 5m grid associated with the locations identified as potential contaminant source locations. Twenty-five (25) subsamples were systematically sampled and the sediment was extracted to a depth of ~ 2 inches. Soil samples were shipped to CRREL and prepared for evaluation. Contaminant concentrations were measured using a GC-ECD ECD according to Environmental Protection Agency (EPA) SW846 Method 8095 (US EPA 1999).
17 Scatter Plot of Energetics vs Metal Content (nt/m( nt/m)
18 Models Linear regression on untransformed data. Linear regression on transformed data logarithm square root reciprocal
19 Modeling Results Model Intercept Slope R 2 F p-value % % % %
20 Problems Data are not normally distributed. Transformations did not appear to normalize the data. Data are highly skewed. Coefficients of Determination are low. Pearson s Type III distribution appears to best fit the data. Modeled the data using generalized linear modeling with a gamma distribution.
21 Non-Parametric Analyses GridCode Non-Parametric Median Test N Mean GRIDCODE (Analytic Signal Ranges) Score Sum Median Std Deviation Summary: Larger class values of analytic signal are associated with larger values of energetic compounds (subtly at least)
22 Logistic Analysis Observations were classified as Detectable or Not Number of Observations Yes Predicted No Yes (72.7%) 15 (27.3%) No (30.6%) 25 (69.4%) Model Estimate ξ 2 p-value Intercept Slope
23 Logistical Analysis Logistic regression: Results highly significant P < (Likelihood Ratio) P = (Wald) log(odds) = AS (Where AS = mag analytic signal) Prob of detecting energetics: 38% at lowest value of AS (0.1060) 50% at AS of (6.9134) > 80% at AS of ( ) Plot of mean analytic signal versus probability of detection of energetics.
24 Conclusions Remote sensing techniques do help predict where you are most likely to detect energetic compounds However, a relationship of analytic signal to energetic concentrations is weak Due to distributed nature of compounds Photodegradation / vertical transport / etc.
25 Other Comments Ft. Ord was not an ideal place for study Site had been surface-cleared Closed for approximately 10 years Energetic levels detected in soil were very low Support provided by Ft. Ord BRAC office was critical Dealt with media (ABC, CBS news coverage) and public meetings prior to remote sensing flights Cost-shared remote sensing data acquisition (60%) Provided EOD personnel for soil sampling team Team Effort ORNL/Battelle (Jeff Gamey, Les Beard, Bill Doll) (REMOTE SENSING) CRREL (Tom Jenkins, Susan Bigl, Marianne Walsh, Alan Hewitt, Dennis Lambert, Nancy Perron) (SOIL SAMPLING AND ANALYSIS) LSU and ULM (Drs. Jay Geaghan and Dale Magoun) (STATISTICAL ANALYSES)
26 Remote Sensing Techniques for Characterizing Distribution of Impact Area Energetic Compounds Mr. Mark R. Graves US Army Engineer R&D Center Environmental Laboratory Vicksburg, MS ,
Incremental Sampling Methodology
 Incremental Sampling Methodology Advancing the Practice In Massachusetts Jay Clausen: U.S. ACE, ERDC/CRREL Nancy Bettinger: MassDEP/ORS Nancy Bettinger This Presentation Overview of ISM Planning ISM Projects
and Engineering Laboratory Cold Regions Research Representative Sampling for Energetic Compounds at an Antitank Firing Range ERDC/CRREL TR-04-7
 ERDC/CRREL TR-04-7 Representative Sampling for Energetic Compounds at an Antitank Firing Range US Army Corps of Engineers Engineer Research and Development Center Thomas F. Jenkins, Thomas A. Ranney, Alan
A Proposed Approach for Characterizing Large Military Ranges
 A Proposed Approach for Characterizing Large Military Ranges Jay Clausen Physical Research Scientist Hanover, NH July 25, 2013 US Army Corps of Engineers Large Ranges Characterization Issues Lack of a
METHOD 8330B NITROAROMATICS, NITRAMINES, AND NITRATE ESTERS BY HIGH PERFORMANCE LIQUID CHROMATOGRAPHY (HPLC)
") METHOD 8330B NITROAROMATICS, NITRAMINES, AND NITRATE ESTERS BY HIGH PERFORMANCE LIQUID CHROMATOGRAPHY (HPLC) SW-846 is not intended to be an analytical training manual. Therefore, method procedures are
METHOD 8330B NITROAROMATICS, NITRAMINES, AND NITRATE ESTERS BY HIGH PERFORMANCE LIQUID CHROMATOGRAPHY (HPLC) SW-846 is not intended to be an analytical training manual. Therefore, method procedures are
Data Collection and GIS Applications
 Data Collection and GIS Applications Governor s s Conference on the Management of the Illinois River System Jeff Jack of all Trades Boeckler, IDNR Introduction Collecting available GIS data sets Creating
Incremental Sampling Methodology Status Report on ITRC Guidance
 Better Site Characterization Through Incremental Sampling Methodology Status Report on ITRC Guidance Mark Bruce Ph. D. 2011, TestAmerica Laboratories, Inc. All rights reserved. TestAmerica & Design are
Innovative Technologies and Methodologies to Help Solve Complex Problems in Spatial River Studies
 Innovative Technologies and Methodologies to Help Solve Complex Problems in Spatial River Studies John V. Sloat Chief Technical officer WaterCube, LLC Overview Water depth, water-velocity, and water-surface
Linear Regression Models P8111
 Linear Regression Models P8111 Lecture 25 Jeff Goldsmith April 26, 2016 1 of 37 Today s Lecture Logistic regression / GLMs Model framework Interpretation Estimation 2 of 37 Linear regression Course started
Varying Bathymetric Data Collection Methods and their Impact on Impoundment Volume and Sediment Load Calculations I.A. Kiraly 1, T.
 Varying Bathymetric Data Collection Methods and their Impact on Impoundment Volume and Sediment Load Calculations I.A. Kiraly 1, T. Sullivan 2 1 Gomez and Sullivan Engineers, D.P.C., 41 Liberty Hill Road,
METHOD 8330A NITROAROMATICS AND NITRAMINES BY HIGH PERFORMANCE LIQUID CHROMATOGRAPHY (HPLC)
") METHOD 8330A NITROAROMATICS AND NITRAMINES BY HIGH PERFORMANCE LIQUID CHROMATOGRAPHY (HPLC) 1.0 SCOPE AND APPLICATION 1.1 Method 8330 is intended for the trace analysis of explosives residues by high performance
METHOD 8330A NITROAROMATICS AND NITRAMINES BY HIGH PERFORMANCE LIQUID CHROMATOGRAPHY (HPLC) 1.0 SCOPE AND APPLICATION 1.1 Method 8330 is intended for the trace analysis of explosives residues by high performance
INCREMENTAL SAMPLING METHODOLOGY
 INCREMENTAL SAMPLING METHODOLOGY 1. INTRODUCTION Incremental sampling methodology (ISM) is a structured composite sampling and processing protocol having specific elements designed to reduce data variability
STA 4504/5503 Sample Exam 1 Spring 2011 Categorical Data Analysis. 1. Indicate whether each of the following is true (T) or false (F).
 or false (F).") STA 4504/5503 Sample Exam 1 Spring 2011 Categorical Data Analysis 1. Indicate whether each of the following is true (T) or false (F). (a) (b) (c) (d) (e) In 2 2 tables, statistical independence is equivalent
STA 4504/5503 Sample Exam 1 Spring 2011 Categorical Data Analysis 1. Indicate whether each of the following is true (T) or false (F). (a) (b) (c) (d) (e) In 2 2 tables, statistical independence is equivalent
Geospatial Data Solutions: Site and Corridor Siting Projects. Rachel Turney-Work
 Geospatial Data Solutions: Site and Corridor Siting Projects Rachel Turney-Work Agenda GIS-based Corridor Routing Definition Major Components Uses and Functionality Geospatial Data Sources Data Accuracy
Measurement of Trace Explosive Residues in a Surrogate Operational Environment: Implications for Tactical Use of Chemical Sensing in C-IED Operations*
 Measurement of Trace Explosive Residues in a Surrogate Operational Environment: Implications for Tactical Use of Chemical Sensing in C-IED Operations* Roderick R. Kunz, Kerin Clow, Dennis Hardy Lincoln
SMAM 319 Exam1 Name. a B.The equation of a line is 3x + y =6. The slope is a. -3 b.3 c.6 d.1/3 e.-1/3
 SMAM 319 Exam1 Name 1. Pick the best choice. (10 points-2 each) _c A. A data set consisting of fifteen observations has the five number summary 4 11 12 13 15.5. For this data set it is definitely true
Logistic Regressions. Stat 430
 Logistic Regressions Stat 430 Final Project Final Project is, again, team based You will decide on a project - only constraint is: you are supposed to use techniques for a solution that are related to
3D NUMERICAL SIMULATION OF THE TRANSPORT OF EXPLOSIVES FROM UXO s AND LANDMINES
 3D NUMERICAL SIMULATION OF THE TRANSPORT OF EXPLOSIVES FROM UXO s AND LANDMINES Maik Irrazábal, Julio G. Briano, Miguel Castro, and Samuel P. Hernández Center for Chemical Sensors Development, University
Unit Six Information. EOCT Domain & Weight: Algebra Connections to Statistics and Probability - 15%
 GSE Algebra I Unit Six Information EOCT Domain & Weight: Algebra Connections to Statistics and Probability - 15% Curriculum Map: Describing Data Content Descriptors: Concept 1: Summarize, represent, and
Laboratory Support for Multi-Increment Sampling
 Laboratory Support for Multi-Increment Sampling Mark Bruce Ph.D Larry Penfold USACE Fort Worth and Sacramento Districts 2008, TestAmerica Laboratories, Inc. All rights reserved. TestAmerica & Design are
MULTIPLE REGRESSION METHODS
 DEPARTMENT OF POLITICAL SCIENCE AND INTERNATIONAL RELATIONS Posc/Uapp 816 MULTIPLE REGRESSION METHODS I. AGENDA: A. Residuals B. Transformations 1. A useful procedure for making transformations C. Reading:
and Engineering Laboratory
 ERDC/CRREL TR-08-10 Energetic Residues and Crater Geometries from the Firing of 120-mm High-Explosive Mortar Projectiles into Eagle River Flats, June 2007 Marianne E. Walsh, Charles M. Collins, Michael
STA 4504/5503 Sample Exam 1 Spring 2011 Categorical Data Analysis. 1. Indicate whether each of the following is true (T) or false (F).
 or false (F).") STA 4504/5503 Sample Exam 1 Spring 2011 Categorical Data Analysis 1. Indicate whether each of the following is true (T) or false (F). (a) T In 2 2 tables, statistical independence is equivalent to a population
STA 4504/5503 Sample Exam 1 Spring 2011 Categorical Data Analysis 1. Indicate whether each of the following is true (T) or false (F). (a) T In 2 2 tables, statistical independence is equivalent to a population
Appendix I. Dredged Volume Estimates. Draft Contractor Document: Subject to Continuing Agency Review
 Appendix I Dredged Volume Estimates Draft Contractor Document: Subject to Continuing Agency Review Interoffice Correspondence Date: April 6, 2007 To: L. Bossi (WHI) Copy: S. Thompson (WHI), B. Fidler (NNJ)
Count data page 1. Count data. 1. Estimating, testing proportions
 Count data page 1 Count data 1. Estimating, testing proportions 100 seeds, 45 germinate. We estimate probability p that a plant will germinate to be 0.45 for this population. Is a 50% germination rate
Explosives by HPLC, LC/MS and LC/MS/MS
 Ask The Expert Webinar Series Explosives by HPLC, LC/MS and LC/MS/MS Karla Buechler Corporate Technical Director August 2, 2016 Presentation Outline A Historical Overview of Explosive Chemicals An Introduction
Logistic Regression 21/05
 Logistic Regression 21/05 Recall that we are trying to solve a classification problem in which features x i can be continuous or discrete (coded as 0/1) and the response y is discrete (0/1). Logistic regression
Separation of Explosives in EPA 8330: Column Choices Optimize Speed, Resolution, and Solvent Use. Application. Authors. Abstract.
 Separation of Explosives in EPA 833: Column Choices Optimize Speed, Resolution, and Solvent Use Application Environmental Authors John W. Henderson Jr. and William J. Long Agilent Technologies, Inc. 28
y = 3 x + k and results in the function graphed to the right. Determine the value of k.
 Math I Review #1 Math I Review # 1. Solve 4(+) 5 = + 8 1. Jack s bowling score was 0 less than twice Jill s score. The sum of their scores was 05. What was Jack s score?. Graph the system y 4 + y 9. Find
Chapter Goals. To understand the methods for displaying and describing relationship among variables. Formulate Theories.
 Chapter Goals To understand the methods for displaying and describing relationship among variables. Formulate Theories Interpret Results/Make Decisions Collect Data Summarize Results Chapter 7: Is There
Data Mining Based Anomaly Detection In PMU Measurements And Event Detection
 Data Mining Based Anomaly Detection In PMU Measurements And Event Detection P. Banerjee, S. Pandey, M. Zhou, A. Srivastava, Y. Wu Smart Grid Demonstration and Research Investigation Lab (SGDRIL) Energy
Chapter 22: Log-linear regression for Poisson counts
 Chapter 22: Log-linear regression for Poisson counts Exposure to ionizing radiation is recognized as a cancer risk. In the United States, EPA sets guidelines specifying upper limits on the amount of exposure
ESP 178 Applied Research Methods. 2/23: Quantitative Analysis
 ESP 178 Applied Research Methods 2/23: Quantitative Analysis Data Preparation Data coding create codebook that defines each variable, its response scale, how it was coded Data entry for mail surveys and
Regression models. Categorical covariate, Quantitative outcome. Examples of categorical covariates. Group characteristics. Faculty of Health Sciences
 Faculty of Health Sciences Categorical covariate, Quantitative outcome Regression models Categorical covariate, Quantitative outcome Lene Theil Skovgaard April 29, 2013 PKA & LTS, Sect. 3.2, 3.2.1 ANOVA
Stat 101 Exam 1 Important Formulas and Concepts 1
 1 Chapter 1 1.1 Definitions Stat 101 Exam 1 Important Formulas and Concepts 1 1. Data Any collection of numbers, characters, images, or other items that provide information about something. 2. Categorical/Qualitative
Chapter 6 The 2 k Factorial Design Solutions
 Solutions from Montgomery, D. C. (004) Design and Analysis of Experiments, Wiley, NY Chapter 6 The k Factorial Design Solutions 6.. A router is used to cut locating notches on a printed circuit board.
Pacing Guide Algebra 1
 Pacing Guide Algebra Chapter : Equations and Inequalities (one variable) Section Section Title Learning Target(s) I can. Evaluate and Simplify Algebraic Expressions. Evaluate and simplify numeric and algebraic
8. Find r a! r b. a) r a = [3, 2, 7], r b = [ 1, 4, 5] b) r a = [ 5, 6, 7], r b = [2, 7, 4]
![8. Find r a! r b. a) r a = [3, 2, 7], r b = [ 1, 4, 5] b) r a = [ 5, 6, 7], r b = [2, 7, 4]](/thumbs/95/122742655.jpg "8. Find r a! r b. a) r a = [3, 2, 7], r b = [ 1, 4, 5] b) r a = [ 5, 6, 7], r b = [2, 7, 4]") Chapter 8 Prerequisite Skills BLM 8-1.. Linear Relations 1. Make a table of values and graph each linear function a) y = 2x b) y = x + 5 c) 2x + 6y = 12 d) x + 7y = 21 2. Find the x- and y-intercepts of
Chapter 8 Prerequisite Skills BLM 8-1.. Linear Relations 1. Make a table of values and graph each linear function a) y = 2x b) y = x + 5 c) 2x + 6y = 12 d) x + 7y = 21 2. Find the x- and y-intercepts of
RITS Fall 2009 Getting the Most Out of Your Conceptual Site Model 1
 of Your Conceptual Site Model 1 of Your Conceptual Site Model 2 of Your Conceptual Site Model 3 of Your Conceptual Site Model 4 of Your Conceptual Site Model 5 The CSM is a comprehensive representation
Institute of Actuaries of India
 Institute of Actuaries of India Subject CT3 Probability and Mathematical Statistics For 2018 Examinations Subject CT3 Probability and Mathematical Statistics Core Technical Syllabus 1 June 2017 Aim The
History & Scope of Remote Sensing FOUNDATIONS
 History & Scope of Remote Sensing FOUNDATIONS Lecture Overview Introduction Overview of visual information Power of imagery Definition What is remote sensing? Definition standard for class History of Remote
2/26/2017. PSY 512: Advanced Statistics for Psychological and Behavioral Research 2
 PSY 512: Advanced Statistics for Psychological and Behavioral Research 2 When and why do we use logistic regression? Binary Multinomial Theory behind logistic regression Assessing the model Assessing predictors
Parametric Estimating Nonlinear Regression
 Parametric Estimating Nonlinear Regression The term nonlinear regression, in the context of this job aid, is used to describe the application of linear regression in fitting nonlinear patterns in the data.
Correlation and Regression
 Correlation and Regression October 25, 2017 STAT 151 Class 9 Slide 1 Outline of Topics 1 Associations 2 Scatter plot 3 Correlation 4 Regression 5 Testing and estimation 6 Goodness-of-fit STAT 151 Class
Chemical Radiological & Explosive. Detection Solutions for First Responders
 WWW.NATS-USA.COM Chemical Radiological & Explosive Detection Solutions for First Responders North American Technical Services Bridging Technology Innovative Innovative Solutions Solutions in Radiation,
Chesapeake Bay Remote Sensing Pilot Executive Briefing
 Chesapeake Bay Remote Sensing Pilot Executive Briefing Introduction In his Executive Order 13506 in May 2009, President Obama stated The Chesapeake Bay is a national treasure constituting the largest estuary
Stat 101 L: Laboratory 5
 Stat 101 L: Laboratory 5 The first activity revisits the labeling of Fun Size bags of M&Ms by looking distributions of Total Weight of Fun Size bags and regular size bags (which have a label weight) of
Statistics for exp. medical researchers Regression and Correlation
 Faculty of Health Sciences Regression analysis Statistics for exp. medical researchers Regression and Correlation Lene Theil Skovgaard Sept. 28, 2015 Linear regression, Estimation and Testing Confidence
Predictive Model for Archaeological Resources. Marine Corps Base Quantico, Virginia John Haynes Jesse Bellavance
 Predictive Model for Archaeological Resources Marine Corps Base Quantico, Virginia John Haynes Jesse Bellavance Report Documentation Page Form Approved OMB No. 0704-0188 Public reporting burden for the
Big-Geo-Data EHR Infrastructure Development for On-Demand Analytics
 Big-Geo-Data EHR Infrastructure Development for On-Demand Analytics Sohayla Pruitt, MA Senior Geospatial Scientist Duke Medicine DUHS DHTS EIM HIRS Page 1 Institute of Medicine, World Health Organization,
ANALYSIS OF LOCALIZED HIGH MAGNETIC SUSCEPTIBILITY ZONES AT JEFFERSON PROVING GROUND, INDIANA
 ANALYSIS OF LOCALIZED HIGH MAGNETIC SUSCEPTIBILITY ZONES AT JEFFERSON PROVING GROUND, INDIANA Ryan E. North*, Eric W. Smith, and Jose L. Llopis U. S. Army Engineer Research and Development Center Geotechnical
Web-enabled GIS Services
 Austin Davis Research Geographer US Army Engineer Research and Development Center, Environmental Laboratory (EL) Waterways Experiment Station (WES), Vicksburg, Mississippi Environmental Systems Branch
Initial Evaluation of Inlet Thermal Desorption GC/MS Analysis for Organic Gunshot Residue from the Hands of Known Shooters
 Initial Evaluation of Inlet Thermal Desorption GC/MS Analysis for Organic Gunshot Residue from the Hands of Known Shooters Agilent Technologies NEAFS Workshop November 7, 2017 Presented by Dr. Suzanne
Toward an automatic real-time mapping system for radiation hazards
 Toward an automatic real-time mapping system for radiation hazards Paul H. Hiemstra 1, Edzer J. Pebesma 2, Chris J.W. Twenhöfel 3, Gerard B.M. Heuvelink 4 1 Faculty of Geosciences / University of Utrecht
Prob and Stats, Sep 23
 Prob and Stats, Sep 23 Calculator Scatter Plots and Equations of Lines of Fit Book Sections: 4.1 Essential Questions: How can the calculator help me to produce a scatter plot, and also the equation of
Passing-Bablok Regression for Method Comparison
 Chapter 313 Passing-Bablok Regression for Method Comparison Introduction Passing-Bablok regression for method comparison is a robust, nonparametric method for fitting a straight line to two-dimensional
On Improving the Output of. a Statistical Model
 On Improving the Output of Mark Delgado 4/19/2016 a Statistical Model Using GFS single point outputs for a linear regression model and improve forecasting i. Introduction Forecast Modelling Using computers
AP STATISTICS Name: Period: Review Unit IV Scatterplots & Regressions
 AP STATISTICS Name: Period: Review Unit IV Scatterplots & Regressions Know the definitions of the following words: bivariate data, regression analysis, scatter diagram, correlation coefficient, independent
Name Class Date. Residuals and Linear Regression Going Deeper
 Name Class Date 4-8 and Linear Regression Going Deeper Essential question: How can you use residuals and linear regression to fit a line to data? You can evaluate a linear model s goodness of fit using
Final Exam Review Packet
 Final Exam Review Packet Multiple Choice Identify the choice that best completes the statement or answers the question. 1. Find the length of the missing side. The triangle is not drawn to scale. 6 8 a.
Inference and Regression
 Name Inference and Regression Final Examination, 2015 Department of IOMS This course and this examination are governed by the Stern Honor Code. Instructions Please write your name at the top of this page.
Survival Analysis Math 434 Fall 2011
 Survival Analysis Math 434 Fall 2011 Part IV: Chap. 8,9.2,9.3,11: Semiparametric Proportional Hazards Regression Jimin Ding Math Dept. www.math.wustl.edu/ jmding/math434/fall09/index.html Basic Model Setup
Problem Set 1 ANSWERS
 Economics 20 Prof. Patricia M. Anderson Problem Set 1 ANSWERS Part I. Multiple Choice Problems 1. If X and Z are two random variables, then E[X-Z] is d. E[X] E[Z] This is just a simple application of one
* Tuesday 17 January :30-16:30 (2 hours) Recored on ESSE3 General introduction to the course.
 Recored on ESSE3 General introduction to the course.") Name of the course Statistical methods and data analysis Audience The course is intended for students of the first or second year of the Graduate School in Materials Engineering. The aim of the course
Name of the course Statistical methods and data analysis Audience The course is intended for students of the first or second year of the Graduate School in Materials Engineering. The aim of the course
A Detailed Examination of DTM Creation Methods and Sources. Study Area Overview
 A Detailed Examination of DTM Creation Methods and Sources Adam Mosbrucker & Melinda Lamb Geography 593: Dec. 2 nd, 2010 Study Area Overview Mt. St. Helens -active volcano many eruptions in the past 30
Shielding. Principles. Effectiveness. Materials FM Appendix B
 Appendix B Shielding Shielding reduces the effects of gamma radiation on personnel and equipment. Metal, concrete, soil, water, and wood are good shielding materials. The denser the material, the better
Module 1. Identify parts of an expression using vocabulary such as term, equation, inequality
 Common Core Standards Major Topic Key Skills Chapters Key Vocabulary Essential Questions Module 1 Pre- Requisites Skills: Students need to know how to add, subtract, multiply and divide. Students need
RESEARCH METHODOLOGY
 III. RESEARCH METHODOLOGY 3.1. Time and Research Area The field work was taken place in primary forest around Toro village in Lore Lindu National Park, Indonesia. The study area located in 120 o 2 53 120
Predictive Modeling Using Logistic Regression Step-by-Step Instructions
 Predictive Modeling Using Logistic Regression Step-by-Step Instructions This document is accompanied by the following Excel Template IntegrityM Predictive Modeling Using Logistic Regression in Excel Template.xlsx
R Hints for Chapter 10
 R Hints for Chapter 10 The multiple logistic regression model assumes that the success probability p for a binomial random variable depends on independent variables or design variables x 1, x 2,, x k.
BUILDING AN ASSET MANAGEMENT GEODATABASE FOR RANCHING. Matt Crawford, GISP
 BUILDING AN ASSET MANAGEMENT GEODATABASE FOR RANCHING Matt Crawford, GISP Introduction East Foundation Formed in 2007 Mission Research Education Outreach Properties Six ranches ~ 215,000 acres San Antonio
A strategy for modelling count data which may have extra zeros
 A strategy for modelling count data which may have extra zeros Alan Welsh Centre for Mathematics and its Applications Australian National University The Data Response is the number of Leadbeater s possum
STA102 Class Notes Chapter Logistic Regression
 STA0 Class Notes Chapter 0 0. Logistic Regression We continue to study the relationship between a response variable and one or more eplanatory variables. For SLR and MLR (Chapters 8 and 9), our response
Int Math 1 Statistic and Probability. Name:
 Name: Int Math 1 1. Juan wants to rent a house. He gathers data on many similar houses. The distance from the center of the city, x, and the monthly rent for each house, y, are shown in the scatter plot.
Wednesday August 24, 2016
 1.1 Functions Wednesday August 24, 2016 EQs: 1. How to write a relation using set-builder & interval notations? 2. How to identify a function from a relation? 1. Subsets of Real Numbers 2. Set-builder
Inference and Regression
 Name Inference and Regression Final Examination, 2016 Department of IOMS This course and this examination are governed by the Stern Honor Code. Instructions Please write your name at the top of this page.
Chapter 8 (More on Assumptions for the Simple Linear Regression)
") EXST3201 Chapter 8b Geaghan Fall 2005: Page 1 Chapter 8 (More on Assumptions for the Simple Linear Regression) Your textbook considers the following assumptions: Linearity This is not something I usually
EXST3201 Chapter 8b Geaghan Fall 2005: Page 1 Chapter 8 (More on Assumptions for the Simple Linear Regression) Your textbook considers the following assumptions: Linearity This is not something I usually
Logistic Regression - problem 6.14
 Logistic Regression - problem 6.14 Let x 1, x 2,, x m be given values of an input variable x and let Y 1,, Y m be independent binomial random variables whose distributions depend on the corresponding values
ALGEBRA I SEMESTER EXAMS PRACTICE MATERIALS SEMESTER (1.1) Examine the dotplots below from three sets of data Set A
 Examine the dotplots below from three sets of data Set A") 1. (1.1) Examine the dotplots below from three sets of data. 0 2 4 6 8 10 Set A 0 2 4 6 8 10 Set 0 2 4 6 8 10 Set C The mean of each set is 5. The standard deviations of the sets are 1.3, 2.0, and 2.9.
1. (1.1) Examine the dotplots below from three sets of data. 0 2 4 6 8 10 Set A 0 2 4 6 8 10 Set 0 2 4 6 8 10 Set C The mean of each set is 5. The standard deviations of the sets are 1.3, 2.0, and 2.9.
Imagine the result Sediment Sampling Plan. 1½-Mile Reach of the Housatonic River. General Electric Company Pittsfield, Massachusetts
 Imagine the result General Electric Company Pittsfield, Massachusetts 2012 Sediment Sampling Plan 1½-Mile Reach of the Housatonic River March 2012 2012 Sediment Sampling Plan 1½-Mile Reach of the Housatonic
ECLT 5810 Linear Regression and Logistic Regression for Classification. Prof. Wai Lam
 ECLT 5810 Linear Regression and Logistic Regression for Classification Prof. Wai Lam Linear Regression Models Least Squares Input vectors is an attribute / feature / predictor (independent variable) The
Using GIS to Evaluate Rural Emergency Medical Services (EMS)
") Using GIS to Evaluate Rural Emergency Medical Services (EMS) Zhaoxiang He Graduate Research Assistant Xiao Qin Ph.D., P.E. Associate Professor Outline Introduction Literature Review Study Design Data Collection
Using GIS to Evaluate Rural Emergency Medical Services (EMS) Zhaoxiang He Graduate Research Assistant Xiao Qin Ph.D., P.E. Associate Professor Outline Introduction Literature Review Study Design Data Collection
Coastal and Hydraulics Laboratory
 SAM Hydraulic Design Package for Channels Coastal and Hydraulics Laboratory William A. Thomas, Ronald R. Copeland, and Dinah N. McComas September 2002 Approved for public release; distribution is unlimited.
KEYSTONE ALGEBRA I REVIEW
 1. Which graph represents a linear function 4. The faces of a cube are numbered from 1 to 6. If the cube is tossed once, what is the probability that a prime number or a number divisible by 2 is obtained
Stat/F&W Ecol/Hort 572 Review Points Ané, Spring 2010
 1 Linear models Y = Xβ + ɛ with ɛ N (0, σ 2 e) or Y N (Xβ, σ 2 e) where the model matrix X contains the information on predictors and β includes all coefficients (intercept, slope(s) etc.). 1. Number of
STAT 7030: Categorical Data Analysis
 STAT 7030: Categorical Data Analysis 5. Logistic Regression Peng Zeng Department of Mathematics and Statistics Auburn University Fall 2012 Peng Zeng (Auburn University) STAT 7030 Lecture Notes Fall 2012
STANDARD OPERATING PROCEDURES SOP: 1828 PAGE: 1 of 14 REV: 0.0 DATE: 05/12/95 ANALYSIS OF METHYL PARATHION IN CARPET SAMPLES BY GC/MS
 PAGE: 1 of 14 1.0 SCOPE AND APPLICATION 2.0 METHOD SUMMARY CONTENTS 3.0 SAMPLE PRESERVATION, CONTAINERS, HANDLING AND STORAGE 4.0 INTERFERENCES AND POTENTIAL PROBLEMS 5.0 EQUIPMENT/APPARATUS 6.0 REAGENTS
Summer Review for Mathematical Studies Rising 12 th graders
 Summer Review for Mathematical Studies Rising 12 th graders Due the first day of school in August 2017. Please show all work and round to 3 significant digits. A graphing calculator is required for these
EXAMINATIONS OF THE HONG KONG STATISTICAL SOCIETY
 EXAMINATIONS OF THE HONG KONG STATISTICAL SOCIETY MODULE 4 : Linear models Time allowed: One and a half hours Candidates should answer THREE questions. Each question carries 20 marks. The number of marks
Why Is It There? Attribute Data Describe with statistics Analyze with hypothesis testing Spatial Data Describe with maps Analyze with spatial analysis
 6 Why Is It There? Why Is It There? Getting Started with Geographic Information Systems Chapter 6 6.1 Describing Attributes 6.2 Statistical Analysis 6.3 Spatial Description 6.4 Spatial Analysis 6.5 Searching
Better Site Characterization through Incremental Sampling Methodology Mark Bruce Ph. D.
 Better Site Characterization through Incremental Sampling Methodology Mark Bruce Ph. D. 2014, TestAmerica Laboratories, Inc. All rights reserved. TestAmerica & Design are trademarks of TestAmerica Laboratories,
Engineer Research and Development Center. Cost and Performance Report of Incremental Sampling Methodology for Soil Containing Metallic Residues
 ERDC TR-13-10 Environmental Science and Technology Certification Program Cost and Performance Report of Incremental Sampling Methodology for Soil Containing Metallic Residues Project ER-0918 Jay L. Clausen,
One Corps Serving the Army and the Nation. Improving the Quality of Environmental Samples
 Improving the Quality of Environmental Samples Initial Concerns Re Validity of Discrete Sampling, thanks to Sebastian Tindall, Portland 2002 How valid are discrete samples if they are not representative,
Unexploded Ordnance on Auckland s Doorstep. WasteMINZ November 2017
 Unexploded Ordnance on Auckland s Doorstep WasteMINZ November 2017 Scope Site Background. Site Assessment. Geophysical Survey. Investigation. Findings. Challenges. Key Points. Weiti Bay Site Access Road
Explosives Detection and Identification by PGNAA
 INL/EXT-06-01210 Explosives Detection and Identification by PGNAA E.H. Seabury A.J. Caffrey April 2006 The INL is a U.S. Department of Energy National Laboratory operated by Battelle Energy Alliance INL/EXT-06-01210
THE NEW ROLE FOR LC/MS AND LC/MS/MS IN EXPLOSIVES INVESTIGATIONS. L. Penfold Severn Trent Laboratories, Inc.
 THE NEW ROLE FOR LC/MS AND LC/MS/MS IN EXPLOSIVES INVESTIGATIONS L. Penfold Severn Trent Laboratories, Inc. INTRODUCTION Liquid chromatography/mass spectrometry (LC/MS) is an instrumental technique that
Approach to Field Research Data Generation and Field Logistics Part 1. Road Map 8/26/2016
 Approach to Field Research Data Generation and Field Logistics Part 1 Lecture 3 AEC 460 Road Map How we do ecology Part 1 Recap Types of data Sampling abundance and density methods Part 2 Sampling design
Box-Cox Transformations
 Box-Cox Transformations Revised: 10/10/2017 Summary... 1 Data Input... 3 Analysis Summary... 3 Analysis Options... 5 Plot of Fitted Model... 6 MSE Comparison Plot... 8 MSE Comparison Table... 9 Skewness
STATISTICS SYLLABUS UNIT I
 STATISTICS SYLLABUS UNIT I (Probability Theory) Definition Classical and axiomatic approaches.laws of total and compound probability, conditional probability, Bayes Theorem. Random variable and its distribution
A Generalized Linear Model for Binomial Response Data. Copyright c 2017 Dan Nettleton (Iowa State University) Statistics / 46
 Statistics / 46") A Generalized Linear Model for Binomial Response Data Copyright c 2017 Dan Nettleton (Iowa State University) Statistics 510 1 / 46 Now suppose that instead of a Bernoulli response, we have a binomial response
A Generalized Linear Model for Binomial Response Data Copyright c 2017 Dan Nettleton (Iowa State University) Statistics 510 1 / 46 Now suppose that instead of a Bernoulli response, we have a binomial response
Chapter 11. Regression with a Binary Dependent Variable
 Chapter 11 Regression with a Binary Dependent Variable 2 Regression with a Binary Dependent Variable (SW Chapter 11) So far the dependent variable (Y) has been continuous: district-wide average test score