Logistic Regressions. Stat 430
|
|
|
- Bennett Terry
- 5 years ago
- Views:
Transcription
1 Logistic Regressions Stat 430
2 Final Project Final Project is, again, team based You will decide on a project - only constraint is: you are supposed to use techniques for a solution that are related to material in the class (you can go beyond the content, but it will be part of the project to explain what you are doing) Nov 15 is the first deadline: submit an abstract of the project that you have decided on and a link to the data that you are planning on using
3 Outline Binary Responses Logistic Function Interpretation of Coefficients Comparison of models
4 Situation Response Variable is binary, e.g. Delayed Flight (yes, no) Assumption of normality of response is violated (or of errors - we only have two states for the error) Idea: model probability of response rather than yes/no states
5 Situation Still problematic: linear model does not ensure that predictions are within [0,1] We could change predictions to this range, but that will affect distribution and make inference problematic
6 Logistic Regression Binary Response Y Model should make sure that predictions are in [0,1] logistic function: exp(a+bx)/(1+exp(a+bx)) use logistic function to model probability of success
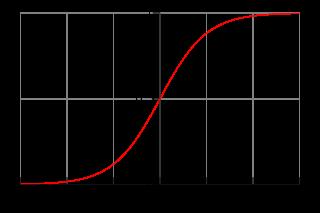

7 Logistic Regression e x /(1+e x )
8 Logistic Regression use logistic function to model probability of success: logit(πx) = a + Xb logit (πx) = log [πx/(1-πx)] transformed response makes model linear in parameters function in R: glm(y~x, family=binomial())
9 p(x) π(x) = exp(α + β x) /(1 + exp(α + β x) ) for β > 0, π(x) increases, for β < 0, π(x) decreases π(x)/(1 π(x)) = exp(α) exp(β x) for every unit in X, odds increase multiplicatively by exp(β) Since exp(βx) is approx (1 + βx + 0.5β 2 x ) we can interpret β as percentage change for every unit in X inflection point for π(x) = 0.5, for x = α/β (median effect, median lethal dose), steepest slope in inflection point: β/4 x
10 Example: Flights glm(formula = Delayed ~ Wind_SpeedMPH, family = binomial(), data = train) Deviance Residuals: Min 1Q Median 3Q Max Coefficients: Estimate Std. Error z value Pr(> z ) (Intercept) < 2e-16 *** Wind_SpeedMPH e-07 *** --- Signif. codes: 0 *** ** 0.01 * (Dispersion parameter for binomial family taken to be 1) Null deviance: on 6389 degrees of freedom Residual deviance: on 6388 degrees of freedom (253 observations deleted due to missingness) AIC: Number of Fisher Scoring iterations: 6
11 Example: Flights as.numeric(delayed) Wind_SpeedMPH
12 Goodness of fit We do not have R 2 (we can still compute it, but it doesn t have the nice distributional properties of the linear model) Use Deviance
13 Deviance Deviance is used for model comparisons: -2 * difference in log likelihood of two models Model M and saturated model: deviance of M, lack of fit of model M Model M and null model (intercept only): null deviance, improvement of model M Deviance difference is asymptotically χ 2 distributed (df given by difference in degrees of freedom)
14 Comparing Models > anova(model.wind, model.dow, test="chisq") Analysis of Deviance Table Model 1: Delayed ~ Wind_SpeedMPH Model 2: Delayed ~ Wind_SpeedMPH + factor(dayofweek) Resid. Df Resid. Dev Df Deviance P(> Chi ) e-05 *** --- Signif. codes: 0 *** ** 0.01 * Deviance difference for models M1, M2 where M1 is a submodel of M2
15 Flights Example > xtabs(~delayed+dayofweek, data=train) DayOfWeek Delayed FALSE TRUE Probability for delay is highest on day 3 Odds for delays on day three is the highest
16 Odds of an event Comparison of probability of an event with its complement odds of an event: P(event) / (1 - P(event)) e.g. fifty-fifty (means P(event) = 0.5) probability of rain = 0.6 gives odds for rain of 3/2
17 Odds Ratio assume we have two groups, want to compare odds of survival: odds ratio phi = ad/(bc) a b c d
18 Example: Flights Compare odds of Delays on Weekends vs Weekdays: odds of delay on weekday: 227/4494 = weekend: 79/1843 = odds ratio of delays on weekends is 0.85 Week day Week end delayed not
19 Bootstrapping Next:
Generalized linear models for binary data. A better graphical exploratory data analysis. The simple linear logistic regression model
 Stat 3302 (Spring 2017) Peter F. Craigmile Simple linear logistic regression (part 1) [Dobson and Barnett, 2008, Sections 7.1 7.3] Generalized linear models for binary data Beetles dose-response example
Logistic Regression 21/05
 Logistic Regression 21/05 Recall that we are trying to solve a classification problem in which features x i can be continuous or discrete (coded as 0/1) and the response y is discrete (0/1). Logistic regression
Exercise 5.4 Solution
 Exercise 5.4 Solution Niels Richard Hansen University of Copenhagen May 7, 2010 1 5.4(a) > leukemia
Interactions in Logistic Regression
 Interactions in Logistic Regression > # UCBAdmissions is a 3-D table: Gender by Dept by Admit > # Same data in another format: > # One col for Yes counts, another for No counts. > Berkeley = read.table("http://www.utstat.toronto.edu/~brunner/312f12/
R Hints for Chapter 10
 R Hints for Chapter 10 The multiple logistic regression model assumes that the success probability p for a binomial random variable depends on independent variables or design variables x 1, x 2,, x k.
Matched Pair Data. Stat 557 Heike Hofmann
 Matched Pair Data Stat 557 Heike Hofmann Outline Marginal Homogeneity - review Binary Response with covariates Ordinal response Symmetric Models Subject-specific vs Marginal Model conditional logistic
STA 4504/5503 Sample Exam 1 Spring 2011 Categorical Data Analysis. 1. Indicate whether each of the following is true (T) or false (F).
 or false (F).") STA 4504/5503 Sample Exam 1 Spring 2011 Categorical Data Analysis 1. Indicate whether each of the following is true (T) or false (F). (a) T In 2 2 tables, statistical independence is equivalent to a population
STA 4504/5503 Sample Exam 1 Spring 2011 Categorical Data Analysis 1. Indicate whether each of the following is true (T) or false (F). (a) T In 2 2 tables, statistical independence is equivalent to a population
STA 4504/5503 Sample Exam 1 Spring 2011 Categorical Data Analysis. 1. Indicate whether each of the following is true (T) or false (F).
 or false (F).") STA 4504/5503 Sample Exam 1 Spring 2011 Categorical Data Analysis 1. Indicate whether each of the following is true (T) or false (F). (a) (b) (c) (d) (e) In 2 2 tables, statistical independence is equivalent
STA 4504/5503 Sample Exam 1 Spring 2011 Categorical Data Analysis 1. Indicate whether each of the following is true (T) or false (F). (a) (b) (c) (d) (e) In 2 2 tables, statistical independence is equivalent
NATIONAL UNIVERSITY OF SINGAPORE EXAMINATION. ST3241 Categorical Data Analysis. (Semester II: ) April/May, 2011 Time Allowed : 2 Hours
 April/May, 2011 Time Allowed : 2 Hours") NATIONAL UNIVERSITY OF SINGAPORE EXAMINATION Categorical Data Analysis (Semester II: 2010 2011) April/May, 2011 Time Allowed : 2 Hours Matriculation No: Seat No: Grade Table Question 1 2 3 4 5 6 Full marks
NATIONAL UNIVERSITY OF SINGAPORE EXAMINATION Categorical Data Analysis (Semester II: 2010 2011) April/May, 2011 Time Allowed : 2 Hours Matriculation No: Seat No: Grade Table Question 1 2 3 4 5 6 Full marks
Logistic Regression. James H. Steiger. Department of Psychology and Human Development Vanderbilt University
 Logistic Regression James H. Steiger Department of Psychology and Human Development Vanderbilt University James H. Steiger (Vanderbilt University) Logistic Regression 1 / 38 Logistic Regression 1 Introduction
UNIVERSITY OF TORONTO Faculty of Arts and Science
 UNIVERSITY OF TORONTO Faculty of Arts and Science December 2013 Final Examination STA442H1F/2101HF Methods of Applied Statistics Jerry Brunner Duration - 3 hours Aids: Calculator Model(s): Any calculator
Exam Applied Statistical Regression. Good Luck!
 Dr. M. Dettling Summer 2011 Exam Applied Statistical Regression Approved: Tables: Note: Any written material, calculator (without communication facility). Attached. All tests have to be done at the 5%-level.
A Generalized Linear Model for Binomial Response Data. Copyright c 2017 Dan Nettleton (Iowa State University) Statistics / 46
 Statistics / 46") A Generalized Linear Model for Binomial Response Data Copyright c 2017 Dan Nettleton (Iowa State University) Statistics 510 1 / 46 Now suppose that instead of a Bernoulli response, we have a binomial response
A Generalized Linear Model for Binomial Response Data Copyright c 2017 Dan Nettleton (Iowa State University) Statistics 510 1 / 46 Now suppose that instead of a Bernoulli response, we have a binomial response
On the Inference of the Logistic Regression Model
 On the Inference of the Logistic Regression Model 1. Model ln =(; ), i.e. = representing false. The linear form of (;) is entertained, i.e. ((;)) ((;)), where ==1 ;, with 1 representing true, 0 ;= 1+ +
ssh tap sas913, sas https://www.statlab.umd.edu/sasdoc/sashtml/onldoc.htm
 Kedem, STAT 430 SAS Examples: Logistic Regression ==================================== ssh abc@glue.umd.edu, tap sas913, sas https://www.statlab.umd.edu/sasdoc/sashtml/onldoc.htm a. Logistic regression.
9 Generalized Linear Models
 9 Generalized Linear Models The Generalized Linear Model (GLM) is a model which has been built to include a wide range of different models you already know, e.g. ANOVA and multiple linear regression models
Log-linear Models for Contingency Tables
 Log-linear Models for Contingency Tables Statistics 149 Spring 2006 Copyright 2006 by Mark E. Irwin Log-linear Models for Two-way Contingency Tables Example: Business Administration Majors and Gender A
Classification. Chapter Introduction. 6.2 The Bayes classifier
 Chapter 6 Classification 6.1 Introduction Often encountered in applications is the situation where the response variable Y takes values in a finite set of labels. For example, the response Y could encode
Linear Regression Models P8111
 Linear Regression Models P8111 Lecture 25 Jeff Goldsmith April 26, 2016 1 of 37 Today s Lecture Logistic regression / GLMs Model framework Interpretation Estimation 2 of 37 Linear regression Course started
Logistic Regression - problem 6.14
 Logistic Regression - problem 6.14 Let x 1, x 2,, x m be given values of an input variable x and let Y 1,, Y m be independent binomial random variables whose distributions depend on the corresponding values
Poisson Regression. The Training Data
 The Training Data Poisson Regression Office workers at a large insurance company are randomly assigned to one of 3 computer use training programmes, and their number of calls to IT support during the following
Introduction to General and Generalized Linear Models
 Introduction to General and Generalized Linear Models Generalized Linear Models - part III Henrik Madsen Poul Thyregod Informatics and Mathematical Modelling Technical University of Denmark DK-2800 Kgs.
NATIONAL UNIVERSITY OF SINGAPORE EXAMINATION (SOLUTIONS) ST3241 Categorical Data Analysis. (Semester II: )
 ST3241 Categorical Data Analysis. (Semester II: )") NATIONAL UNIVERSITY OF SINGAPORE EXAMINATION (SOLUTIONS) Categorical Data Analysis (Semester II: 2010 2011) April/May, 2011 Time Allowed : 2 Hours Matriculation No: Seat No: Grade Table Question 1 2 3
NATIONAL UNIVERSITY OF SINGAPORE EXAMINATION (SOLUTIONS) Categorical Data Analysis (Semester II: 2010 2011) April/May, 2011 Time Allowed : 2 Hours Matriculation No: Seat No: Grade Table Question 1 2 3
7/28/15. Review Homework. Overview. Lecture 6: Logistic Regression Analysis
 Lecture 6: Logistic Regression Analysis Christopher S. Hollenbeak, PhD Jane R. Schubart, PhD The Outcomes Research Toolbox Review Homework 2 Overview Logistic regression model conceptually Logistic regression
Sample solutions. Stat 8051 Homework 8
 Sample solutions Stat 8051 Homework 8 Problem 1: Faraway Exercise 3.1 A plot of the time series reveals kind of a fluctuating pattern: Trying to fit poisson regression models yields a quadratic model if
cor(dataset$measurement1, dataset$measurement2, method= pearson ) cor.test(datavector1, datavector2, method= pearson )
 cor.test(datavector1, datavector2, method= pearson )") Tutorial 7: Correlation and Regression Correlation Used to test whether two variables are linearly associated. A correlation coefficient (r) indicates the strength and direction of the association. A correlation
Tutorial 7: Correlation and Regression Correlation Used to test whether two variables are linearly associated. A correlation coefficient (r) indicates the strength and direction of the association. A correlation
12 Modelling Binomial Response Data
 c 2005, Anthony C. Brooms Statistical Modelling and Data Analysis 12 Modelling Binomial Response Data 12.1 Examples of Binary Response Data Binary response data arise when an observation on an individual
Logistic regression. 11 Nov Logistic regression (EPFL) Applied Statistics 11 Nov / 20
 Applied Statistics 11 Nov / 20") Logistic regression 11 Nov 2010 Logistic regression (EPFL) Applied Statistics 11 Nov 2010 1 / 20 Modeling overview Want to capture important features of the relationship between a (set of) variable(s)
Logistic regression 11 Nov 2010 Logistic regression (EPFL) Applied Statistics 11 Nov 2010 1 / 20 Modeling overview Want to capture important features of the relationship between a (set of) variable(s)
Introduction to the Analysis of Tabular Data
 Introduction to the Analysis of Tabular Data Anthropological Sciences 192/292 Data Analysis in the Anthropological Sciences James Holland Jones & Ian G. Robertson March 15, 2006 1 Tabular Data Is there
R Output for Linear Models using functions lm(), gls() & glm()
, gls() & glm()") LM 04 lm(), gls() &glm() 1 R Output for Linear Models using functions lm(), gls() & glm() Different kinds of output related to linear models can be obtained in R using function lm() {stats} in the base
LM 04 lm(), gls() &glm() 1 R Output for Linear Models using functions lm(), gls() & glm() Different kinds of output related to linear models can be obtained in R using function lm() {stats} in the base
STAT 7030: Categorical Data Analysis
 STAT 7030: Categorical Data Analysis 5. Logistic Regression Peng Zeng Department of Mathematics and Statistics Auburn University Fall 2012 Peng Zeng (Auburn University) STAT 7030 Lecture Notes Fall 2012
Truck prices - linear model? Truck prices - log transform of the response variable. Interpreting models with log transformation
 Background Regression so far... Lecture 23 - Sta 111 Colin Rundel June 17, 2014 At this point we have covered: Simple linear regression Relationship between numerical response and a numerical or categorical
Week 7 Multiple factors. Ch , Some miscellaneous parts
 Week 7 Multiple factors Ch. 18-19, Some miscellaneous parts Multiple Factors Most experiments will involve multiple factors, some of which will be nuisance variables Dealing with these factors requires
STA 450/4000 S: January
 STA 450/4000 S: January 6 005 Notes Friday tutorial on R programming reminder office hours on - F; -4 R The book Modern Applied Statistics with S by Venables and Ripley is very useful. Make sure you have
Generalized Linear Models. stat 557 Heike Hofmann
 Generalized Linear Models stat 557 Heike Hofmann Outline Intro to GLM Exponential Family Likelihood Equations GLM for Binomial Response Generalized Linear Models Three components: random, systematic, link
Generalized linear models
 Generalized linear models Douglas Bates November 01, 2010 Contents 1 Definition 1 2 Links 2 3 Estimating parameters 5 4 Example 6 5 Model building 8 6 Conclusions 8 7 Summary 9 1 Generalized Linear Models
ST3241 Categorical Data Analysis I Logistic Regression. An Introduction and Some Examples
 ST3241 Categorical Data Analysis I Logistic Regression An Introduction and Some Examples 1 Business Applications Example Applications The probability that a subject pays a bill on time may use predictors
Duration of Unemployment - Analysis of Deviance Table for Nested Models
 Duration of Unemployment - Analysis of Deviance Table for Nested Models February 8, 2012 The data unemployment is included as a contingency table. The response is the duration of unemployment, gender and
Regression so far... Lecture 21 - Logistic Regression. Odds. Recap of what you should know how to do... At this point we have covered: Sta102 / BME102
 Background Regression so far... Lecture 21 - Sta102 / BME102 Colin Rundel November 18, 2014 At this point we have covered: Simple linear regression Relationship between numerical response and a numerical
STA102 Class Notes Chapter Logistic Regression
 STA0 Class Notes Chapter 0 0. Logistic Regression We continue to study the relationship between a response variable and one or more eplanatory variables. For SLR and MLR (Chapters 8 and 9), our response
Binary Regression. GH Chapter 5, ISL Chapter 4. January 31, 2017
 Binary Regression GH Chapter 5, ISL Chapter 4 January 31, 2017 Seedling Survival Tropical rain forests have up to 300 species of trees per hectare, which leads to difficulties when studying processes which
Review: what is a linear model. Y = β 0 + β 1 X 1 + β 2 X 2 + A model of the following form:
 Outline for today What is a generalized linear model Linear predictors and link functions Example: fit a constant (the proportion) Analysis of deviance table Example: fit dose-response data using logistic
Modeling Overdispersion
 James H. Steiger Department of Psychology and Human Development Vanderbilt University Regression Modeling, 2009 1 Introduction 2 Introduction In this lecture we discuss the problem of overdispersion in
Administration. Homework 1 on web page, due Feb 11 NSERC summer undergraduate award applications due Feb 5 Some helpful books
 STA 44/04 Jan 6, 00 / 5 Administration Homework on web page, due Feb NSERC summer undergraduate award applications due Feb 5 Some helpful books STA 44/04 Jan 6, 00... administration / 5 STA 44/04 Jan 6,
Generalized Additive Models
 Generalized Additive Models The Model The GLM is: g( µ) = ß 0 + ß 1 x 1 + ß 2 x 2 +... + ß k x k The generalization to the GAM is: g(µ) = ß 0 + f 1 (x 1 ) + f 2 (x 2 ) +... + f k (x k ) where the functions
A Handbook of Statistical Analyses Using R. Brian S. Everitt and Torsten Hothorn
 A Handbook of Statistical Analyses Using R Brian S. Everitt and Torsten Hothorn CHAPTER 6 Logistic Regression and Generalised Linear Models: Blood Screening, Women s Role in Society, and Colonic Polyps
Booklet of Code and Output for STAD29/STA 1007 Midterm Exam
 Booklet of Code and Output for STAD29/STA 1007 Midterm Exam List of Figures in this document by page: List of Figures 1 NBA attendance data........................ 2 2 Regression model for NBA attendances...............
Various Issues in Fitting Contingency Tables
 Various Issues in Fitting Contingency Tables Statistics 149 Spring 2006 Copyright 2006 by Mark E. Irwin Complete Tables with Zero Entries In contingency tables, it is possible to have zero entries in a
STAC51: Categorical data Analysis
 STAC51: Categorical data Analysis Mahinda Samarakoon April 6, 2016 Mahinda Samarakoon STAC51: Categorical data Analysis 1 / 25 Table of contents 1 Building and applying logistic regression models (Chap
Regression Methods for Survey Data
 Regression Methods for Survey Data Professor Ron Fricker! Naval Postgraduate School! Monterey, California! 3/26/13 Reading:! Lohr chapter 11! 1 Goals for this Lecture! Linear regression! Review of linear
Class Notes: Week 8. Probit versus Logit Link Functions and Count Data
 Ronald Heck Class Notes: Week 8 1 Class Notes: Week 8 Probit versus Logit Link Functions and Count Data This week we ll take up a couple of issues. The first is working with a probit link function. While
Two Hours. Mathematical formula books and statistical tables are to be provided THE UNIVERSITY OF MANCHESTER. 26 May :00 16:00
 Two Hours MATH38052 Mathematical formula books and statistical tables are to be provided THE UNIVERSITY OF MANCHESTER GENERALISED LINEAR MODELS 26 May 2016 14:00 16:00 Answer ALL TWO questions in Section
BMI 541/699 Lecture 22
 BMI 541/699 Lecture 22 Where we are: 1. Introduction and Experimental Design 2. Exploratory Data Analysis 3. Probability 4. T-based methods for continous variables 5. Power and sample size for t-based
LISA Short Course Series Generalized Linear Models (GLMs) & Categorical Data Analysis (CDA) in R. Liang (Sally) Shan Nov. 4, 2014
 & Categorical Data Analysis (CDA) in R. Liang (Sally) Shan Nov. 4, 2014") LISA Short Course Series Generalized Linear Models (GLMs) & Categorical Data Analysis (CDA) in R Liang (Sally) Shan Nov. 4, 2014 L Laboratory for Interdisciplinary Statistical Analysis LISA helps VT researchers
LISA Short Course Series Generalized Linear Models (GLMs) & Categorical Data Analysis (CDA) in R Liang (Sally) Shan Nov. 4, 2014 L Laboratory for Interdisciplinary Statistical Analysis LISA helps VT researchers
Introduction to the Generalized Linear Model: Logistic regression and Poisson regression
 Introduction to the Generalized Linear Model: Logistic regression and Poisson regression Statistical modelling: Theory and practice Gilles Guillot gigu@dtu.dk November 4, 2013 Gilles Guillot (gigu@dtu.dk)
Tento projekt je spolufinancován Evropským sociálním fondem a Státním rozpočtem ČR InoBio CZ.1.07/2.2.00/
 Tento projekt je spolufinancován Evropským sociálním fondem a Státním rozpočtem ČR InoBio CZ.1.07/2.2.00/28.0018 Statistical Analysis in Ecology using R Linear Models/GLM Ing. Daniel Volařík, Ph.D. 13.
A Handbook of Statistical Analyses Using R 2nd Edition. Brian S. Everitt and Torsten Hothorn
 A Handbook of Statistical Analyses Using R 2nd Edition Brian S. Everitt and Torsten Hothorn CHAPTER 7 Logistic Regression and Generalised Linear Models: Blood Screening, Women s Role in Society, Colonic
Categorical data analysis Chapter 5
 Categorical data analysis Chapter 5 Interpreting parameters in logistic regression The sign of β determines whether π(x) is increasing or decreasing as x increases. The rate of climb or descent increases
Neural networks (not in book)
") (not in book) Another approach to classification is neural networks. were developed in the 1980s as a way to model how learning occurs in the brain. There was therefore wide interest in neural networks
(not in book) Another approach to classification is neural networks. were developed in the 1980s as a way to model how learning occurs in the brain. There was therefore wide interest in neural networks
Analysing categorical data using logit models
 Analysing categorical data using logit models Graeme Hutcheson, University of Manchester The lecture notes, exercises and data sets associated with this course are available for download from: www.research-training.net/manchester
Generalised linear models. Response variable can take a number of different formats
 Generalised linear models Response variable can take a number of different formats Structure Limitations of linear models and GLM theory GLM for count data GLM for presence \ absence data GLM for proportion
STAT 526 Spring Midterm 1. Wednesday February 2, 2011
 STAT 526 Spring 2011 Midterm 1 Wednesday February 2, 2011 Time: 2 hours Name (please print): Show all your work and calculations. Partial credit will be given for work that is partially correct. Points
STAT 510 Final Exam Spring 2015
 STAT 510 Final Exam Spring 2015 Instructions: The is a closed-notes, closed-book exam No calculator or electronic device of any kind may be used Use nothing but a pen or pencil Please write your name and
Non-Gaussian Response Variables
 Non-Gaussian Response Variables What is the Generalized Model Doing? The fixed effects are like the factors in a traditional analysis of variance or linear model The random effects are different A generalized
Homework 5 - Solution
 STAT 526 - Spring 2011 Homework 5 - Solution Olga Vitek Each part of the problems 5 points 1. Agresti 10.1 (a) and (b). Let Patient Die Suicide Yes No sum Yes 1097 90 1187 No 203 435 638 sum 1300 525 1825
Count data page 1. Count data. 1. Estimating, testing proportions
 Count data page 1 Count data 1. Estimating, testing proportions 100 seeds, 45 germinate. We estimate probability p that a plant will germinate to be 0.45 for this population. Is a 50% germination rate
PAPER 218 STATISTICAL LEARNING IN PRACTICE
 MATHEMATICAL TRIPOS Part III Thursday, 7 June, 2018 9:00 am to 12:00 pm PAPER 218 STATISTICAL LEARNING IN PRACTICE Attempt no more than FOUR questions. There are SIX questions in total. The questions carry
MSH3 Generalized linear model
 Contents MSH3 Generalized linear model 5 Logit Models for Binary Data 173 5.1 The Bernoulli and binomial distributions......... 173 5.1.1 Mean, variance and higher order moments.... 173 5.1.2 Normal limit....................
Statistics 203 Introduction to Regression Models and ANOVA Practice Exam
 Statistics 203 Introduction to Regression Models and ANOVA Practice Exam Prof. J. Taylor You may use your 4 single-sided pages of notes This exam is 7 pages long. There are 4 questions, first 3 worth 10
Let s see if we can predict whether a student returns or does not return to St. Ambrose for their second year.
 Assignment #13: GLM Scenario: Over the past few years, our first-to-second year retention rate has ranged from 77-80%. In other words, 77-80% of our first-year students come back to St. Ambrose for their
Random Independent Variables
 Random Independent Variables Example: e 1, e 2, e 3 ~ Poisson(5) X 1 = e 1 + e 3 X 2 = e 2 +e 3 X 3 ~ N(10,10) ind. of e 1 e 2 e 3 Y = β 0 + β 1 X 1 + β 2 X 2 +β 3 X 3 + ε ε ~ N(0,σ 2 ) β 0 = 0 β 1 = 1
Lecture 14: Introduction to Poisson Regression
 Lecture 14: Introduction to Poisson Regression Ani Manichaikul amanicha@jhsph.edu 8 May 2007 1 / 52 Overview Modelling counts Contingency tables Poisson regression models 2 / 52 Modelling counts I Why
Modelling counts. Lecture 14: Introduction to Poisson Regression. Overview
 Modelling counts I Lecture 14: Introduction to Poisson Regression Ani Manichaikul amanicha@jhsph.edu Why count data? Number of traffic accidents per day Mortality counts in a given neighborhood, per week
Reaction Days
 Stat April 03 Week Fitting Individual Trajectories # Straight-line, constant rate of change fit > sdat = subset(sleepstudy, Subject == "37") > sdat Reaction Days Subject > lm.sdat = lm(reaction ~ Days)
ST3241 Categorical Data Analysis I Multicategory Logit Models. Logit Models For Nominal Responses
 ST3241 Categorical Data Analysis I Multicategory Logit Models Logit Models For Nominal Responses 1 Models For Nominal Responses Y is nominal with J categories. Let {π 1,, π J } denote the response probabilities
22s:152 Applied Linear Regression. Example: Study on lead levels in children. Ch. 14 (sec. 1) and Ch. 15 (sec. 1 & 4): Logistic Regression
 and Ch. 15 (sec. 1 & 4): Logistic Regression") 22s:52 Applied Linear Regression Ch. 4 (sec. and Ch. 5 (sec. & 4: Logistic Regression Logistic Regression When the response variable is a binary variable, such as 0 or live or die fail or succeed then
22s:52 Applied Linear Regression Ch. 4 (sec. and Ch. 5 (sec. & 4: Logistic Regression Logistic Regression When the response variable is a binary variable, such as 0 or live or die fail or succeed then
SCHOOL OF MATHEMATICS AND STATISTICS. Linear and Generalised Linear Models
 SCHOOL OF MATHEMATICS AND STATISTICS Linear and Generalised Linear Models Autumn Semester 2017 18 2 hours Attempt all the questions. The allocation of marks is shown in brackets. RESTRICTED OPEN BOOK EXAMINATION
Clinical Trials. Olli Saarela. September 18, Dalla Lana School of Public Health University of Toronto.
 Introduction to Dalla Lana School of Public Health University of Toronto olli.saarela@utoronto.ca September 18, 2014 38-1 : a review 38-2 Evidence Ideal: to advance the knowledge-base of clinical medicine,
Age 55 (x = 1) Age < 55 (x = 0)
 Age < 55 (x = 0)") Logistic Regression with a Single Dichotomous Predictor EXAMPLE: Consider the data in the file CHDcsv Instead of examining the relationship between the continuous variable age and the presence or absence
Logistic Regression with a Single Dichotomous Predictor EXAMPLE: Consider the data in the file CHDcsv Instead of examining the relationship between the continuous variable age and the presence or absence
Today. HW 1: due February 4, pm. Aspects of Design CD Chapter 2. Continue with Chapter 2 of ELM. In the News:
 Today HW 1: due February 4, 11.59 pm. Aspects of Design CD Chapter 2 Continue with Chapter 2 of ELM In the News: STA 2201: Applied Statistics II January 14, 2015 1/35 Recap: data on proportions data: y
Generalized linear models
 Generalized linear models Outline for today What is a generalized linear model Linear predictors and link functions Example: estimate a proportion Analysis of deviance Example: fit dose- response data
Leftovers. Morris. University Farm. University Farm. Morris. yield
 Leftovers SI 544 Lada Adamic 1 Trellis graphics Trebi Wisconsin No. 38 No. 457 Glabron Peatland Velvet No. 475 Manchuria No. 462 Svansota Trebi Wisconsin No. 38 No. 457 Glabron Peatland Velvet No. 475
MSH3 Generalized linear model
 Contents MSH3 Generalized linear model 7 Log-Linear Model 231 7.1 Equivalence between GOF measures........... 231 7.2 Sampling distribution................... 234 7.3 Interpreting Log-Linear models..............
ˆπ(x) = exp(ˆα + ˆβ T x) 1 + exp(ˆα + ˆβ T.
 = exp(ˆα + ˆβ T x) 1 + exp(ˆα + ˆβ T.") Exam 3 Review Suppose that X i = x =(x 1,, x k ) T is observed and that Y i X i = x i independent Binomial(n i,π(x i )) for i =1,, N where ˆπ(x) = exp(ˆα + ˆβ T x) 1 + exp(ˆα + ˆβ T x) This is called the
Exam 3 Review Suppose that X i = x =(x 1,, x k ) T is observed and that Y i X i = x i independent Binomial(n i,π(x i )) for i =1,, N where ˆπ(x) = exp(ˆα + ˆβ T x) 1 + exp(ˆα + ˆβ T x) This is called the
1. Logistic Regression, One Predictor 2. Inference: Estimating the Parameters 3. Multiple Logistic Regression 4. AIC and BIC in Logistic Regression
 Logistic Regression 1. Logistic Regression, One Predictor 2. Inference: Estimating the Parameters 3. Multiple Logistic Regression 4. AIC and BIC in Logistic Regression 5. Target Marketing: Tabloid Data
Lecture 12: Effect modification, and confounding in logistic regression
 Lecture 12: Effect modification, and confounding in logistic regression Ani Manichaikul amanicha@jhsph.edu 4 May 2007 Today Categorical predictor create dummy variables just like for linear regression
Poisson Regression. James H. Steiger. Department of Psychology and Human Development Vanderbilt University
 Poisson Regression James H. Steiger Department of Psychology and Human Development Vanderbilt University James H. Steiger (Vanderbilt University) Poisson Regression 1 / 49 Poisson Regression 1 Introduction
PAPER 206 APPLIED STATISTICS
 MATHEMATICAL TRIPOS Part III Thursday, 1 June, 2017 9:00 am to 12:00 pm PAPER 206 APPLIED STATISTICS Attempt no more than FOUR questions. There are SIX questions in total. The questions carry equal weight.
Regression models. Generalized linear models in R. Normal regression models are not always appropriate. Generalized linear models. Examples.
 Regression models Generalized linear models in R Dr Peter K Dunn http://www.usq.edu.au Department of Mathematics and Computing University of Southern Queensland ASC, July 00 The usual linear regression
MODULE 6 LOGISTIC REGRESSION. Module Objectives:
 MODULE 6 LOGISTIC REGRESSION Module Objectives: 1. 147 6.1. LOGIT TRANSFORMATION MODULE 6. LOGISTIC REGRESSION Logistic regression models are used when a researcher is investigating the relationship between
Stat/F&W Ecol/Hort 572 Review Points Ané, Spring 2010
 1 Linear models Y = Xβ + ɛ with ɛ N (0, σ 2 e) or Y N (Xβ, σ 2 e) where the model matrix X contains the information on predictors and β includes all coefficients (intercept, slope(s) etc.). 1. Number of
STATS216v Introduction to Statistical Learning Stanford University, Summer Midterm Exam (Solutions) Duration: 1 hours
 Duration: 1 hours") Instructions: STATS216v Introduction to Statistical Learning Stanford University, Summer 2017 Remember the university honor code. Midterm Exam (Solutions) Duration: 1 hours Write your name and SUNet ID
Instructions: STATS216v Introduction to Statistical Learning Stanford University, Summer 2017 Remember the university honor code. Midterm Exam (Solutions) Duration: 1 hours Write your name and SUNet ID
Linear Regression. Data Model. β, σ 2. Process Model. ,V β. ,s 2. s 1. Parameter Model
 Regression: Part II Linear Regression y~n X, 2 X Y Data Model β, σ 2 Process Model Β 0,V β s 1,s 2 Parameter Model Assumptions of Linear Model Homoskedasticity No error in X variables Error in Y variables
Unit 5 Logistic Regression Practice Problems
 Unit 5 Logistic Regression Practice Problems SOLUTIONS R Users Source: Afifi A., Clark VA and May S. Computer Aided Multivariate Analysis, Fourth Edition. Boca Raton: Chapman and Hall, 2004. Exercises
1. Hypothesis testing through analysis of deviance. 3. Model & variable selection - stepwise aproaches
 Sta 216, Lecture 4 Last Time: Logistic regression example, existence/uniqueness of MLEs Today s Class: 1. Hypothesis testing through analysis of deviance 2. Standard errors & confidence intervals 3. Model
Consider fitting a model using ordinary least squares (OLS) regression:
 regression:") Example 1: Mating Success of African Elephants In this study, 41 male African elephants were followed over a period of 8 years. The age of the elephant at the beginning of the study and the number of successful
Example 1: Mating Success of African Elephants In this study, 41 male African elephants were followed over a period of 8 years. The age of the elephant at the beginning of the study and the number of successful
Generalized Linear Models
 Generalized Linear Models 1/37 The Kelp Data FRONDS 0 20 40 60 20 40 60 80 100 HLD_DIAM FRONDS are a count variable, cannot be < 0 2/37 Nonlinear Fits! FRONDS 0 20 40 60 log NLS 20 40 60 80 100 HLD_DIAM
McGill University. Faculty of Science. Department of Mathematics and Statistics. Statistics Part A Comprehensive Exam Methodology Paper
 Student Name: ID: McGill University Faculty of Science Department of Mathematics and Statistics Statistics Part A Comprehensive Exam Methodology Paper Date: Friday, May 13, 2016 Time: 13:00 17:00 Instructions
Overdispersion Workshop in generalized linear models Uppsala, June 11-12, Outline. Overdispersion
 Biostokastikum Overdispersion is not uncommon in practice. In fact, some would maintain that overdispersion is the norm in practice and nominal dispersion the exception McCullagh and Nelder (1989) Overdispersion
Econometrics II. Seppo Pynnönen. Spring Department of Mathematics and Statistics, University of Vaasa, Finland
 Department of Mathematics and Statistics, University of Vaasa, Finland Spring 2018 Part III Limited Dependent Variable Models As of Jan 30, 2017 1 Background 2 Binary Dependent Variable The Linear Probability