The Core Database Strategy A new paradigm for data collection at regional level
|
|
|
- Laureen Morrison
- 6 years ago
- Views:
Transcription

1 DECEMBER 2011 The Core Database Strategy A new paradigm for data collection at regional level SUMMARY The aim of this report is twice: Firstly, it proposes a general strategy for data collection inside M4D project and more generally at the level of ESPON program. The Core Database Strategy (CDS) is an attempt to propose an innovative solution against the current situation where the ESPON database is adversely affected by the accumulation of heterogeneous data that are more and more difficult to manage. The report describes the general aims of this new strategy and the expected benefits, in particular when it comes to territorial monitoring. Secondly, it presents the preliminary tests and results of this strategy in the case of regional data. We examine firstly the current list of core indicators likely to support the CDS. Then we propose methods for the estimation of missing values and building of long term time series of core indicators. Finally we demonstrate how such core indicators can be combined with accessibility measure in order to produce innovative measure of functional dynamics pages Exc. annexes
2 LIST OF AUTHORS Claude Grasland, UMS 2414 RIATE Ronan Ysebaert, UMS 2414 RIATE Contact UMS 2414 RIATE Tel. (+ 33)
3 TABLE OF CONTENT 1. The Core Database Strategy Two possible scenarios for ESPON Database Principles of the Core Database Strategy Expected benefit of CDS for territorial monitoring Preliminary tests and results Collection of ESPON Core indicators through Eurostat website Estimation of missing values using the ESTI framework and the ESPON metadata model Data quality control, example of population check by level Transformation of indicators by functional smoothing Conclusion Bibliography Annexe 1 Data availability in Eurostat tables Annexe 2 Towards a dictionary of estimation methods for missing values? Working paper Annexe 3 R programmes for calculating potential of population in different car-time radius
. This strategy implies an important revision of data collection approach inside the ESPON M4D project but also in the whole ESPON program.")

4 1. The Core Database Strategy During the second internal meeting of ESPON M4D project in October 2011, the coordinator of the thematic group has proposed a new method for the development of ESPON database called the Core Database Strategy (CDS). This strategy implies an important revision of data collection approach inside the ESPON M4D project but also in the whole ESPON program. That is the reason why it has been decided to launch during 6 months a test phase of the CDS strategy, in order to evaluate its potential to solve existing problem. The ESPON seminar in Denmark will be the milestone for the decision to adopt definitively, to modify or to give up this CDS strategy. 1.1 Two possible scenarios for ESPON Database Based on the experience gained in the ESPON Database 2013 project ( ) and the first months of work of the ESPON M4D Project (Feb-Sept 2011) it appears possible to propose two opposite strategies for the management, storage and diffusion of data produced in the ESPON program as a whole (figure 1). Figure 1 Discussion of two scenarios for the achievement of ESPON Database (M4D meeting, October 2011) The Cosmetic scenario is driven by final evaluation of the ESPON program, in particular by the so-called quantitative indicators of success that are usually used in INTERREG programs. In the case of data, a classical indicator is the number of indicators or maps produced by each project. Following this strategy, it is important to produce as many indicators as possible and to publish regularly a list of new indicators produced by the ESPON program. It is also important to classify this indicators in relevant groups based on thematic topics (Agriculture, Economy, Transport, ) but also, which is certainly the most important, in terms of policy relevance and linkage with EU policies (Lisbonne Strategy, Europe 2020, ). Concerning the choice of geographical objects, the Cosmetic Scenario will obviously focus on official delineation for regions (NUTS2, NUTS3) and for cities (FUA) and will take care to make firstly use of official datasets produced by Eurostat and EEA or politically recognized document like OECD and DG Regio studies. Concerning estimation of missing values, the rule will be to stick to official data as long as they are available and to avoid any modification of official figures. Concerning innovation, the rule will 3
5 be to avoid any duplication of officially existing work like the OECD typology of urban-rural area. The keyword associated to this strategy is therefore cosmetic because what is at the top of the agenda is not the content of the database itself but the way it is promoted to external users or evaluators. When ESPON TIPTAP deliver more than 50 indicators related to variant of TIA scenarios, it increase formally the size of the database (it is good for quantitative evaluation) but it does not offer real added value in the long term as these 50 indicators cannot be updated regularly and are not useful for the majority of users. For the same reason, when ESPON database store gigabytes of regional data derived from Eurostat and add only values for non EU countries, it increases formally the size of the database (40 indicators by just storing the age structure by sex and 5-years age groups ) but it is of minor interest for the majority of external users who prefer to download directly data on Eurostat website or eventually through OECD explorer which present the interest to use more relevant territorial divisions based on mixture of NUTS2 and NUTS3. Last but not least, many ESPON projects has delivered socalled Synthetic index which are just elementary statistical transformation of a limited number of classical variable published regularly in the cohesion report. It is really of null interest to store indicators like GDP per capita transformed into a qualitative index with value 1 to 5 but ESPON database is filled of such indexes that are useful in the context of a specific report but are certainly not of interest for any user and are just a pollution. Only the formula of such composite indicators should be stored, making possible to compute it and update in real time when new basic variables are delivered. With this strategy of storing the maximum of data, the ESPON Program appears as a giant collection of data covering the maximum of subject of political interest and using as much as possible official data and definitions. The Sustainable Scenario is driven by the assumption that ESPON program can contribute to major innovation in the statistical landscape of European Union and should provide not only answer to current political demand but also propose material for new innovative policies and strategies. The keywords are therefore the sustainability and capacity of innovation of the database i.e. the possibility to update and enrich the content of the database in past, present and future and to address new questions that are not necessarily currently present in the political agenda but are considered as likely to emerge in a near future. In this framework, the first question to ask for each data to be stored in the database is: Can it be estimated in the past and computed again in the future. If the answer is no, such a data is of limited interest because it cannot be used for territorial monitoring and is not likely to be of any help in the building of scenarios. The second question to be asked is: Can this indicator be estimated in different geometries like various regional delineations, various cities definitions, various grid types or is it limited to a specific delineation of a specific type geographical object. If the answer is no, we can consider that the interest of the data are limited in time (because the delineation of regions and cities are changing through time) and limited in terms of potential users (e.g. stakeholder of cities and regions cannot share the same knowledge database). The third question to be asked is: Does this indicator open the door for new territorial policies at EU level and what is the added value as compared to existing work done out of ESPON?. If the answer is no, the fact to store the data is of minor interest because it will introduce a confusion between what can be found elsewhere and what is really specific and original in ESPON production. It is even dangerous and risky for ESPON to store non original data without added value because the evaluators of the ESPON 4
 and finally the level of innovation ( What s new as compared to Eurostat or OECD? ).")
6 program will certainly not evaluate only the quantitative dimension ( How many indicators? ) but also check the qualitative dimension ( What about consistency of the database? ) and finally the level of innovation ( What s new as compared to Eurostat or OECD? ). The difficulty with the sustainable approach is the fact that it has not been launched since the beginning of the ESPON 2013 program and that in the current database is stored a lot of data that does not fulfil the conditions of sustainability. Moreover, all the ESPON project are contractually obliged to deliver data that M4D is contractually obliged to check and store, whatever the interest to do it in a perspective of sustainability. In pragmatic terms, the sustainable approach is possible only if we are ready to develop a separated part inside the ESPON database called ESPON Core Database. 1.2 Principles of the Core Database Strategy The Core Database Strategy is not something new in the ESPON Program. The principles behind this strategy have been elaborated and discussed during the ESPON 2006 Program, in particular in the final projects called Modifiable Area Unit Problem (2006) and Data Navigator II (2007). The two versions of the HyperAtlas (2004 and 2010) have also contributed to the reflection on this topic, by demonstrating that a lot of indicators of major political interest could be derived from the same basic count variables. Finally, the ESPON Database 2013 program has elaborated a database structure which follows the central idea of the CDS which is to avoid the limitation of database to a single type of geographical object (NUTS2 and NUTS3 region). Out of ESPON, it is also worth to mention the Atlas Interactif des Régions Européennes (AIRE) realized by UMS RIATE with support of University Diderot s Innovation Prize (2009) which proposed 30 cartographic visualizations of the same indicator, starting from an initial distribution at NUTS3 level. All this related work converges to a general model of data collection that can be briefly summarized by the figure elaborated during the M4D meeting of October 2011 and presented at the ESPON seminar in Cracow (Dec. 2011, figure 2). Figure 2 Methodology overview for sustainable solution 5
7 Without developing in details the CDS strategy, we can briefly explain in five bullet points the main ideas of the solution and the expected results. 1. Start by eliminating all indicators except count variables. In concrete terms, it means that a variable like GDP per capita is initially excluded from the core database as it is not a count variable but the ratio of two count variables which are total population and total amount of GDP (in $ or pps). For the same reason, a variable like dependency ratio which is the ratio between young and old divided by adult will be eliminated. What will be stored is the pyramid of age at the most detailed level (population by 5-years age group), making possible in the future to test alternative delimitation of young (0-14? 0-19?, 0-25?) or old (60 and more? 65 and more? 70 and more?). 2. Store formula of indicators of interest derived from count variables. All indicators that are derived from count variables are stored as formula using count variables located in the core database. They are therefore virtual data that are computed on request when a user requests it. This formula are not related to a particular geometry but can be computed for all type of objects (cities, regions, states, ) as long as count variables are available for this particular geometry. 3. Enlarge time series of count variables in past and future with estimation of missing values. Count variables are in limited number which reduces the task of estimation of their time series. Moreover, they are more robust to statistical tests because it is not necessary to introduce weighting criteria as it is the case for ratio. They offer many opportunities of estimation in the ESTI framework and are likely to be checked in many ways (e.g. comparison of sums in lines and columns in the case of age structure). Once time series of count variable are completed, all the derived indicator can be immediately computed using their formula. 4. Develop automatic procedure of exchange of count variables between geometries of various types. Depending on the nature of information, it can be initially available at regional level (GDP), at grid or vector level (Land Cover), at dot level (Airport location), etc. The problem to be solved here is how to transfer count data from one geometry to another one by using the relevant method of aggregation/disaggregation, eventually coupled with the use of proxy and ancillary information. Considering experience gained in ESPON database 2013 project, we propose to focus this step on the use of OLAP cube technology which will be the pivot for exchange between geometries. For example, GDP data at NUTS 3 level will be firstly estimated at grid level (using ancillary variable like JRC grid of population) and then re-aggregated to new geometries like water basin, FUA, etc. 5. Propose innovative procedures of multi-representation and multi-level analysis of indicators for territorial monitoring and political decision. Whatever the geometry of interest (cities, regions, ) an isolated indicator can be transformed into a family of variants that are targeted to answer to specific political questions. If we consider for example the unemployment rate of a specific FUA, it can be compared to the mean level of unemployment of EU, of the country where the city is located, of the cities located at a car distance of less than 2 hours, etc. The reader recognizes here the procedure of multilevel territorial analysis developed by HyperAtlas for regional units, but that can be also transposed to the case of other objects like dot or grids. Another example is the cartography of discontinuities between regional borders. As long as the target indicator is available in regional units (e.g. median age of population at NUTS2 level), we can link it with the matrix of contiguity and deliver a database on regional borders, where each limit is characterized by absolute or relative 6
8 differences of median age. One more time, it is not necessary to store this table of discontinuities that can be generated automatically for all indicators of the database. The solution appears very exciting but is it really as simple and nice as it looks? In fact, some difficulties are to be expected and M4D project has to take into account some possible difficulties and objection. We discuss here some of them: What will happen to the indicators currently contained in the database if CDS is adopted? This is not a trivial question because many projects has delivered data that are not in line with CDS (lack of any new count variables, lack of clear formula of computation of indicators or too complex formula, ). It is certainly necessary to maintain the storage of this data but this will implies to spend a lot of time that could be better used for CDS development. What is the consequence for future data delivery and check by ESPON project? The provisional solution elaborated by M4D with ESPON CU in order to limit the data deluge (after TIPTAP ) was to limit the delivery of data by Priority 1 project to the ten best indicators. But it is not quite sure that this solution is relevant in the case of CDS. If we consider for example the ARTS project, our recent data check has revealed that this project has delivered absolutely no new count variable and has just proposed formula making use of existing data in order to propose sophisticated composite indexes. On the contrary, DEMIFER project has delivered many new count variables of high interest, in relation with different demographic scenarios. Limitation to ten best indicators is therefore not relevant in the case of DEMIFER (we would lost major contribution to core data toward the future) and, on the contrary, it would be stupid to store the composite indexes of ARTS which produce no added value in terms of count data : only formula should be stored in this case. What will be the effect of CDS on the quantitative production of ESPON database? The answer is dual. On one hand, there would be an apparent contraction of the database because count variables available in time series are of limited number, especially if we consider contingency table as one single variable (population by age and sex, active population by branch, land cover by type, ). In this case, we can say that probably no more than 15 to 30 table of count variable will be finally stored. But this table of count variable are likely to produce several hundred of indicators derived from formula. And this hundreds of indicators should be multiplied by the number of geographical object where they will be available (cities, regions, states, grids) as well as they should be multiplied by the number of variants of this indicators that can be automatically generated (deviations to European, national or local context, evolution through time, discontinuities, ). In reality, the CDS should provide ESPON with thousands of potential indicators, very innovative and nicely targeted to political needs at various scales. What would be the added value of CDS as compare to OECD regional database? In the case of regional database of OECD, the CDS is yet applied and the number of count variables proposed by this organization is very limited, and mostly to Eurostat data. The only added value of OECD regional database is the use of good territorial divisions NUTS2/3 (robust to the MAUP) and the nice visual application OECD Explorer. But it is precisely because the amount of data is limited in OECD database that the Explorer was easy to develop. If ESPON adopt the CDS strategy, it will be much easier to connect the database to existing application like HyperAtlas or to develop new visualization and 7
9 monitoring tools. In fact, ESPON database is potentially much more powerful than OECD regional database and involve genuine innovative indicators (like accessibility measure, telecom connections, demographic scenarios, ) which are not simple extracts of Eurostat or National Statistical Institutes. The problem is that this innovative part of the ESPON database is currently hidden in an ocean of data of lower interest. What about the question of official data if estimation is introduced by CDS? The evaluation of count data for different geometries will produce a lot of estimated values that will be different from the official ones (when they exist). The lineage of data will be precisely described and the methods used for estimation will be precisely described, thanks to the ESTI framework described in the second part of this report. But it will necessarily happen that figures from the ESPON database will be different from the one published by Eurostat and National Statistical Institutes. This is a consequence of the harmonisation and check for internal consistency that will be used to remove holes and file time series. From this point of view, the status of the ESPON database should be equivalent to the one of the Maddisson database on GDP: the data of GDP and Population included in Maddisson database are not exactly the same than the one produced by IMF or UN, but they benefit from an internal coherency and are available in long term time series. In any case, the ESPON database will be able, thanks to its metadata model, to precise which figures are equivalent to the official and which data are estimated and by which method. What is the agenda of the CDS experience? How will it be validated? The teams involved in the M4D project has decided to launch a 6 months experience, in order to present results to the ESPON community at the meeting of Denmark in June During this period, we continue to maintain and develop the current structure of the ESPON database and we try to realize the expected improvement, in particular concerning the interface, the thesaurus, etc. We limit therefore the risk and will be able to stay on the Cosmetic Strategy if the CDS appears to be too difficult to launch. We are nevertheless convinced that it will not be the case and that the ESPON Program as a whole will strongly benefit from the new orientation we propose to enhance during the next months. 1.3 Expected benefit of CDS for territorial monitoring We discuss here some expected benefits of the CDS for policymakers and stakeholder. The ESPON project on Territorial Monitoring has been delayed a first time because of lack of applicant. At the same time, the linkage between ESPON 2013 Database project and ESPON Interco project has not been sufficient, making difficult the elaboration of a common set of territorial indicators of prior interest for policy makers. As a whole, it appears for the moment difficult to achieve the common project of priority 3 projects, which is to build an efficient tool for the monitoring of regions and cities of the ESPON area. The CDS appears in our opinion as a potential candidate to the solution of this difficulties, because it focus precisely on the indicators that can be regularly updated in past and future and that are therefore the most useful for the understanding of current dynamics and the forecast of future evolutions. The fact that CDS stores only a limited number of count variables make it really easy to update each year. And as 8
, it can be")
10 long as the count variables are update, all the other derived indicators or complex indicators will be automatically recomputed as long as they are based on formula. Moreover, each time that an innovation is proposed and adopted by policy makers (like the maps of deviation, the analysis of discontinuities, the potential based on time distance, ), it can be transposed to most recent data by application of formula to new count variables. Last but not least, when modification occurs in the geometry of spatial units (like the move of NUTS2006 to NUTS2010 delineation), the revision of data is easy because, one more time, the question is only to evaluate the count variables and to apply automatically the program of computation of derivated indicators. A good illustration of this strategy is provided by the cartographic portal of UMS RIATE (figure 3): Figure 3 AIRE, Interactive Atlas of European Regions The aim of this application is to deliver simple maps of basic indicator characterising European Region to a great diversity of users (researchers, teachers, students, policy makers, local authorities). The originality of its approach is to propose a great diversity of map for each proposed indicator, making possible for the user to choose the map (or the maps) that are the most likely to fulfil their expectations. 7 types of maps are proposed and for each type of map, 4 to 5 different scales of aggregation, which means a choice between more than 30 solutions The difficulty is of course the fact that the users are generally interested by the last data published by Eurostat, which oblige to revise all the maps each year. It is easy to imagine that such a revision should be a nightmare if the authors are obliged to create as many maps as the number of indicator multiplicated by 30 (numbers of variants ). But it is not the case because the majority of maps (25 out of 30) are automatically generated through the connection with a database where only most recent count variables are stored. When new values are published by Eurostat, all the maps (except the maps of potential) are automatically regenerated and the cartographic expert has only to validate and introduce minor changes. 9
11 We have clearly here a model of what could be a tool for territorial monitoring with automatic update each year. Of course, AIRE is not specifically targeted to policy makers and the specification of the ESPON monitoring tool would be different. But there is certainly food for thought in the idea of periodic automatic update of results. 10
12 2 Preliminary tests and results Having detailed the Core Database Strategy in the first part of the technical report, we want here to focus the discussion on the technical implementation of this strategy. During the last months, the ESPON M4D Project has achieved an experiment on data collection for total population, from 1990 to 2010, and NUTS0 to NUTS3 levels following the principles of the strategy described above. This experimentation has provided some documentation and methods, which we want to develop for the next steps of data collection if the CDS is approved by the ESPON Coordination Unit. The work has firstly consisted by making an overview of available information on Eurostat website on a selected number of indicators (section 2.1). Then, estimation methods have been systematically listed and defined starting from the data navigator II framework and applied to the dataset in order to obtain a full dataset (Section 2.2). After, automatic checking methods will be implemented to test the quality of the resulting dataset (Section 2.3). Finally, methods of spatial analysis, using space-time matrixes have been implemented in a R programme to propose innovative indicators based on the resulting ESPON Core database (Section 2.4). The presentation of the results obtained after two months of experimentation in this Technical Report gives, according to us, a good preview on what can be expected from the ESPON M4D Project in term of data collection and can answer to the most recurrent question asked to the project dealing with the ESPON database during each ESPON Seminar: What kind of new indicator do you expect to deliver to the ESPON Community, and when?. Nevertheless, it is important to define the main properties of the targeted indicators in order to comply with the CDS strategy. These properties constitute in fact the technical objectives of data collection at regional level. Collecting count data: We expect to provide the basic indicators for the ESPON Community. Instead of collecting an unemployment rate, we prefer to focus the work on CORE INDICATORS, such as unemployed population and active population (and its derived, e.g. by age, sex etc.). Targeting time-series data: All count data is collected systematically over a defined time period. Generally, we will focus on the years, but for some indicators (e.g. total population), we have extended this analysis to the period It depends generally of the data availability on Eurostat website. Data collection for the all ESPON Space + Candidate Countries. The data collection will target the entire ESPON 31 countries and the Candidate Countries (Turkey, Croatia, FYROM, Montenegro). Moreover, we want to precise that the CDS is fully compatible with the strategy elaborated for the data collection in European neighbouring countries. Full completeness of dataset: In the datasets which will be provided by the ESPON M4D project, all missing values will be estimated, by combining information coming from various sources (Eurostat, National Statistical Institutes, OECD etc.) or by estimating missing values. Systematic description of estimated data, following the ESPON metadata template and the work realized through the Data Navigator 11
13 II framework. There is never a single solution for estimating missing value, but a couple of solutions combining the Space (E), the Source (S), the time (T) or the thematic dimensions (I). The idea of this work is to, for each estimated value, explain clearly what was the strategy followed in order to know exactly how the data has been obtained. The ESPON metadata template allows to integrate this information precisely. Coherencies between the NUTS divisions: If possible (when the data is not provided through a survey, such as the Labour Force Survey) The data is collected systematically in the NUTS3, NUTS2, NUTS1 and NUTS0 divisions. The values of NUTS3, NUTS2, NUTS1 and NUTS0 are also linked between them (e.g. the sum of NUTS3 vales are equals to the sum of NUTS2 values, to the NUTS1 values and so on). Limit the statistical breakdowns in time-serie data: New censuses occurring at country level are generally the moment where statistical breakdowns appear in time-serie data (observed both on Eurostat or National Statistical Institutes data) 1. In order to overcome these problems, temporal breakdown analyse and correction methods are necessarily to implement. Proposing innovative indicators based on these count data. Having collected count data of quality which have been meticulously checked, it is possible to implement systematic methods, derived from spatial analysis for instance, which allow to valorise the content of the core database. 2.1 Collection of ESPON Core indicators through Eurostat website A selected number of indicators of interest have been extracted from Eurostat website (table 1). These indicators constitute the data bank and the main source for the building of the future ESPON Core database. All these indicators are available for different NUTS levels (at NUTS2 level at least), for a minimum time period (5 years at least) and are described by count values (km², inhabitants, euros, employees etc.) Eurostat table demo_r_d2jan Indicator of interest contained in the dataset Population by ageclasses and sex demo_r_d3avg Annual average population by sex Timeperiod covered by the table NUTS levels NUTS0 NUTS1 NUTS NUTS0 NUTS1 NUTS2 NUTS3 Last update Possible ESPON Classification 06/12/ Population structure 25/11/ Population structure demo_r_gind3 Total population Live births Deaths Net migration NUTS2 NUTS3 07/12/ Natural changes 1 An impressive example related to this topic is given by the Nigerian census, where population has suddenly decrease from 114 million of inhabitants to 88 million in For more details, see Population et Société, Le recensement du Nigéria, 1992, N 272. The document (in French) is available at the following URL: 12
14 Indicator of interest Eurostat table contained in the dataset nama_r_e3empl95 Employment by NACE R1 activities (8 classes) Timeperiod covered by the table NUTS levels NUTS0 NUTS1 NUTS2 NUTS3 Last update Possible ESPON Classification 25/05/ Labour maket 0702 Employment lfst_r_lfe2en1 Employment by NACE rev.1.1 activities (9 classes) lfst_r_lfe2en2 Employment by NACE rev.2 activities (11 classes) lfst_r_lfp3pop Economically active population lfst_r_lfu3pers Unemployment by sex and age lfst_r_lfu2ltu Long-term unemployment edat_lfse_10 Persons aged with upper secondary education attainment (in % only) educ_renrlrg1 Number of students by level of education by sex (ISCED0-6) nama_r_e3gdp Gross Domestic Product in Euros and PPS NUTS0 NUTS1 NUTS NUTS0 NUTS1 NUTS NUTS0 NUTS1 NUTS2 NUTS NUTS0 NUTS1 NUTS2 NUTS NUTS1 NUTS NUTS0 NUTS1 NUTS NUTS0 NUTS1 NUTS NUTS0 NUTS1 NUTS2 NUTS NUTS0 NUTS1 NUTS2 NUTS3 nama_r_e3vabp95 Gross value added by economic branches, NACE rev.1.1 activities (9 classes) ef_r_nuts Number of NUTS0 agricultural NUTS1 holdings (in area NUTS2 and economic NUTS3 weight) demo_r_d3area Area of the region NUTS0 NUTS1 NUTS2 NUTS3 14/12/ Labour maket 0702 Employment 08/07/ Labour maket 0702 Employment 08/07/ Labour maket 29/11/ Labour market 0603 Living conditions 0702 Employment 05/09/ Labour market 0603 Living conditions 0702 Employment 27/05/ Education 07/12/ Education 05/08/ Aggregated accounts 30/06/ Production and costs per sector 31/01/ Farm structure 07/10/ Land use and land cover by types Table 1: The basis of ESPON M4D data collection: Information extracted from Eurostat website References and content of the tables 13


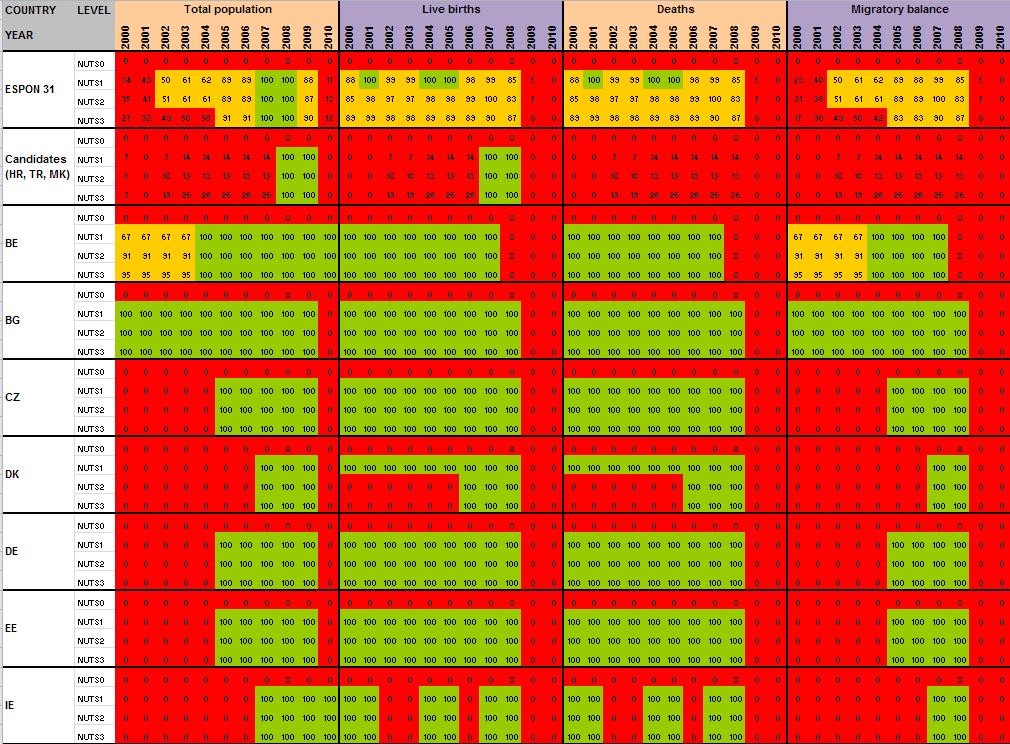
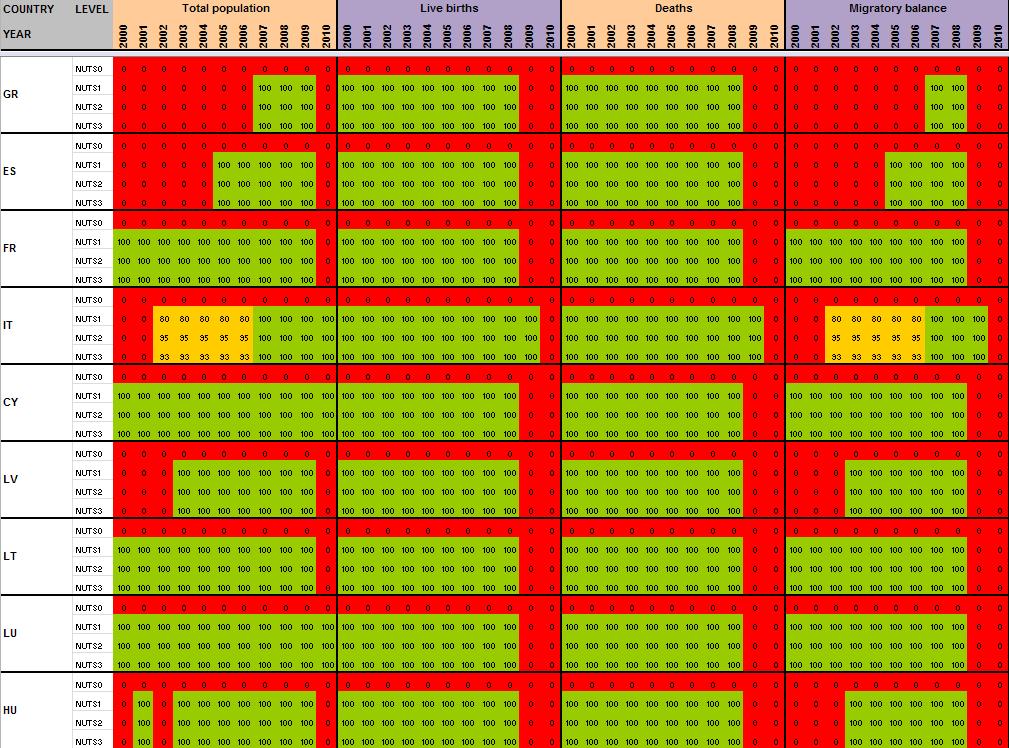
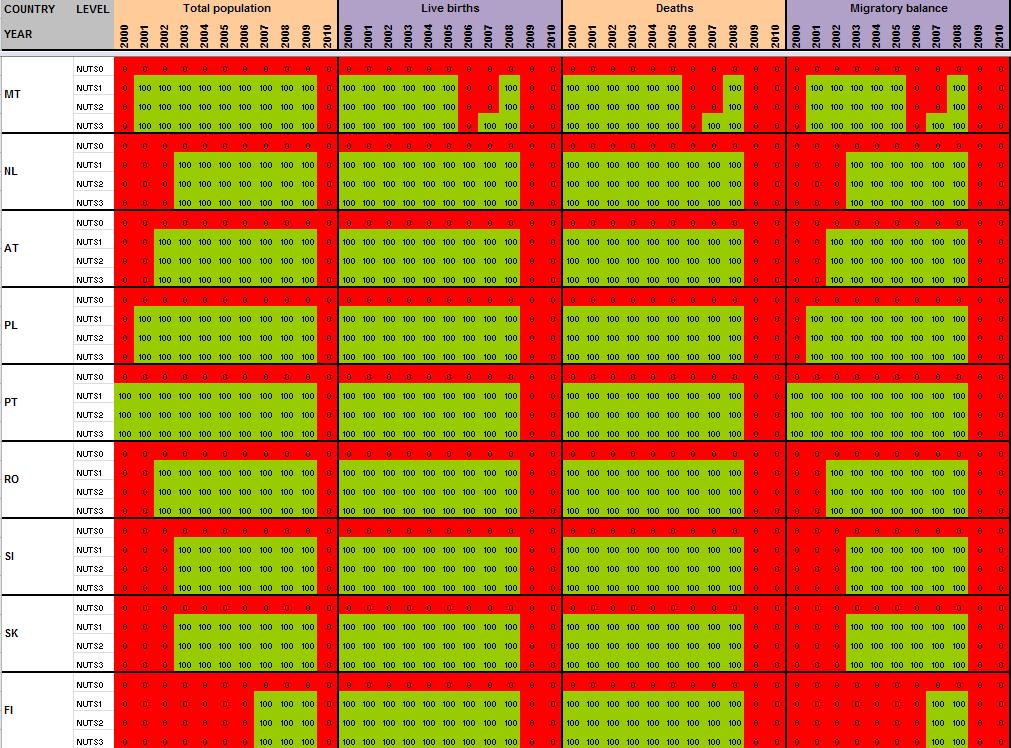
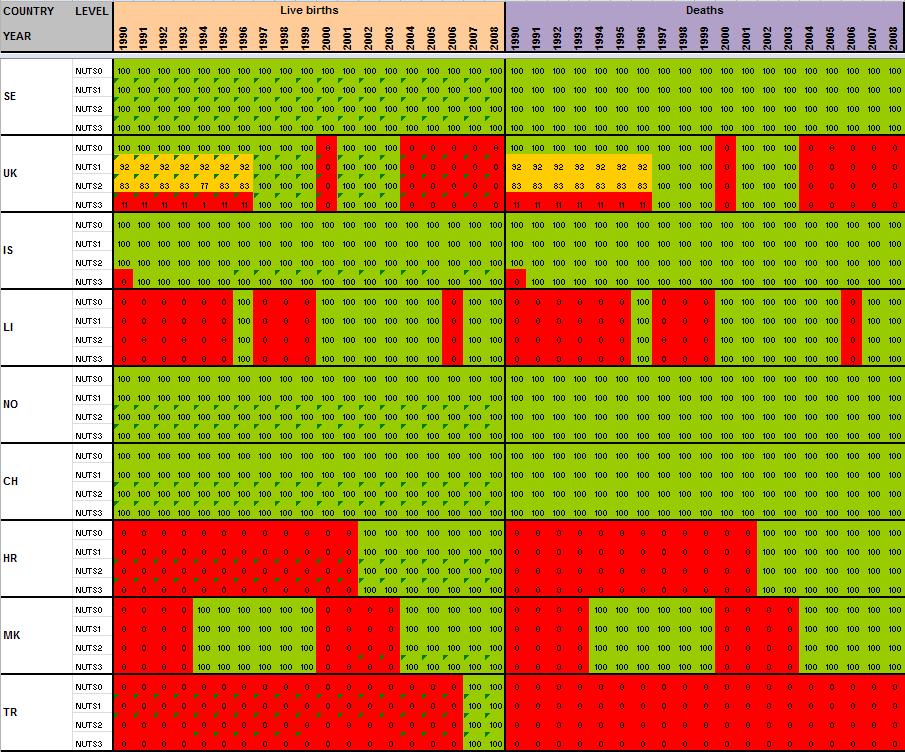
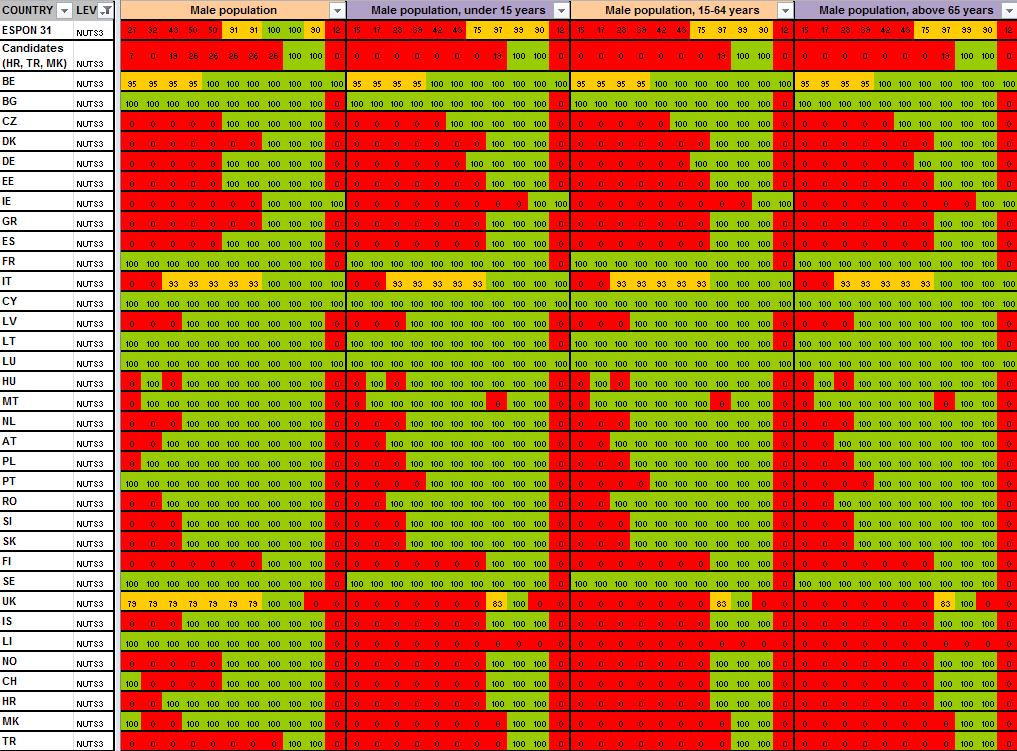
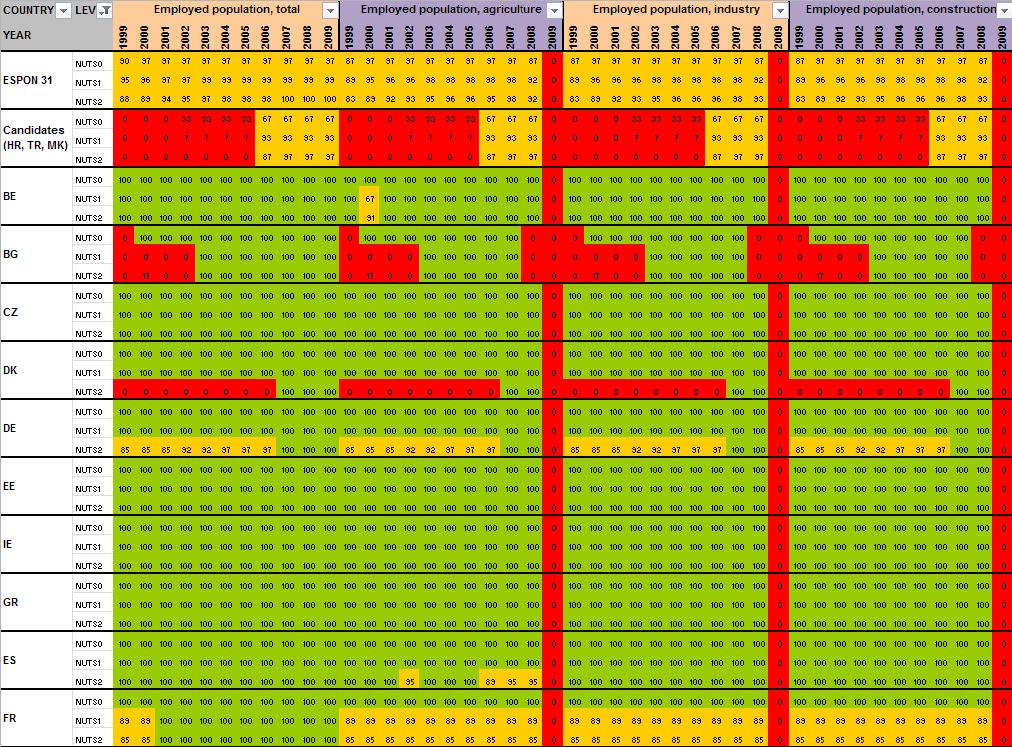
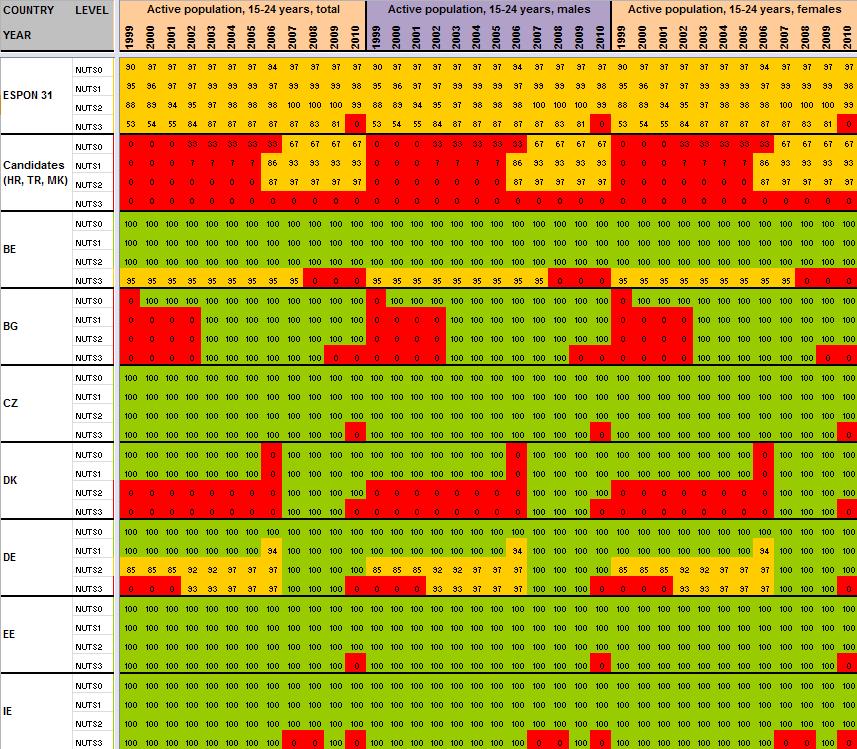
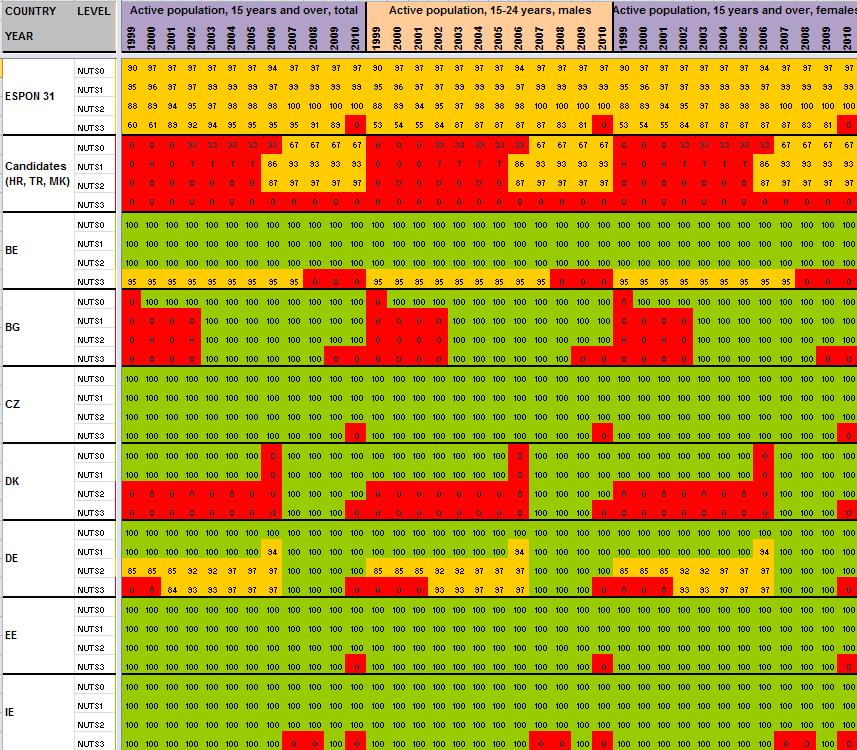
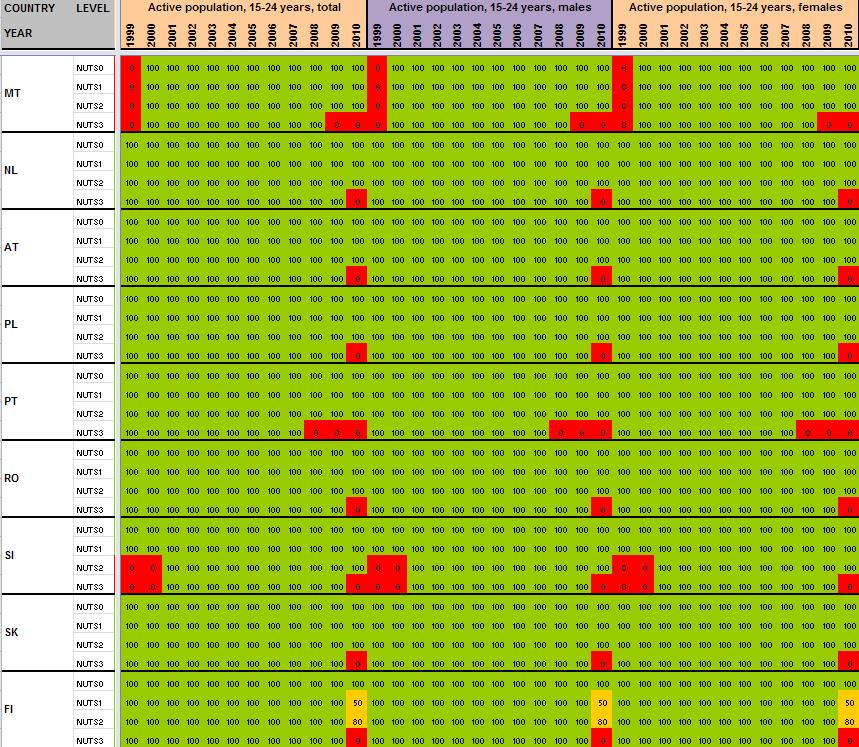
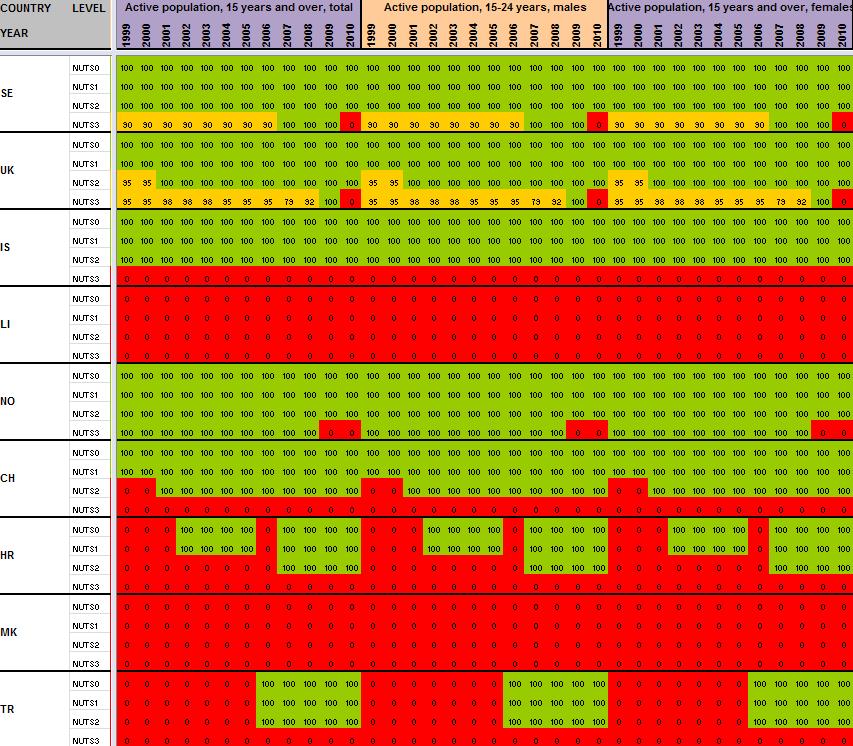
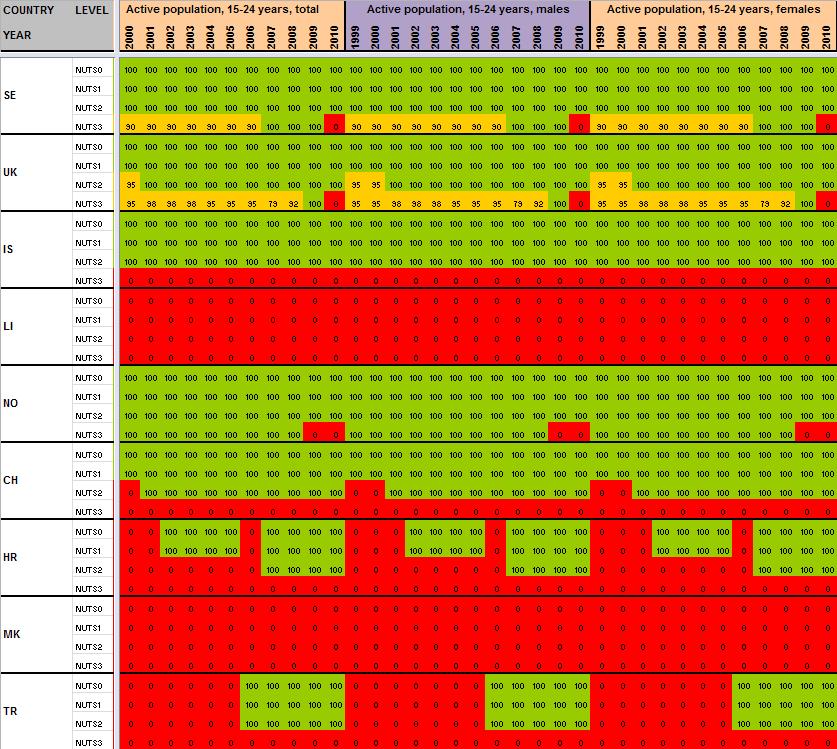
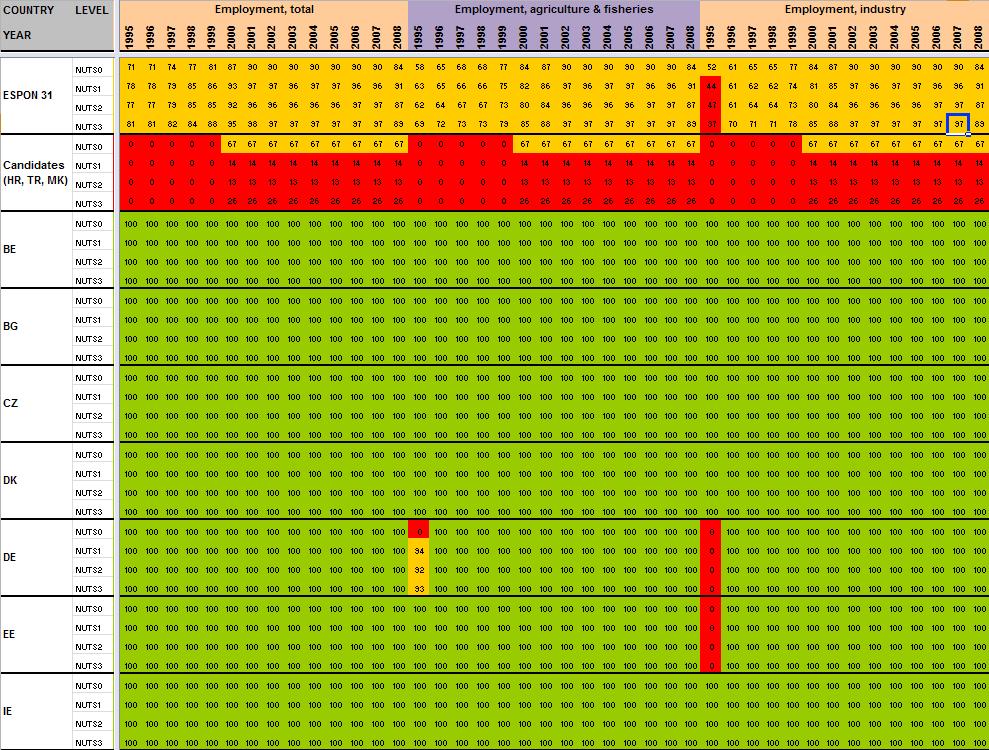
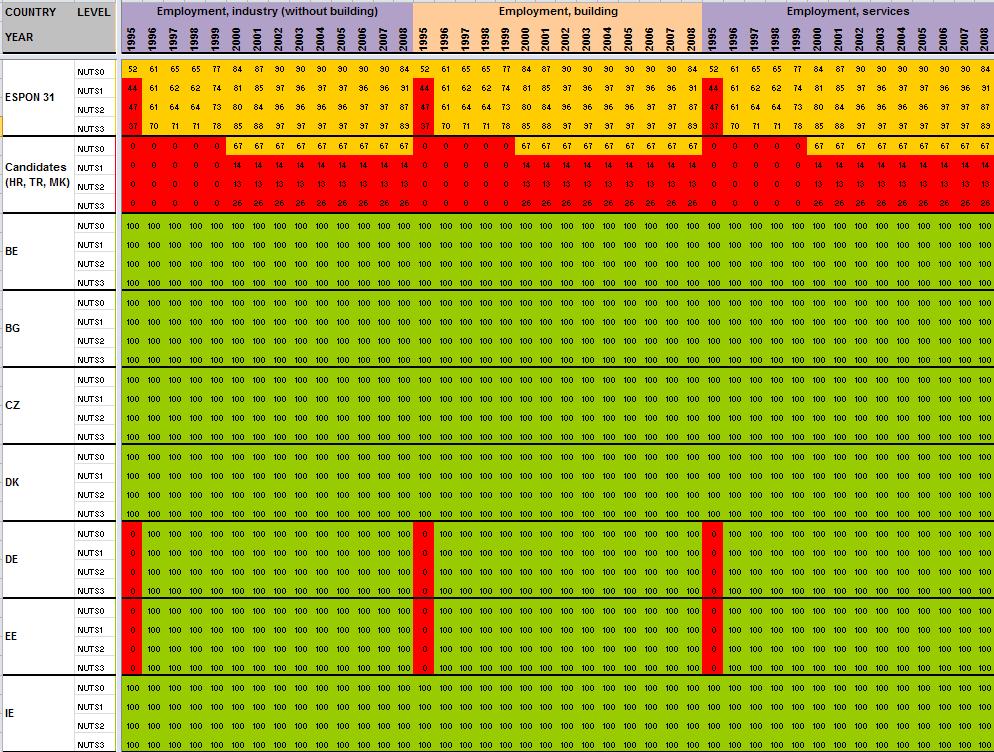
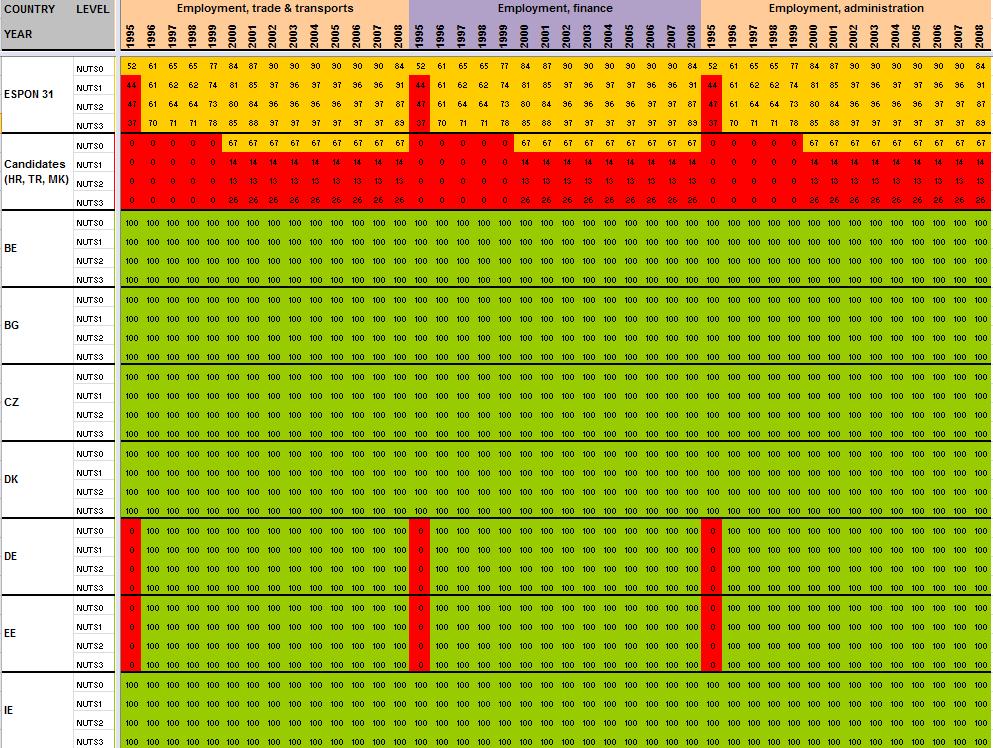
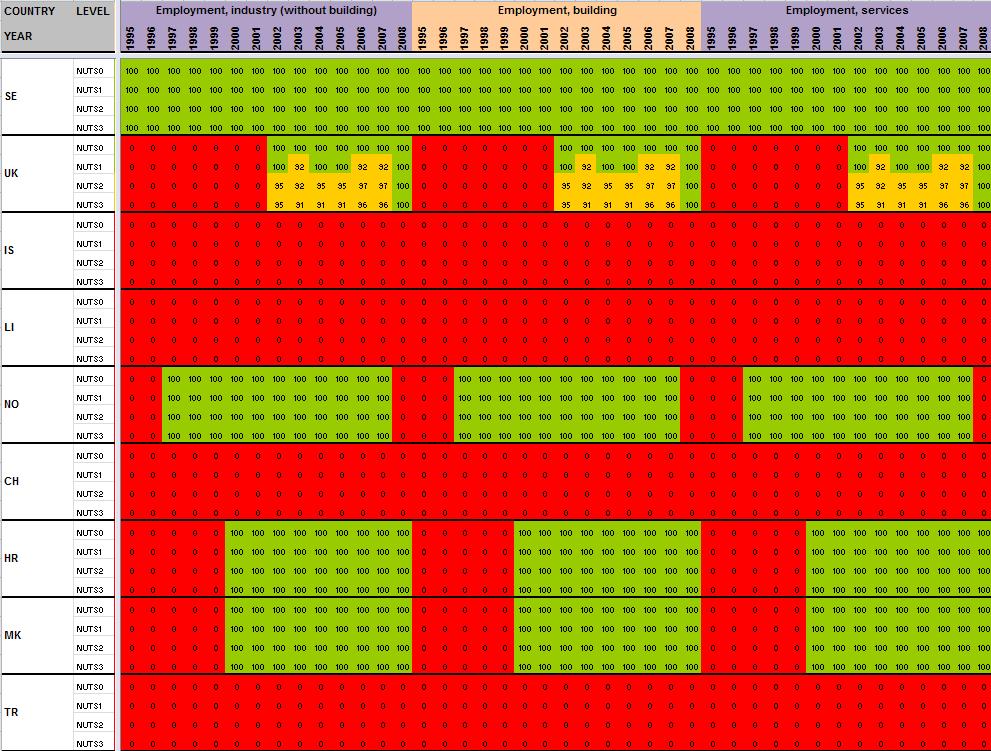
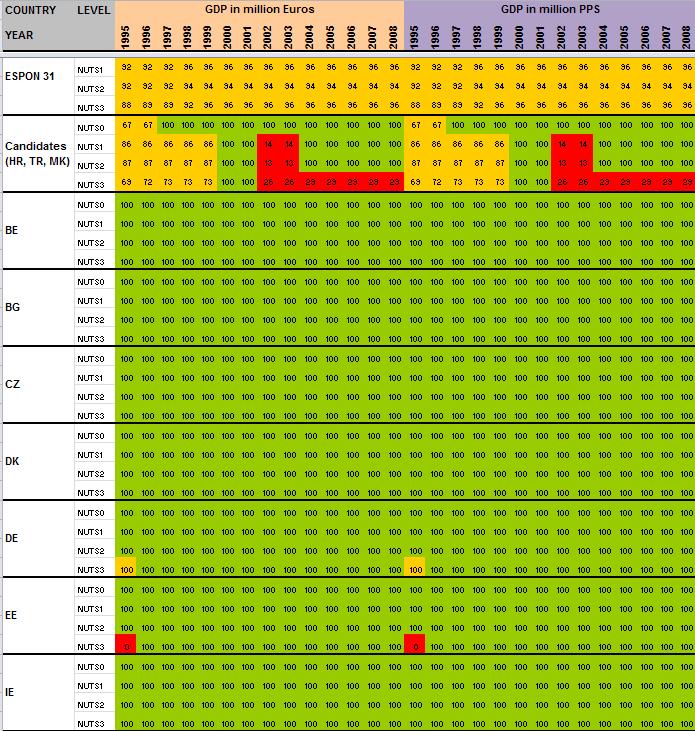
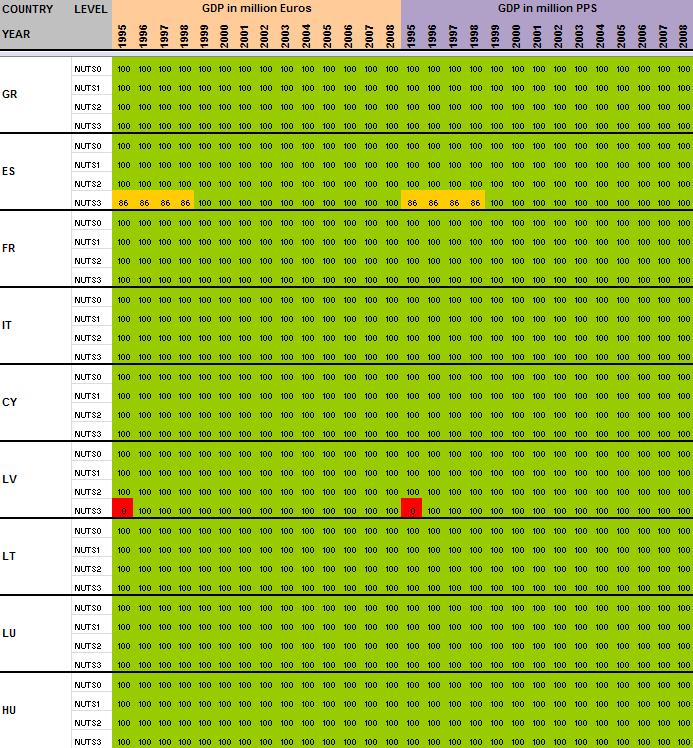
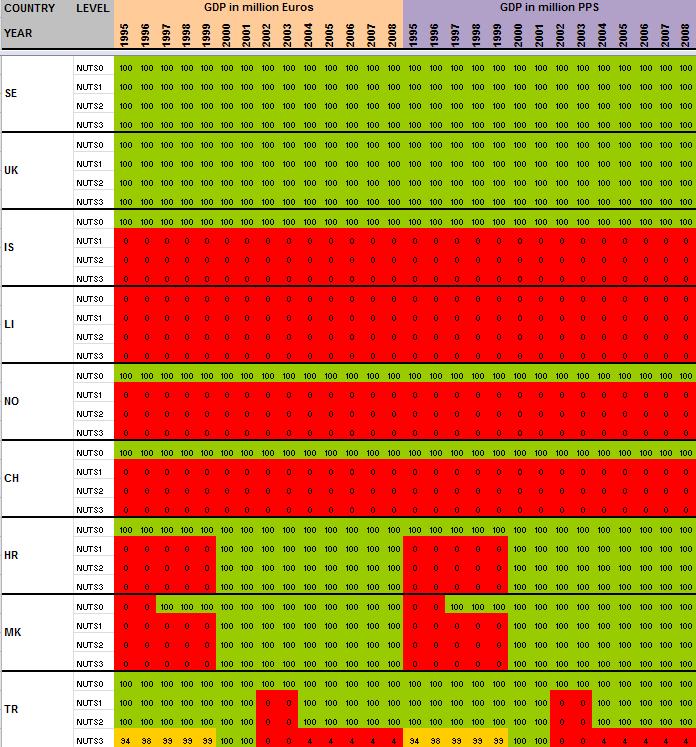
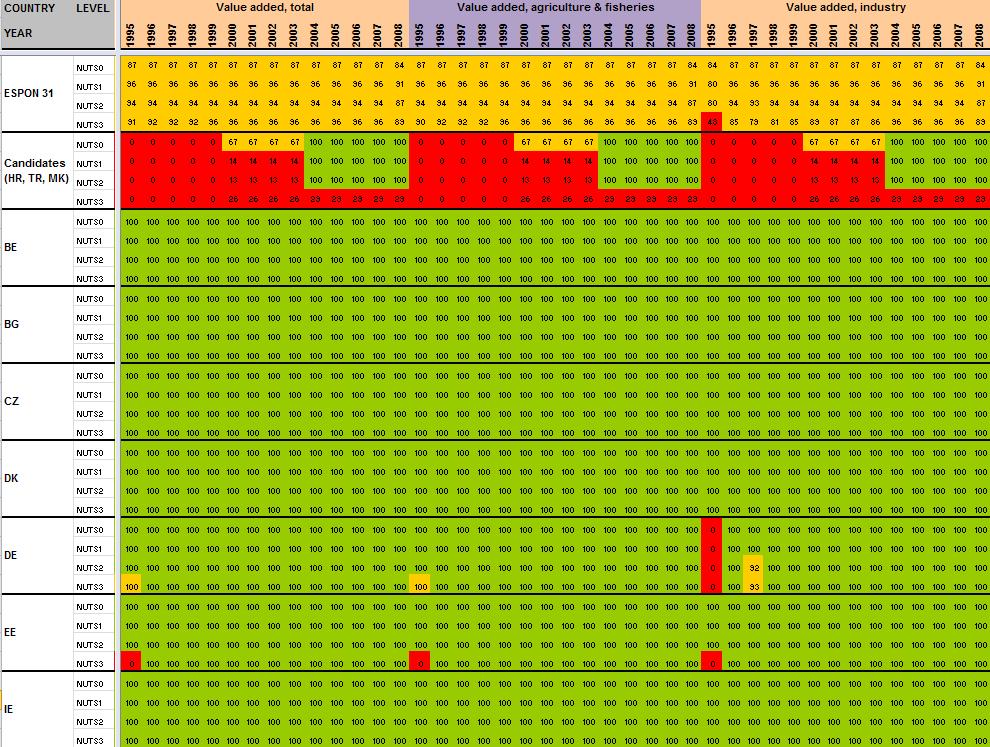
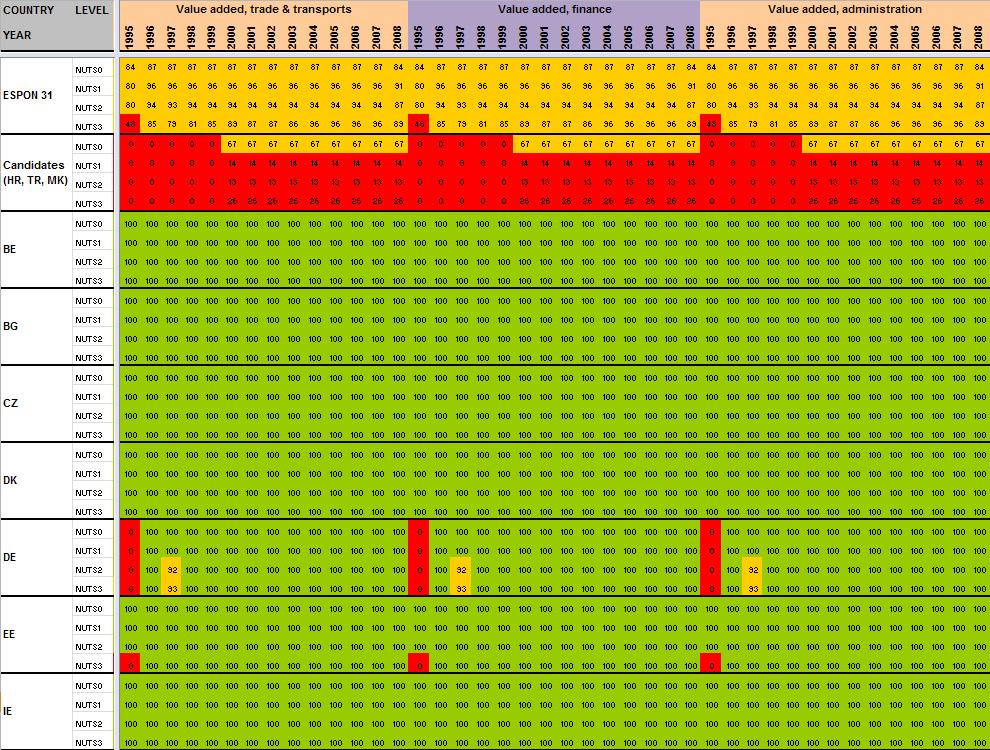
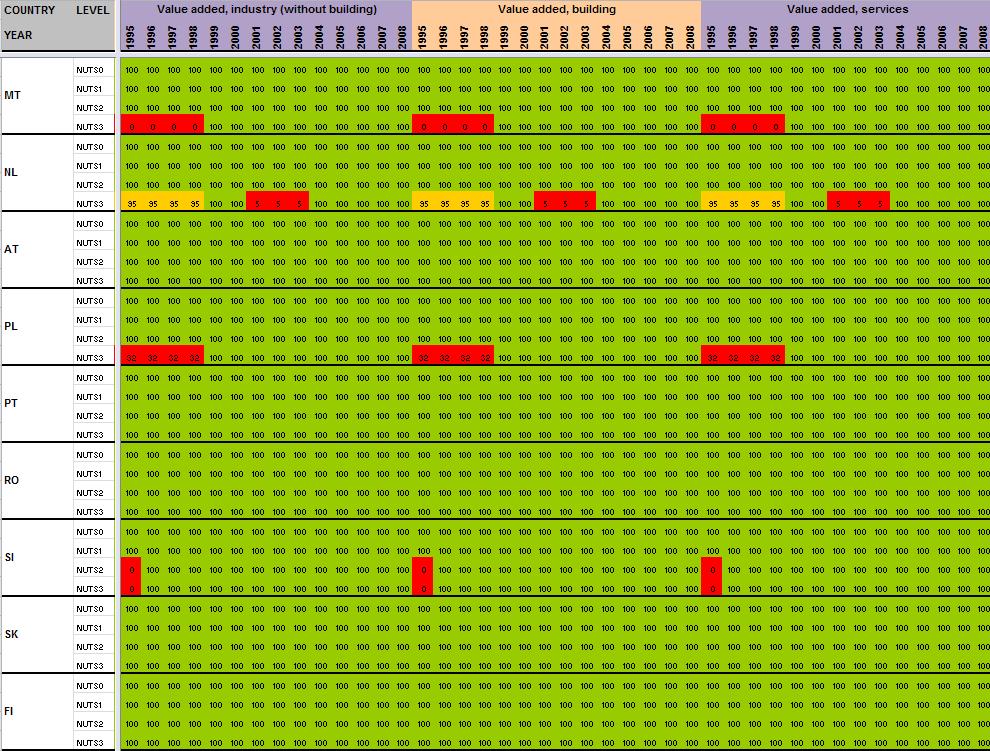
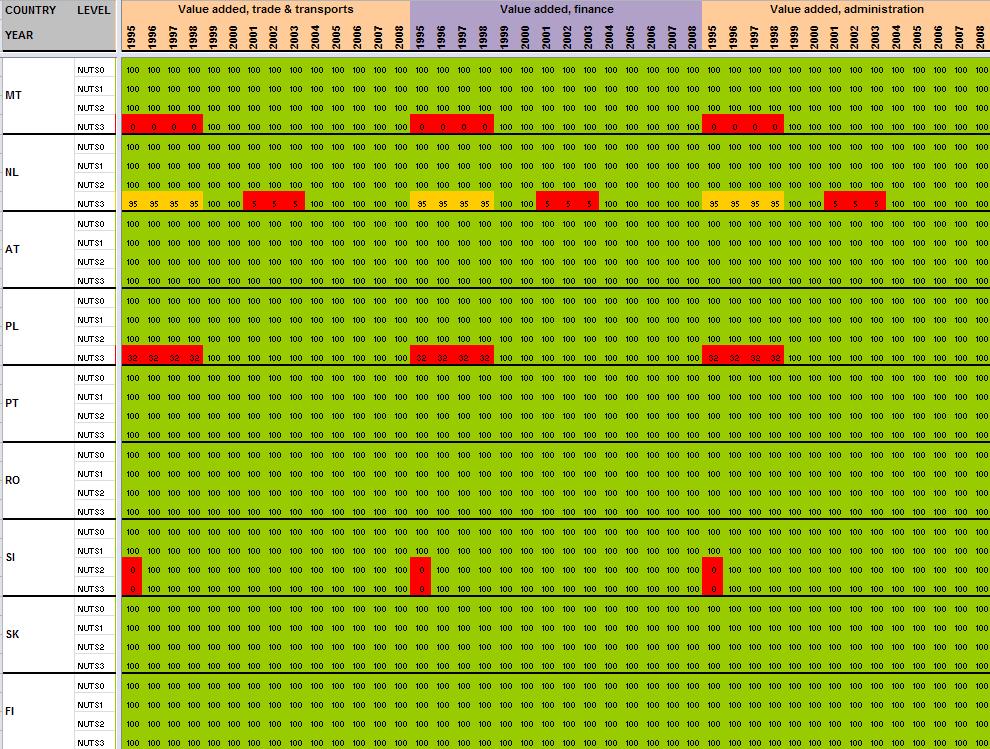
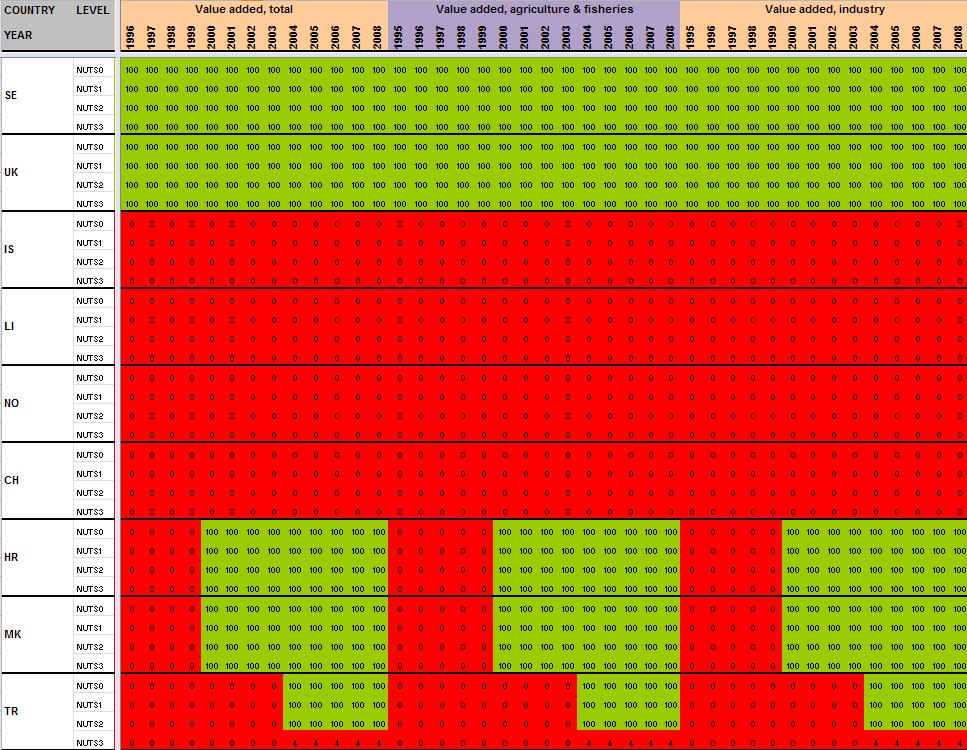
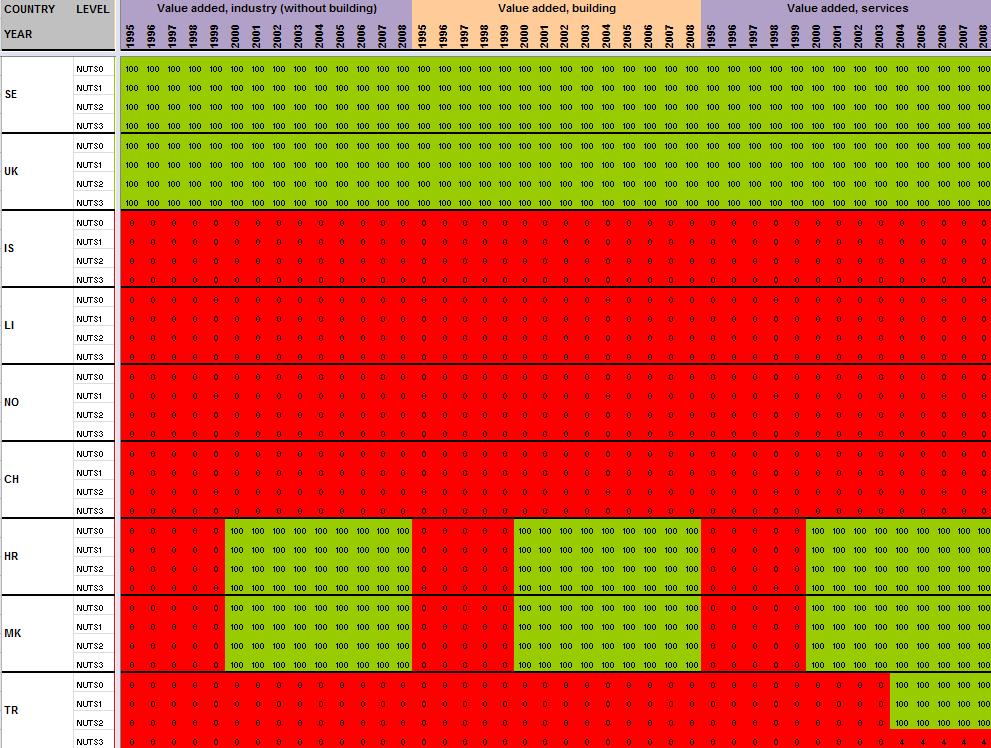
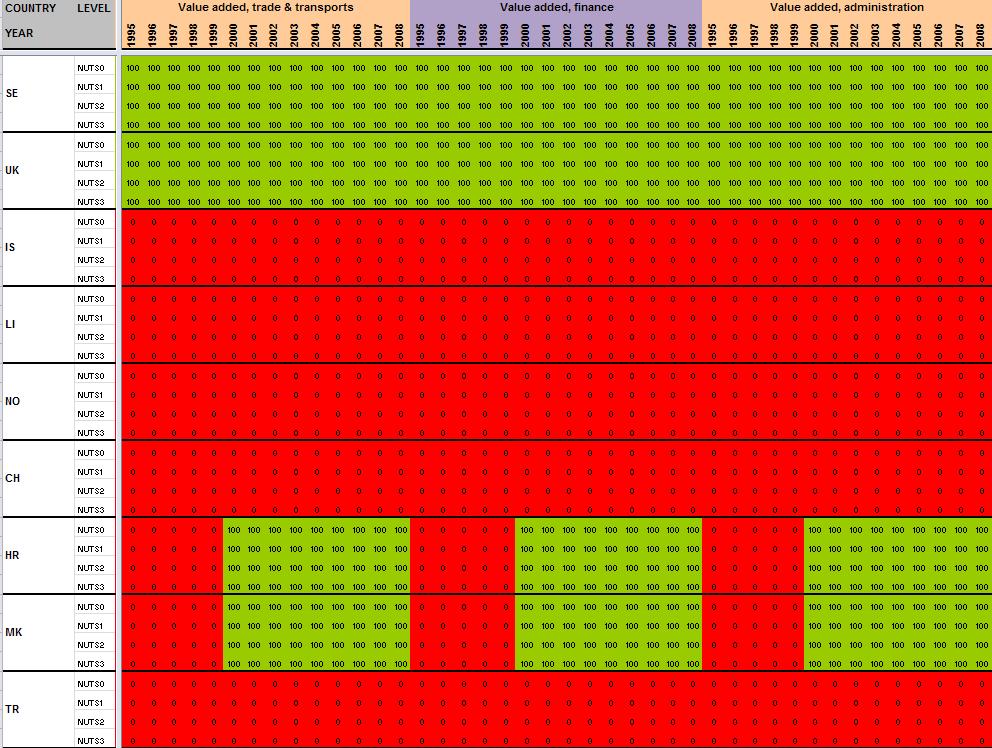
15 When all the data have been extracted from Eurostat, keeping their original format (figure 4), systematic measures of data availability for the ESPON space and Candidate Countries 2 are made in order to have an overview on what is feasible or not in term of data estimation: It is clear that it is currently impossible to propose the total population in 1970 at NUTS2/3 levels, considering the low level of harmonised information available. Differences introduced between the estimation and the reality might be too important. Nevertheless, keeping the example of total population, it is possible, by combining different Eurostat tables, to make available a complete time-serie for the period The amount of available information is sufficient, considering that: Data were complete at NUTS3 level for all ESPON 31 and Candidate Countries for 2 years (figure 5). At NUTS2 level, most of the data were available from 1990 to 2010 allowing the use of precise methods of data estimation (retropolations and hierarchy harmonization, cf part. 2). Total population is probably one of the most general statistical indicators, which is generally available when using National Statistical Institutes resources. Figure 4 First step, extraction of Eurostat tables Figure 5 Second step, calculation of data availability in Eurostat tables 2 Cf Annex 1 to see the data availability of selected tables. 14

16 2.2 Estimation of missing values using the ESTI framework and the ESPON metadata model When analysing the degree of completeness of Eurostat s targeted indicators (cf Annex 1), in no case it is possible to have a complete dataset for a time-period longer than 2 two years for all the NUTS levels for the ESPON Area (even for the total population, probably the most complete dataset in Eurostat). In this context, Eurostat missing values are also not systematically provided by National Statistical Institutes, because of changing of territorial divisions (Poland, Denmark) or protecting historical data to free access (Romania, Slovakia). Consequently, for building time-series data and estimating missing values, alternative solutions are required out of Eurostat and NSI. By the past, ESPON has produced interesting materials for overcoming the problem raised by missing values. The ESTI framework in the Data Navigator 2 project is one of the milestones to consider in that topic (figure 6). Figure 6 The ESTI framework project, a milestone for estimating missing values The ESTI framework proposed a couple of solutions, based on four dimensions: The Spatial dimension (E): Estimate the missing values thanks to values known at an upper, lower or at the same hierarchical level. The Source dimension (S): Alternative sources of information can be used when the main source does not provide the targeted information. The Time dimension (T) uses information provided in time before or after the value to estimate. 15

17 The Thematic dimension (I): The idea is to replace the missing value by a known value coming from an alternative indicator, controlled by a correlation factor. As regard to this useful background, we have tried to improve the ESTI framework on the basis of empirical situations, provided by the experience of the estimation of missing values on the total population dataset coming from Eurostat. The resulting document (entirely available in Annex 2), describes 12 one-dimensional and 8 multi-dimensional methods derived from the 4 dimensions of the ESTI framework allowing to estimate missing values in a couple of various situations. The aim of this document is twice. Firstly, to help users (who have not a specific background in statistics) to overcome problems raised by missing values. Secondly, to find an efficient system for describing the methodology used for the estimation in metadata. This documentation is scalable. It will be improved and expanded later regarding to user and experts feedbacks. Nevertheless, it is currently structured in different parts: Conditions of use No data at lower level of the hierarchy in X(e,s,t,i). Information available at a upper level of the hierarchy X,((parent(e),s,t,i) Data at lower level of the hierarchy available from another organism of statistics X(e,s,t,i) This part describes some preliminary conditions for using a given method of data estimation. Indeed, it is impossible to estimate data without having a minimum information linked to the data to estimate. Graphic illustration Considering that some estimation methods are sometimes difficult to explain (when using several dimensions in particular), we have tried to illustrate graphically each method simply to ease the understanding of them. 16
![Textual explanation Estimation based on source and space dimension (S, E) The values have been collected from [name of the organism of statistics], then, adjusted by ESPON M4D Project in a way that](/docs-images/72/67143342/images/18-0.jpg "the sum of the values of the children units (e1, e2 en) are equal to the value of the parent unit (e) In this case, [name of the hierarchy, e.g.")
18 Textual explanation Estimation based on source and space dimension (S, E) The values have been collected from [name of the organism of statistics], then, adjusted by ESPON M4D Project in a way that the sum of the values of the children units (e1, e2 en) are equal to the value of the parent unit (e) In this case, [name of the hierarchy, e.g. NUTS3] values coming from [name of the organism of statistics of X(e,s,t,i)] is adjusted to the [name of the hierarchy, e.g. NUTS0] values delivered by [Name of the organism of statistics of X(e,s,t,i), e.g. generally Eurostat] In this part, we aim to find a harmonized way for describing the methodology of the estimation method. For the moment, in the ESPON metadata, this description is made by a free-text. Consequently, there are too many different descriptions of data estimations, and very often there are too few elements of description for understanding correctly how the data has been estimated. With this information box, we propose a common definition of the estimation methodology. The only parameters to change are described in italics (e.g. the name of the organism of statistics, the level of data harmonization, the year used for the temporal extrapolation, etc.) Mathematic formalization Following the mathematic syntax provided by the ESTI framework, we have provided the mathematic formalization of each estimation method 3. Example We propose here to formalize the procedures of data estimations as regard to regular concrete situations. We try systematically to explain step by step the methodology employed for estimating data by using the ESTI terminology. In that order, we expect that non-specialist of data estimation can appropriate themselves the methods explained in the documentation. 3 We precise that this formalization need to be improved with specialist of mathematic formalization. 17
 and estimated values.")
.")
 Value estimated using the source (S) and space (E) dimensions Figure 7 Extract of the dataset of population 1990-2010 For instance, when adopting the labelling for the table of total")
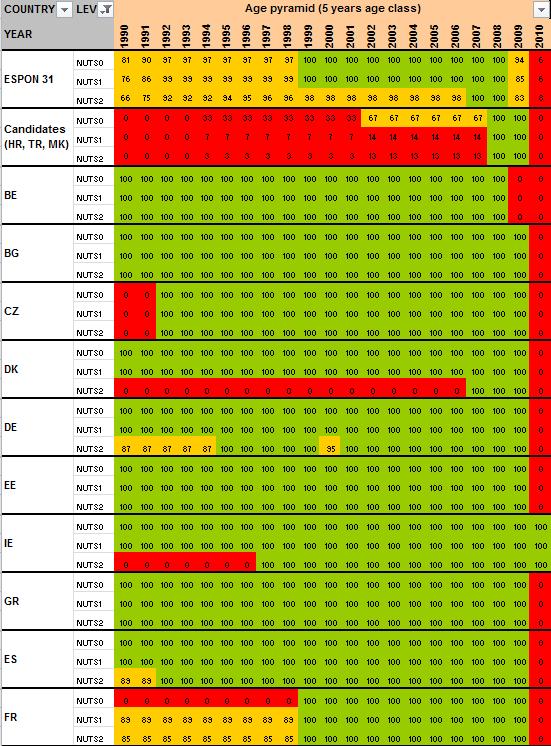
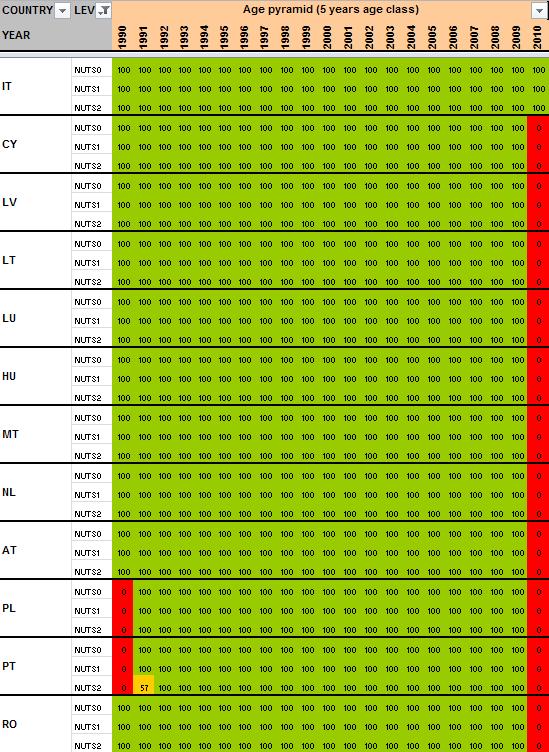
19 Intelligent labels When a lot of estimation methods are used in a dataset, the risk is high to make confusion between existing labels, not making possible the differentiation between the information coming from official sources (Eurostat, National Statistical Institutes ) and estimated values. On top of that, we consider that it could be interesting to understand directly in the dataset what method of estimation has been used for filling missing values. This is why we propose a codification for labelling the values (figure 7). Value coming from a national statistical institute (the label begin by another number than 1 ) Value estimated using the temporal (T) and space (E) dimensions Value coming from Eurostat (the label begin by 1 ) Value estimated using the source (S) and space (E) dimensions Figure 7 Extract of the dataset of population For instance, when adopting the labelling for the table of total population (figure 8), it is immediately possible to note that this file contains 4 labels related to Eurostat tables (labels beginning by 1a, 1b, etc), 35 labels are related to various National Statistical Institutes (beginning by 3a,4,13 etc), 9 labels related to onedimensional estimation methods (beginning by E or S or T or I) and 43 multidimensional methods (beginning by a couple with at least two letters of the acronym ESTI). Having done this labelling, it is also easy to extract only values coming from Eurostat, NSI or estimations. Figure 8 Extract of the labels contained in the metadata of the dataset of population
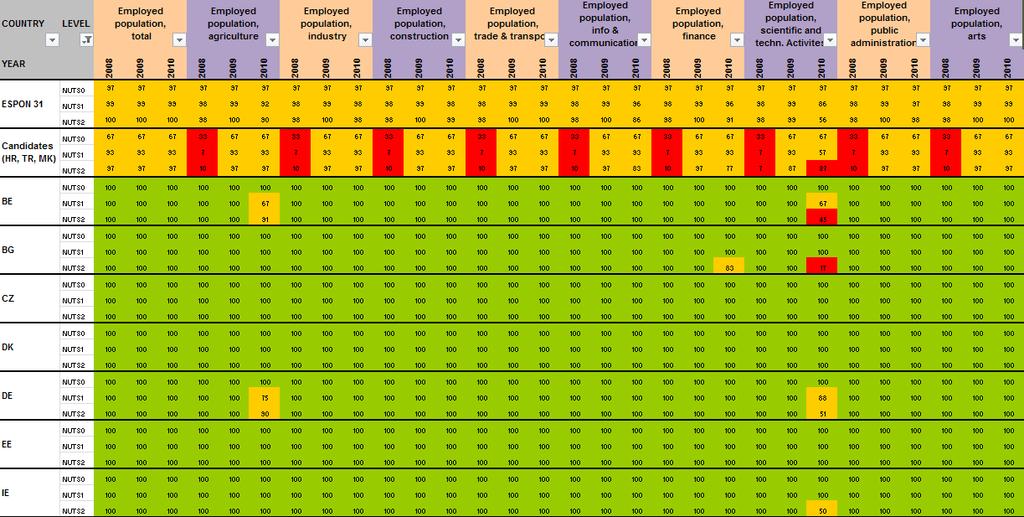
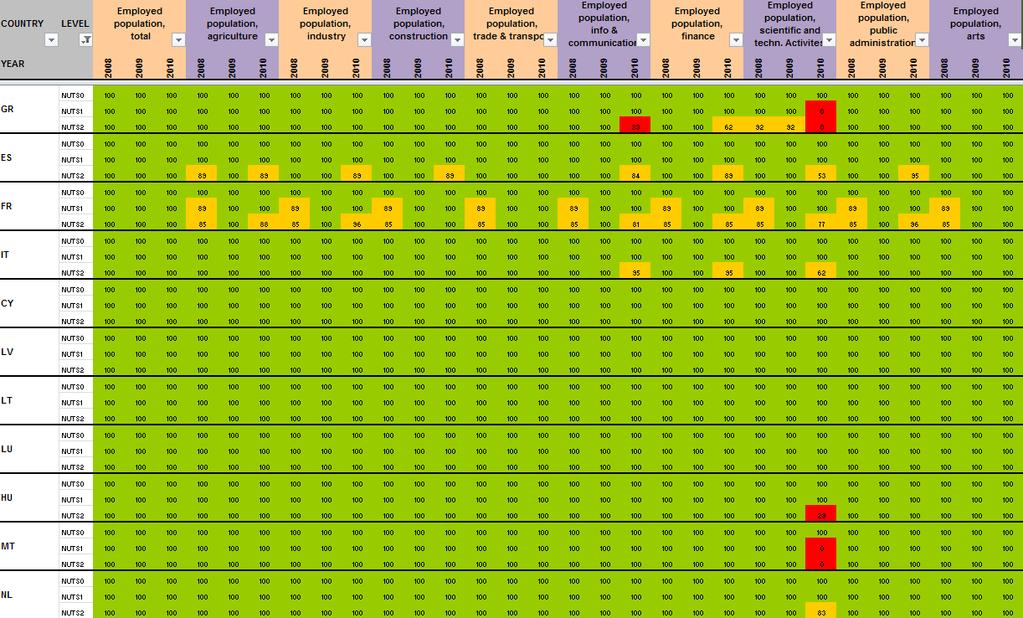
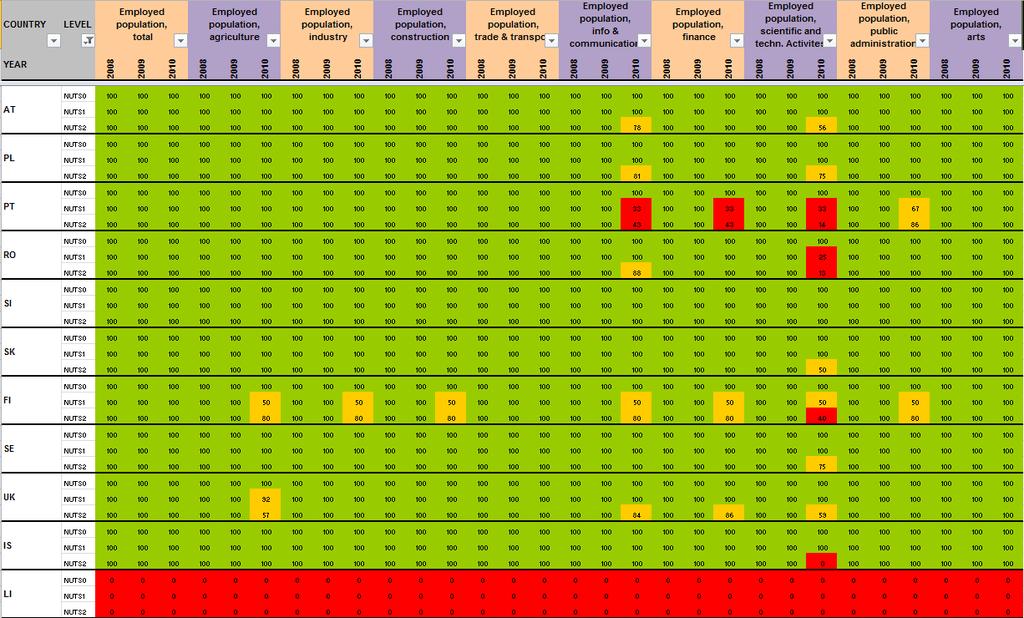
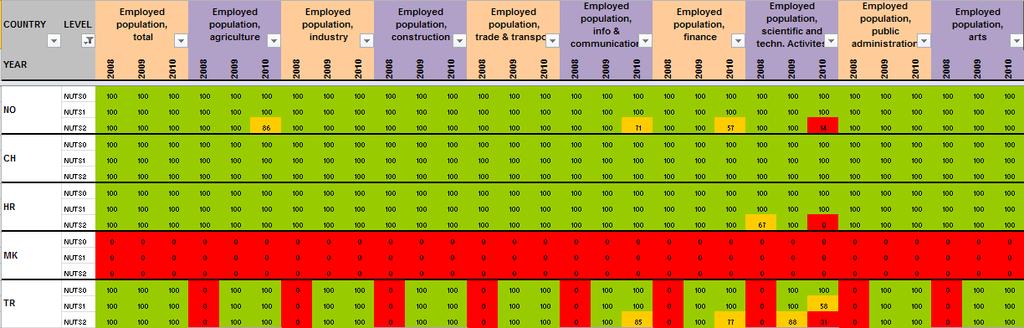
20 2.3 Data quality control, example of population check by level As described in precise terms by Martin Charlton and Paul Harris in the ESPON Technical Report on outlier detection 4, exceptional values may arise during the coding, transmission, manipulation or editing of data. They may not be noticed until late in the day or not at all, particularly if the data that is a candidate for input to the Database has been the outcome from a series of sequential manipulations. Exceptional values may also arise in the measurement of data; perhaps a sensor on some measuring equipment has been incorrectly calibrated or is faulty; a respondent can tick the wrong box in completing a survey form. Anyway and even if the technical process of data creation is very precise, there is ever a risk of integrating involuntary inputs errors in the datasets created. This is the reason why the definition of automatic check of outliers and errors is too important. The ESPON Database 1 has produced a battery of filters against which potential input data can be tested in R programme with experimental datasets. We propose in the second phase of the project to enlarge the process of data quality control in order to make possible systematic check for indicators that aim to integrate the ESPON Core Database. To illustrate this operational phase of the quality control, the ESPON M4D project has implemented a hierarchical data check in a R programme (cf in Annexe 3). The idea of this simple check is to know whether the amount of data collected at NUTS3 level is equal to the data collected at other NUTS levels. This check provides two kind of tables: The first one makes the sum of the count indicator at each NUTS level and compares in absolute (dif) and relative terms (pct) the gap between the different NUTS hierarchical levels (figure 9). In this case, the table shows that a difference of 6835 inhabitants exists between the NUTS3 and the NUTS0 for the total population in 2001 and a gap of inhabitants has been introduced between the NUTS0 and the NUTS1 nomenclature in CHARLTON M., HARRIS P., 2011, Spatial analysis for quality control, ESPON Technical Report, 81 p. 5 We precise that detected errors have been corrected thanks to this hierarchical check 19

21 Figure 9 Hierarchical data check 1 Comparison of the sum of the count indicator by hierarchical level and years The second table (figure 10) is useful to target hierarchical incoherencies by country when a gap appears during the first test. In the total population example, errors have been introduced for Italy from 1990 to 2005 between the NUTS3 and NUTS0 levels for example. It is due to the fact that the NUTS0 population is delivered by Eurostat and the NUTS3 values by I-STAT without hierarchical harmonization Thanks to this check, these logical input errors have been adjusted quickly. Figure 10 Hierarchical data check 2 Comparison of the sum of the count indicator by hierarchical level, years and country (NUTS3-NUTS0 level in this case) 20
22 2.4 Transformation of indicators by functional smoothing Since the beginning, one of the major strength of ESPON Program has always been the production of indicators based on multimodal accessibility of regions and cities by air, train or road. Thanks to the excellence of research teams involved in this area of research (S&W, RRG, MCRIT, INRETS, CESA, ), ESPON has been able to produce regularly maps of potential of population or GDP under various assumption of friction of distance or opening of borders. In terms of comparative advantage, ESPON has clearly here a strong added value as compared to Eurostat, OECD and even DG Regio (Multimodal accessibility is one of the only ESPON map that has been reproduced in a Cohesion Report). This advantage is currently maintained by new projects in Priority 1 and Priority 2 dealing with local accessibility (TRACKS) or to simulation of the effect of various scenarios of accessibility in the future. Considering this specificity of ESPON, we propose to push further the advantage by developing a family of new indicators based on functional smoothing of regional data available at NUTS2 or NUTS3 levels. This strategy is directly related to the Core Database Strategy because it proposes to transform all the count variables into functional potential and then to compute the related indicators derived from this count variables in order to achieve functional smoothing. Let us explain briefly the principle behind that proposal through a simple example, the analysis of population variation at NUTS3 level between 2000 and 2010, resulting of the data creation process described in part 2.1, 2.2 and 2.3. The initial map of population variation at NUTS3 level is not correct because strongly dependant of the heterogeneity of territorial divisions (figure 11). As explained by the ESPON 2006 project on Modifiable Area Unit Problem, such a map is not really useful for a functional approach of European territories because it is based on a mixture of regions of different size (big to small) and different nature (urban, mixed, rural). In many countries like Poland and Germany, the map displays demographic decreasing core-cities surrounded by demographic growing suburb areas. But in other countries like France or Spain this distinction is not visible because territorial units are mixing both type of regions in a single entity. As a result, the map is not useful at all for political decision because it is too heterogeneous in terms of territorial divisions. The transformation into a map of population variation in a functional neighbourhood of 1 hour by road (figure 12) eliminates the majority of problems identified previously. What is measured here is not only the internal situation of the regions but a combination between their internal dynamic and the dynamic of neighbouring regions (e.g. with a weight of 0.5 for regions located at 1 hour, 0.05 for regions located at 2 hours, ). This map is easily obtained through a function of gaussian smoothing applied to time distance by car between NUTS3 regions (source: RRG). The time of computation is less than 2 minutes on a normal PC computer, which means that all count variables available at NUTS3 level could be easily functionally smoothed, producing related indicator of unemployment rate, GDP/capita in a functional neighbourhood of 1 hour by car. It is certainly of major political interest for regional authorities to measure not only their internal situation but also the one of the neighbouring area. It is indeed not the same to be a region with high unemployment rate surrounded by region with low unemployment rate (e.g. Seine-Saint-Denis in France) or a region with high unemployment rate surrounded by region with equivalent or highest levels of unemployment (e.g. majority of regions of eastern Germany). 21

23 Variations of time span and variations of opening of borders. Following the same principle, we can derive alternative maps, for example by considering that the mobility of people is increase and that the influence of neighbouring regions is decreasing lower with distance (figure 13). We can also examine what happens when border are closed and when contributions to current situation is only national (figure 14) Figure 11 Evolution of population between 2000 and
24 Figure 12 Evolution of potential population between 2000 and 2010 in a 60 mn radius 23

25 Figure 13 Evolution of potential population between 2000 and 2010 in a 120 mn radius opened borders 24
26 Figure 14 Evolution of potential population between 2000 and 2010 in a 120 mn radius closed borders 25
27 Conclusion Yes, there are two paths you can go by, but in the long run There's still time to change the road you're on And it makes me wonder Led Zepplin, Stairway to Heaven It is certainly not obvious to choose between the two paths of development of the ESPON database that has been described at the beginning of this report in section 1.1 and there is no doubts that it makes us wonder On the one hand, the «Cosmetic» approach offers a relative security because it follows a normative path where all the effort is put on registration of work produced by other ESPON TPG, with a minor role of M4D project which is just a kind of gate keeper and designer of results. It is certainly not a very exciting path for a TPG composed of researchers with advanced skills in cartography, spatial analysis, computer science... but with few skills in communication, public relation and accounting. On the other hand the «Sustainable approach» proposes a more risky strategy as it suggests to follow an innovative path where, by definition, we cannot be sure of the results that will be finally obtained. We have tried to demonstrate by the work of the last months that the Core Database Strategy is feasible and likely to obtain results in a short delay. But time is not expansible and it will be difficult at the same time to push this strategy without reducing somewhere the effort on the pure compilation of data produced by TPGs. What we propose to ESPON CU and ESPON MC is to let us develop the CDS experience during 6 months until de Denmark meeting. And to decide at this moment only if we are right or if we should have done better by sticking to a purely normative role. 26
28 Bibliography ANDRIENKO N., ANDRIENKO G., GATALSKI P., 2001, Exploring change in census time series with interactive dynamic maps and graphics. Computational Statistics, vol. 16, no. 3, pp BEN REBAH M., PEETERS D., PLUMEJEAUD C., YSEBAERT R., 2011, Modeling territorial changes and time series database process, empirical approach and applications, ESPON, Technical Report, 32 p. CHARLTON M., HARRIS P., 2011, Spatial analysis for quality control, ESPON Databse 2013, Technical Report, 81 p. DEICHMANN U., BALK D., YETMAN G., 2001, Transforming Population Data for Interdisciplinary Usages: From census to grid, NASA Socioeconomic Data and Applications Center (SEDAC), 19 p. ESPON 3.2., 2006, Part 1 Handbook for data collection, Data Navigator 2, Final Report, 153 p. ESPON 3.4.3, 2006, The modifiable areas unit problem, Final report, 254 p. GALLEGO J., A downscaled population density map of the EU from Commune Data and Land Cover information, JRC-ISPRA, 10 p. GRASLAND C., MATHIAN H., VINCENT J.M., 2000, Multiscalar analysis and map generalisation of discrete social phenomena: Statistical problems and political consequences, Statistical Journal of the United Nations Economic Commission for Europe, IOS Press, Volume 17 (2), LEVY M.-L., OMOLUABI E., 1992, Le recensement du Nigéria, Population et Sociétés, n 272, 4 p. MADELIN M., GRASLAND C., MATHIAN H., SANDERS L., VINCENT J-M., 2009 "Das MAUP : Modifiable Areal Unit Problem oder Fortschritt? ", Informationen zur Raumentwicklung, n 10/11, MILEGO R., RAMOS M.J., 2011, Disaggregation of socio-economic data into a regular grid and combination with other types of data, ESPON, Technical Report, 37 p. PLUMEJEAUD C., 2011, Modélisation et représentation de données spatio-temporelles évolutives pour la cartographie interactive, Thèse de doctorat, 310 p. PLUMEJEAUD C., VINCENT J.M., GRALAND C., BIMONTE S., MATHIAN H., GUELTON S., BOULIER J., GENSEL J., 2008, «HyperSmooth: A System for Interactive Spatial Analysis Via Potential Maps», Lecture Notes in Computer Science, Volume 5373,
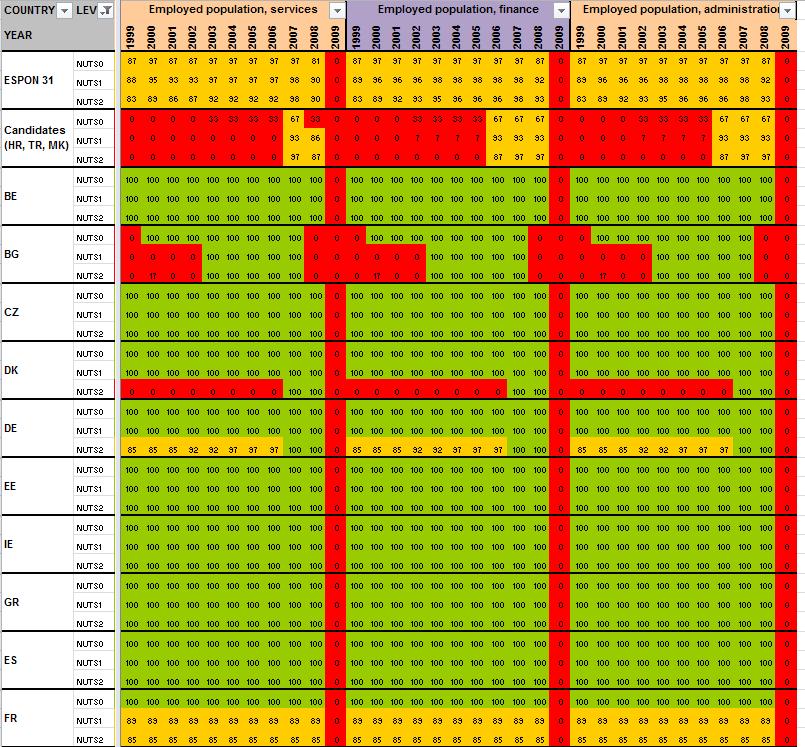
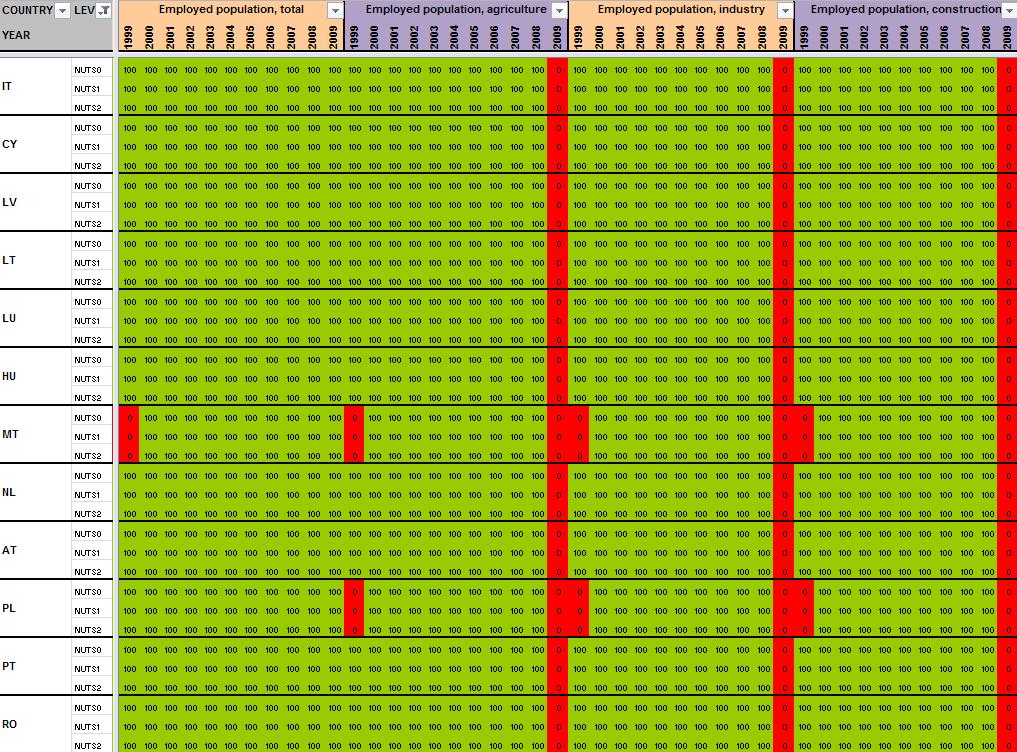
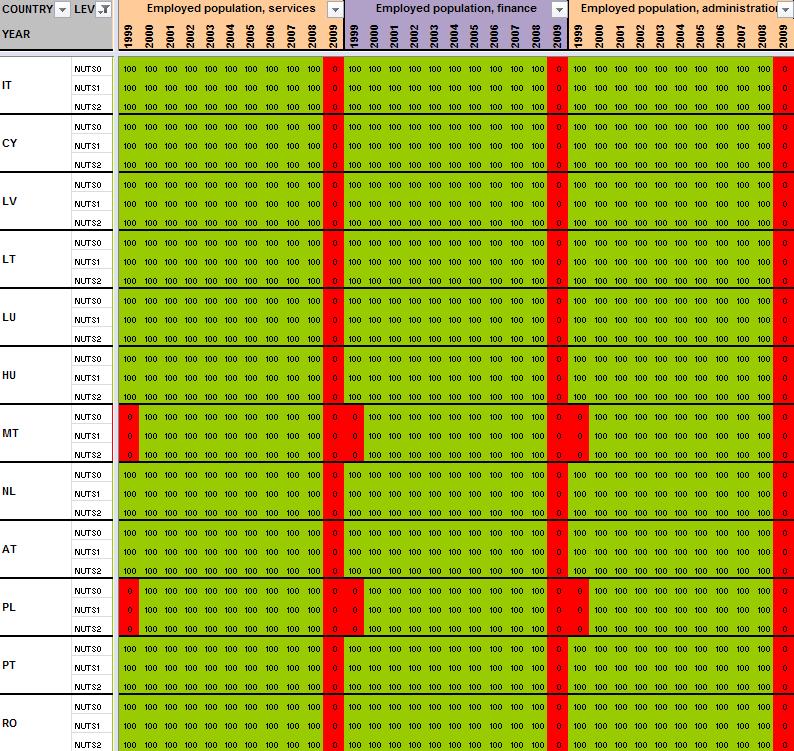
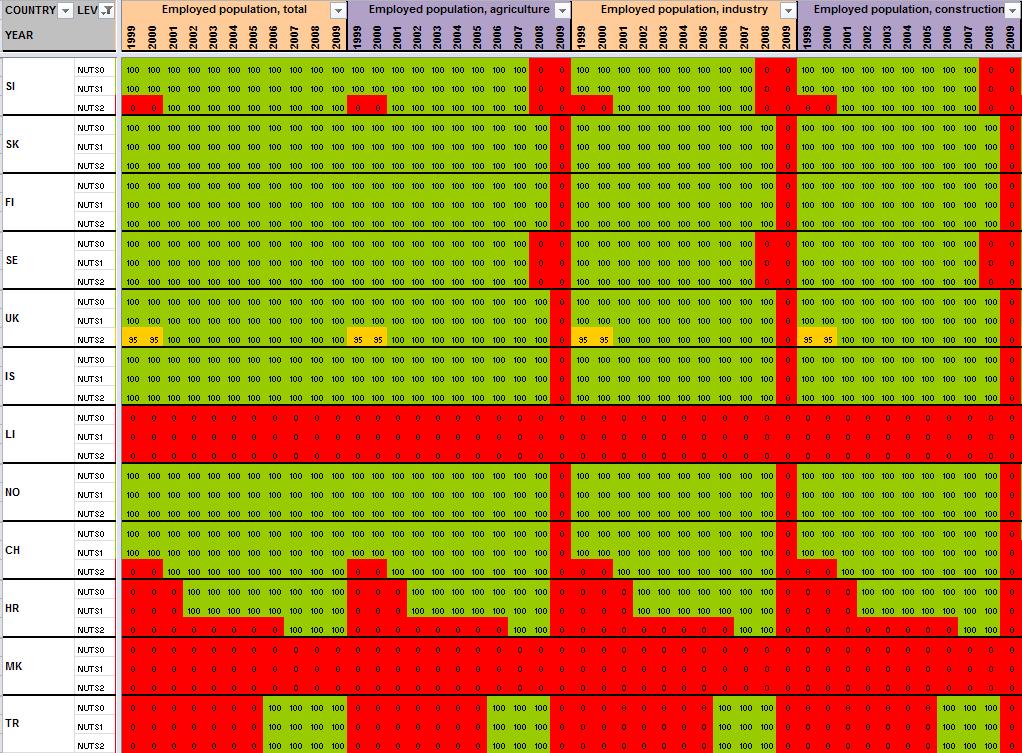
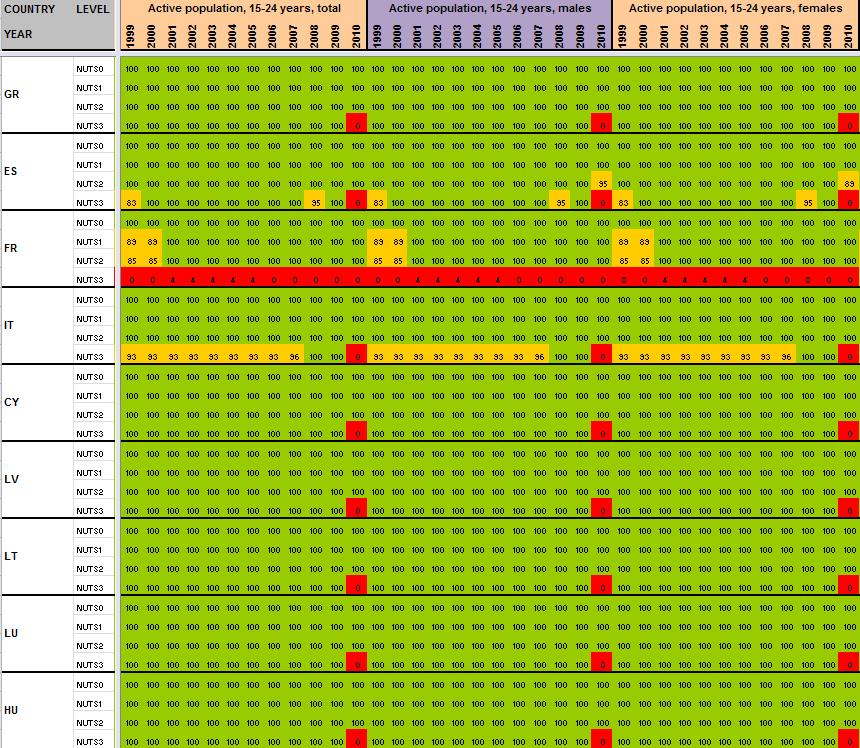
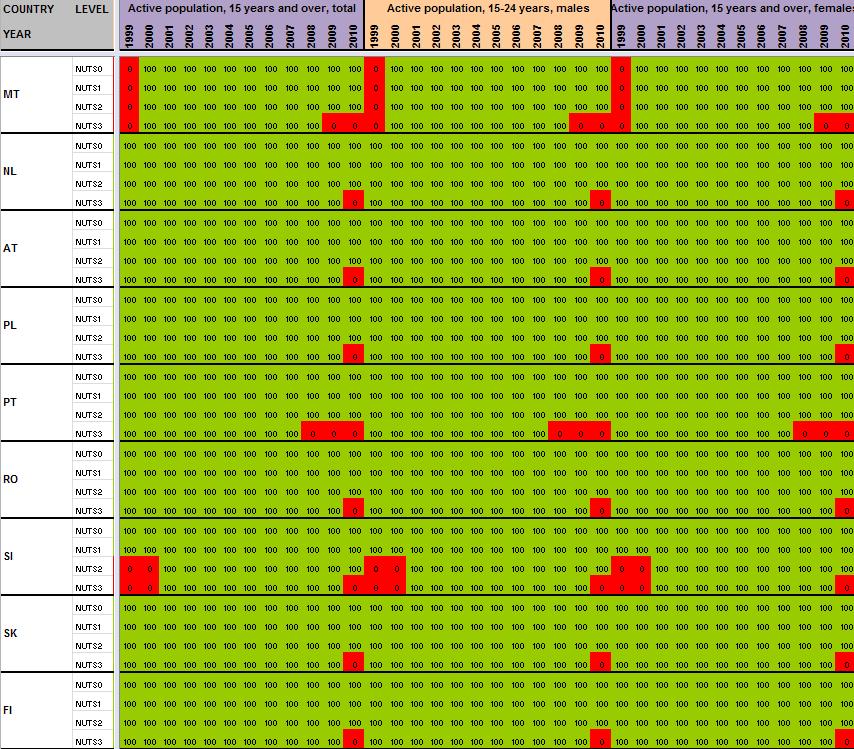
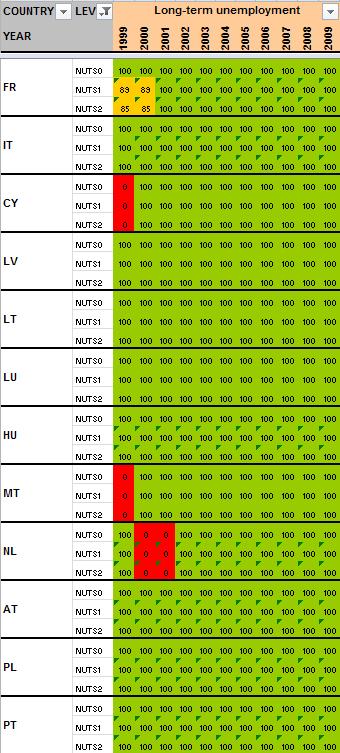
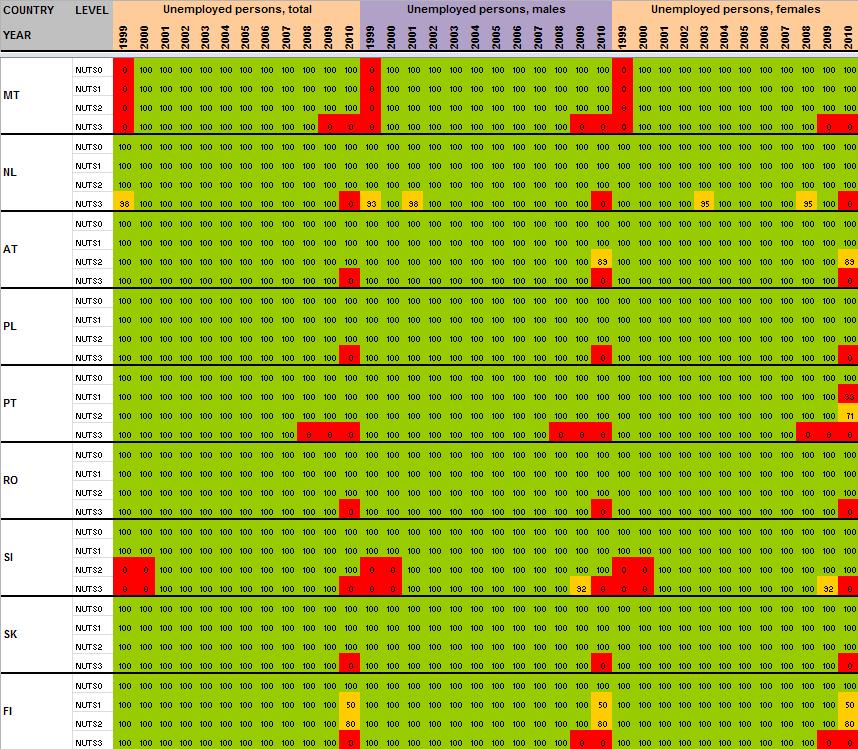
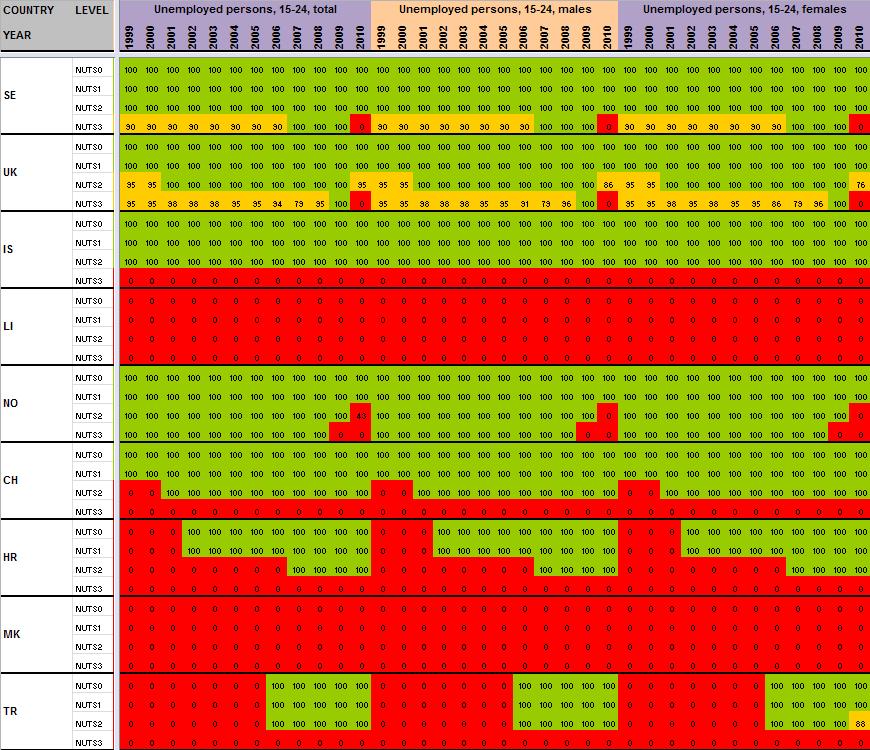
29 Annexe 1 Data availability in Eurostat tables Situation in September 2011 (note: some tables from Eurostat have been updated since that time). A.Table demo_r_gind B.Table demo_r_birth_deaths_n C.Table demo_r_d2jan D.Table demo_r_d3avg E.Table educ_renrlrg F.Table lfst_r_lfe2en G.Table lfst_r_lfe2en H.Table lfst_r_lfp3pop I.Table lfst_r_lfu2ltu J.Table lfst_r_lfu3pers K.Table nama_r_e3empl L.Table nama_r_e3gdp M.Table nama_r_e3vabp
30 A. Table demo_r_gind3 29

31 30


32 B. Table demo_r_birth_deaths_n3 31

33 32
34 C. Table demo_r_d2jan 33
35 34

36 35

37 D. Table demo_r_d3avg 36

38 37


39 E. Table educ_renrlrg1 38


40 39


41 Note : UKM = NUTS 2003 version 40
42 F. Table lfst_r_lfe2en1 41
43 42

44 43
45 G. Table lfst_r_lfe2en2 44
46 45
47 H. Table lfst_r_lfp3pop 46

48 47
49 48
50 49

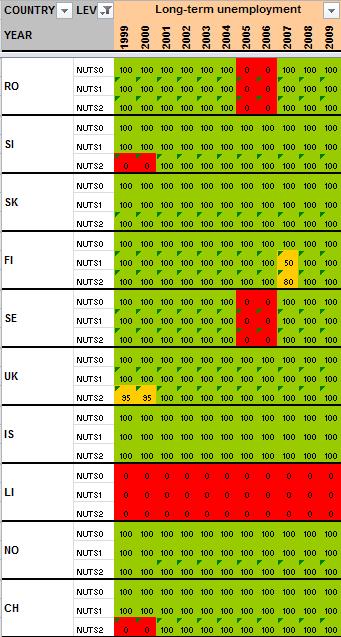

51 I. Table lfst_r_lfu2ltu 50
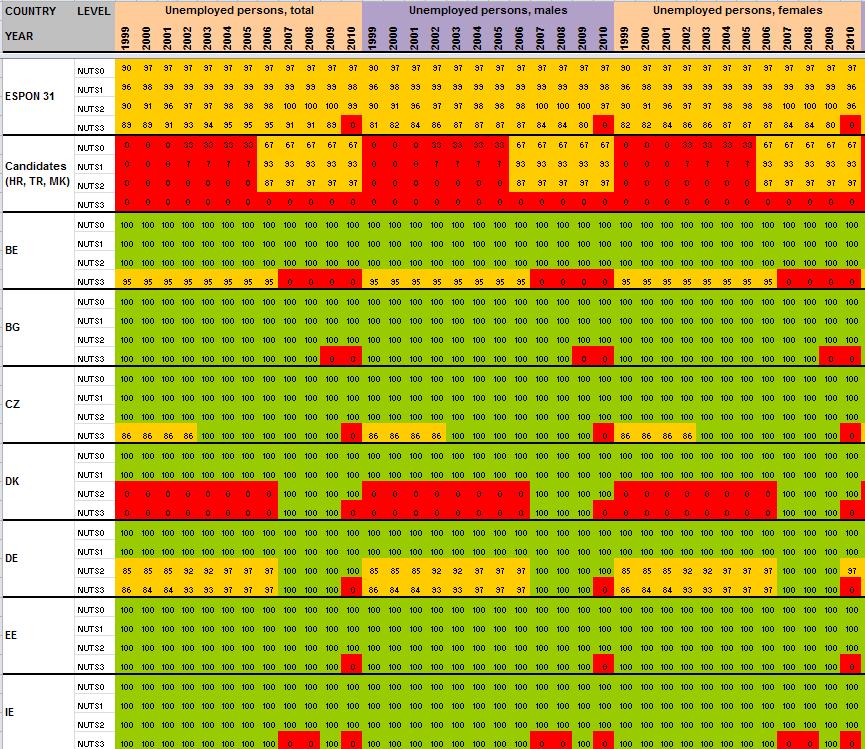

52 J. Table lfst_r_lfu3pers 51
53 52


54 53


55 54
56 55
57 K. Table nama_r_e3empl95 56

58 57


59 58


60 59

61 60
62 61
63 L. Table nama_r_e3gdp 62

64 63

65 M. Table nama_r_e3vabp95 64

66 65


67 66

68 67
69 68
70 69

71 Annexe 2 Towards a dictionary of estimation methods for missing values? Working paper NOTE: This documentation is provisional and will be improved thanks to feedbacks of persons trying to use this methodological paper. 70
72 Table of content Forewords Steps to follow quick overview The ESTI Framework and ESPON metadata One dimensional estimations methods Estimation based on the space dimension (E) E1 - Deduction with available values at the same and an upper hierarchical level E2 - Deduction with available values at a lower hierarchical level (average of children) E3 - Approximation with available values at a lower, a same and an upper hierarchical level (min-max) E4 - Approximation with available values at a same hierarchical level Specificities of the source dimension (S) Estimation based on the time dimension (T) T1 - Interpolation, 1-1 method (where t-1<t<t+1) T2 - Interpolation, n-n method (where t-n<t-1<t<t+1<t+n) T3 - Retrospective method (where t<t+1<t+n) T4 - Prospective method (where t-n<t-1<t) Estimation based on the thematic dimension (I) I1 - Deduction coming from indicators thematically coherent (sum, subtraction) I2 - Proxy coming from indicators thematically coherent (sum, subtraction) I3 - Estimation by using bivariate or multivariate regression Multidimensional estimations methods Estimation based on the source and spatial dimensions (SE) SE1 Estimation using other data sources and space harmonization Estimation based on the space and time dimensions (TE) TE1 - Retropolation and space harmonization TE2 - Extrapolation and space harmonization TE3 - Interpolation and space harmonization evolution method TE4 - Interpolation and space harmonization distribution method TE5 - Interpolation/retropolation and space harmonization based on distribution method TE6 Retropolation/extrapolation and space harmonization based on distribution method with available values at the same hierarchical level TE7 - Interpolation/retropolation and space harmonization based on distribution method with available values at the same hierarchical level
73 FOREWORDS The process of data collection / estimation is strongly linked to the development of the core database, which has the following properties: The core database properties Stock only count data / no ratios Collect systematically data for all the NUTS levels Data collected for NUTS3 if possible/available Coherence of hierarchies Eurostat is considered as a primary source for data collection. No changes on Eurostat data, unless identified error. No missing data. Targeted time-period: (yearly) for primary stocks: GDP, population, area and (yearly) for sub-components of primary stocks (cf below). Targeted space of analysis: ESPON Area + Candidate Countries The targeted indicators Basic 1: Population ( ) Sub-components ( ): death, birth, migration, by age and sex (5 years age-class), active population (by sex), unemployed population (by sex and age), employed population (by economic branch), long-term unemployment, education level of the population. Basic 2: Money (GDP euros & PPS, ) Sub-components ( ): GVA by economic branch, income Basic 3: Area ( ) Sub-components ( ): By type (Corine Land Cover) Main information sources Eurostat (primary source) NewCronos database (historical Eurostat database NUTS 1999 version) National Statistical institutes United Nations databases (UNEP, UNPP) OECD database European DGs databases (DG AGRI ) Estimations (cf below) 72

 for the information contained in the Eurostat table (cf part 1.2 for more information). ESPON Source metadata template d.")
74 STEPS TO FOLLOW QUICK OVERVIEW a. Download data from Eurostat and transform it in the data model The following tables have been downloaded from Eurostat (September 2011). They contains all the targeted count indicators. List of tables downladed from Eurostat b. Transformation of the Eurostat tables into the ESPON data template. The table should contain both NUTS0, NUTS1, NUTS2 and NUTS3 data values (1927 territorial units in the NUTS 2006 division). ESPON Data template c. Fulfillment of metadata as below (source sheet) for the information contained in the Eurostat table (cf part 1.2 for more information). ESPON Source metadata template d. Completion of missing values thanks to the ESTI framework. A couple of solutions are proposed in this document. e. Immediately after each estimation, fulfill the source sheet of the metadata template. 73
75 The ESTI Framework and ESPON metadata All the development below is largely inspired from the Data Navigator 2 framework produced within the ESPON Project 3.2 (2007). The document proposes to formalize estimation methods by using the spatial (e), source (s), temporal (t), and thematic (i) dimensions: Background - The ESTI framework Data in the LTDB can therefore be characterized according to four dimensions E, S, T and I where: (E) represents the spatial dimension and refers to one or several territorial units; (S) represents the source dimension and refers to one or several organism of statistics; (T) represents the time dimension and refers to one or several instants or/and periods (I) represents the thematic dimension and refers to one or several indicators. For instance, the value could be the result of a query concerning the dimension I and where: E= Austria S= EUROSTAT T= 1999 I= Area in km2. Although the query is answered a lot of implicit assumptions are made here: - Regarding the E dimension, the query is supposed to refer to the territorial unit whose shape corresponds to the official delimitation of Austria. - Regarding the T dimension, the value returned corresponds to the value provided by the EUROSTAT for the period ranging from 01/01/99 to 31/12/99. - Regarding the I dimension, areas of lakes and rivers in Austria are supposed to be included In the previous example, a value is returned for the corresponding value of E, S, T and I, namely the tuple ( Austria, EUROSTAT, 1999, Area in km2 ). It should be noted that values of E, S, T or I, or a combination of them might be missing when formulating the query. By default, such a missing value in one or more dimensions handled by the query, should be considered equivalent to a wildcard operator * meaning all values. However, unavoidable incompleteness in the LTDB will lead to unanswered queries. This occurs when, no value is present in the LTDB, for a given tuple of values (included wildcard * ). The objective is to overcome this case of missing value by proposing one or several estimation methods in order to compute the more probable (although not measured or sure) value and return it as an answer to the query. LTDB users should be warned when the returned value is a computed estimated value replacing a missing one. Then, information in the LTDB (that is the future database implanting the data model presented in Figure 7) can be represented as a fourdimensional hypercube (the ESTI framework) with holes corresponding to missing values. Estimation methods help in filling-up these holes by considering information provided by the neighborhood of these holes. We present the main principles of the estimation methods which could be implemented as procedures together with the future LTDB. Then we describe why and how the model could moreover allow the elaboration of quality control procedures. Background - The ESTI framework for estimating missing values Let X(e,s,t,i) be a value, possibly missing (not known or not defined) where e describes one territorial unit, s describes one source, t describes one instant, and i describes one indicator. For the sake of simplicity, only this elementary case is considered here. However, it can be shown that more complex cases, where e,s,t, and i are each described by set of values, can be decomposed in elementary ones. For a missing value X(e,s,t,i), estimation methods exploit known values X(e,s,t,i ) in the neighbourhood of X(e,s,t,i). This neighbourhood can be defined according to one or more dimension among E, S, T and I. Some one and two-dimensional estimation methods are described. Let child be the operator which, for a spatial unit e, returns the set of all the spatial units e1,e2,,en which are spatially included in e, at the first level of spatial inclusion. Let parent be the operator which, for a spatial unit e, returns the spatial units p which includes e, at the first level of spatial inclusion. ESPON 3.2, 2007, Data navigator 2, Final Report, Part1 Handbook for data collection, p.51 These dimensions can be combined together, and provide indeed various methods for estimating missing values in a dataset. 74
76 As regard to this background, the aim of this document is double: - Formalize procedures of data estimations as regard to regular concrete situations. We try systematically to explain step by step the methodology employed for estimating data by using the ESTI terminology. - Provide information for fulfilling correctly the ESPON metadata in that order. At the end, it is possible to find some concrete applications to the results of this document, linked to the improvements of the ESPON metadata model: 1. Harmonize the metadata of the source information: for the moment there are too many different descriptions of data estimations in the ESPON metadata. 2. Definition of intelligent labels for estimated data, which allow to understand directly in the dataset (without looking in the metadata) which estimation method has been used for estimating the data. 3. For the most common estimation methods (presented below), find an harmonized way to describe the methodology (which is currently developed in a free text mode). 4. After having inventoried the most current estimation methods, we can imagine in the next steps to implement it in a computer model to make possible the development of an automatic tool for estimating missing data. 75
 is known, in order to obtain information on the missing value.")
77 One dimensional estimations methods Estimation based on the space dimension (E) In this case, for a missing value X(e,s,t,i), s,t,and i being fixed, the idea is to use spatial units e being at an upper, lower or same hierarchical spatial level as e, and for which X(e,s,t,i) is known, in order to obtain information on the missing value. 76
78 Name Conditions of use E1 - Deduction with available values at the same and an upper hierarchical level If X(parent(e),s,t,i) is known and if X(e,s,t,i) is known for all e so that parent(e ) = parent(e) and e e (e is at the same hierarchical level as e and has the same parent as e) SPACE DIMENSION (E) Graphics illustration Level n? Level n+1 Textual explanation Estimation based on the space dimension (E) The value is estimated by subtracting the value available at an upper hierarchical level by the sum of units having the same hierarchical level and the same parent than the value estimated. Mathematic formalization Example HOW TO PROCEED? (1) Sum the values of the children (e ) (2) Subtract the value of the sum of children to the parent unit (e) 77
 Graphics illustration Level n-1 Level n?")
79 Name Conditions of use E2 - Deduction with available values at a lower hierarchical level (average of children) If e is so that e = parent (e ) and X (e, s, t, i) is defined All the children of the value to estimate are known SPACE DIMENSION (E) Graphics illustration Level n-1 Level n? Textual explanation Estimation based on the space dimension (E) Sum/average of the values available at a lower hierarchical level. Mathematic formalization Example HOW TO PROCEED? (1) Sum the value of the children (be careful, only true for count data) 78
 = parent(e) and e e (e is at the same hierarchical level as e and has the same parent as e),")
 The value is estimated by putting in relation the maximum and the")

80 Name Conditions of use E3 - Approximation with available values at a lower, a same and an upper hierarchical level (min-max) If X(parent(e),s,t,i) is known and if there exists at least one e so that parent(e ) = parent(e) and e e (e is at the same hierarchical level as e and has the same parent as e), and X(e,s,t,i) is not defined then three methods can be used. Graphics illustration Textual explanation Estimation based on the space dimension (E) The value is estimated by putting in relation the maximum and the minimum values possible thanks to available information at the upper (n+1), the same (n), and lower (n-1) hierarchical levels. Mathematic formalization Example HOW TO PROCEED? (1) Estimate the maximum value possible thanks to the parent unit value and the available values of the units of the same hierarchy (e ) (2) Estimate the minimum value possible thanks to the chidren (e ) (3) (Min+Max)/2 79

 Average of the values of spatial units of the same hierarchical level.")
81 Name Conditions of use E4 - Approximation with available values at a same hierarchical level If e so that parent (e ) = parent (e) and e e and X(e,s,t,i) is defined Have values for other units at a same hierarchical level Have a statistical distribution relatively homogeneous between the other units of a same hierarchical level SPACE DIMENSION (E) Graphics illustration Level n-1? Level n? Textual explanation Estimation based on the space dimension (E) Average of the values of spatial units of the same hierarchical level. Mathematic formalization Example HOW TO PROCEED? (1) Average of the values of spatial units of the same hierarchical level 80
")
82 Specificities of the source dimension (S) 81
. In that order, they cannot be considered as primary sources in a methodological point of view.")
83 Data available from Eurostat or National Statistical Institutes are delivered after a long process of data creation (individual censuses, aggregation, harmonization at European using various methodologies). In that order, they cannot be considered as primary sources in a methodological point of view. However, it is difficult to obtain and synthesize all the steps of data creation in the methodological field of the source part of the ESPON metadata model. We consider indeed that this kind of information is not estimated (a). This is the reason why the strategy of source completion has been defined as below: - For European data at regional level, the most common source is Eurostat, who deliver official data for the European Community. Considering that this statistical organization makes available new tables and updates regularly, it is very important to mention systematically the date of the creation of the table (1) and the name of the table (2). - If data comes from Eurostat, the label can for instance begin by 1 (which can be developed in 1a, 1b, 1c if the dataset contains different Eurostat tables or updates). Label 1a, 1b, 1c Date 17/12/2010 (1) Copyright Eurostat Provider Name: Eurostat URI: Publication Title: [Let this cell empty] URI: [Let this cell empty] Reference: [Let this cell empty] Methodology Table demo_r_d3natmo (2) Access rule Public Estimation False (a) Quality High ESPON metadata model (source part) Eurostat table (2) (1) The missing value in Eurostat tables could be completed by alternative sources, like information coming from National Statistical Institutes, United Nations, OCDE and so on. In this case, the information can be obtained through various formats: Statistical books, my country in focus format, information downloaded from the NSI website directly. When using this kind of information, the idea consists to fulfill as precise as possible the metadata template and save (if possible) the table or the document downloaded in a dedicated space by mentioning the name of the file. Some basic rules have to be followed: (1) The date corresponds to the date of publication of the report. If the data comes from the web page, mention the date of download (2) Mention systemically name, URI (home web page) and copyrights of the source used. (3) If the data comes from a publication, mention the title of the publication, its reference (web address or ISSN if not available) and if possible the page where the information has been downloaded. (4) If there is precision on the data (e.g. resident population estimated the 31th March 2000, mention it in the methodology field). (5) The data quality depends on the nature of the data (exhaustive census? Surveys?) but basically will be medium or high. 82
84 Label 7a (1) Date 01/12/2010 (2) Copyright 2006 Republic of Croatia Croatian Bureau of Statistics (3) Provider Name: Croatian Bureau of Statistics (3) URI: (3) Publication Title: Statistical Yearbook 2010 of the Republic of the Republic of Croatia (4) URI: ISSN (4) Reference: page 108 Methodology Mid-year estimate Access rule False (a) Estimation true Quality High ESPON metadata model with National Statistical Institute source 83
85 Estimation based on the time dimension (T) Various time interpolation methods using linear or non-linear assumption, prospective or retrospective computations of tendency can be used. Three of them are described here. The idea here is to estimate the missing value X(e,s,t,i) by using two known values X(e,s,t1,i) and X(e,s,t2,i), who t1 and t2 are placed in time after or before t. 84
.")
 [linear/power] interpolation.")
86 Name Conditions of use T1 - Interpolation, 1-1 method (where t-1<t<t+1) If X(e,s,t-1,i) and X(e,s,t+1,i) are known Have other values at the same hierarchical level at t-1 and t+1 Don t have too much statistical breakdown in the temporal serie (adapted for territorial units who have more or less a linear evolution). Do not have any information at a upper level in the hierarchy (parent(x)) TIME DIMENSION (T) Graphics illustration T-1 T? T+1 Textual explanation Estimation based on the time dimension (T) [linear/power] interpolation. This method uses the two closest neighbours placed in time before ([mention the year of reference]) and after ([mention the year of reference]) the value estimated. Linear model Mathematic formalization Power model Example HOW TO PROCEED? For the linear model (1), put the following formula in the table cell: =value(2000)+((value (2002)- value(2000))/( ))*( ) For the power model (2) put the following formula in the table cell: value(2000)*((value(2002)/value(2000))^(( )/( ))) 85

87 Name Conditions of use T2 - Interpolation, n-n method (where t-n<t-1<t<t+1<t+n) If X(e,s,t-1,i), X(e,s,t-n,i), X(e,s,t+1,i) and X(e,s,t+n,i) are known. Have other values at the same hierarchical level at t-1, t-n, t+1 and t+1 Method more adapted to temporal series characterized by statistical breakdowns. Do not have any information at a upper level in the hierarchy (parent(x)) TIME DIMENSION (T) Graphics illustration T-N T-1 T? T+1 T+N Textual explanation Estimation based on the time dimension (T) [linear/power] interpolation. This method uses the closest neighbours placed in time before ([mention the years of reference]) and after ([mention the years of reference]) the value estimated (average value on the time period. Linear model Power model Mathematic formalization Where ; And Example HOW TO PROCEED? (1) Estimate the average time period for t-1 t-n (2) Estimate the average time period for t+1 t+n (3) Calculation of the average for the X(e,s,t-1,i) X(e,s,t-n,i) values (4) Calculation of the average for the X(e,s,t+1,i) X(e,s,t+n,i) values (5) Estimation thanks a linear model, following the same logical than T1 method (6) Estimation thanks a power model, following the same logical than T1 method 86
) With the linear model, it is possible to obtain negative value after estimation.")
, it is better to use an exponential model, which exclude automatically negative values in the results of the estimation Do not have any information at a upper level in the hierarchy")
88 Name Conditions of use T3 - Retrospective method (where t<t+1<t+n) If X(e,s,t+1,i) and X(e,s,t+n,i) are known Have other values at the same hierarchical level at t+1 and t+n Don t have too much statistical breakdown in the temporal serie. Do not have any information at a upper level in the hierarchy (parent(x)) With the linear model, it is possible to obtain negative value after estimation. For most of indicators (e.g. population), it is better to use an exponential model, which exclude automatically negative values in the results of the estimation Do not have any information at a upper level in the hierarchy (parent(x)) Graphics illustration T? TIME DIMENSION (T) T+1 T+N Textual explanation Estimation based on the time dimension (T) [linear/power] retropolation. This method uses the two closest neighbours placed in time after ([mention the two years of reference]) the value estimated. Linear model Mathematic formalization Power model Example HOW TO PROCEED? For the linear model (1) and in this case, put the following formula in the table cell for estimating the 1990 value: =value(2005) ((value(2010) value(2005))/(( )*( )) For the power model (2) and in this case, put the following formula in the table cell for estimating the 1990 value: = value(2005)*((value(2010)/value2005)^(( )/( )) 87
.")
 [linear/power] extrapolation.")
![This method uses the two closest neighbours placed in time before ([mention the two years of reference]) the value estimated. Linear model Power model Example HOW TO PROCEED?](/docs-images/72/67143342/images/89-2.jpg "For the linear model (1) and in this case, put the following formula in the table cell for estimating the 1990 value: =value(2010) + ((value(2010) value(2005))/(2010-2005))*(2040-2010) For the power")
89 Name Conditions of use T4 - Prospective method (where t-n<t-1<t) If X(e,s,t-1,i) and X(e,s,t-n,i) are known Have other values at the same hierarchical level at least at t-1 and t-n Don t have too much statistical breakdown in the temporal serie. With the exponential model, it is possible to obtain very high values when the estimation is made for a long time-period (e.g. projection of population). Do not have any information at a upper level in the hierarchy (parent(x)) TIME DIMENSION (T) Graphics illustration T-N T-1 T? Textual explanation Mathematic formalization Estimation based on the time dimension (T) [linear/power] extrapolation. This method uses the two closest neighbours placed in time before ([mention the two years of reference]) the value estimated. Linear model Power model Example HOW TO PROCEED? For the linear model (1) and in this case, put the following formula in the table cell for estimating the 1990 value: =value(2010) + ((value(2010) value(2005))/( ))*( ) For the power model (2) and in this case, put the following formula in the table cell for estimating the 2040 value: =value(2010)*(value(2010)/value(2005))^(( )/( ))) 88
 where i is another indicator. X(e,s,t,i) = α (e,s,t,i ) where α is a correlation factor empirically fixed.")
90 Estimation based on the thematic dimension (I) The idea is to replace the missing value X(e,s,t,i) by a known value X(e,s,t,i ) where i is another indicator. X(e,s,t,i) = α (e,s,t,i ) where α is a correlation factor empirically fixed. 89
91 Name Conditions of use I1 - Deduction coming from indicators thematically coherent (sum, subtraction) If X(e,s,t,i) and X(e,s,t,i ) are components a contingency table and X(e,s,t,i+1) where i+1 is the sum of a indicators of the contingency table and i are known No data for one dimension of the contingency table (i). Data available for the other dimension of the contingency table (i ) Sum of the contingency table available (i+1) THEMATIC DIMENSION (I) I I+1 Graphics illustration? Textual explanation Estimation based on thematic dimension (I) The values have been deducted by subtracting the total of a contingency table by the sum of the different indicators available in this contingency table. Mathematic formalization Example HOW TO PROCEED? (1) Sum the data available for the other dimensions of the contingency table (i ) (2) Subtract the total of the contingency table (I) by the sum of the other dimensions of the table (i ) 90
 into several ones n*x(e,s,t,i) X(e,s,t,i ) is known The user know in how")
 The indicator [name of the indicator] has been")
![split into [n] indicators [name of the indicators] by a division process. where n is the number of indicators required. Example HOW TO PROCEED?](/docs-images/72/67143342/images/92-3.jpg "(1) Define the targeted indicators for the split operation X(e,s,t,i ) (2) Define in how many indicators the operation should be made (3) Divide")
92 Name Conditions of use I2 - Proxy coming from indicators thematically coherent (sum, subtraction) If X(e,s,t,i ) is a known component of a contingency table and the aim of the estimation is to split X(e,s,t,i ) into several ones n*x(e,s,t,i) X(e,s,t,i ) is known The user know in how many indicators he want to split X(e,s,t,i ) THEMATIC DIMENSION (I) Graphics illustration I'? I? Textual explanation Mathematic formalization Estimation based on thematic dimension (I) The indicator [name of the indicator] has been split into [n] indicators [name of the indicators] by a division process. where n is the number of indicators required. Example HOW TO PROCEED? (1) Define the targeted indicators for the split operation X(e,s,t,i ) (2) Define in how many indicators the operation should be made (3) Divide the stock of X(e,s,t,i ) by the number of classes required 91
 I' I Graphics illustration CORR.")
] and [mention the names of the other indicators of the regression]. The significance of the model has been carefully checked. Mathematic formalization Example HOW TO PROCEED?")
 In case of multivariate regression, evaluate the influence of the indicators in the model (globally and individually). (4) Detect observations who can influence the result (residuals).")
93 Name Conditions of use I3 - Estimation by using bivariate or multivariate regression If, is statistically correlated with, and : significance and correlation, and are known Understand the significance of the relation between i and i THEMATIC DIMENSION (I) I' I Graphics illustration CORR.? Textual explanation Estimation based on thematic dimension (I) The value has been deducted from the parameters of a regression model putting in relation [mention the name of the indicator X(e,s,t,i)] and [mention the names of the other indicators of the regression]. The significance of the model has been carefully checked. Mathematic formalization Example HOW TO PROCEED? (1) Estimate parameters by using known observations and evaluate their precision. (2) Evaluate the R-Square and the significance of the model. (3) In case of multivariate regression, evaluate the influence of the indicators in the model (globally and individually). (4) Detect observations who can influence the result (residuals). (5) If (1), (2), (3) and (4) proves that the statistical relation exists, estimate X(e,s,t,i) thanks to the parameters calculated by the regression. 92

94 Multidimensional estimations methods Multi-dimensional estimation methods are results from the combination of two or more onedimensional methods. Generally they are more accurate and capitalize on more information. Estimation based on the source and spatial dimensions (SE) Alternative sources of information can be used when the main source does not provide the targeted information. The idea here is to replace the missing value X(e,s,t,i) by a known value X(e,s,t,i) where s is another organism of statistics. However, it is very important that the values coming from another statistics provider fits correctly with the values and the hierarchy of the primary source. This is the reason why it is important to operate a space harmonization in a second step. In that order, X(parent(e),s,t,i) = X (parent(e),s,t,i) by defining a correlation factor α depending of the deviation between X(parent(e),s,t,i) and X(parent(e),s,t,i). 93
,s,t,i) Data at lower level of the hierarchy available from another organism of statistics X(e,s,t,i) SPACE DIMENSION (E) Graphics")
 The values have been collected from [name of the organism of statistics], then,")
95 SOURCE DIMENSION (S) Source 1' Source 1 Name Conditions of use SE1 Estimation using other data sources and space harmonization No data at lower level of the hierarchy in X(e,s,t,i). Information available at a upper level of the hierarchy X,((parent(e),s,t,i) Data at lower level of the hierarchy available from another organism of statistics X(e,s,t,i) SPACE DIMENSION (E) Graphics illustration Level n???? Level n+1 Textual explanation Mathematic formalization Estimation based on source and space dimension (S, E) The values have been collected from [name of the organism of statistics], then, adjusted by ESPON M4D Project in a way that the sum of the values of the children units (e1, e2 en) are equal to the value of the parent unit (e) In this case, [name of the hierarchy, e.g. NUTS3] values coming from [name of the organism of statistics of X(e,s,t,i)] is adjusted to the [name of the hierarchy, e.g. NUTS0] values delivered by [Name of the organism of statistics of X(e,s,t,i), e.g. generally Eurostat] where Example HOW TO PROCEED? (1) Download data at lower level from another organism of statistics (s ). (2) Save the table downloaded from (s ) in a dedicated space (s ) (3) Merge (s) and (s ) in the same table (4) Sum the values coming from (s ) of the childs (e1,e2,..en) available in s for its parent (e) Ex: if the data is available at NUTS2 level for Eurostat data, aggregate the NUTS3 coming from the other organism of statistics in NUTS2. (5) Calculate the deviation (α) by dividing X(parent(e),s,t,i) and X(parent(e),s,t,i). (6) Use the deviation calculated above as correlation factor: X(e,s,t,i) = α X(e,s,t,i) (7) Check if the sum of the estimation at lower level is equal to the to the value delivered by Eurostat at upper level In ESPON tables: Estimation of population in Scotland and Northern Ireland from 2001 to 2006, where NUTS3 values are missing and NUTS0 is available. 94
, but this information is available at t only for parent units X(parent(e),s,t,i) and/or for some units of the same hierarchical level (X(e,s,t,i).")
96 Estimation based on the space and time dimensions (TE) In Eurostat tables, the following situation occurs very often: it is possible to have information at t1 or t2 for units at the lower hierarchical level X(e,s,t1,i), but this information is available at t only for parent units X(parent(e),s,t,i) and/or for some units of the same hierarchical level (X(e,s,t,i). There is potentially an infinity of situations and solutions but we can formalize some concrete examples of configurations with dedicated solutions correctly documented. 95
) Data at lower level available at T+1and T+N TIME DIMENSION (T) T T+1 T+N Graphics illustration?")
![??? Textual explanation Estimation based on the time and space dimensions (ET) 1/ Time dimension - [linear/power] retropolation.](/docs-images/72/67143342/images/97-1.jpg "This method uses the two closest neighbours placed in time after ([mention the two years of reference]) the value estimated.")
97 SPACE DIMENSION (E) Level n Level n+1 Name Conditions of use TE1 - Retropolation and space harmonization No data at lower level of the hierarchy at T. Information available at a upper level of the hierarchy at T (parent(e)) Data at lower level available at T+1and T+N TIME DIMENSION (T) T T+1 T+N Graphics illustration???? Textual explanation Estimation based on the time and space dimensions (ET) 1/ Time dimension - [linear/power] retropolation. This method uses the two closest neighbours placed in time after ([mention the two years of reference]) the value estimated. 2/ Space dimension The estimated values have been adjusted in a way that the sum of values of children units (e1,e2 en) are equal to the value of the parent unit (parent(e1,e2..en)). In this case, the [mention the lower level, e.g.] NUTS3 values coming from the estimation are adjusted to [mention the upper level, e.g. NUTS0 value]. Linear model Mathematic formalization Power model where and Example HOW TO PROCEED? (1) Estimate the evolution at T thanks to available information at lower level at T+1 and T+N. ( cf estimation method T3, p.16) (2) Calculate the sum of (1) for the units of the same hierarchy (e ) in order to have value the of X(parent(e),s,t,i) (3) Estimate the deviation between X(parent(e),s,t,i) and X parent(e),s,t,i) (4) Multiplicate the value of the deviation (3) by the temporal estimation (1) (5) Check if the sum of values estimated is equal to the value delivered at upper level. 96
) Data at lower level available at T-1and T-N TIME DIMENSION (T) T-N T-1 T Graphics illustration?")
![??? Textual explanation Estimation based on the time and space dimensions (ET) 1/ Time dimension - [linear/power] extrapolation.](/docs-images/72/67143342/images/98-1.jpg "This method uses the two closest neighbours placed in time before ([mention the two years of reference]) the value estimated.")
98 SPACE DIMENSION (E) Level n Level n+1 Name Conditions of use TE2 - Extrapolation and space harmonization No data at lower level of the hierarchy at T. Information available at a upper level of the hierarchy at T (parent(e)) Data at lower level available at T-1and T-N TIME DIMENSION (T) T-N T-1 T Graphics illustration???? Textual explanation Estimation based on the time and space dimensions (ET) 1/ Time dimension - [linear/power] extrapolation. This method uses the two closest neighbours placed in time before ([mention the two years of reference]) the value estimated. 2/ Space dimension The estimated values have been adjusted in a way that the sum of values of children units (e1,e2 en) are equal to the value of the parent unit (parent(e1,e2..en)). In this case, the [mention the lower level, e.g.] NUTS3 values coming from the estimation are adjusted to [mention the upper level, e.g. NUTS0 value]. Linear model Mathematic formalization Power model where and Example HOW TO PROCEED? (1) Estimate the evolution at T thanks to available information at lower level at T+1 and T+N. ( cf estimation method T4, p.17, here the power model has been used) (2) Calculate the sum of (1) for the units of the same hierarchy (e ) in order to have value the of X(parent(e),s,t,i) (3) Estimate the deviation between X(parent(e),s,t,i) and X parent(e),s,t,i) (4) Multiplicate the value of the deviation (3) by the temporal estimation (1) (5) Check if the sum of values estimated is equal to the value delivered at upper level. 97
). Data at lower level available at T-1and T+1. TIME DIMENSION (T) T-N T-1 T Graphics illustration ²?")
99 SPACE DIMENSION (E) Level n Level n+1 Name Conditions of use TE3 - Interpolation and space harmonization evolution method No data at lower level of the hierarchy at T. Information available at a upper level of the hierarchy at T (parent(e)). Data at lower level available at T-1and T+1. TIME DIMENSION (T) T-N T-1 T Graphics illustration ²???? Textual explanation Estimation based on the time and space dimensions (ET) 1/ Time dimension - [linear/power] interpolation. This method uses the two closest neighbours placed in time before and after ([mention the two years of reference]) the value estimated. 2/ Space dimension The estimated values have been adjusted in a way that the sum of values of children units (e1,e2 en) are equal to the value of the parent unit (parent(e1,e2..en)). In this case, the [mention the lower level, e.g.] NUTS3 values coming from the estimation are adjusted to [mention the upper level, e.g. NUTS0 value]. Linear model Mathematic formalization Power model where and Example HOW TO PROCEED? (1) Estimate the evolution at T thanks to available information at lower level at T-1 and T+1. ( cf estimation method T1, p.14, here the power model has been used). (2) Calculate the sum of (1) for the units of the same hierarchy (e ) in order to have value the of X(parent(e),s,t,i). (3) Estimate the deviation between X(parent(e),s,t,i) and X parent(e),s,t,i). (4) Multiplicate the value of the deviation (3) by the temporal estimation (1). (5) Check if the sum of values estimated is equal to the value delivered at upper level. 98
). Data at lower level available at T-1and T+1. TIME DIMENSION (T) T-N T-1 T Graphics illustration?")
100 SPACE DIMENSION (E) Level n Level n+1 Name Conditions of use TE4 - Interpolation and space harmonization distribution method No data at lower level of the hierarchy at T. Information available at a upper level of the hierarchy at T (parent(e)). Data at lower level available at T-1and T+1. TIME DIMENSION (T) T-N T-1 T Graphics illustration???? Textual explanation Mathematic formalization Estimation based on the time and space dimensions (ET) 1/ Space/time dimension: Calculation of the share of the unit as regard to a given upper level of belonging [mention the hierarchical level, e.g. NUTS0] placed in time before and after the estimated value [mention the years]. 2/ Average of the share of units (share of the unit before and the share of the unit after the estimated value) 2/ Time/space dimension The ratio calculated in 2/ is multiplied with a value available at upper level [mention the hierarchical level, e.g. NUTS0] at the targeted time period. where Example HOW TO PROCEED? (1) Estimate the distribution of the stock at t-1 and t+1 as regard to an upper unit in the hierarchy (Take the lower level of the hierarchy available at t). (2) Check if the sum of the distribution at lower level is equal to 1. (3) Estimate the average distribution between t-1 and t+1. (4) Check if the sum of the distribution at lower level is equal to 1. (5) At t, multiply the values calculated in (3) by the stock available to the unit available at t at a upper level (the same than the one chosen for calculating (1)). (6) Check if the sum of values estimated at lower level at t is equal to value delivered by at upper level. 99
 At upper level (parent(e)), the information is available at (t-n) and/or (t+n). TIME DIMENSION (T) T-N T T+N Graphics illustration?")

101 SPACE DIMENSION (E) Level n Level n+1 Name Conditions of use TE5 - Interpolation/retropolation and space harmonization based on distribution method At lower level of the hierarchy, information is available for a single year (t) At upper level (parent(e)), the information is available at (t-n) and/or (t+n). TIME DIMENSION (T) T-N T T+N Graphics illustration???????? Textual explanation Mathematic formalization Estimation based on the space and time dimensions (TE) 1/ Space/time dimension: Calculation of the share of the unit as regard to its immediate upper level of belonging available[mention the hierarchical level of the nomenclature, e.g. NUTS0] placed in time after or before the estimated value [mention the year] 2/ Time/space dimension The ratio calculated in 1/ is multiplied with its immediate upper level of belonging available available [mention the hierarchical level of the nomenclature, e.g. NUTS0] at the targeted time period. where Example HOW TO PROCEED? (1) Estimate the distribution at lower level at t as regard to its immediate (if possible) upper level of belonging. (2) Check if the sum of the distribution at lower level is equal to 1. (3) At t-1 and t-2, multiplicate the values calculated in (1) by the stock available with its upper level of belonging (take the same hierarchical level than in (1)). For instance: poptot (T, UKM65) = Distribution (T+1, UKM65/UKM) * poptot (T, UKM) (4) Check if the sum of values estimated at lower level at t and t-1 is equal to value delivered by Eurostat at upper level. 100

102 SPACE DIMENSION (E) Level n Level n+1 Name Conditions of use Graphics illustration TE6 Retropolation/extrapolation and space harmonization based on distribution method with available values at the same hierarchical level Having at least one data available for a unit having the same parent and the same position in the hierarchy than the data to estimate at t-n and/or t+n. At lower level of the hierarchy, all information is available for two years (t and t+n or t and t-n) Data available for the parent unit both at t-n and/or t+n. TIME DIMENSION (T) T-N T T+N?? Textual explanation Mathematic formalization Estimation based on the time and space dimensions (TE) 1/ Time dimension - [linear/power] extrapolation. This method uses the two closest neighbours placed in time [before/after] ([mention the two years of reference]) the value estimated. 2/ Space dimension: Estimate the stock to estimate for missing values at t-n and/or t+n, by subtracting the value available for the unit of belonging (parent(e)) by the sum of available values for values of the same hierarchy and having the same parents (X(e,s,t,i)) 3/ Space harmonization: In that order, the sum of the data of units of the same hierarchy is equal to the value of their parent unit (which is already available). Where a = Linear model Power model And where Example 101
103 HOW TO PROCEED? This example has been developed with availale information a t+1 and t+n. But the methodology would be the same for data available at t-1 and t-n (1) Identify the units of the same hierarchy and having the same parent for which data is not available at t-1. (2) For missing values only, calculation of the 2000 s value thanks to available information at lower level in 2001 and 2002 (t+1 and t+2) Cf estimation method T1, p.14, here the power model has been used). (3) Sum of (2) (4) Estimate the quantity to estimate (subtraction of the immediate upper level of belonging by available values of the same hierarchical level and having the same parents at t). Then (5) Divide (4) by (3) (6) Multiply (2) by (5). (7) Check if the sum of values available and estimated at lower level at t-1 are the same than the value available at the immediate upper level of belonging. 102

 1/ Space/time dimension: At t [mention the year of reference], calculation of the share that")
104 SPACE DIMENSION (E) Level n Level n+1 Name Conditions of use Graphics illustration TE7 - Interpolation/retropolation and space harmonization based on distribution method with available values at the same hierarchical level Having at least one data available for a unit having the same parent and the same position in the hierarchy than the data to estimate at t-n and/or t+n. At lower level of the hierarchy, information is available for a single year (t) Data available for the parent unit both at t-n and/or t+n. TIME DIMENSION (T) T-N T T+N???? Textual explanation Mathematic formalization Estimation based on the space and time dimensions (TE) 1/ Space/time dimension: At t [mention the year of reference], calculation of the share that the count data of X(e,s,t,i) represents as regard to units of the same hierarchy and having the same parents (X(e,s,t,i)), who have also missing data at t-n and/or t+n. 2/ Space dimension: Estimate the stock to estimate for missing values at t-n and/or t+n, by subtracting the value available for the unit of belonging (parent(e)) by the sum of available values for values of the same hierarchy and having the same parents (X(e,s,t,i)) 3/ Space harmonization: Multiplication of 1/ and 2/. In that order, the sum of the data of units of the same hierarchy is equal to the value of their parent unit. where Example HOW TO PROCEED? (8) Identify the units of the same hierarchy and having the same parent for which data is not available at t-1. (9) For these units, estimate the share they represent individually at t as regard to the other missing value of the same hierarchy and having the same parents. (10) Check if the sum of the distribution at lower level is equal to 1. (11) Estimate the quantity to estimate (subtraction of the immediate upper level of belonging by available values of the same hierarchical level and having the same parents at t). (12) Multiply (2) and (4). (13) Check if the sum of values available and estimated at lower level at t-1 are the same than the value available at the immediate upper level of belonging. 103
Compact guides GISCO. Geographic information system of the Commission
 Compact guides GISCO Geographic information system of the Commission What is GISCO? GISCO, the Geographic Information System of the COmmission, is a permanent service of Eurostat that fulfils the requirements
The ESPON Programme. Goals Main Results Future
 The ESPON Programme Goals Main Results Future Structure 1. Goals Objectives and expectations Participation, organisation and networking Themes addressed in the applied research undertaken in ESPON projects
GISCO Working Party Meeting. 8 March 2012 Luxembourg. The ESPON 2013 Programme: State of Affairs. Marjan van Herwijnen project expert in the ESPON CU
 GISCO Working Party Meeting 8 March 2012 Luxembourg The ESPON 2013 Programme: State of Affairs Marjan van Herwijnen project expert in the ESPON CU The ESPON 2013 Programme Role in Structural Funds 2007-2013:
The ESPON Programme and the use of spatial data on the European level
 The ESPON Programme and the use of spatial data on the European level Plan4Business project ISOCARP Brussels Liaison Office 29 November 2013 Marjan van Herwijnen Project Expert - ESPON Coordination Unit
Launch of the ESPON 2013 Programme. European observation network on territorial development and cohesion
 Launch of the ESPON 2013 Programme European observation network on territorial development and cohesion Framework conditions for the ESPON 2013 Programme Policy development in use of territorial evidence
European spatial policy and regionalised approaches
 Findings of the ESPON 2006 Programme COMMIN Final Conference 26-27 April 2007 European spatial policy and regionalised approaches by Dr. Kai BöhmeB ! Territory matters Structure of presentation! Territorial
Key Indicators for Territorial Cohesion & Spatial Planning Stakeholder Workshop - Project Update. 13 th December 2012 San Sebastián, Basque Country
 Key Indicators for Territorial Cohesion & Spatial Planning Stakeholder Workshop - Project Update 13 th December 2012 San Sebastián, Basque Country Key Aims Explore the use of territorial data in developing
European Regional and Urban Statistics
 European Regional and Urban Statistics Dr. Berthold Feldmann berthold.feldmann@ec.europa.eu Eurostat Structure of the talk Regional statistics in the EU The tasks of Eurostat Regional statistics Urban
Helsinki. Oslo. Stockholm. Tallinn. Riga. København. Minsk. Vilnius. Warszawa. Berlin. Praha. Luxembourg. Bratislava Budapest. Wien.
 M4D NEWSLETTER FOR ESPON PROJECTS ulti-dimensional Database Design & Development MULTI-DIMENSIONAL DATA DESIGN AND DEVELOPMENT N 3 DECEMBER-JUNE 2013 EDITO This third issue of the ESPON M4D newsletter
Populating urban data bases with local data
 Populating urban data bases with local data (ESPON M4D, Géographie-cités, June 2013 delivery) We present here a generic methodology for populating urban databases with local data, applied to the case of
Land Use in the context of sustainable, smart and inclusive growth
 Land Use in the context of sustainable, smart and inclusive growth François Salgé Ministry of sustainable development France facilitator EUROGI vice president AFIGéO board member 1 Introduction e-content+
Progress of UN-GGIM: Europe Working Group A on Core Data
 INSPIRE KEN 13 December 2016 Progress of UN-GGIM: Europe Working Group A on Core Data François Chirié, Dominique Laurent, IGN France Plan Introduction Objectives of the working group with respect to INSPIRE
IAEG SDGs WG GI, , Mexico City
 IAEG SDGs WG GI, 12-14.12.2016, Mexico City UN-GGIM:Europe s perspective and activities to support better integration of geospatial information and statistics and the UN SDG monitoring Pier-Giorgio Zaccheddu,
Improving rural statistics. Defining rural territories and key indicators of rural development
 Improving rural statistics Defining rural territories and key indicators of rural development Improving rural statistics Improving Rural Statistics In 2016, the Global Strategy to improve Agricultural
Implementation of the ESPON 2020 cooperation program. 16 January 2017 Anneloes van Noordt
 Implementation of the ESPON 2020 cooperation program 16 January 2017 Anneloes van Noordt Outline! ESPON Cooperation Program! Specific Objectives! Applied Research! Targeted Analysis! Database & Tools!
Poland, European Territory, ESPON Programme Warsaw, 2 July 2007 STRATEGY OF THE ESPON 2013 PROGRAMME
 Poland, European Territory, ESPON Programme 2007-2013 Warsaw, 2 July 2007 STRATEGY OF THE ESPON 2013 PROGRAMME Territory matters Regional diversity as asset Territorial potentials increasing in importance
Status of implementation of the INSPIRE Directive 2016 Country Fiches. COUNTRY FICHE Netherlands
 Status of implementation of the INSPIRE Directive 2016 Country Fiches COUNTRY FICHE Netherlands Introduction... 1 1. State of Play... 2 1.1 Coordination... 2 1.2 Functioning and coordination of the infrastructure...
Key Indicators for Territorial Cohesion and Spatial Planning in Preparing Territorial Development Strategies
 ESPON Evidence in a North European Context Challenges and Opportunities for Territorial Development and Cohesion in a North European Macro Region, 10-11 April, 2014, Vilnius, Lithuania Key Indicators for
ESPON Factsheet. Italy Austria
 ESPON Factsheet Italy Austria ESPON Project TERREVI November 2012 1 Introduction ESPON supports policy development in relation to the aim of territorial cohesion and a harmonious development of the European
BUILDING SOUND AND COMPARABLE METRICS FOR SDGS: THE CONTRIBUTION OF THE OECD DATA AND TOOLS FOR CITIES AND REGIONS
 BUILDING SOUND AND COMPARABLE METRICS FOR SDGS: THE CONTRIBUTION OF THE OECD DATA AND TOOLS FOR CITIES AND REGIONS STATISTICAL CAPACITY BUILDING FOR MONITORING OF SUSTAINABLE DEVELOPMENT GOALS Lukas Kleine-Rueschkamp
Alps Results from the ESPON Project. Common spatial perspectives for the Alpine area. Towards a common vision
 Results from the ESPON Project Alps 2050 Common spatial perspectives for the Alpine area. Towards a common vision Tobias Chilla, University of Erlangen Cooperation Alps 2020+ 1 & 2 October 2018 Salzburg
Refinement of the OECD regional typology: Economic Performance of Remote Rural Regions
 [Preliminary draft April 2010] Refinement of the OECD regional typology: Economic Performance of Remote Rural Regions by Lewis Dijkstra* and Vicente Ruiz** Abstract To account for differences among rural
How proximity to a city influences the performance of rural regions by Lewis Dijkstra and Hugo Poelman
 n 01/2008 Regional Focus A series of short papers on regional research and indicators produced by the Directorate-General for Regional Policy Remote Rural Regions How proximity to a city influences the
ESPON public database
 ESPON public database - tables and indicators overview - NUTS-Reference: NUTS 0 reference NUTS 1 reference NUTS 2 reference NUTS 3 reference ESPON basic indicators: Area NUTS 2 Area in square kilometer
Eurostat regional yearbook using statistical maps and graphs to tell a story. Teodóra Brandmüller and Åsa Önnerfors, Eurostat
 Eurostat regional yearbook 2015 - using statistical maps and graphs to tell a story Teodóra Brandmüller and Åsa Önnerfors, Eurostat Gross domestic product (GDP) at current market prices per inhabitant
Labour Market Areas in Italy. Sandro Cruciani Istat, Italian National Statistical Institute Directorate for territorial and environmental statistics
 Labour Market Areas in Italy Sandro Cruciani Istat, Italian National Statistical Institute Directorate for territorial and environmental statistics Workshop on Developing European Labour Market Areas Nuremberg,
Status of implementation of the INSPIRE Directive 2016 Country Fiches. COUNTRY FICHE Croatia
 Status of implementation of the INSPIRE Directive 2016 Country Fiches COUNTRY FICHE Croatia Introduction... 1 1. State of Play... 2 1.1 Coordination... 2 1.2 Functioning and coordination of the infrastructure...
Status of implementation of the INSPIRE Directive 2016 Country Fiches. COUNTRY FICHE Malta
 Status of implementation of the INSPIRE Directive 2016 Country Fiches COUNTRY FICHE Malta Introduction... 1 1. State of Play... 2 1.1 Coordination... 2 1.2 Functioning and coordination of the infrastructure...
Third Cohesion report February 2004
 February 2004 A new partnership for cohesion Convergence, Competitiveness and Co-operation METREX meeting S. Sebastian, Luisa Sanches DG REGIO The 3rd CR structure 1. Analysis of situation and trends in
Low Density Areas : Places of Opportunity. Enrique Garcilazo, OECD Directorate for Public Governance and Territorial Development
 Low Density Areas : Places of Opportunity Enrique Garcilazo, OECD Directorate for Public Governance and Territorial Development Open Days, Brussels, 11 th October, 2016 Outline 1. Performance low density
Figure 10. Travel time accessibility for heavy trucks
 Figure 10. Travel time accessibility for heavy trucks Heavy truck travel time from Rotterdam to each European cities respecting the prescribed speed in France on the different networks - Road, motorway
Status of implementation of the INSPIRE Directive 2016 Country Fiches. COUNTRY FICHE Czech Republic
 Status of implementation of the INSPIRE Directive 2016 Country Fiches COUNTRY FICHE Czech Republic Introduction... 1 1. State of Play... 2 1.1 Coordination... 2 1.2 Functioning and coordination of the
Egypt Public DSS. the right of access to information. Mohamed Ramadan, Ph.D. [R&D Advisor to the president of CAPMAS]
![Egypt Public DSS. the right of access to information. Mohamed Ramadan, Ph.D. [R&D Advisor to the president of CAPMAS]](/thumbs/89/98483713.jpg "Egypt Public DSS. the right of access to information. Mohamed Ramadan, Ph.D. [R&D Advisor to the president of CAPMAS]") Egypt Public DSS ì the right of access to information Central Agency for Public Mobilization and Statistics Arab Republic of Egypt Mohamed Ramadan, Ph.D. [R&D Advisor to the president of CAPMAS] Egypt
Egypt Public DSS ì the right of access to information Central Agency for Public Mobilization and Statistics Arab Republic of Egypt Mohamed Ramadan, Ph.D. [R&D Advisor to the president of CAPMAS] Egypt
How the science of cities can help European policy makers: new analysis and perspectives
 How the science of cities can help European policy makers: new analysis and perspectives By Lewis Dijkstra, PhD Deputy Head of the Economic Analysis Unit, DG Regional and European Commission Overview Data
European Commission STUDY ON INTERIM EVALUATION OF EUROPEAN MARINE OBSERVATION AND DATA NETWORK. Executive Summary
 European Commission STUDY ON INTERIM EVALUATION OF EUROPEAN MARINE OBSERVATION AND DATA NETWORK Executive Summary by NILOS Netherlands Institute for the Law of the Sea June 2011 Page ii Study on Interim
Workshop B Spatial positioning and definition of characteristics
 This presentation expresses the author's views. It does not necessarily reflect the opinion of the ESPON Monitoring Committee, which is not liable for any use that may be made of the information provided.
City definitions. Sara Ben Amer. PhD Student Climate Change and Sustainable Development Group Systems Analysis Division
 City definitions Sara Ben Amer PhD Student Climate Change and Sustainable Development Group Systems Analysis Division sbea@dtu.dk Contents 1. Concept of a city 2. Need for the city definition? 3. Challenges
ESBN. Working Group on INSPIRE
 ESBN Working Group on INSPIRE by Marc Van Liedekerke, Endre Dobos and Paul Smits behalf of the WG members WG participants Marc Van Liedekerke Panos Panagos Borut Vrščaj Ivana Kovacikova Erik Obersteiner
Infrastructure for Spatial Information in Europe (INSPIRE)
") Infrastructure for Spatial Information in Europe (INSPIRE) 2011 GISCO Working Party 8-9.3.2012 INSPIRE is about improving access to spatial information: the environment doesn t stop at borders EU Geoportal
Infrastructure for Spatial Information in Europe (INSPIRE) 2011 GISCO Working Party 8-9.3.2012 INSPIRE is about improving access to spatial information: the environment doesn t stop at borders EU Geoportal
The Added Value of Geospatial Data in a Statistical Office. Pedro Diaz Munoz Director Sectoral and Regional Statistics EUROSTAT European Commission
 The Added Value of Geospatial Data in a Statistical Office Pedro Diaz Munoz Director Sectoral and Regional Statistics EUROSTAT European Commission Why integrate Responsibility of all the information we
ESPON evidence on European cities and metropolitan areas
 BEST METROPOLISES Final Conference 18 April 2013, Warsaw ESPON evidence on European cities and metropolitan areas Michaela Gensheimer Structure of Intervention Content Part I: What is the ESPON 2013 Programme?
Mediterranean Sea and Territorial Development, Opportunities and Risks
 EESC Hearing Towards an EU Macro-Regional Strategy for the Mediterranean Mediterranean Sea and Territorial Development, Opportunities and Risks Michaela Gensheimer Structure of Intervention Part I: What
Ministry of Health and Long-Term Care Geographic Information System (GIS) Strategy An Overview of the Strategy Implementation Plan November 2009
 Strategy An Overview of the Strategy Implementation Plan November 2009") Ministry of Health and Long-Term Care Geographic Information System (GIS) Strategy An Overview of the Strategy Implementation Plan November 2009 John Hill, Health Analytics Branch Health System Information
Ministry of Health and Long-Term Care Geographic Information System (GIS) Strategy An Overview of the Strategy Implementation Plan November 2009 John Hill, Health Analytics Branch Health System Information
Foundation Geospatial Information to serve National and Global Priorities
 Foundation Geospatial Information to serve National and Global Priorities Greg Scott Inter-Regional Advisor Global Geospatial Information Management United Nations Statistics Division UN-GGIM: A global
Secondary Towns and Poverty Reduction: Refocusing the Urbanization Agenda
 Secondary Towns and Poverty Reduction: Refocusing the Urbanization Agenda Luc Christiaensen and Ravi Kanbur World Bank Cornell Conference Washington, DC 18 19May, 2016 losure Authorized Public Disclosure
Book Review: A Social Atlas of Europe
 Book Review: A Social Atlas of Europe Ferreira, J Author post-print (accepted) deposited by Coventry University s Repository Original citation & hyperlink: Ferreira, J 2015, 'Book Review: A Social Atlas
South Europe at the crossroads
 Inspire policy making by territorial evidence ESPON Seminar South Europe at the crossroads Are we making the right decisions about accessibility investments for the future? The access to services of general
Progress of UN-GGIM: Europe Working Group A on Core Data
 PolicyKEN Budapest 29 November 2016 Progress of UN-GGIM: Europe Working Group A on Core Data François Chirié, Dominique Laurent, IGNF Core data context Background and purpose Aim of Work Group A to propose
Are EU Rural Areas still Lagging behind Urban Regions? An Analysis through Fuzzy Logic
 Are EU Rural Areas still Lagging behind Urban Regions? An Analysis through Fuzzy Logic Francesco Pagliacci Department of Economics and Social Sciences Università Politecnica delle Marche Ancona (Italy)
National Spatial Development Perspective (NSDP) Policy Coordination and Advisory Service
 Policy Coordination and Advisory Service") National Spatial Development Perspective (NSDP) Policy Coordination and Advisory Service 1 BACKGROUND The advances made in the First Decade by far supersede the weaknesses. Yet, if all indicators were
National Spatial Development Perspective (NSDP) Policy Coordination and Advisory Service 1 BACKGROUND The advances made in the First Decade by far supersede the weaknesses. Yet, if all indicators were
APPLICATION OF DEFINITION AND METHODS IN MEXICO
 APPLICATION OF DEFINITION AND METHODS IN MEXICO WIEGO 20th. ANNIVERSARY RESEARCH CONFERENCE Cambridge Mass. November 10-12 2017 Rodrigo Negrete Lilia Guadalupe Luna Why informality matters so much in Mexico
ANNEX 2: Defining and measuring rurality. Prepared by Dr Steve Goss
 ANNEX 2: Defining and measuring rurality Prepared by Dr Steve Goss June 2013 1 TABLE OF CONTENTS 1 Definitions of rurality in common use... 2 1.1 Measuring rurality... 2 1.1.1 OECD rural urban division...
Brazil Paper for the. Second Preparatory Meeting of the Proposed United Nations Committee of Experts on Global Geographic Information Management
 Brazil Paper for the Second Preparatory Meeting of the Proposed United Nations Committee of Experts on Global Geographic Information Management on Data Integration Introduction The quick development of
Geological information for Europe : Towards a pan-european Geological Data Infrastructure
 Geological information for Europe : Towards a pan-european Geological Data Infrastructure Integrating geoscientific information for EU competitiveness Co-funded by the European Union European societal
Economic and Social Council
 United Nations Economic and Social Council Distr.: General 2 July 2012 E/C.20/2012/10/Add.1 Original: English Committee of Experts on Global Geospatial Information Management Second session New York, 13-15
3D Urban Information Models in making a smart city the i-scope project case study
 UDC: 007:528.9]:004; 007:912]:004; 004.92 DOI: 10.14438/gn.2014.17 Typology: 1.04 Professional Article 3D Urban Information Models in making a smart city the i-scope project case study Dragutin PROTIĆ
The Combination of Geospatial Data with Statistical Data for SDG Indicators
 Session 3: Sustainable Development Goals, SDG indicators The Combination of Geospatial Data with Statistical Data for SDG Indicators Pier-Giorgio Zaccheddu (with the assistance of Francisco Vala & Cátia
SPIMA Spatial dynamics and strategic planning in metropolitan areas
 Targeted Analysis SPIMA Spatial dynamics and strategic planning in metropolitan areas Executive Summary Conference version 1 February 2018 0 1. Background To address the challenges of metropolitan development
Euro-indicators Working Group
 Euro-indicators Working Group Luxembourg, 9 th & 10 th June 2011 Item 9.4 of the Agenda New developments in EuroMIND estimates Rosa Ruggeri Cannata Doc 309/11 What is EuroMIND? EuroMIND is a Monthly INDicator
Jordan's Strategic Research Agenda in cultural heritage
 Jordan's Strategic Research Agenda in cultural heritage Analysis of main results Alessandra Gandini Amman, Jordan 3 rd November 2013 Main objectives The work performed had the main objective of giving
The European territory: Strategic developmentd
 The European territory: Strategic developmentd Peter Mehlbye Workshop Strategic Development Catalonia 11 June 2002 THE LECTURE Structure I. Territorial trends II. Strategy for European spatial development
A proposal for building an infrastructure for European geospatial statistics
 A proposal for building an infrastructure for European geospatial statistics Marie Haldorson, Statistics Sweden Ekkehard Petri, Eurostat What is geospatial statistics? The location, extent or spatial relations
Topic 4: Changing cities
 Topic 4: Changing cities Overview of urban patterns and processes 4.1 Urbanisation is a global process a. Contrasting trends in urbanisation over the last 50 years in different parts of the world (developed,
Heritage Counts! Economic Impacts of Cultural Heritage European Perspective - Presented by: Dr. Cornelia Dümcke, CULTURE CONCEPTS, Berlin, Germany
 Heritage Counts! Economic Impacts of Cultural Heritage European Perspective - Presented by: Dr. Cornelia Dümcke, CULTURE CONCEPTS, Berlin, Germany The most significant shift in the heritage discourse concerns
GEOGRAPHIC INFORMATION SYSTEMS Session 8
 GEOGRAPHIC INFORMATION SYSTEMS Session 8 Introduction Geography underpins all activities associated with a census Census geography is essential to plan and manage fieldwork as well as to report results
City and SUMP of Ravenna
 City and SUMP of Ravenna Nicola Scanferla Head of Mobility Planning Unit, Municipality of Ravenna nscanferla@comune.ra.it place your logo here 19 April, 2017 1st Steering Committee Meeting, Nicosia, Cyprus
TERCET: A European regulation on statistical units and territorial typologies
 TERCET: A European regulation on statistical units and territorial typologies NUAC Meeting 10 May 2016 Eurostat Unit E4 Regulation (EC) No 1059/2003: - Establishes a classification of territorial units
PART A Project summary
 PART A Project summary A.1 Project identification Project title Project acronym Name of the lead partner organisation in English Specific objective Demonstrattion AF DAF Partner 1.1. Improving innovation
The Combination of Geospatial Data with Statistical Data for SDG Indicators
 Session x: Sustainable Development Goals, SDG indicators The Combination of Geospatial Data with Statistical Data for SDG Indicators Pier-Giorgio Zaccheddu Fabio Volpe 5-8 December2018, Nairobi IAEG SDG
Status of implementation of the INSPIRE Directive 2016 Country Fiches. COUNTRY FICHE France
 Status of implementation of the INSPIRE Directive 2016 Country Fiches COUNTRY FICHE France Introduction... 1 1. State of Play... 2 1.1 Coordination... 2 1.2 Functioning and coordination of the infrastructure...
Land Use and Land cover statistics (LUCAS)
") EUROPEAN COMMISSION EUROSTAT Directorate E: Sectoral and regional statistics Doc. ENV/DIMESA/7.1/2012 Original in EN Agenda point 7.1 Land Use and Land cover statistics (LUCAS) DIMESA Directors' Meeting
EUROPEAN COMMISSION EUROSTAT Directorate E: Sectoral and regional statistics Doc. ENV/DIMESA/7.1/2012 Original in EN Agenda point 7.1 Land Use and Land cover statistics (LUCAS) DIMESA Directors' Meeting
CentropeSTATISTICS Working Interactively with Cross-Border Statistic Data Clemens Beyer, Walter Pozarek, Manfred Schrenk
 Clemens Beyer, Walter Pozarek, Manfred Schrenk (Dipl.-Ing. Clemens Beyer, CEIT ALANOVA, Concorde Business Park 2/F, 2320 Schwechat, Austria, c.beyer@ceit.at) (Dipl.-Ing. Walter Pozarek, PGO Planungsgemeinschaft
Tackling urban sprawl: towards a compact model of cities? David Ludlow University of the West of England (UWE) 19 June 2014
 19 June 2014") Tackling urban sprawl: towards a compact model of cities? David Ludlow University of the West of England (UWE) 19 June 2014 Impacts on Natural & Protected Areas why sprawl matters? Sprawl creates environmental,
Tackling urban sprawl: towards a compact model of cities? David Ludlow University of the West of England (UWE) 19 June 2014 Impacts on Natural & Protected Areas why sprawl matters? Sprawl creates environmental,
Traffic accidents and the road network in SAS/GIS
 Traffic accidents and the road network in SAS/GIS Frank Poppe SWOV Institute for Road Safety Research, the Netherlands Introduction The first figure shows a screen snapshot of SAS/GIS with part of the
I CAN STATEMENTS 6TH GRADE SOCIAL STUDIES
 6TH GRADE SOCIAL STUDIES I can compare historical issues involving rights, roles and statues of individuals. I can describe the relationships among specialization, division of labor, productivity of workers
Cell-based Model For GIS Generalization
 Cell-based Model For GIS Generalization Bo Li, Graeme G. Wilkinson & Souheil Khaddaj School of Computing & Information Systems Kingston University Penrhyn Road, Kingston upon Thames Surrey, KT1 2EE UK
Multinational Spatial Planning Experience
 POLAND Multinational Spatial Planning Experience of the Baltic Sea Region Competitiveness and territorial cohesion in Eastern and South-Eastern Europe Magdalena Zagrzejewska-Fiedorowicz VASAB 2010 Visions
ESPON Factsheet. South East Europe
 ESPON Factsheet South East Europe ESPON Project TERREVI November 2012 1 Introduction ESPON supports policy development in relation to the aim of territorial cohesion and a harmonious development of the
Report. Workshop 5: How can atlases help to organise and promote the seas?
 Workshop 5: How can atlases help to organise and promote the seas? Report 1. Three key messages included on the reporting slide for the last plenary session Atlases help people to visualise intuitively
Geography. Programme of study for key stage 3 and attainment target (This is an extract from The National Curriculum 2007)
") Geography Programme of study for key stage 3 and attainment target (This is an extract from The National Curriculum 2007) Crown copyright 2007 Qualifications and Curriculum Authority 2007 Curriculum aims
Geography Programme of study for key stage 3 and attainment target (This is an extract from The National Curriculum 2007) Crown copyright 2007 Qualifications and Curriculum Authority 2007 Curriculum aims
THE SEVILLE STRATEGY ON BIOSPHERE RESERVES
 THE SEVILLE STRATEGY ON BIOSPHERE RESERVES 1 VISION FOR BIOSPHERE RESERVES IN THE 21 ST CENTURY The international Seville Conference on Biosphere Reserves, organised by UNESCO, adopted a two-pronged approach,
DEFINING AND MEASURING WORLD-METRO REGIONS FOR INTERNATIONAL COMPARISONS
 DEFINING AND MEASURING WORLD-METRO REGIONS FOR INTERNATIONAL COMPARISONS Mario Piacentini, OECD 27th Scorus Conference, 11-13 August 2010, Latvia Why we need comparable measures of city performance Growing
ESPON Database 2013 Phase II ( ) Multi Dimensional Database Design and Development (M4D) Final Report January 2015
 Multi Dimensional Database Design and Development (M4D) Final Report January 2015") ESPON Database 2013 Phase II (2011-2014) Multi Dimensional Database Design and Development (M4D) Final Report January 2015 1 This report presents the final results of a Scientific Platform Project conducted
ESPON Database 2013 Phase II (2011-2014) Multi Dimensional Database Design and Development (M4D) Final Report January 2015 1 This report presents the final results of a Scientific Platform Project conducted
Lecture 9: Location Effects, Economic Geography and Regional Policy
 Lecture 9: Location Effects, Economic Geography and Regional Policy G. Di Bartolomeo Index, EU-25 = 100 < 30 30-50 50-75 75-100 100-125 >= 125 Canarias (E) Guadeloupe Martinique RÈunion (F) (F) (F) Guyane
COUNCIL OF THE EUROPEAN UNION. Brussels, 2 May /14 CULT 68
 COUNCIL OF THE EUROPEAN UNION Brussels, 2 May 2014 9129/14 CULT 68 NOTE from: General Secretariat of the Council to: Permanent Representatives Committee (Part 1) / Council No. prev. doc.: 8892/14 CULT
Integrated Strategies in regional development
 Inspire policy making by territorial evidence ESPON Seminar Territories Acting for Economic Growth: Using territorial evidence to meet challenges towards 2020 Integrated Strategies in regional development
Global City Definition
 Regional Training Workshop on Human Settlement Indicators Global City Definition Dennis Mwaniki Global Urban Observatory, Research and Capacity Development Branch, UN-Habitat Bangkok, Thailand Outline
International Conference Analysis and Management of Changing Risks for Natural Hazards November 2014 l Padua, Italy
 Abstract Code: B01 Assets mapping products in support of preparedness and prevention measures (examples from Germany, Italy and France) Marc Mueller, Thierry Fourty, Mehdi Lefeuvre Airbus Defence and Space,
The Socio Economic Development of the Marine Sector in the Atlantic Area. Stephen Hynes
 The Socio Economic Development of the Marine Sector in the Atlantic Area Stephen Hynes Overview SEMRU and its role in Marine Socioeconomic analysis Defining Ocean and Coastal Economies in the Atlantic
Implementation of the Political Declaration on energy cooperation between the North Seas Countries. Support Group 1 on Maritime Spatial Planning
 Implementation of the Political Declaration on energy cooperation between the North Seas Countries Support Group 1 on Maritime Spatial Planning Work Programme 1. Work area as outlined in Annex I to the
Typology of Rural Regions in Europe RUFUS. Johanna Scholz& Sylvia Herrmann. A regional typology as instrument for integrative rural development
 Typology of Rural Regions in Europe A regional typology as instrument for integrative rural development RUFUS Rural Future Networks Workshop Hannover 25-26 August 2010 `Diversities of rural areas in Europe
Governance and Functional Urban Areas CEMAT Conference
 Governance and Functional Urban Areas CEMAT Conference Mart Grisel Bucharest, Romania 30/05/2017 FUA: various definitions KEY ASPECTS: CITY & COMMUTING AREA The area occupied by a large city and its surrounding
Challenges in Geospatial Policy Formulation and Programme Management
 Challenges in Geospatial Policy Formulation and Programme Management Luiz Paulo Souto Fortes, PhD An Exchange with the Geospatial Industry for UN-GGIM Seoul, October 23, 2011 BRAZIL Land area 8,514,876.599
A proposal for building an infrastructure for European geospatial statistics. Marie Haldorson, Statistics Sweden Ekkehard Petri, Eurostat
 A proposal for building an infrastructure for European geospatial statistics Marie Haldorson, Statistics Sweden Ekkehard Petri, Eurostat What is geospatial statistics? The location, extent or spatial relations
2. Defining fisheries areas
 What does fisheries area mean in the context of the EFF? Axis 4 of the European Fisheries Fund (EFF) is different from the other three Axes in that it targets fisheries areas (it is titled Sustainable
Carpathians Unite mechanism of consultation and cooperation for implementation of the Carpathian Convention
 Carpathians Unite mechanism of consultation and cooperation for implementation of the Carpathian Convention Zbigniew Niewiadomski, UNEP/GRID-Warsaw Centre First Joint Meeting of the Carpathian Convention
How rural the EU RDP is? An analysis through spatial funds allocation
 How rural the EU RDP is? An analysis through spatial funds allocation Beatrice Camaioni, Roberto Esposti, Antonello Lobianco, Francesco Pagliacci, Franco Sotte Department of Economics and Social Sciences
GIS FOR MAZOWSZE REGION - GENERAL OUTLINE
 GIS FOR MAZOWSZE REGION - GENERAL OUTLINE S. Bialousz 1), K Mączewski 2), E. Janczar 2), K. Osinska-Skotak 1) 1) Warsaw University of Technology, Warsaw, Poland 2) Office of the Surveyor of the Mazowieckie
SAMPLE. Geography 2018 Sample paper. Question booklet. Examination information
 South Australian Certificate of Education The external assessment requirements of this subject are listed on page 18. Question booklet Geography 2018 Sample paper Section 1 (Questions 1 and 2) 33 marks
How to measure Territorial Cohesion and Cooperation?
 How to measure territorial cohesion and cooperation? How to measure Territorial Cohesion and Cooperation? Brussels: 21 February Growth, Development or Cohesion? Economic Competitiveness Social Cohesion