INDIAN INSTITUTE OF TECHNOLOGY ROORKEE
|
|
|
- Eustace Paul
- 5 years ago
- Views:
Transcription

1 SEMINAR ON A REVIEW OF CHANGE DETECTION TECHNIQUES INDIAN INSTITUTE OF TECHNOLOGY ROORKEE PRESENTED BY:- ABHISHEK BHATT RESEARCH SCHOLAR abhishekbhatt.iitr@gmail.com
2 OUTLINE This seminar is organized into eight sections as follows: 1. Background and applications of change detection techniques 2. Considerations before implementing change detection 3. A review of seven categories of change detection techniques 4. Comparative analyses among the different techniques 5. A global change analyses 6. Threshold selection 7. Accuracy assessment 8. Summary and recommendations References
3 Background In general, change detection involves the application of multitemporal datasets to quantitatively analyze the temporal effects Change detection can be defined as the process of identifying differences in the state of an object or phenomenon by observing it at different times. This process is usually applied to Earth surface changes at two or more times. understanding relationships and interactions to better manage and use resources Change detection is useful in many applications such as land use changes, habitat fragmentation, rate of deforestation, coastal change, urban sprawl, and other cumulative changes
4
5

6 Change detection source; Norsk Regnesentral website Two main categories of land cover changes: Conversion of land cover from one category to a different category. Modification of the condition of the land cover type within the same category (thinning of trees, selective cutting, pasture to cultivation, etc.)
7 Applications of change detection techniques land-use and land-cover (LULC) change forest or vegetation change forest mortality, defoliation and damage assessment deforestation, regeneration and selective logging wetland change forest fire and fire-affected area detection landscape change urban change environmental change, drought monitoring, flood monitoring, monitoring coastal marine environments, desertification, and detection of landslide areas other applications such as crop monitoring, shifting cultivation monitoring, road segments, and change in glacier mass balance and facies.
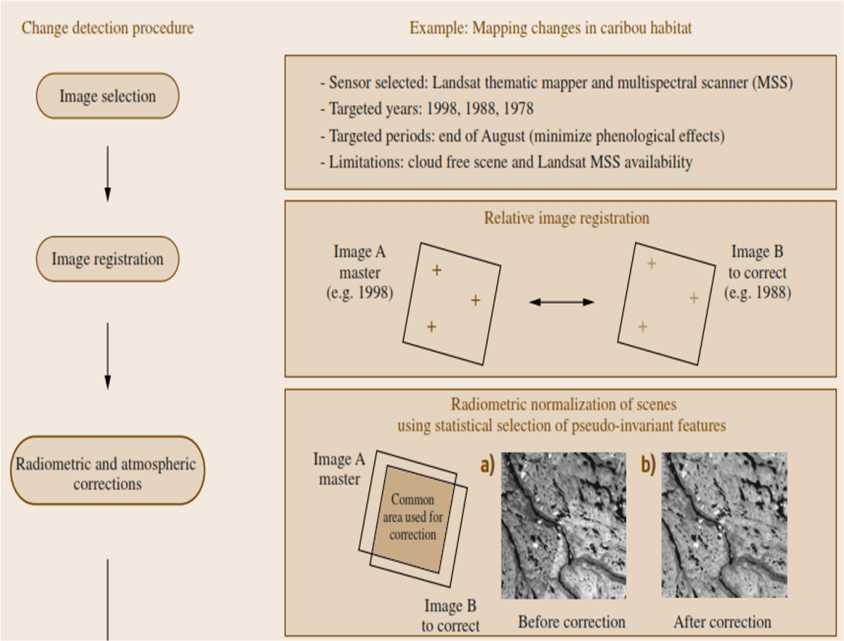
8 Considerations before implementing change detection Before implementing change detection analysis, the following conditions must be satisfied: i. precise registration of multi-temporal images; ii. precise radiometric and atmospheric calibration or normalization between multi-temporal images; iii. selection of the same spatial and spectral resolution images if possible
9 Good change detection research should provide the following information: i. area change and change rate ii. spatial distribution of changed types iii. Change trajectories of land-cover types iv. accuracy assessment of change detection results.
10 A review of change detection techniques Because digital change detection is affected by spatial, spectral, radiometric and temporal constraints. Many change detection techniques are possible to use, the selection of a suitable method or algorithm for a given research project is important, but not easy.
11 The seven change detection technique categories 1. Algebra Based Approach image differencing image regression image ratioing vegetation index differencing change vector analysis 2. Transformation PCA Tasseled Cap (KT) Gramm-Schmidt (GS) Chi-Square 3. Classification Based Post-Classification Comparison Spectral-Temporal Combined Analysis EM Transformation Unsupervised Change Detection Hybrid Change Detection Artificial Neural Networks (ANN) 4. Advanced Models 5. GIS Li-Strahler Reflectance Model Spectral Mixture Model Biophysical Parameter Method Integrated GIS and RS Method GIS Approach 6. visual Analysis Visual Interpretation 7. other Change Detection Techniques Measures of spatial dependence Knowledge-based vision system Area production method Combination of three indicators: vegetation indices, land surface temperature, and spatial structure Change curves Generalized linear models Curve-theorem-based approach Structure-based approach Spatial statistics-based method
12 Category I Algebra Based Approach The algebra category includes image differencing, image regression Image ratioing vegetation index differencing change vector analysis (CVA)
13 Algebra based Approach These algorithms have a common characteristic, i.e. selecting thresholds to determine the changed areas. These methods (excluding CVA) are relatively simple, straightforward, easy to implement and interpret, but these cannot provide complete matrices of change information. In this category, two aspects are critical for the change detection results: selecting suitable image bands selecting suitable thresholds
14 Image Differencing Concept Date 1 - Date 2 No-change = 0 Positive and negative values interpretable Pick a threshold for change
15 Image Differencing Image Date 1 Image Date Difference Image = Image 1 - Image 2
16 Image Differencing Image differencing: Pros Simple (some say it s the most commonly used method) Easy to interpret Robust Cons: Difference value is absolute, so same value may have different meaning Requires atmospheric calibration
17 Image regression Relationship between pixel values of two dates is established by using a regression function. The dimension of the residuals is an indicator of where change occurred. Advantage Reduces impact of atmospheric, sensor and environmental differences. Drawback Requires development of accurate regression functions. Does not provide change matrix.
18 Image regression
19 Image Ratioing Concept Pros Cons Date 1 / Date 2 No-change = 1 Values less than and greater than 1 are interpretable Pick a threshold for change Simple May mitigate problems with viewing conditions, esp. sun angle Scales change according to a single date, so same change on the ground may have different score depending on direction of change; I.e. 50/100 =.5, 100/50 = 2.0

 Image Ratio (TM99")
20 Change Detection source: CCRS website, CANADA Image Difference (TM99 TM88) Image Ratio (TM99 / TM88)

21 Change vector analysis In n-dimensional spectral space, determine length and direction of vector between Date 1 and Date2 No-change = 0 length Change direction may be interpretable Pick a threshold for change Band 4 Date 1 Date 2 Band 3

22 Change vector analysis Determines in n-dimensional spectral space, the length and direction of the vector between Date 1 and Date 2. Produces an intensity image and a direction image of change. The direction image can be used to classify change. source; Norsk Regnesentral website Typically used when all changes need to be investigated. Advantage Works on multispectral data. Allows designation of the type of change occurring Drawback Shares some of the drawbacks of algebra based techniques but less severe

23 Change vector analysis
24 Category I. Algebra Based Approach Techniques Characteristics Advantages Disadvantages Examples Key factors 1. Image differencing Subtracts the first date image from a seconddate image, pixel by pixel Simple and Straight forward, easy to interpret the results Cannot provide a detailed change matrix, requires selection of thresholds Forest defoliation, land-cover Change and irrigated crops monitoring Identifies suitable image bands and thresholds 2. Image regression Establishes relationships between bitemporal images, then estimates pixel values of the second-date image by use of a regression function, subtracts the regressed image from the first-date image Reduces impacts of the atmospheric, sensor and environmental differences between two-date images Requires to develop accurate regression functions for the selected bands before implementing change detection Tropical forest change and forest conversion Develops the regression function; identifies suitable bands and thresholds 3. Image ratioing Calculates the ratio of registered images of two dates, band by band Reduces impactsof Sun angle, shadow and topography Non-normal distribution of the result is often criticized Land-use mapping Identifies the image bands and thresholds
25 Techniques Characteristics Advantages Disadvantages Examples Key factors 4. Vegetation Index differencing Produces vegetation index separately, then subtracts the second-date vegetation index from the first-date vegetation index Emphasizes differences in the spectral response of different features and reduces impacts of topographic effects and illumination. random noise or coherence noise Vegetation change and forest canopy change Enhances Identifies suitable vegetation index and thresholds 5. Change vector analysis (CVA) Generates two outputs: (1) the spectral change vector describes the direction and magnitude of change from the first to the second date; and (2) the total change magnitude per pixel is computed by determining the Euclidean distance between end points through n-dimensional change space Ability to process any number of spectral bands desired and to produce detailed change detection information Difficult to identify land cover change trajectories landscape variables land-cover changes disaster assessment and conifer forest change Defines thresholds and identifies change trajectories
26 Category II. Transformation of data sets
27 Transformations Principal Component Analysis Alt1: Perform PCA on data from both dates and analyse the component images. Alt2: Perform PCA separately on each image and subtract the second-date PC image from that of the first date. Advantage Reduces data redundancy. Drawback Results are scene dependent and can be difficult to interpret. Does not provide change matrix.
28 Kauth Thomas Transformation Described the temporal spectral patterns derived from Landsat MSS imagery for crops. As crops grow from seed to maturity, there is a net increase in NIR and decrease in Red Reflectance. This effect varies based on soil Color Brightness Greenness Wetness The Brightness, Greenness, Wetness transform was first developed for use with the Landsat MSS system and called the Tasseled Cap transformation. The transform is based on a set of constants applied to the image in the form of a linear algebraic formula. Brightness primary axis calculated as the weighted sum of reflectances of all spectral bands. Greenness perpendicular to the axis of the Brightness component that passes through the point of maturity of all plants Yellow Stuff perpendicular to both Greenness and Brightness axis representing senesced vegetation.

29 Kauth Thomas Transformation Typically the first few components contain most of the information in the data so that four channels of LANDSAT MSS data or the six channels of the Thematic Mapper data may be reduced to just three principal components. The components higher than three are usually treated as being information less. Source;
30 Category II. Transformation Techniques Characteristics Advantages Disadvantages Examples Key factors 1. Principal component analysis (PCA) Assumes that multitemporal data are highly correlated and change information can be highlighted in the new components. Two ways to apply PCA for change detection are: (1)put two or more dates of images into a single file, then perform PCA and analyse the minor component images for change information; and (2) perform PCA separately, then subtract the second-date PC image from the corresponding PC image of the first date Reduces data Redundancy between bands and emphasizes different information in the derived components PCA is scene dependent, thus the change detection results between different dates are often difficult to interpret and label. It cannot provide a complete matrix of change class information and requires determining thresholds to identify the changed areas Land-cover change urban expansion,tropical forest conversion, forest mortality and forest defoliation Analyst s skill in identifying which component best represents the change and selecting thresholds 2. Tasselled cap (KT) The principle of this method is similar to PCA. The only difference from PCA is that PCA depends on the image scene, andkt transformation is independent of the scene. The change detection is implemented based on the three components: brightness, greenness and wetness Reduces data redundancy between bands and emphasizes different information in the derived components. KT is scene independent. Difficult to interpret and label change information, cannot provide a complete change matrix; requires determining thresholds to identify the changed areas. Accurate atmospheric calibration is required Monitoring forest mortality, monitoring green biomass and land-use change Analyst s skill is needed in identifying which component best represents the change and thresholds
31 Techniques Characteristics Advantages Disadvantages Examples Key factors 3. Gramm Schmidt (GS) The GS method orthogonalizes spectral vectors taken directly from bi-temporal images, as does the original KT method, produces three stable components corresponding to multitemporal analogues of KT brightness, greenness and wetness, and a change component The association of transformed components with scene characteristics allows the extraction of information that would not be accessible using other techniques It is difficult to extract more than one single component related to a given type of change. The GS process relies on selection of spectral vectors from multi-date image typical of the type of change being examined Monitoring forest mortality Initial identification of the stable subspace of the multi-date data is required 4. Chisquare Y=(X-M) T -1 *(X-M) Y:digital value of change image X:vector of the difference of the six digital values between the two dates M:vector of the mean residual of each band T:transverse of the matrix -1 = inverse covariance matrix Multiple bands Are simultaneously considered to produce a single change image. The assumption that a value of Y~0 represents a pixel of no change is not true when a large portion of the image is changed. Also the change related to specific spectral direction not identified Urban environmen tal change Y is distributed as a Chi-square random variable with p degrees of freedom ( p is the number of bands)
32 Category-III Classification based approach
33 Post-classification Post-classification (delta classification) Classify Date 1 and Date 2 separately, compare class values on pixel by pixel basis between dates Post-classification: Pros Avoids need for strict radiometric calibration Favors classification scheme of user Designates type of change occurring Cons Error is multiplicative from two parent maps Changes within classes may be interesting
34 Composite Analysis Composite Analysis Stack Date 1 and Date 2 and run unsupervised classification on the whole stack Composite Analysis: Pros May extract maximum change variation Includes reference for change, so change is anchored at starting value, unlike change vector analysis and image differencing Cons May be extremely difficult to interpret classes

35 Unsupervised techniques Objective Produce a change detection map in which changed areas are separated from unchanged ones. The changes sought are assumed to result in larger changes in radiance values than other factors. Comparison is performed directly on the spectral data. source; Norsk Regnesentral website This results in a difference image which is analysed to separate insignificant from significant changes.

36 Supervised techniques Objective Generate a change detection map where changed areas are identified and the land-cover transition type can be identified. The changes are detected and labelled using supervised classification approaches. source; Norsk Regnesentral website Main techniques: Post-classification comparison Multidate direct classification

37 Post classification comparison source; Norsk Regnesentral website Standard supervised classifiers are used to classify the two images independently. Changes are detected by comparing the two classified images. Advantage Common and intuitive. Provides change matrix. Drawback Critically depends on the accuracy of the classification maps. Accuracy close to the product of the two results. Does not exploit the dependence between the information from the two points in time.

38 Post classification comparison

39 Multidate direct classification source; Norsk Regnesentral website Two dates are combined into one multitemporal image and classified. Performs joint classification of the two images by using a stacked feature vector. Change detection is performed by considering each transition as a class, and training the classifier to recognize all classes and all transitions. Advantage Exploits the multitemporal information. Error rate not cumulative. Provides change matrix. Drawback Ground truth required also for transitions.
40 Supervised vs. Unsupervised Level of change detection Change information Change computation Supervised Change detection at decision level. Provides explicit labeling of change and class transitions Obtained directly from the classified images. Unsupervised Change detection at data level. Separates change from no change. Obtained through interpretation of the difference image. Ground truth Requires ground truth. Requires no ground truth. Spectral information. Data requirements Multispectral. Not sensitive to atmospheric conditions and sensor differences. Most methods work on one spectral band. Sensitive to atmospheric conditions and sensor differences.
41 Category III. Classification based approach Techniques Characteristics Advantages Disadvantages Examples Key factors 1. Post classification comparison 2. Spectral temporal combined analysis 3. EM detection Separately classifies multitemporal images into thematic maps, then implements comparison of the classified images, pixel by pixel Puts multi-temporal data into a single file, then classifies the combined dataset and identifies and labels the changes The EM detection is a classification-based method using an expectation maximization (EM) algorithm to estimate the a priori joint class probabilities at two times. These probabilities are estimated directly from the images under analysis Minimizes Requires a great impacts of amount of time and atmospheric, expertise to create sensor and classification environmental products. The final differences accuracy depends on between the quality of the multitemporal classified image of images; provides a each date complete matrix of change information Simple and Difficult to identify timesaving and label the change in classification classes; cannot provide a complete matrix of change information This method was reported to provide higher change detection accuracy than other change detection methods Requires estimating the a priori joint class probability. LULC change, wetland change and urban expansion Changes in coastal zone environments and forest change Land-cover change Selects sufficient training sample data for classification Labels the change classes Estimates the a priori joint class probability
42 Techniques Characteristics Advantages Disadvantages Examples Key factors 4. Unsupervised change detection 5. Hybrid change detection Selects spectrally similar groups of pixels and clusters date 1 image into primary clusters, then labels spectrally similar groups in date 2 image into primary clusters in date 2 image, and finally detects and identifies changes and outputs results Uses an overlay enhancement from a selected image to isolate changed pixels, then uses Supervised classification. A binary change mask is constructed from the classification results. This change mask sieves out the changed themes from the LULC maps produced for each date This method makes use of the unsupervised nature and automation of the change analysis process This method Excludes unchanged pixels classification to reduce classification errors from Difficulty identifying labelling trajectories in and change Requires selection of thresholds to implement classification; somewhat complicated to identify change trajectories Forest hange LULC change, vegetation change and monitoring eelgrass Identifies the spectrally similar or relatively homogeneous units Selects suitable thresholds to identify the change and nonchange areas and develops accurate classifi n output 6. Artificial neural networks (ANN) The input used to train the neural network is the spectral data of the period of change. A backpropagation algorithm is often used to train the multi-layer perceptron neural network model ANN is a nonparametric Supervised method and has the ability to estimate the properties of data based on the training samples The nature of hidden layers is poorly known; a long training time is required. ANN is often sensitive to the amount of training data used. ANN functions are not common in image processing software Mortality detection in Lake, landcover change, forest change, Urban hange The architecture used such as the number of hidden layers, and training samples
43 Category IV. Advanced models Techniques Characteristics Advantages Disadvantages Examples Key factors 1. Li Strahler The Li Strahler canopy model This method combines This method Mapping Develops the reflectance is used to estimate each conifer the techniques of digital requires a large and Stand crown model stand crown cover for two dates image processing of number of field monitoring cover images of imageries separately. remotely sensed data Measurement data. conifer and identifies Comparison of the stand crown with traditional sampling It is complex and mortality the crown covers for two dates is and field observation not available in characteristics conducted to produce the methods. It provides commercial image of vegetation change detection results statistical results and processing types maps showing the software. It is only geometric distribution of suitable for changed patterns vegetation change 2. Spectral Uses spectral mixture analysis to The fractions have This method is Land-cover Identifies mixture derive fraction images. biophysical meanings, regarded as an change, suitable model Endmembers are selected from representing the areal advanced image seasonal endmembers; training areas on the image or proportion of each processing vegetation defines suitable from spectra of materials endmember within the analysis and is patterns and thresholds for occurring in the study area or pixel. The results are somewhat Vegetation each landcover from a relevant spectral library. stable, accurate and complex change Changes are detected by repeatable using TM class based on comparing the before and data fractions after fraction images of each end member. The quantitative changes can be measured by classifying images based on the endmember fractions
44 Category V. GIS based approach Techniques Characteristics Advantages Disadvantages Examples Key factors 3. Integrated GIS and remote Sensing method Incorporates image data and GIS data, such as the overlay of GIS layers directly on image data; moves results of image processing into GIS system for further analysis Allows access of ancillary data to aid interpretation and analysis and has the ability to directly update land-use information in GIS Different data quality from various sources often degrades the results of LULC change detection LULC and urban sprawl The accuracy of different data sources and their registration accuracies between the thematic images 4. GIS approach Integrates past and current maps of land use with topographic and geological data. The image overlaying and binary masking techniques are useful in revealing quantitatively the change dynamics in each category This method allows incorporation of aerial photographic data of current and past land-use data with other map data Different GIS data with different geometric accuracy and classification system degrades the quality of results Urban change And landscape change The accuracy of different data sources and their registration accuracies between the thematic images.
45 Category VI. Visual analysis Techniques Characteristics Advantages Disadvantages Examples Key factors 1. Visual interpretation One band (or VI) from date1 image as red, the same band (or VI) from date2 image as green, and the same band (or VI) from date3 image as blue if available. Visually interprets the colour composite to identify the changed areas. An alternative is to implement on-screen digitizing of changed areas using visual interpretation based on overlaid images of diff. dates Human experience and knowledge are useful during visual interpretation. Two or three dates of images can be analysed at one time. The analyst can incorporate texture, shape, size and patterns intovisual interpretation to make a decision on the LULC change Cannot provide detailed change information. The results depend on the analyst s skill in image interpretation. Timeconsuming and difficulty in updating the results Land-use change, forest change, monitoring selectively logged areas and land cover change Analyst s skill and familiarit y with the study area
46 Category VII. Other change detection techniques 1. Measures of spatial dependence (Henebry 1993) 2. Knowledge-based vision system (Wang 1993) 3. Area production method (Hussin et al. 1994) 4. Combination of three indicators: vegetation indices, land surface temperature, and spatial structure (Lambin and Strahler 1994b) 5. Change curves (Lawrence and Ripple 1999) 6. Generalized linear models (Morisette et al. 1999) 7. Curve-theorem-based approach (Yue et al. 2002) 8. Structure-based approach (Zhang et al. 2002) 9. Spatial statistics-based method (Read and Lam 2002)
47 Factors to consider when choosing a method Objective of the change detection? Monitor/identify specific changes More efficient mapping at T2 Improved quality of mapping at T2 What type of change information to extract? Spectral changes Land cover transitions Shape changes Changes in long temporal series What type of changes to be considered? Land use and land cover change Forest and vegetation change Wetland change Urban change Environmental change
48 Factors to consider Expected amount of changes Available data at date 1 and date 2 Remote sensing data Temporal, spatial and spectral characteristics. Differences in characteristics btw. date 1 and date 2. Classified maps Ground truth Environmental considerations Atmospheric conditions Soil moisture conditions Phenological states Accuracy requirements
49 Comparing the Different Techniques Two types of change detection either detect binary change/non-change, or the detailed from-to change between different classes. Different change detection techniques are often tested and compared based on an accuracy assessment or qualitative assessment. no single method is suitable for all cases. A combination of two change detection techniques can improve the change detection results (image differencing/pca, NDVI/PCA, PCA/CVA). The most common change detection methods: image differencing, PCA, CVA, and post-classification comparison.
50 Global change analyses and image resolution For change detection at high or moderate spatial resolution: use Landsat TM, SPOT, or radar. For change detection at the continental or global scale, use coarse resolution data such as MODIS and AVHRR. AVHRR has daily availability at low cost; it is the best source of data for large area change detection. NDVI and land surface temperatures derived from MODIS or AVHRR thermal bands are especially useful in large area change detection.
51 Threshold Selection Many change detection algorithms require threshold selection to determine whether a pixel has changed. Thresholds can be adjusted manually until the resulting image is satisfactory, or they can be selected statistically using a suitable standard deviation from a class mean. Both are highly subjective methods. Other methods exist for improving the change detection results, such as using fuzzy set and fuzzy membership functions to replace the thresholds. However, threshold selection is simple and intuitive, so it is still the most extensively applied method for detecting binary change/no-change information.
52 Accuracy Assessment Accuracy assessments are important for understanding the change detection results and using these results in decision-making. However, they are difficult to do because reliable temporal field-based datasets are often problematic to collect. The error matrix is the most common method for accuracy assessment. To properly generate one, the following factors must be considered: 1. ground truth data collection, 2. classification scheme, 3. sampling scheme, 4. spatial autocorrelation, and 5. sample size and sample unit.
53 Summary and Recommendations The binary change/no-change threshold techniques all have difficulties in distinguishing true changed areas from the detected change areas. Singleband image differencing and PCA are the recommended methods. Classification-based change detection methods can avoid such problems, but requires more effort to implement. Post-classification comparison is a suitable method when sufficient training data is available. When multi-source data is available, GIS techniques can be helpful. Advanced techniques such as LSMA, ANN, or a combination of change detection methods can produce higher quality change detection results.
54 References MACLEOD, R. D., and CONGALTON, R. G.,A quantitative comparison of change detection algorithms for monitoring eelgrass from remotely sensed data. Photogrammetric Engineering and Remote Sensing, vol. 64, pp , LAMBIN, E. F., and STRAHLER, A. H., 1994b, Indicators of land-cover change for change vector analysis in multitemporal space at coarse spatial scales. International Journal of Remote Sensing, 15, LAMBIN, E. F., and STRAHLER, A. H., 1994a, Change-vector analysis in multitemporal space: a tool to detect and categorize land-cover change processes using high temporal resolution satellite data. Remote Sensing of Environment, 48, GREEN, K., KEMPKA, D., and LACKEY, L., 1994, Using remote sensing to detect and monitor land-cover and land-use change. Photogrammetric Engineering and Remote Sensing, 60, DEER, P. J., 1995, Digital change detection techniques: civilian and military applications. International Symposium on Spectral Sensing Research 1995 Report (Greenbelt, MD: Goddard Space Flight Center), 95/digitalc.htm WANG, F., 1993, A knowledge-based vision system for detecting land change at urban fringes. IEEE Transactions on Geoscience and Remote Sensing, 31, HUSSIN, Y. A., DE GIER, A., and HARGYONO, 1994, Forest cover change detection analysis using remote sensing: a test for the spatially resolved area production model. Fifth European Conference and Exhibition on Geographic Information Systems, EGIS 94 Proceedings, Paris, France, 29 March 29 1 April 1994 (Utrecht: EGIS Foundation), vol. II, pp
55 References LAWRENCE, R. L., and RIPPLE, W. J., 1999, Calculating change curves for multitemporal satellite imagery: Mount St. Helens Remote Sensing of Environment, 67, MORISETTE, J. T., KHORRAM, S., and MACE, T., 1999, Land-cover change detectionenhanced with generalized linear models. International Journal of Remote Sensing, 20, YUE, T. X., CHEN, S. P., XU, B., LIU, Q. S., LI, H. G., LIU, G. H., and YE, Q. H., 2002, A curve-theorem based approach for change detection and its application to Yellow River Delta. International Journal of Remote Sensing, 23, ZHANG, Q., WANG, J., PENG, X., GONG, P., and SHI, P., 2002, Urban build-up land change detection with road density and spectral information from multitemporal Landsat TM data. International Journal of Remote Sensing, 23, READ, J. M., and LAM, N. S.-N., 2002, Spatial methods for characterizing land cover and detecting land over changes for the tropics. International Journal of Remote Sensing, 23, JENSEN, J. R., and TOLL, D. L., 1982, Detecting residential land use development at the urban fringe. Photogrammetric Engineering and Remote Sensing, 48, CHAVEZ, P. S. JR, and MACKINNON, D. J., 1994, Automatic detection of vegetation changes in the southwestern United States using remotely sensed images. Photogrammetric Engineering and Remote Sensing, 60, PILON, P. G., HOWARTH, P. J., BULLOCK, R. A., and ADENIYI, P. O., 1988, An enhanced classification approach to change detection in semi-arid environments. Photogram- metric Engineering and Remote Sensing, 54,
56 References. FUNG, T., and LEDREW, E., 1987, The application of principal component analysis to change detection. Photogrammetric Engineering and Remote Sensing, 53, FUNG, T., 1990, An assessment of TM imagery for land-cover change detection. IEEE Transactions on Geoscience and Remote Sensing, 28, GONG, P., 1993, Change detection using principal component analysis and fuzzy set theory. Canadian Journal of Remote Sensing, 19, FOODY, G. M., 2001, Monitoring the magnitude of land-cover change around the southern limits of the Sahara. Photogrammetric Engineering and Remote Sensing, 67, ABUELGASIM, A. A., ROSS, W. D., GOPAL, S., and WOODCOCK, C. E., 1999, Change detection using adaptive fuzzy neural networks: environmental damage assessment after the Gulf War. Remote Sensing of Environment, 70, DAI, X. L., and KHORRAM, S., 1999, Remotely sensed change detection based on artificial neural networks. Photogrammetric Engineering and Remote Sensing, 65, GOPAL, S., and WOODCOCK, C. E., 1996, Remote sensing of forest change using artificial neural networks. IEEE Transactions on Geoscience and Remote Sensing, 34, GOPAL, S., and WOODCOCK, C. E., 1999, Artificial neural networks for detecting forest change. In Information Processing for Remote Sensing, edited by C. H. Chen (Singapore: World Scientific Publishing Co.), pp
57 References. WOODCOCK, C. E., MACOMBER, S. A., PAX-LENNEY, M., and COHEN, W. B., 2001 Monitoring large areas for forest change using Landsat: generalization across space, time and Landsat sensors. Remote Sensing of Environment, 78, LIU, X., and LATHROP, R. G. JR, 2002, Urban change detection based on an artificial neural network. International Journal of Remote Sensing, 23, ROGAN, J., FRANKLIN, J., and ROBERTS, D. A., 2002, A comparison of methods for monitoring multitemporal vegetation change using Thematic Mapper imagery. Remote Sensing of Environment, 80, KRESSLER, F., and STEINNOCHER, K., 1996, Change detection in urban areas using satellite data and spectral mixture analysis. International Archives of Photogrammetry and Remote Sensing, 31, ADAMS, J. B., SABOL, D., KAPOS, V., FILHO, R. A., ROBERTS, D. A., SMITH, M. O., and GILLESPIE, A. R., 1995, Classification of multispectral images based on fractions of endmembers: application to land-cover change in the Brazilian Amazoˆ n. Remote Sensing of Environment, 52, PETIT, C. C., and LAMBIN, E. F., 2001, Integration of multi-source remote sensing data for land cover change detection. International Journal of Geographical Information Science, 15, LO, C. P., and SHIPMAN, R. L., 1990, A GIS approach to land-use change dynamics detection. Photogrammetric Engineering and Remote Sensing, 56,
Change Detection Techniques using Optical Remote Sensing: A Survey
 American Scientific Research Journal for Engineering, Technology, and Sciences (ASRJETS) ISSN (Print) 2313-4410, ISSN (Online) 2313-4402 Global Society of Scientific Research and Researchers http://asrjetsjournal.org/
Vegetation Change Detection of Central part of Nepal using Landsat TM
 Vegetation Change Detection of Central part of Nepal using Landsat TM Kalpana G. Bastakoti Department of Geography, University of Calgary, kalpanagb@gmail.com Abstract This paper presents a study of detecting
Deriving Uncertainty of Area Estimates from Satellite Imagery using Fuzzy Land-cover Classification
 International Journal of Information and Computation Technology. ISSN 0974-2239 Volume 3, Number 10 (2013), pp. 1059-1066 International Research Publications House http://www. irphouse.com /ijict.htm Deriving
Digital Change Detection Using Remotely Sensed Data for Monitoring Green Space Destruction in Tabriz
 Int. J. Environ. Res. 1 (1): 35-41, Winter 2007 ISSN:1735-6865 Graduate Faculty of Environment University of Tehran Digital Change Detection Using Remotely Sensed Data for Monitoring Green Space Destruction
KNOWLEDGE-BASED CLASSIFICATION OF LAND COVER FOR THE QUALITY ASSESSEMENT OF GIS DATABASE. Israel -
 KNOWLEDGE-BASED CLASSIFICATION OF LAND COVER FOR THE QUALITY ASSESSEMENT OF GIS DATABASE Ammatzia Peled a,*, Michael Gilichinsky b a University of Haifa, Department of Geography and Environmental Studies,
Module 2.1 Monitoring activity data for forests using remote sensing
 Module 2.1 Monitoring activity data for forests using remote sensing Module developers: Frédéric Achard, European Commission (EC) Joint Research Centre (JRC) Jukka Miettinen, EC JRC Brice Mora, Wageningen
IMAGE CLASSIFICATION TOOL FOR LAND USE / LAND COVER ANALYSIS: A COMPARATIVE STUDY OF MAXIMUM LIKELIHOOD AND MINIMUM DISTANCE METHOD
 IMAGE CLASSIFICATION TOOL FOR LAND USE / LAND COVER ANALYSIS: A COMPARATIVE STUDY OF MAXIMUM LIKELIHOOD AND MINIMUM DISTANCE METHOD Manisha B. Patil 1, Chitra G. Desai 2 and * Bhavana N. Umrikar 3 1 Department
Data Fusion and Multi-Resolution Data
 Data Fusion and Multi-Resolution Data Nature.com www.museevirtuel-virtualmuseum.ca www.srs.fs.usda.gov Meredith Gartner 3/7/14 Data fusion and multi-resolution data Dark and Bram MAUP and raster data Hilker
A Method to Improve the Accuracy of Remote Sensing Data Classification by Exploiting the Multi-Scale Properties in the Scene
 Proceedings of the 8th International Symposium on Spatial Accuracy Assessment in Natural Resources and Environmental Sciences Shanghai, P. R. China, June 25-27, 2008, pp. 183-188 A Method to Improve the
Landuse and Landcover change analysis in Selaiyur village, Tambaram taluk, Chennai
 Landuse and Landcover change analysis in Selaiyur village, Tambaram taluk, Chennai K. Ilayaraja Department of Civil Engineering BIST, Bharath University Selaiyur, Chennai 73 ABSTRACT The synoptic picture
Accuracy analysis of remote sensing change detection by rule-based rationality evaluation with post-classification comparison
 INT. J. REMOTE SENSING, 10MARCH, 2004, VOL. 25, NO. 5, 1037 1050 Accuracy analysis of remote sensing change detection by rule-based rationality evaluation with post-classification comparison H. LIU Department
An Automated Object-Oriented Satellite Image Classification Method Integrating the FAO Land Cover Classification System (LCCS).
.") An Automated Object-Oriented Satellite Image Classification Method Integrating the FAO Land Cover Classification System (LCCS). Ruvimbo Gamanya Sibanda Prof. Dr. Philippe De Maeyer Prof. Dr. Morgan De
An Automated Object-Oriented Satellite Image Classification Method Integrating the FAO Land Cover Classification System (LCCS). Ruvimbo Gamanya Sibanda Prof. Dr. Philippe De Maeyer Prof. Dr. Morgan De
IMPROVING REMOTE SENSING-DERIVED LAND USE/LAND COVER CLASSIFICATION WITH THE AID OF SPATIAL INFORMATION
 IMPROVING REMOTE SENSING-DERIVED LAND USE/LAND COVER CLASSIFICATION WITH THE AID OF SPATIAL INFORMATION Yingchun Zhou1, Sunil Narumalani1, Dennis E. Jelinski2 Department of Geography, University of Nebraska,
M.C.PALIWAL. Department of Civil Engineering NATIONAL INSTITUTE OF TECHNICAL TEACHERS TRAINING & RESEARCH, BHOPAL (M.P.), INDIA
, INDIA") INVESTIGATIONS ON THE ACCURACY ASPECTS IN THE LAND USE/LAND COVER MAPPING USING REMOTE SENSING SATELLITE IMAGERY By M.C.PALIWAL Department of Civil Engineering NATIONAL INSTITUTE OF TECHNICAL TEACHERS
INVESTIGATIONS ON THE ACCURACY ASPECTS IN THE LAND USE/LAND COVER MAPPING USING REMOTE SENSING SATELLITE IMAGERY By M.C.PALIWAL Department of Civil Engineering NATIONAL INSTITUTE OF TECHNICAL TEACHERS
Detecting Landscape Changes in High Latitude Environments Using Landsat Trend Analysis: 2. Classification
 1 Detecting Landscape Changes in High Latitude Environments Using Landsat Trend Analysis: 2. Classification Ian Olthof and Robert H. Fraser Canada Centre for Mapping and Earth Observation Natural Resources
GLOBAL/CONTINENTAL LAND COVER MAPPING AND MONITORING
 GLOBAL/CONTINENTAL LAND COVER MAPPING AND MONITORING Ryutaro Tateishi, Cheng Gang Wen, and Jong-Geol Park Center for Environmental Remote Sensing (CEReS), Chiba University 1-33 Yayoi-cho Inage-ku Chiba
Land cover/land use mapping and cha Mongolian plateau using remote sens. Title. Author(s) Bagan, Hasi; Yamagata, Yoshiki. Citation Japan.
 Bagan, Hasi; Yamagata, Yoshiki. Citation Japan.") Title Land cover/land use mapping and cha Mongolian plateau using remote sens Author(s) Bagan, Hasi; Yamagata, Yoshiki International Symposium on "The Imp Citation Region Specific Systems". 6 Nove Japan.
Title Land cover/land use mapping and cha Mongolian plateau using remote sens Author(s) Bagan, Hasi; Yamagata, Yoshiki International Symposium on "The Imp Citation Region Specific Systems". 6 Nove Japan.
Land Cover Classification Over Penang Island, Malaysia Using SPOT Data
 Land Cover Classification Over Penang Island, Malaysia Using SPOT Data School of Physics, Universiti Sains Malaysia, 11800 Penang, Malaysia. Tel: +604-6533663, Fax: +604-6579150 E-mail: hslim@usm.my, mjafri@usm.my,
Overview of Remote Sensing in Natural Resources Mapping
 Overview of Remote Sensing in Natural Resources Mapping What is remote sensing? Why remote sensing? Examples of remote sensing in natural resources mapping Class goals What is Remote Sensing A remote sensing
Methods review for the Global Land Cover 2000 initiative Presentation made by Frédéric Achard on November 30 th 2000
 Methods review for the Global Land Cover 2000 initiative Presentation made by Frédéric Achard on November 30 th 2000 1. Contents Objectives Specifications of the GLC-2000 exercise Strategy for the analysis
AN INVESTIGATION OF AUTOMATIC CHANGE DETECTION FOR TOPOGRAPHIC MAP UPDATING
 AN INVESTIGATION OF AUTOMATIC CHANGE DETECTION FOR TOPOGRAPHIC MAP UPDATING Patricia Duncan 1 & Julian Smit 2 1 The Chief Directorate: National Geospatial Information, Department of Rural Development and
MODULE 5 LECTURE NOTES 5 PRINCIPAL COMPONENT ANALYSIS
 MODULE 5 LECTURE NOTES 5 PRINCIPAL COMPONENT ANALYSIS. (PCA) Principal component analysis (PCA), also known as Karhunen-Loeve analysis, transforms the information inherent in multispectral remotely sensed
A COMPARISON OF SPECTRAL MIXTURE ANALYSIS METHODS FOR URBAN LANDSCAPE USING LANDSAT ETM+ DATA: LOS ANGELES, CA
 A COMPARISO OF SPECTRAL MIXTURE AALYSIS METHODS FOR URBA LADSCAPE USIG LADSAT ETM+ DATA: LOS AGELES, CA Xianfeng Chen a and Lin Li b a Slippery Rock University of Pennsylvania, Slippery Rock, PA 657, USA
Urban remote sensing: from local to global and back
 Urban remote sensing: from local to global and back Paolo Gamba University of Pavia, Italy A few words about Pavia Historical University (1361) in a nice town slide 3 Geoscience and Remote Sensing Society
Change detection techniques
 INT. J. REMOTE SENSING, 2003, VOL. 25, NO. 12, 2365 2407 Change detection techniques D. LU*{, P. MAUSEL{, E. BRONDÍZIO and E. MORAN{ {Center for the Study of Institutions, Population, and Environmental
LAND COVER CATEGORY DEFINITION BY IMAGE INVARIANTS FOR AUTOMATED CLASSIFICATION
 LAND COVER CATEGORY DEFINITION BY IMAGE INVARIANTS FOR AUTOMATED CLASSIFICATION Nguyen Dinh Duong Environmental Remote Sensing Laboratory Institute of Geography Hoang Quoc Viet Rd., Cau Giay, Hanoi, Vietnam
The Wide Dynamic Range Vegetation Index and its Potential Utility for Gap Analysis
 Summary StatMod provides an easy-to-use and inexpensive tool for spatially applying the classification rules generated from the CT algorithm in S-PLUS. While the focus of this article was to use StatMod
EMPIRICAL ESTIMATION OF VEGETATION PARAMETERS USING MULTISENSOR DATA FUSION
 EMPIRICAL ESTIMATION OF VEGETATION PARAMETERS USING MULTISENSOR DATA FUSION Franz KURZ and Olaf HELLWICH Chair for Photogrammetry and Remote Sensing Technische Universität München, D-80290 Munich, Germany
MAPPING LAND USE/ LAND COVER OF WEST GODAVARI DISTRICT USING NDVI TECHNIQUES AND GIS Anusha. B 1, Sridhar. P 2
 MAPPING LAND USE/ LAND COVER OF WEST GODAVARI DISTRICT USING NDVI TECHNIQUES AND GIS Anusha. B 1, Sridhar. P 2 1 M. Tech. Student, Department of Geoinformatics, SVECW, Bhimavaram, A.P, India 2 Assistant
 International Environmental Modelling and Software Society (iemss) 01 International Congress on Environmental Modelling and Software Managing Resources of a Limited Planet, Sixth Biennial Meeting, Leipzig,
o 3000 Hannover, Fed. Rep. of Germany
 1. Abstract The use of SPOT and CIR aerial photography for urban planning P. Lohmann, G. Altrogge Institute for Photogrammetry and Engineering Surveys University of Hannover, Nienburger Strasse 1 o 3000
A GLOBAL ANALYSIS OF URBAN REFLECTANCE. Christopher SMALL
 A GLOBAL ANALYSIS OF URBAN REFLECTANCE Christopher SMALL Lamont Doherty Earth Observatory Columbia University Palisades, NY 10964 USA small@ldeo.columbia.edu ABSTRACT Spectral characterization of urban
Joint International Mechanical, Electronic and Information Technology Conference (JIMET 2015)
") Joint International Mechanical, Electronic and Information Technology Conference (JIMET 2015) Extracting Land Cover Change Information by using Raster Image and Vector Data Synergy Processing Methods Tao
Joint International Mechanical, Electronic and Information Technology Conference (JIMET 2015) Extracting Land Cover Change Information by using Raster Image and Vector Data Synergy Processing Methods Tao
Comparison between Land Surface Temperature Retrieval Using Classification Based Emissivity and NDVI Based Emissivity
 Comparison between Land Surface Temperature Retrieval Using Classification Based Emissivity and NDVI Based Emissivity Isabel C. Perez Hoyos NOAA Crest, City College of New York, CUNY, 160 Convent Avenue,
7.1 INTRODUCTION 7.2 OBJECTIVE
 7 LAND USE AND LAND COVER 7.1 INTRODUCTION The knowledge of land use and land cover is important for many planning and management activities as it is considered as an essential element for modeling and
EFFECT OF ANCILLARY DATA ON THE PERFORMANCE OF LAND COVER CLASSIFICATION USING A NEURAL NETWORK MODEL. Duong Dang KHOI.
 EFFECT OF ANCILLARY DATA ON THE PERFORMANCE OF LAND COVER CLASSIFICATION USING A NEURAL NETWORK MODEL Duong Dang KHOI 1 10 Feb, 2011 Presentation contents 1. Introduction 2. Methods 3. Results 4. Discussion
Greening of Arctic: Knowledge and Uncertainties
 Greening of Arctic: Knowledge and Uncertainties Jiong Jia, Hesong Wang Chinese Academy of Science jiong@tea.ac.cn Howie Epstein Skip Walker Moscow, January 28, 2008 Global Warming and Its Impact IMPACTS
GNR401 Principles of Satellite Image Processing
 Principles of Satellite Image Processing Instructor: Prof. CSRE, IIT Bombay bkmohan@csre.iitb.ac.in Slot 5 Guest Lecture PCT and Band Arithmetic November 07, 2012 9.30 AM 10.55 AM IIT Bombay Slide 1 November
Impacts of sensor noise on land cover classifications: sensitivity analysis using simulated noise
 Impacts of sensor noise on land cover classifications: sensitivity analysis using simulated noise Scott Mitchell 1 and Tarmo Remmel 2 1 Geomatics & Landscape Ecology Research Lab, Carleton University,
A SURVEY OF REMOTE SENSING IMAGE CLASSIFICATION APPROACHES
 IJAMML 3:1 (2015) 1-11 September 2015 ISSN: 2394-2258 Available at http://scientificadvances.co.in DOI: http://dx.doi.org/10.18642/ijamml_7100121516 A SURVEY OF REMOTE SENSING IMAGE CLASSIFICATION APPROACHES
LAND USE MAPPING AND MONITORING IN THE NETHERLANDS (LGN5)
") LAND USE MAPPING AND MONITORING IN THE NETHERLANDS (LGN5) Hazeu, Gerard W. Wageningen University and Research Centre - Alterra, Centre for Geo-Information, The Netherlands; gerard.hazeu@wur.nl ABSTRACT
LAND USE MAPPING AND MONITORING IN THE NETHERLANDS (LGN5) Hazeu, Gerard W. Wageningen University and Research Centre - Alterra, Centre for Geo-Information, The Netherlands; gerard.hazeu@wur.nl ABSTRACT
APPENDIX. Normalized Difference Vegetation Index (NDVI) from MODIS data
 from MODIS data") APPENDIX Land-use/land-cover composition of Apulia region Overall, more than 82% of Apulia contains agro-ecosystems (Figure ). The northern and somewhat the central part of the region include arable lands
APPENDIX Land-use/land-cover composition of Apulia region Overall, more than 82% of Apulia contains agro-ecosystems (Figure ). The northern and somewhat the central part of the region include arable lands
Remote detection of giant reed invasions in riparian habitats: challenges and opportunities for management planning
 Remote detection of giant reed invasions in riparian habitats: challenges and opportunities for management planning Maria do Rosário Pereira Fernandes Forest Research Centre, University of Lisbon Number
Drought Estimation Maps by Means of Multidate Landsat Fused Images
 Remote Sensing for Science, Education, Rainer Reuter (Editor) and Natural and Cultural Heritage EARSeL, 2010 Drought Estimation Maps by Means of Multidate Landsat Fused Images Diego RENZA, Estíbaliz MARTINEZ,
Remote sensing Based Assessment of Urban Heat Island Phenomenon in Nagpur Metropolitan Area
 International Journal of Information & Computation Technology. ISSN 0974-2239 Volume 4, Number 11 (2014), pp. 1069-1074 International Research Publications House http://www. irphouse.com Remote sensing
Advanced Image Analysis in Disaster Response
 Advanced Image Analysis in Disaster Response Creating Geographic Knowledge Thomas Harris ITT The information contained in this document pertains to software products and services that are subject to the
Land Use MTRI Documenting Land Use and Land Cover Conditions Synthesis Report
 Colin Brooks, Rick Powell, Laura Bourgeau-Chavez, and Dr. Robert Shuchman Michigan Tech Research Institute (MTRI) Project Introduction Transportation projects require detailed environmental information
Many of remote sensing techniques are generic in nature and may be applied to a variety of vegetated landscapes, including
 Remote Sensing of Vegetation Many of remote sensing techniques are generic in nature and may be applied to a variety of vegetated landscapes, including 1. Agriculture 2. Forest 3. Rangeland 4. Wetland,
Environmental Impact Assessment Land Use and Land Cover CISMHE 7.1 INTRODUCTION
 7 LAND USE AND LAND COVER 7.1 INTRODUCTION The knowledge of land use and land cover is important for many planning and management activities as it is considered an essential element for modeling and understanding
STUDY OF NORMALIZED DIFFERENCE BUILT-UP (NDBI) INDEX IN AUTOMATICALLY MAPPING URBAN AREAS FROM LANDSAT TM IMAGERY
 INDEX IN AUTOMATICALLY MAPPING URBAN AREAS FROM LANDSAT TM IMAGERY") STUDY OF NORMALIZED DIFFERENCE BUILT-UP (NDBI) INDEX IN AUTOMATICALLY MAPPING URBAN AREAS FROM LANDSAT TM IMAGERY Dr. Hari Krishna Karanam Professor, Civil Engineering, Dadi Institute of Engineering &
STUDY OF NORMALIZED DIFFERENCE BUILT-UP (NDBI) INDEX IN AUTOMATICALLY MAPPING URBAN AREAS FROM LANDSAT TM IMAGERY Dr. Hari Krishna Karanam Professor, Civil Engineering, Dadi Institute of Engineering &
Applications of GIS and Remote Sensing for Analysis of Urban Heat Island
 Chuanxin Zhu Professor Peter V. August Professor Yeqiao Wang NRS 509 December 15, 2016 Applications of GIS and Remote Sensing for Analysis of Urban Heat Island Since the last century, the global mean surface
Progress Report Year 2, NAG5-6003: The Dynamics of a Semi-Arid Region in Response to Climate and Water-Use Policy
 Progress Report Year 2, NAG5-6003: The Dynamics of a Semi-Arid Region in Response to Climate and Water-Use Policy Principal Investigator: Dr. John F. Mustard Department of Geological Sciences Brown University
DETECTION OF CHANGES IN FOREST LANDCOVER TYPE AFTER FIRES IN PORTUGAL
 DETECTION OF CHANGES IN FOREST LANDCOVER TYPE AFTER FIRES IN PORTUGAL Paulo M. Barbosa, Mário R. Caetano, and Teresa G. Santos Centro Nacional de Informação Geográfica (CNIG), Portugal barp@cnig.pt, mario@cnig.pt,
Monitoring Vegetation Growth of Spectrally Landsat Satellite Imagery ETM+ 7 & TM 5 for Western Region of Iraq by Using Remote Sensing Techniques.
 Monitoring Vegetation Growth of Spectrally Landsat Satellite Imagery ETM+ 7 & TM 5 for Western Region of Iraq by Using Remote Sensing Techniques. Fouad K. Mashee, Ahmed A. Zaeen & Gheidaa S. Hadi Remote
ANALYSIS AND VALIDATION OF A METHODOLOGY TO EVALUATE LAND COVER CHANGE IN THE MEDITERRANEAN BASIN USING MULTITEMPORAL MODIS DATA
 PRESENT ENVIRONMENT AND SUSTAINABLE DEVELOPMENT, NR. 4, 2010 ANALYSIS AND VALIDATION OF A METHODOLOGY TO EVALUATE LAND COVER CHANGE IN THE MEDITERRANEAN BASIN USING MULTITEMPORAL MODIS DATA Mara Pilloni
Defining microclimates on Long Island using interannual surface temperature records from satellite imagery
 Defining microclimates on Long Island using interannual surface temperature records from satellite imagery Deanne Rogers*, Katherine Schwarting, and Gilbert Hanson Dept. of Geosciences, Stony Brook University,
MULTI-CHANNEL REMOTE SENSING DATA AND ORTHOGONAL TRANSFORMATIONS FOR CHANGE DETECTION 1
 MULTI-CHANNEL REMOTE SENSING DATA AND ORTHOGONAL TRANSFORMATIONS FOR CHANGE DETECTION 1 Allan Aasbjerg Nielsen IMM, Department of Mathematical Modelling Technical University of Denmark, Building 321 DK
DAMAGE DETECTION OF THE 2008 SICHUAN, CHINA EARTHQUAKE FROM ALOS OPTICAL IMAGES
 DAMAGE DETECTION OF THE 2008 SICHUAN, CHINA EARTHQUAKE FROM ALOS OPTICAL IMAGES Wen Liu, Fumio Yamazaki Department of Urban Environment Systems, Graduate School of Engineering, Chiba University, 1-33,
DEVELOPMENT OF DIGITAL CARTOGRAPHIC DATABASE FOR MANAGING THE ENVIRONMENT AND NATURAL RESOURCES IN THE REPUBLIC OF SERBIA
 DEVELOPMENT OF DIGITAL CARTOGRAPHIC BASE FOR MANAGING THE ENVIRONMENT AND NATURAL RESOURCES IN THE REPUBLIC OF SERBIA Dragutin Protic, Ivan Nestorov Institute for Geodesy, Faculty of Civil Engineering,
Land cover classification methods
 Land cover classification methods This document provides an overview of land cover classification using remotely sensed data. We will describe different options for conducting land cover classification
Preparation of LULC map from GE images for GIS based Urban Hydrological Modeling
 International Conference on Modeling Tools for Sustainable Water Resources Management Department of Civil Engineering, Indian Institute of Technology Hyderabad: 28-29 December 2014 Abstract Preparation
Identifying Audit, Evidence Methodology and Audit Design Matrix (ADM)
") 11 Identifying Audit, Evidence Methodology and Audit Design Matrix (ADM) 27/10/2012 Exercise XXX 2 LEARNING OBJECTIVES At the end of this session participants will be able to: 1. Identify types and sources
11 Identifying Audit, Evidence Methodology and Audit Design Matrix (ADM) 27/10/2012 Exercise XXX 2 LEARNING OBJECTIVES At the end of this session participants will be able to: 1. Identify types and sources
OBJECT BASED IMAGE ANALYSIS FOR URBAN MAPPING AND CITY PLANNING IN BELGIUM. P. Lemenkova
 Fig. 3 The fragment of 3D view of Tambov spatial model References 1. Nemtinov,V.A. Information technology in development of spatial-temporal models of the cultural heritage objects: monograph / V.A. Nemtinov,
Remote sensing of sealed surfaces and its potential for monitoring and modeling of urban dynamics
 Remote sensing of sealed surfaces and its potential for monitoring and modeling of urban dynamics Frank Canters CGIS Research Group, Department of Geography Vrije Universiteit Brussel Herhaling titel van
URBAN CHANGE DETECTION AND ANALYSIS IN THE GREATER TORONTO AREA FROM 1972 TO 2004 USING REMOTE SENSING AND GIS. Paul (Baorong) Du.
 Du.") URBAN CHANGE DETECTION AND ANALYSIS IN THE GREATER TORONTO AREA FROM 1972 TO 2004 USING REMOTE SENSING AND GIS by Paul (Baorong) Du A research paper presented to Ryerson University in partial fulfillment
URBAN CHANGE DETECTION AND ANALYSIS IN THE GREATER TORONTO AREA FROM 1972 TO 2004 USING REMOTE SENSING AND GIS by Paul (Baorong) Du A research paper presented to Ryerson University in partial fulfillment
Overview on Land Cover and Land Use Monitoring in Russia
 Russian Academy of Sciences Space Research Institute Overview on Land Cover and Land Use Monitoring in Russia Sergey Bartalev Joint NASA LCLUC Science Team Meeting and GOFC-GOLD/NERIN, NEESPI Workshop
Use of Corona, Landsat TM, Spot 5 images to assess 40 years of land use/cover changes in Cavusbasi
 New Strategies for European Remote Sensing, Olui (ed.) 2005 Millpress, Rotterdam, ISBN 90 5966 003 X Use of Corona, Landsat TM, Spot 5 images to assess 40 years of land use/cover changes in Cavusbasi N.
Comparative Analysis of Supervised and
 Applied Mathematical Sciences, Vol.,, no., 68-69 HIKARI Ltd, www.m-hikari.com http://dx.doi.org/.988/ams.. Comparative Analysis of Supervised and Unsupervised Classification on Multispectral Data Asmala
Quick Response Report #126 Hurricane Floyd Flood Mapping Integrating Landsat 7 TM Satellite Imagery and DEM Data
 Quick Response Report #126 Hurricane Floyd Flood Mapping Integrating Landsat 7 TM Satellite Imagery and DEM Data Jeffrey D. Colby Yong Wang Karen Mulcahy Department of Geography East Carolina University
CHAPTER-7 INTERFEROMETRIC ANALYSIS OF SPACEBORNE ENVISAT-ASAR DATA FOR VEGETATION CLASSIFICATION
 147 CHAPTER-7 INTERFEROMETRIC ANALYSIS OF SPACEBORNE ENVISAT-ASAR DATA FOR VEGETATION CLASSIFICATION 7.1 INTRODUCTION: Interferometric synthetic aperture radar (InSAR) is a rapidly evolving SAR remote
Landcover Dynamics in the Niger Inland Delta (Mali)
") Fakultät Forst-, Geo- Hydrowissenschaften Institut f. Photogrammetrie & Fernerkundung, Professur Fernerkundung Landcover Dynamics in the Niger Inland Delta (Mali) A Classification Approach for MERIS Data
Fakultät Forst-, Geo- Hydrowissenschaften Institut f. Photogrammetrie & Fernerkundung, Professur Fernerkundung Landcover Dynamics in the Niger Inland Delta (Mali) A Classification Approach for MERIS Data
Lecture Topics. 1. Vegetation Indices 2. Global NDVI data sets 3. Analysis of temporal NDVI trends
 Lecture Topics 1. Vegetation Indices 2. Global NDVI data sets 3. Analysis of temporal NDVI trends Why use NDVI? Normalize external effects of sun angle, viewing angle, and atmospheric effects Normalize
Urban Growth Analysis In Akure Metropolis
 Urban Growth Analysis In Akure Metropolis Olaoluwa A. Idayat, Samson A. Samuel, Muibi K.H, Ogbole John, Alaga A, T., Ajayi Victoria Abstract: Urban Land use changes, quantification and the analysis of
Sparse Representation-based Analysis of Hyperspectral Remote Sensing Data
 Sparse Representation-based Analysis of Hyperspectral Remote Sensing Data Ribana Roscher Institute of Geodesy and Geoinformation Remote Sensing Group, University of Bonn 1 Remote Sensing Image Data Remote
USE OF RADIOMETRICS IN SOIL SURVEY
 USE OF RADIOMETRICS IN SOIL SURVEY Brian Tunstall 2003 Abstract The objectives and requirements with soil mapping are summarised. The capacities for different methods to address these objectives and requirements
Image classification. Mário Caetano. September 4th, 2007 Lecture D2L4
 Image classification Mário Caetano September 4th, 2007 Lecture D2L4 Goals 1 From data to information: presentation of different mapping approaches 2 Most common problems in image classification and how
IAPRS, Vol. XXXIII, Amsterdam, 2000 THE CONTRIBUTION OF GIS AND REMOTE SENSING IN URBAN LAND USE NEGOTIATION IN DEVELOPING COUNTRIES
 THE CONTRIBUTION OF GIS AND REMOTE SENSING IN URBAN LAND USE NEGOTIATION IN DEVELOPING COUNTRIES Faith KARANJA*and Peter LOHMANN** University of Hannover Institute of Photogrammetry and Engineering Surveys(IPI)
Geospatial technology for land cover analysis
 Home Articles Application Environment & Climate Conservation & monitoring Published in : Middle East & Africa Geospatial Digest November 2013 Lemenkova Polina Charles University in Prague, Faculty of Science,
STUDY ON FOREST VEGETATION CLASSIFICATION BASED ON MULTI- TEMPORAL REMOTE SENSING IMAGES
 STUDY ON FOREST VEGETATION CLASSIFICATION BASED ON MULTI- TEMPORAL REMOTE SENSING IMAGES Xia Jing 1, 2, JiHua Wang 2, WenJiang Huang 2,*, LiangYun Liu 2, JinDi Wang 1 1 School of Geography, Beijing Normal
IDENTIFICATION OF TRENDS IN LAND USE/LAND COVER CHANGES IN THE MOUNT CAMEROON FOREST REGION
 IDENTIFICATION OF TRENDS IN LAND USE/LAND COVER CHANGES IN THE MOUNT CAMEROON FOREST REGION By Nsorfon Innocent F. April 2008 Content Introduction Problem Statement Research questions/objectives Methodology
LAND COVER AND LAND USE CHANGE DETECTION AND ANALYSES IN PLOVDIV, BULGARIA, BETWEEN 1986 AND 2000
 LAND COVER AND LAND USE CHANGE DETECTION AND ANALYSES IN PLOVDIV, BULGARIA, BETWEEN 1986 AND 2000 Boriana Pangelova, GIS Analyst CABRERA SERVICES 473 Silver Lane East Hartford, CT 06118 BPangelova@cabreraservices.com
1. Introduction. S.S. Patil 1, Sachidananda 1, U.B. Angadi 2, and D.K. Prabhuraj 3
 Cloud Publications International Journal of Advanced Remote Sensing and GIS 2014, Volume 3, Issue 1, pp. 525-531, Article ID Tech-249 ISSN 2320-0243 Research Article Open Access Machine Learning Technique
What is a vegetation index?
 Vegetation indexes What is a vegetation index? A tool: a vegetation index is a mathematical formula used to estimate the likelihood of vegetation presence in remotely sensed data A product: the result
Change Detection Over Sokolov Open Pit Mine Areas, Czech Republic, Using Multi Temporal HyMAP Data ( )
") Change Detection Over Sokolov Open Pit Mine Areas, Czech Republic, Using Multi Temporal HyMAP Data (2009 2010) S. Adar* a G. Notesco b, A. Brook b, I. Livne b, P. Rojik c, V. Kopackova d, K. Zelenkova
Change Detection Over Sokolov Open Pit Mine Areas, Czech Republic, Using Multi Temporal HyMAP Data (2009 2010) S. Adar* a G. Notesco b, A. Brook b, I. Livne b, P. Rojik c, V. Kopackova d, K. Zelenkova
This module presents remotely sensed assessment (choice of sensors and resolutions; airborne or ground based sensors; ground truthing)
") This module presents remotely sensed assessment (choice of sensors and resolutions; airborne or ground based sensors; ground truthing) 1 In this presentation you will be introduced to approaches for using
This module presents remotely sensed assessment (choice of sensors and resolutions; airborne or ground based sensors; ground truthing) 1 In this presentation you will be introduced to approaches for using
2 Dr.M.Senthil Murugan
 International Journal of Scientific & Engineering Research, Volume 4, Issue 11, November-2013 186 Comparative Study On Hyperspectral Remote Sensing Images Classification Approaches 1 R.Priya 2 Dr.M.Senthil
DETECTION AND ANALYSIS OF LAND-USE/LAND-COVER CHANGES IN NAY PYI TAW, MYANMAR USING SATELLITE REMOTE SENSING IMAGES
 DETECTION AND ANALYSIS OF LAND-USE/LAND-COVER CHANGES IN NAY PYI TAW, MYANMAR USING SATELLITE REMOTE SENSING IMAGES Kay Khaing Oo 1, Eiji Nawata 1, Kiyoshi Torii 2 and Ke-Sheng Cheng 3 1 Division of Environmental
Evaluation of Land Surface Temperature and Vegetation Relation Based on Landsat TM5 Data
 SCIREA Journal of Geosciences http://www.scirea.org/journal/geosciences October 15, 2016 Volume 1, Issue1, October 2016 Evaluation of Land Surface Temperature and Vegetation Relation Based on Landsat TM5
Using MERIS and MODIS for Land Cover Mapping in the Netherlands
 Using MERIS and for Land Cover Mapping in the Netherlands Raul Zurita Milla, Michael Schaepman and Jan Clevers Wageningen University, Centre for Geo-Information, NL Introduction Actual and reliable information
International Journal of Scientific & Engineering Research, Volume 6, Issue 7, July ISSN
 International Journal of Scientific & Engineering Research, Volume 6, Issue 7, July-2015 1428 Accuracy Assessment of Land Cover /Land Use Mapping Using Medium Resolution Satellite Imagery Paliwal M.C &.
Classification Techniques with Applications in Remote Sensing
 Classification Techniques with Applications in Remote Sensing Hunter Glanz California Polytechnic State University San Luis Obispo November 1, 2017 Glanz Land Cover Classification November 1, 2017 1 /
COMPARISON OF PIXEL-BASED AND OBJECT-BASED CLASSIFICATION METHODS FOR SEPARATION OF CROP PATTERNS
 COMPARISON OF PIXEL-BASED AND OBJECT-BASED CLASSIFICATION METHODS FOR SEPARATION OF CROP PATTERNS Levent BAŞAYİĞİT, Rabia ERSAN Suleyman Demirel University, Agriculture Faculty, Soil Science and Plant
This is trial version
 Journal of Rangeland Science, 2012, Vol. 2, No. 2 J. Barkhordari and T. Vardanian/ 459 Contents available at ISC and SID Journal homepage: www.rangeland.ir Full Paper Article: Using Post-Classification
Analysis of Urban Surface Biophysical Descriptors and Land Surface Temperature Variations in Jimeta City, Nigeria
 Global Journal of Human Social Science Vol. 10 Issue 1 (Ver 1.0), April 2010 Page 19 Analysis of Urban Surface Biophysical Descriptors and Land Surface Temperature Variations in Jimeta City, Nigeria Ambrose
VISUALIZATION URBAN SPATIAL GROWTH OF DESERT CITIES FROM SATELLITE IMAGERY: A PRELIMINARY STUDY
 CO-439 VISUALIZATION URBAN SPATIAL GROWTH OF DESERT CITIES FROM SATELLITE IMAGERY: A PRELIMINARY STUDY YANG X. Florida State University, TALLAHASSEE, FLORIDA, UNITED STATES ABSTRACT Desert cities, particularly
Review of Techniques Used For the Detection of Change in Remotely Sensed Images
 Review of Techniques Used For the Detection of Change in Remotely Sensed Images Sonia Attri 1, Mohit trehan 2 1 Student, Deptt.of CSE, GCET, Gurdaspur, Punjab, India 2 A.P (CSE), GCET, Gurdaspur, Punjab,
Land Use Land Cover Change in Active Flood Plain using Satellite Remote Sensing
 Jour. Agric. Physics, Vol. 8, pp. 22-28 (2008) Land Use Land Cover Change in Active Flood Plain using Satellite Remote Sensing GOPAL KUMAR, R.N. SAHOO, R.K. TOMAR, M. BHAVANARAYANA, V.K. GUPTA, C.S.RAO,
Land cover classification methods. Ned Horning
 Land cover classification methods Ned Horning Version: 1.0 Creation Date: 2004-01-01 Revision Date: 2004-01-01 License: This document is licensed under a Creative Commons Attribution-Share Alike 3.0 Unported
Abstract. TECHNOFAME- A Journal of Multidisciplinary Advance Research. Vol.2 No. 2, (2013) Received: Feb.2013; Accepted Oct.
 Received: Feb.2013; Accepted Oct.") Vol.2 No. 2, 83-87 (2013) Received: Feb.2013; Accepted Oct. 2013 Landuse Pattern Analysis Using Remote Sensing: A Case Study of Morar Block, of Gwalior District, M.P. Subhash Thakur 1 Akhilesh Singh 2
Vol.2 No. 2, 83-87 (2013) Received: Feb.2013; Accepted Oct. 2013 Landuse Pattern Analysis Using Remote Sensing: A Case Study of Morar Block, of Gwalior District, M.P. Subhash Thakur 1 Akhilesh Singh 2
Use of normalized difference built-up index in automatically mapping urban areas from TM imagery
 INT. J. REMOTE SENSING, 2003, VOL. 24, NO. 3, 583 594 Use of normalized difference built-up index in automatically mapping urban areas from TM imagery Y. ZHA College of Geographical Sciences, Nanjing Normal