Research Exercise 1: Instructions
|
|
|
- Judith Allison
- 5 years ago
- Views:
Transcription
1 Research Exercise 1: Instructions Instructions: 1. Cross-national scatter plots of trade openness and economic performance. a. Create a scatter plot with some measure of trade openness on the x-axis and some measure of economic performance on the y-axis for the year We recommend that you use the Quality of Government data set ( but you may also use another data set if you like. If you use the QoG data set, look through the codebook to choose your measures. The data and codebook will be posted on the class website under Week 2. b. Explain (briefly) which variables you used, why you chose them, and assess the strengths and weaknesses of the variables. c. Analyze the scatter plot. What does it tell you about the relationship between trade openness and economic growth? What are some limitations of the graph? (e.g., why might the apparent relationship not really be what it appears to be?) d. Create a second scatter plot that is different in some way from the first. For example, use a different year, or a different measure for the x or y axis (but it should still be trade and economic performance), or a subset of countries (for example, only poor countries, or only rich countries, or only small or large population countries, or only Asian or European or African countries, or a different year, or a different measure of trade openness and/or economic performance, or whatever) e. Analyze the second scatter plot, including comparing/contrasting it with the first. 2. Create a time series plot of trade policy and economic performance. a. Look at Table A2 in Wacziarg & Welch (posted on class website under Week 1) to identify a country that changed its policy, and what year it changed its policy: Then make a timeline for that country of economic performance (it can be GDP growth or GDP per capita growth or GDP or GDP per capita, for example). b. Analyze the time-series plot. Look at the year when the country changed its trade policy, and see if you think that the change in trade policy led to a change in economic performance. Explain what kind of change the readings would predict, and whether that change actually happened for that country. Below are step-by-step instructions to complete this assignment, if you are not familiar with a statistical program. The first uses Excel. Download the.csv data file for to use Excel. The second uses Stata. Download the.dta data file to use Stata. The third uses My preference is that you use Excel or Stata, but do what you can. EXCEL Note: These instructions were prepared for use with Excel However, you should be able to create graphs using roughly the same instructions in Excel
2 Step 1: Opening and Formatting the Data (NOTE: If you want to skip Step 1, I posted selected variables from the QoG data set and the codebook on the class website) Download the Quality of Governance (QOG) Time-Series Dataset as a CSV file via the following link: Open Microsoft Excel. From the Data menu, under Get External Data, select From Text. Select the CSV file you downloaded. This will open a Text Import Wizard. In the Wizard, check the box that says Delimited and click Next. On the following screen, select Semicolon under the list of Delimiters and click Next. On the following screen, select General as the Column Data Format and click Finish. Before proceeding to analyze the data, save this file to preserve the data format. At this point, download and open the QOG Codebook (available at the link above). The Codebook contains a list of variables contained within the dataset, as well as a description of each variable. For this exercise, you should now familiarize yourself with the different measures of economic growth and trade openness contained in the dataset, and think about which variables you would like to use throughout the exercise. Step 2: Sorting the Data In Excel, the first row of the QOG dataset contains the variable names. These names correspond to the names of the variables that appear in the QOG Codebook. The values for each variable appear vertically in the columns. Since the first part of the exercise asks you to create a scatterplot for the year 2000, you will want to sort the data by year and then by country. To do this, select all of the data (using Ctrl+A). Then click on the Data tab and choose Sort. Under Column, select Sort by: Year. Then click Add Level and select Then by: cname. This will sort the data by year, and then alphabetically by country. At this point, it may be helpful to freeze the data-panes for easier viewing. The Excel help file contains information on how to do this. The easiest way is to highlight the ccodealp column and then highlight the columns to the left of this one. Then select View, Freeze Panes, and choose the first option on the dropdown menu that appears. After sorting the data, scroll down to the data for the year At this point, copy the data from the cname and year columns into a separate spreadsheet. Next, return to the very top of the dataset (the first row) and scroll horizontally through the data to find the variable name that corresponds to the measure of trade openness you selected from the codebook. Once you ve identified the variable you would like to use, scroll back down to the year 2000 and copy the trade openness data for that year into a blank column of the new 2
3 spreadsheet you created. That spreadsheet should now contain a list of country names in the first column, followed by a year column (in this case, the year is 2000), and finally, a trade openness column. The trade openness data will comprise the x-axis values of the scatterplot you create. Now, repeat this process for the measure of economic growth that you ve selected, and add the 2000 data on economic growth to the new spreadsheet you have created. The economic growth data will comprise the y-axis values of the scatterplot you create. Now you are ready to graph the data for the first part of the exercise. Note that data for some countries may be missing; that is okay. You can leave these blank values in the new spreadsheet you created without causing any errors. Step 3: Graphing the Data (Creating the First Scatterplot) To create a scatterplot of the data in your new spreadsheet, highlight the columns which contain the data on trade openness and economic growth. Make sure that the trade data appears in a column to the left of the growth data. Then on the Insert tab, select Scatter (under Charts ), and Scatter with only Markers. This will create a scatterplot with the trade data on the x-axis and the growth data on the y-axis. You can then use the features under the Chart Tools tab to add labels to the x-axis and y-axis (be sure to indicate the units), as well as a title for the graph as a whole. After labeling the graph, add a Trendline. To do this, click on a single datapoint. Then, right-click and select Add Trendline. Choose a Linear Trendline and change the line color and size as you see fit to improve visibility. Now, we will insert each country s name onto the scatterplot. To make each country s name appear on the graph above their corresponding datapoints, go to and download the XY Chart Labeler. This is an Excel add-on that must be installed in order to label the datapoints by country name. Close Excel and follow the installation instructions. Then, reopen Excel. You will now see a new tab titled XY Chart Labels. Under this tab, select Add Labels and highlight the names of the countries in the dataset. Then select OK. This will add country name labels to the graph (note that this may take a bit of time to load). You may wish to shrink the text of the names to make them more legible. This completes the process of creating the initial scatterplot. Your scatterplot should look somewhat like Scatterplot 1 that appears at the end of this document. Step 4: Graphing the Data (Creating the Second Scatterplot) To create the second scatterplot described in the exercise either for a different year or for a subset of countries or with a different variable repeat the process described above using the different data. While the data will be different, the steps for creating the second scatterplot will be identical to those outlined above. Your second scatterplot might look something like Scatterplot 2 that appears at the end of this document. Step 5: Graphing the Data (Creating a Country Line Graph) 3
4 For the third graph, you will be looking at data from a specific country whose trade policies changed from being open to closed according to an updated dataset compiled by Wacziarg and Welch. To identify these countries, first consult Table A-2 in the Wacziarg and Welch PDF posted under the Course Materials tab on Blackboard. For this part of the exercise, choose a country whose year of openness appears in the rightmost Wacziarg and Welch (2003) column. The purpose of this part of the exercise is to compare the economic performance for a given country before and after the year in which the country became open according to the Wacziarg and Welch data. You will therefore be preparing a graph with the year on the x-axis and economic performance on the y-axis. Begin by selecting the economic performance variable that you would like to use from the QOG Codebook. You will then want to sort the data in the formatted time series QOG excel file: first by cname, and then by year. You should now find the data corresponding to the economic performance variable and country that you have selected. Copy and paste the data into a separate spreadsheet. The new spreadsheet should include two columns: one for the year and one for the economic performance data. For whichever country you select, make sure that the QOG dataset contains economic performance data for at least several years before and after the country s transition to openness (as indicated by Table A-2); also, make sure that the first and law row of the economic performance column (in your new spreadsheet) contain data. Highlight the column that contains the economic performance data. Then click on the Insert tab and choose Line to insert a line graph. Right-click on the graph you have created and choose Select Data. Under Horizontal (Category) Axis Labels, click on Edit. In the box that appears, highlight all of the years of data in your Year column and click Ok twice. This will change the x-axis labels to display the years of data you have selected. Format your graph by adding labels and titles as you did for the scatterplots. Then, right-click on the x-axis labels and select Format Axis. Under Axis Options and Position Axis, select On tick marks. Click Close. Once you have finished formatting the graph, add a vertical line on the graph to indicate the year in which the country switched from being closed to open. To do this, under the Insert tab, select Shapes and then choose the line object. Draw the line on your graph and change the color and width as necessary to improve visibility. Finally, right-click on the line you have drawn and select Group to group the line with the rest of the graph as a single object. Your completed line graph should look somewhat like Figure 3 that appears at the end of this document. 4
5 Economic Growth Sca5erplot 1: Trade Openness and Economic Growth (2000) Liberia Turkmenistan Grenada Belize Equatorial Guinea Azerbaijan Russia China Israel Kazakhstan Estonia Albania Bhutan Botswana Cambodia Ireland Swaziland Singapore Korea, South Mauri,us Rwanda Sudan Bangladesh Benin Armenia Cape Bosnia Herzegovina Bulgaria Belarus Bahrain Brazil Australia Cameroon Canada Verde Guinea- Bissau Congo Tajikistan Malaysia Luxembourg Ethiopia Turkey Cuba Egypt (1993- ) Mexico Dominican Nepal Samoa Latvia Uganda Chile Finland Republic Gambia Cyprus France Greece Austria Bahamas Hungary Honduras India Indonesia Iran Nigeria Laos Kyrgyzstan Malta Madagascar Algeria Angola Belgium Central Colombia Denmark Czech Bolivia Brunei Burkina African Ecuador Germany Guatemala Iceland Micronesia Kuwait Oman Pakistan (1972- ) Tanzania Sri Lanka Philippines South Spain Ukraine Vietnam Trinidad and Tobago Japan Italy Poland Saudi Libya Lithuania Faso Republic Croa,a Ghana Jordan Macedonia Republic Lesotho Maldives Mali Nicaragua Guinea El Salvador Georgia Costa An,gua Rica Barbados Comoros Hai, Malawi Lebanon Morocco Mauritania Montenegro Arabia Namibia Netherlands Peru Sierra Portugal Africa United New Zealand Senegal Leone Sweden Slovenia Arab Norway St Vincent Tunisia Seychelles Emirates Thailand United Zambia United States Uzbekistan Venezuela Kingdom Yemen Tonga Romania Syria Switzerland Moldova Vanuatu Panama St Ki[s and Nevis Mozambique Grenadines Kenya Kiriba, and Barbuda Djibou, Mongolia Jamaica Marshall Dominica Slovakia Palau Islands Burundi Argen,na Niger Chad Togo St Suriname Lucia Uruguay Gabon Fiji Guyana Papua New Guinea Cote d'ivoire Paraguay Congo, Democra,c Iraq 0 50 Republic Zimbabwe Eritrea Solomon Islands - 20 Trade Openness 5
6 Economic Growth Lebanon St Lucia United Arab Emirates 20 Iran Bhutan Belize Bangladesh Colombia Cyprus India Indonesia Thailand Vanuatu Korea, Turkey South Botswana Australia China Burundi Comoros Benin Bolivia Chile Costa Austria Rica Dominica Ecuador Egypt Ireland Japan El Salvador Germany Laos Nigeria Israel Saudi Arabia St Vincent Malaysia and Swaziland the Fiji Ethiopia Equatorial France (1993- ) Guinea Gambia Gabon Grenada Guatemala Ghana Guinea Belgium Bahrain Guinea- Bissau Kenya Malawi Marshall Mauri,us Islands Panama Singapore Mexico Uganda Tanzania Venezuela Zimbabwe Nepal Sri Lanka Syria Seychelles Tunisia Jamaica Lesotho Malta Pakistan Spain Morocco Portugal (1972- ) Luxembourg Italy Madagascar Netherlands Micronesia Angola Algeria Brunei An,gua and Barbuda Greece Mozambique Finland Canada Argen,na Burkina Cape Denmark Iceland Norway Verde Central African Republic Faso Congo Cote d'ivoire Namibia Grenadines 10 Sierra Switzerland Vietnam United Leone Philippines Paraguay United States Congo, Bahamas Honduras Jordan St Ki[s Kiriba, and Nevis Somalia New Nicaragua Zealand Democra,c Brazil Hungary Mongolia Mali Niger Oman Russia South Uruguay Suriname Kingdom Africa Sweden Uzbekistan Togo Trinidad and Tobago Zambia Senegal Slovakia Mauritania Chad Papua New Rwanda Guinea Tonga Cameroon Dominican Republic Republic Barbados Guyana Peru Estonia Romania Sudan Samoa 0 Albania Bulgaria Sca5erplot 2: Trade Openness and Economic Growth (1990) Liberia - 60 Trade Openness 6
7 Figure 3: Economic Performance Before and AGer Openness fo Country XX Economic Performance Year STATA The Stata file is likely to be too large for the default memory settings, so first increase the amount of memory: set mem 600m Then open the file. Click the File button on the menu bar, then click Open then find the file and click it, then click the Open button. On the results window it will show up as something like this: use "/Users/username/Downloads/QoG_data_v6Apr11/QoG_t_s_v6Apr11.dta" 7
8 The following command will create the scatter plot. Instead of opennessvar and growthvar, you should choose a variable of openness and of growth (or whatever). You can choose the variable by clicking on Window on the menu bar, and then click Variables. scatter growthvar opennessvar if year==2000, mlabel(cname) title("trade Openness and Growth") lfit growtvar opennessvar if year==2000 For the timeline, use the following command. In place of cname you should put in a country name. To see the country names, you can click on Data Editor on the menu bar, then click Start, then click Data Editor (Browse). Or you can click the icon of a spreadsheet with a magnifying glass. For yearopen, put the year that the country changed its trade openness policy, according to Wacziarg & Welch. tsline growthvar if cname=="cname" & growthvar~=., tline(1990) title("growth before and after trade policy change in cname") GAPMINDER Go to Click on Gapminder World For the scatter plot, I want to see how trade openness affects economic performance, so I m going to put the Trade variable on the x-axis (bottom of the graph), using the menu buttons (Economy to Debt & Trade to Trade merchandise % of GDP). Then I use the y-axis menu buttons (on the left side of the graph) to choose an economic performance measure, such as GDP/capita growth annual % (Economy to incomes and Growth to GDP/capita growth). Then on the timeline on the bottom of the page, I slide the bar to the year If the graph looks good, copy it (maybe with a Screen Shot ) and add it to my Word document. The graph I did has most of the dots smushed in the bottom left corner because of some outliers, so I click the arrow on the bottom right corner of the graph, then use the magnifying glass icon in the bottom right of the graph to zoom in on the bottom left corner. WITHOUT MAGNIFYING GLASS: 8

9 With Mafnifying glass: 9

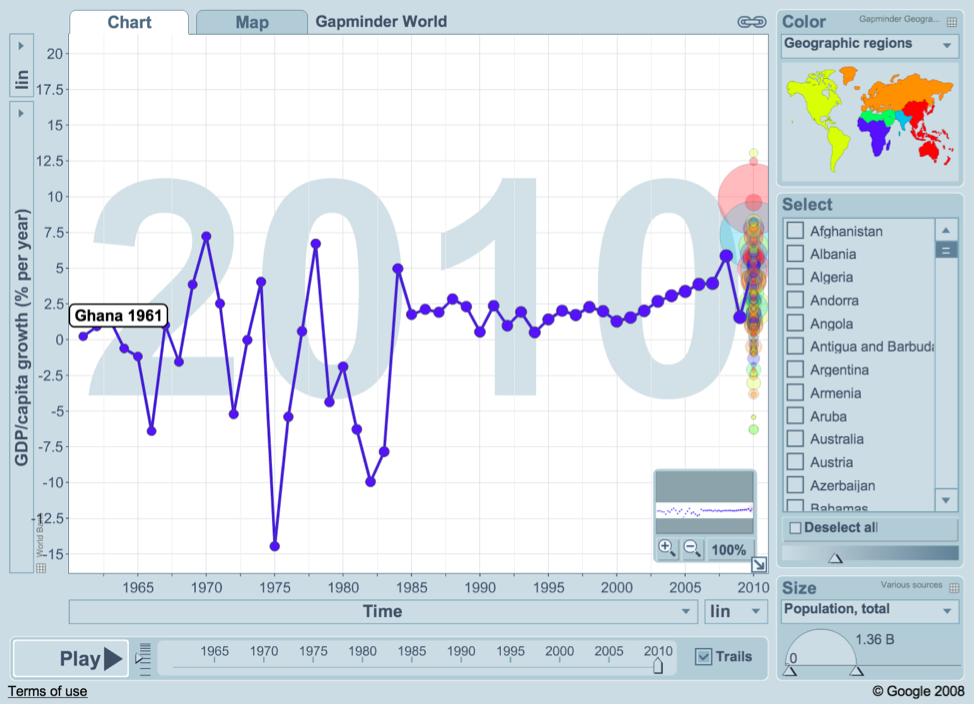
10 I don t think there is a way to generate a trend line (if you know how, tell me) but you can eyeball and see that countries with high trade openness tend to have higher growth rates, on average, although some large countries such as China and India are growing rapidly in spite of not being so open. For the timeline, I pick a country that, according to Table A2 of Wacziarg & Welch, had a change in economic policy. I ll choose Ghana, as I did above. I check Ghana on the list of countries in the table to the right. I use the button on the x-axis to change from Merchandise trade to Time. Then I slide the bar on the timeline at the bottom of the page to I make sure the Trails box is checked. Then I click Play, The years go buy, and Ghana s data point goes up and down across the screen. When it s done, I copy and paste it into my word Doc: 10
11 I don t know how to use Gapminder to draw a line. I could add a line using Insert Shape if I want to. Then I do my analysis. 11
12 12
Situation on the death penalty in the world. UNGA Vote 2012 Resolutio n 67/176. UNGA Vote 2010 Resolutio n 65/206. UNGA Vote 2008 Resolutio n 63/168
 Situation on the death penalty in the world Prepared by the International Commission against the Death Penalty (ICDP), as of 8 June 2014. Based on Amnesty International and Death Penalty Worldwide. Country
Appendices. Please note that Internet resources are of a time-sensitive nature and URL addresses may often change or be deleted.
 Appendices Appendix A Table of Treaties Appendix B State Trademark Registration Provisions Appendix C Resources Appendix D Forms Appendix Appendix E Selected Statutes Please note that Internet resources
Supplementary Appendix for. Version: February 3, 2014
 Supplementary Appendix for When Do Governments Resort to Election Violence? Version: February 3, 2014 This appendix provides supplementary information not included in the published draft. Supplementary
PROPOSED BUDGET FOR THE PROGRAMME OF WORK OF THE CONVENTION ON BIOLOGICAL DIVERSITY FOR THE BIENNIUM Corrigendum
 CBD Distr. GENERAL UNEP/CBD/COP/11/10/Corr.1 6 October ORIGINAL: ENGLISH CONFERENCE OF THE PARTIES TO THE CONVENTION ON BIOLOGICAL DIVERSITY Eleventh meeting Hyderabad, India, 8-19 October Item 14.2 of
GINA Children. II Global Index for humanitarian Needs Assessment (GINA 2004) Sheet N V V VI VIII IX X XI XII XII HDR2003 HDR 2003 UNDP
 Sheet N V V VI VIII IX X XI XII XII HDR2003 HDR 2003 UNDP") Human UNICEF Index Index Natural 2003 GDP per Total as % of Total Rate HDI HPI Disasters Conflicts capita Population population 5 1 Congo, Democratic Republic of the 2,80000 3 3 1 3 3 3 3 3 3 3 2 Burundi
Human UNICEF Index Index Natural 2003 GDP per Total as % of Total Rate HDI HPI Disasters Conflicts capita Population population 5 1 Congo, Democratic Republic of the 2,80000 3 3 1 3 3 3 3 3 3 3 2 Burundi
Country of Citizenship, College-Wide - All Students, Fall 2014
 Country of Citizenship, College-Wide - All Students, Fall 2014-49,552 (72%) students were U.S. Citizens in Fall 2014. - MDC's non-citizen students come from at least 167 countries and speak approximately
Most Recent Periodic Report Initial State Report. Next Periodic Accession/Ratification. Report Publication Publication. Report Due
 Country Signature Most Recent Periodic Report Initial State Report Next Periodic Accession/Ratification Report Publication Publication Report Due Number Date Afghanistan 4 Feb 1985 1 Apr 1987 25 Jun 1992
Programme budget for the biennium Programme budget for the biennium
 DRAFT TEXT on SB 46 agenda item 16(a) Administrative, financial and institutional matters Programme budget for the biennium 2018 2019 Version 1 of 13 May at 12:00 Programme budget for the biennium 2018
PROPOSED BUDGET FOR THE PROGRAMME OF WORK OF THE CARTAGENA PROTOCOL ON BIOSAFETY FOR THE BIENNIUM Corrigendum
 CBD CONFERENCE OF THE PARTIES TO THE CONVENTION ON BIOLOGICAL DIVERSITY SERVING AS THE MEETING OF THE PARTIES TO THE CARTAGENA PROTOCOL ON BIOSAFETY Fifth meeting, Nagoya, Japan, 11-15 October 2010 Item
The Chemical Weapons Convention, Biological and Toxin Weapons Convention, Geneva Protocol
 The Chemical Weapons Convention, Biological and Toxin Weapons Convention, Geneva Afghanistan 14 Jan 93 24 Sep 03 6 Mar 75 (R) 09 Dec 86 Albania 14 Jan 93 11 May 94 03 Jun 92 20 Dec 89 Algeria 13 Jan 93
Patent Cooperation Treaty (PCT) Working Group
 Working Group") E PCT/WG/7/26 ORIGINAL: ENGLISH DATE: MAY 21, 2014 Patent Cooperation Treaty (PCT) Working Group Seventh Session Geneva, June 10 to 13, 2014 FEE REDUCTIONS FOR CERTAIN APPLICANTS FROM CERTAIN COUNTRIES,
E PCT/WG/7/26 ORIGINAL: ENGLISH DATE: MAY 21, 2014 Patent Cooperation Treaty (PCT) Working Group Seventh Session Geneva, June 10 to 13, 2014 FEE REDUCTIONS FOR CERTAIN APPLICANTS FROM CERTAIN COUNTRIES,
Does socio-economic indicator influent ICT variable? II. Method of data collection, Objective and data gathered
 Does socio-economic indicator influent ICT variable? I. Introduction This paper obtains a model of relationship between ICT indicator and macroeconomic indicator in a country. Modern economy paradigm assumes
Mexico, Central America and the Caribbean South America
 Objective: This assignment is a way to prepare you for many different aspects of AP Human Geography. You will be held accountable for this assignment; it will be the first grade of the quarter. Failure
Countries in Order of Increasing Per Capita Income, 2000
 ,400 45000,200 Population Per Capita Income 40000 35000,000 30000 Population, millions 800 600 25000 20000 Per Capita Income 5000 400 0000 200 5000 0 2 3 4 5 6 7 8 9 0 2 3 4 5 6 7 Countries in Order of
International legal instruments related to the prevention and suppression of international terrorism
 III. International legal instruments related to the prevention and suppression of international terrorism A. Status of international conventions pertaining to international terrorism 138. Currently, there
Immigrant Status and Period of Immigration Newfoundland and Labrador 2001 Census
 and Period of Immigration Census - Total - Place of birth of respondent 8,985 8,030 1,635 1,510 1,700 1,165 2,015 880 1,130 955 Americas 2,165 1,835 210 445 635 225 315 140 175 335 North America 1,995
PRECURSORS. Pseudoephedrine preparations 3,4-MDP-2-P a P-2-P b. Ephedrine
 ANNEXES Annex II Annual legitimate requirements for ephedrine, pseudoephedrine, 3,4-methylenedioxyphenyl-2-propanone and 1-phenyl-2-propanone, substances frequently used in the manufacture of amphetamine-type
November 2014 CL 150/LIM 2 COUNCIL. Hundred and Fiftieth Session. Rome, 1-5 December 2014
 November 2014 CL 150/LIM 2 E COUNCIL Hundred and Fiftieth Session Rome, 1-5 December 2014 Status of Current Assessments and Arrears as at 24 November 2014 Executive Summary The document presents the Status
Velocity Virtual Rate Card 2018
 Local 0.26 0.00 0.26 Local National 0.26 0.00 0.26 National Mobile 0.26 0.00 0.26 Mobile AFGHANISTAN ALBANIA 2.20 0.00 2.20 International ALGERIA 2.20 0.00 2.20 International ANDORRA 2.20 0.00 2.20 International
About the Authors Geography and Tourism: The Attraction of Place p. 1 The Elements of Geography p. 2 Themes of Geography p. 4 Location: The Where of
 Preface p. ix About the Authors p. xi Geography and Tourism: The Attraction of Place p. 1 The Elements of Geography p. 2 Themes of Geography p. 4 Location: The Where of Geography p. 4 Place and Space:
Hundred and Fifty-sixth Session. Rome, 3-7 November Status of Current Assessments and Arrears as at 30 June 2014
 September 2014 FC 156/INF/2 E FINANCE COMMITTEE Hundred and Fifty-sixth Session Rome, 3-7 November 2014 Status of Current Assessments and Arrears as at 30 June 2014 Queries on the substantive content of
Delegations School GA Opening Speech 1 SPC Opening Speech 2 SC Total Amnesty International Agora Sant Cugat Botswana Agora Sant Cugat 1 Y 1 Y
 Amnesty International Agora Sant Cugat 1 1 0 2 Botswana Agora Sant Cugat 1 Y 1 Y 0 2 Cameroon Agora Sant Cugat 1 Y 1 Y 0 2 Cuba Agora Sant Cugat 1 Y 1 Y 0 2 Indonesia Agora Sant Cugat 1 Y 1 Y 0 2 Israel
Report by the Secretariat
 SIXTY-FIFTH WORLD HEALTH ASSEMBLY A65/30 Provisional agenda item 16.3 5 April 2012 Status of collection of assessed contributions, including Member States in arrears in the payment of their contributions
SUGAR YEAR BOOK INTERNATIONAL SUGAR ORGANIZATION 1 CANADA SQUARE, CANARY WHARF, LONDON, E14 5AA.
 SUGAR YEAR BOOK 2017 INTERNATIONAL SUGAR ORGANIZATION 1 CANADA SQUARE, CANARY WHARF, LONDON, E14 5AA www.isosugar.org Copyright 2017 International Sugar Organization All rights reserved. No part of ISO
COUNCIL. Hundred and Fifty-eighth Session. Rome, 4-8 December Status of Current Assessments and Arrears as at 27 November 2017
 November 2017 CL 158/LIM/2 E COUNCIL Hundred and Fifty-eighth Session Rome, 4-8 December 2017 Status of Current Assessments and Arrears as at 27 November 2017 Executive Summary The document presents the
Dimensionality Reduction and Visualization
 MTTTS17 Dimensionality Reduction and Visualization Spring 2018 Jaakko Peltonen Lecture 7: Nonlinear dimensionality reduction, part 2 Two measures of faithfulness - precision and recall Faithfully? Good
AT&T Phone. International Calling Rates for Phone International Plus, Phone 200 and Phone Unlimited North America
 AT&T Phone International Calling Rates for Phone International Plus, Phone 200 and Phone Unlimited North Rates do not include taxes, fees or surcharges. Call destinations and rates are subject to change.
Government Size and Economic Growth: A new Framework and Some Evidence from Cross-Section and Time-Series Data
 1 Government Size and Economic Growth: A new Framework and Some Evidence from Cross-Section and Time-Series Data Original Paper by Rati Ram (1986) Replication and Extension by Nicolas Lopez ECON 5341 The
COUNCIL. Hundred and Fifty-fifth Session. Rome, 5-9 December Status of Current Assessments and Arrears as at 29 November 2016.
 November 2016 CL 155/LIM/2 E COUNCIL Hundred and Fifty-fifth Session Rome, 5-9 December 2016 Status of Current Assessments and Arrears as at 29 November 2016 Executive Summary The document presents the
2001 Environmental Sustainability Index
 2001 Environmental Sustainability Index Annex 6: Variable Descriptions and Data An Initiative of the Global Leaders of Tomorrow Environment Task Force, World Economic Forum Annual Meeting 2001 Davos, Switzerland
Export Destinations and Input Prices. Appendix A
 Export Destinations and Input Prices Paulo Bastos Joana Silva Eric Verhoogen July 2017 Appendix A For Online Publication Figure A1. Real exchange rate, selected richer destinations relative price level
Yodekoo Business Pro Tariff (Including Quickstart Out Of Bundle)
") Yodekoo Business Pro Tariff (Including Quickstart Out Of Bundle) This is the full tariff for Business Pro and any out of bundle spend using Quickstart products. All prices shown are in GBP per minute and
Yodekoo Business Pro Tariff (Including Quickstart Out Of Bundle) This is the full tariff for Business Pro and any out of bundle spend using Quickstart products. All prices shown are in GBP per minute and
MULTIPLE REGRESSION. part 1. Christopher Adolph. and. Department of Political Science. Center for Statistics and the Social Sciences
 CSSS/SOC/STAT 321 Case-Based Statistics I MULTIPLE REGRESSION part 1 Christopher Adolph Department of Political Science and Center for Statistics and the Social Sciences University of Washington, Seattle
Erratum to: Policies against human trafficking: the role of religion and political institutions
 Econ Gov (2016) 17:387 396 DOI 10.1007/s10101-016-0185-1 ERRATUM Erratum to: Policies against human trafficking: the role of religion and political institutions Niklas Potrafke 1,2 Published online: 16
DISTILLED SPIRITS - EXPORTS BY VALUE DECEMBER 2017
 DISTILLED SPIRITS - EXPORTS BY VALUE DECEMBER 2017 U.S. COMMERCIAL EXPORTS OF DISTILLED SPIRITS - DECEMBER 2017 (U.S. DOLLARS) Da-Value-17-12 SUMMARY BY CLASS CLASS DECEMBER DECEMBER DOLLAR YTD YTD DOLLAR
Fall International Student Enrollment Statistics
 International Student & Scholar Services Fall 2006 International Student Enrollment Statistics Julie Misa Director www.ips.uiuc.edu/isss Contents Summary...3 International Student Enrollment by Country...5
Climate variability and international migration: an empirical analysis
 Climate variability and international migration: an empirical analysis NICOLA D. CONIGLIO, Corresponding author University of Bari Aldo Moro, Department of Economics, Largo Abbazia Santa Scolastica 53,
ProxiWorld tariffs & zones 2016
 made sent Internet zones Afghanistan 0,91 0,99 2,27 2,89 0 0,1 0,62 0,62 12 3 Albania 0,7 0,91 1,65 2,27 0 0,1 0,62 0,62 12 2 Algeria 0,7 0,91 1,65 2,27 0 0,1 0,62 0,62 12 2 Andorra 0,7 0,91 1,65 2,27
Fall International Student Enrollment & Scholar Statistics
 International Student & Scholar Services Fall 2008 International Student Enrollment & Scholar Statistics Julie Misa Director www.ips.uiuc.edu/isss Contents Summary...2 International Student Enrollment
Solow model: Convergence
 Solow model: Convergence Per capita income k(0)>k* Assume same s, δ, & n, but no technical progress y* k(0)=k* k(0) k Assume same s, δ, &
COMMITTEE ON FISHERIES
 September 2017 COFI:AQ/IX/2017/SBD.12 E COMMITTEE ON FISHERIES SUB-COMMITTEE ON AQUACULTURE Ninth Session Rome, 24 27 October 2017 REGIONAL STATISTICAL ANALYSIS OF RESPONSES BY FAO MEMBERS, REGIONAL FISHERIES
North-South Gap Mapping Assignment Country Classification / Statistical Analysis
 North-South Gap Mapping Assignment Country Classification / Statistical Analysis Due Date: (Total Value: 55 points) Name: Date: Learning Outcomes: By successfully completing this assignment, you will be
Spring 2007 International Student Enrollment by Country, Educational Level, and Gender
 Grand AFRICA 3 9 0 0 12 5 8 18 42 3 0 0 0 76 88 EASTERN AFRICA 0 0 0 0 0 2 3 7 16 1 0 0 0 29 29 Burundi 0 0 0 0 0 0 0 1 0 0 0 0 0 1 1 Eritrea 0 0 0 0 0 0 0 0 0 0 0 0 0 0 0 Ethiopia 0 0 0 0 0 0 0 1 4 0
Marketing Report: Traffic Demographics (Monthly Comprehensive)
") Marketing Report: Traffic Demographics (Monthly Comprehensive) 06/17/2015 Search Traffic Overview Traffic Sources Marketing KPI: Visitor Behavior Audience Geo Location Audience Demographics Performance
Marketing Report: Traffic Demographics (Monthly Comprehensive) 06/17/2015 Search Traffic Overview Traffic Sources Marketing KPI: Visitor Behavior Audience Geo Location Audience Demographics Performance
Overview of past procurement of Solar Direct Drive (SDD) refrigeration systems and UNICEF SD support in Cold Chain
 refrigeration systems and UNICEF SD support in Cold Chain") Overview of past procurement of Solar Direct Drive (SDD) refrigeration systems and UNICEF SD support in Cold Chain 1 UNICEF Supply Does Make a Difference The overall objectives include: Shorten procurement
Overview of past procurement of Solar Direct Drive (SDD) refrigeration systems and UNICEF SD support in Cold Chain 1 UNICEF Supply Does Make a Difference The overall objectives include: Shorten procurement
04 June Dim A W V Total. Total Laser Met
 4 June 218 Member State State as on 4 June 218 Acronyms are listed in the last page of this document. AUV Mass and Related Quantities Length PR T TF EM Mass Dens Pres F Torq Visc H Grav FF Dim A W V Total
Human resources: update
 Human resources: update Workforce data As at 31 July 2017 Document issued 04 October 2017 Index of tables The information is as of 31 July 2017 (unless otherwise stated) and does not include data from
Canadian Imports of Honey
 of 0409000029 - Honey, natural, in containers of a weight > 5 kg, nes (Kilogram) Argentina 236,716 663,087 2,160,216 761,990 35.27% 202.09% /0 76,819 212,038 717,834 257,569 35.88% 205.69% /0 United States
Swaziland Posts and Telecommunications Corporation (SPTC)---International Call Charges
---International Call Charges") Swaziland Posts and Telecommunications Corporation (SPTC)---International Call Charges INTERNATIONAL DIRECT (PER MINUTE) AND OPERATOR DIALLING (PER 3 MINUTES) CALL CHARGES Charge Letter Country Country
Swaziland Posts and Telecommunications Corporation (SPTC)---International Call Charges INTERNATIONAL DIRECT (PER MINUTE) AND OPERATOR DIALLING (PER 3 MINUTES) CALL CHARGES Charge Letter Country Country
Natural Resource Management Indicators for the Least Developed Countries
 Natural Resource Management Indicators for the Least Developed Countries Alex de Sherbinin CIESIN, Columbia University 24 June 2005 Millennium Challenge Corporation workshop Brookings Institution Washington,
Governments that have requested pre-export notifications pursuant to article 12, paragraph 10 (a), of the 1988 Convention
, of the 1988 Convention") Annex X Governments that have requested pre-export notifications pursuant to article 12, paragraph 10 (a), of the 1988 Convention 1. Governments of all exporting countries and territories are reminded
Annex X Governments that have requested pre-export notifications pursuant to article 12, paragraph 10 (a), of the 1988 Convention 1. Governments of all exporting countries and territories are reminded
Fall International Student Enrollment Statistics
 International Student & Scholar Services Fall 2007 International Student Enrollment Statistics Julie Misa Director www.ips.uiuc.edu/isss Contents Summary...2 International Student Enrollment by Country...3
LAND INFO Worldwide Mapping, LLC 1 of 5
 Topographic Map List Country Afghanistan 1653 R 1653 0 R 447 41 R 130 0 N 63 P Albania 16 R 110 0 R 36 0 R 12 0 N 2 P Algeria 0 R 143 P 0 R 372 0 N 52 P Andorra 0 R 1 Angola 4 R 192 P 0 N 48 P? Antigua
University of Oklahoma, Norman Campus International Student Report Fall 2014
 International Student Report Fall 2014 Prepared by Institutional Research & Reporting June 2015 http://www.ou.edu/content/irr/data-center/annual-reports.html International Student Report Notes and Definitions
Travel and Diabetes Survey
 Travel and Diabetes Survey [ ] = Check all that apply, ( ) = Choose one answer, * = Required answer Which of the following best describes you? Check all that apply.* [ ] A person with type 1 diabetes (T1D)
CALLS FROM HOME RESIDENTIAL TARIFFS. Prices effective from 3rd February _03/02/09_Residential_Cable _Version 2
 CALLS FROM HOME RESIDENTIAL TARIFFS Prices effective from 3rd February 2009 002261_03/02/09_Residential_Cable _Version 2 Telephone charges Phone packages (including line rental) Package Price (per month)
Appendix A. ICT Core Indicators: Definitions
 Appendix A. ICT Core Indicators: Definitions ICT indicator Fixed telephone subscriptions per 100 inhabitants Mobile cellular telephone subscriptions per 100 inhabitants Fixed (wired) Internet subscriptions
Duke Visa Services Open Doors Report on International Educational Exchange Annual Census of International Students Fall 2017
 Duke Visa Services Open Doors Report on International Educational Exchange Annual Census of International Students Fall 2017 Basic Data Total Total Enrolled International Students (excluding OPT): 3415
 World OilReview 201 Contents List of Countries: Europe: Albania, Austria, Belarus, Belgium, Bosnia Herzegovina, Bulgaria, Croatia, Cyprus, Czech Republic, Denmark, Estonia, Finland, France, Germany,
Annex 6. Variable Descriptions and Data
 Annex 6. Variable Descriptions and Data This section contains complete variable descriptions along with the original data used to produce the 2002 Environmental Sustainability Index. The variables are
International Student Enrollment Fall 2018 By CIP Code, Country of Citizenship, and Education Level Harpur College of Arts and Sciences
 International Student Enrollment Fall 2018 By CIP Code, Country of Citizenship, and Education Level Harpur College of Arts and Sciences CIP Code Description Citizenship Graduate Undergrad Total 00.0000
GEODATA AVAILABILITY. 50% off. Order RegioGraph by October 31, 2018 and save 50% on maps for an additional country of your choice!
 GEODATA AVAILABILITY You can use our geomarketing software RegioGraph to visualize and analyze your company data on digital maps. In just a few steps, you can extract insights from your data that would
Table 8c: Total endemic and threatened endemic species in each country (totals by taxonomic group): PLANTS
: PLANTS") IUCN Red List version 2018-1: Table 8c Last Updated: 05 July 2018 Table 8c: endemic and threatened endemic species in each country (totals by taxonomic group): PLANTS number of endemic and threatened endemic
IUCN Red List version 2018-1: Table 8c Last Updated: 05 July 2018 Table 8c: endemic and threatened endemic species in each country (totals by taxonomic group): PLANTS number of endemic and threatened endemic
Africa, Asia and the Pacific, Latin America and the Caribbean. Africa, Asia and the Pacific, Latin America and the Caribbean
 ANNEXE I (disponible en anglais) UNESCO/POLAND CO-SPONSORED FELLOWSHIPS PROGRAMME 2017 List of Invited Member States per region and field of research as determined by the Polish authorities Project (Number
GEF Corporate Scorecard. May 2018
 GEF Corporate Scorecard May 218 GEF CORPORATE SCORECARD May 22, 218 Contributions to the Generation of Global Environment Benefits During the GEF 6 replenishment, the GEF 6 focal area strategies were
Chapter 8 - Appendixes
 Chapter 8 - Appendixes Appendix 8.. Individual Preferences for Growth, Environment, and Income Distribution Funds to be invested in projects that Funds to be invested in projects to Funds to be invested
natural gas World Oil and Gas Review
 natural gas Reserves Production Reserves/Production Ratio Consumption Per Capita Consumption Production/Consumption Ratio Exports Imports Traded Gas LNG - Liquefaction and Regasification Capacity Natural
Table 8c: Total endemic and threatened endemic species in each country (totals by taxonomic group): PLANTS
: PLANTS") IUCN Red List version 2018-2: Table 8c Last Updated: 14 November 2018 Table 8c: endemic and threatened endemic species in each country (totals by taxonomic group): PLANTS number of endemic and threatened
IUCN Red List version 2018-2: Table 8c Last Updated: 14 November 2018 Table 8c: endemic and threatened endemic species in each country (totals by taxonomic group): PLANTS number of endemic and threatened
Required answers: 0 Allowed answers: 0. [Code = 1] [TextBox] Required answers: 0 Allowed answers: 1. Required answers: 1 Allowed answers: 7
![Required answers: 0 Allowed answers: 0. [Code = 1] [TextBox] Required answers: 0 Allowed answers: 1. Required answers: 1 Allowed answers: 7](/thumbs/90/104467589.jpg "Required answers: 0 Allowed answers: 0. [Code = 1] [TextBox] Required answers: 0 Allowed answers: 1. Required answers: 1 Allowed answers: 7") UCC International Student Needs Assessment Description: A link will be sent out for this survey. Please give access to Nikki Jones and Lauren Weitzman. Date Created: 2/25/2011 5:24:58 PM Date Range: 3/7/2011
UCC International Student Needs Assessment Description: A link will be sent out for this survey. Please give access to Nikki Jones and Lauren Weitzman. Date Created: 2/25/2011 5:24:58 PM Date Range: 3/7/2011
ICC Rev August 2010 Original: English. Agreement. International Coffee Council 105 th Session September 2010 London, England
 ICC 105-7 Rev. 1 31 August 2010 Original: English Agreement E International Coffee Council 105 th Session 21 24 September 2010 London, England Obstacles to consumption Background 1. In accordance with
DISTILLED SPIRITS - IMPORTS BY VALUE DECEMBER 2017
 DISTILLED SPIRITS - IMPORTS BY VALUE DECEMBER 2017 U.S. DUTIABLE IMPORTS OF DISTILLED SPIRITS (U.S. DOLLARS) Ea-Value-17-12 SUMMARY: IMPORTS ENTERED FOR CONSUMPTION CLASS DECEMBER DECEMBER PERCENT JANUARY
DISTILLED SPIRITS - IMPORTS BY VOLUME DECEMBER 2017
 DISTILLED SPIRITS - IMPORTS BY VOLUME DECEMBER 2017 U.S. DUTIABLE IMPORTS OF DISTILLED SPIRITS (PROOF GALLONS) Ea-17-12 SUMMARY: IMPORTS ENTERED FOR CONSUMPTION CLASS DECEMBER DECEMBER PERCENT JANUARY
INTERNATIONAL TELECOMMUNICATION UNION SERIES T: TERMINALS FOR TELEMATIC SERVICES
 INTERNATIONAL TELECOMMUNICATION UNION TELECOMMUNICATION STANDARDIZATION SECTOR OF ITU T.35 (02/2000) SERIES T: TERMINALS FOR TELEMATIC SERVICES Procedure for the allocation of ITU-T defined codes for non-standard
Tables of Results 21
 Tables of Results 21 Tables of Results 23 2005 ICP Global Results: Summary Table Price GDP per GDP per capita Gross domestic Gross domestic level capita indices indices product per capita product, billions
Annex to the ITU Operational Bulletin No III.2012 TSB TELECOMMUNICATION STANDARDIZATION BUREAU OF ITU LEGAL TIME 2012
 Annex to the ITU Operational Bulletin No. 999 1.III.2012 TSB TELECOMMUNICATION STANDARDIZATION BUREAU OF ITU LEGAL TIME 2012 Geneva, 2012 LEGAL TIME 2012 Note from TSB 1. The information contained in this
LEGAL TIME 2015 TSB TELECOMMUNICATION STANDARDIZATION BUREAU OF ITU. Annex to the ITU Operational Bulletin No IV.2015.
 Annex to the ITU Operational Bulletin No. 1073 1.IV.2015 TSB TELECOMMUNICATION STANDARDIZATION BUREAU OF ITU LEGAL TIME 2015 Geneva, 2015 Annex to ITU OB No. 1073 of 1.IV.2015 Page 1 of 9 LEGAL TIME 2015
Office of Budget & Planning 311 Thomas Boyd Hall Baton Rouge, LA Telephone 225/ Fax 225/
 Louisiana Acadia 25 19 4 2 0 0 Allen 8 7 1 0 0 0 Ascension 173 143 26 1 0 3 Assumption 14 12 2 0 0 0 Avoyelles 51 41 9 0 0 1 Beauregard 18 14 3 0 0 1 Bienville 5 0 4 0 1 0 Bossier 28 27 0 1 0 0 Caddo 95
Fertility and population policy
 Fertility and population policy ABDOULAYE OUEDRAOGO, Ph.D.* MEHMET S. TOSUN, Ph.D.* JINGJING YANG, Ph.D.* Article** JEL: H10, H59, J11, J13, J18 doi: 10.3326/pse.42.1.2 * The authors would like to thank
International Trusteeship: External Authority in Areas of Limited Statehood
 International Trusteeship: External Authority in Areas of Limited Statehood David A. Lake Christopher J. Fariss University of California San Diego, Dept. of Political Science, dlake@ucsd.edu Pennsylvania
W o r l d O i l a n d G a s R e v i e w
 W o r l d O i l a n d G a s R e v i e w 2 0 0 8 Pro duction / Produzione In 2006 the world production of natural gas grew by 3.5%, reaching 2,929 billion cubic metres (bcm). In 2006, Russia was the leading
Countries, World, Universe Maps of world, continents. CSRidentity.com
 Countries, World, Universe Maps of world, continents We urge people to take a printout and see the countries, oceans in world Map of Africa continent Countries, islands in Africa continent Algeria Angola
2017 Source of Foreign Income Earned By Fund
 2017 Source of Foreign Income Earned By Fund Putnam Emerging Markets Equity Fund EIN: 26-2670607 FYE: 08/31/2017 Statement Pursuant to 1.853-4: The fund is hereby electing to apply code section 853 for
International Rates. RATE per minute use
 Afghanistan 93 $0.54 Afghanistan Cellular 93.999 $0.55 Albania 355 $0.16 Albania Cellular 355.999 $0.41 Alberta, B AB,BC,MB,NB,NF,NS,NT,YT,ON,PE,PQ,SK,NU $0.00 Alberta, B AB,BC,MB,NB,NF,NS,NT,YT,ON,PE,PQ,SK,NU
The World Trade Network
 Prelims Luca De Benedictis 1 Lucia Tajoli 2 1 Università di Macerata - Italy 2 Politecnico di Milano - Italy UC Berkeley - February 25th, 2010 Prelims The outline of the talk Introduction: World Trade
Scaling Seed Kits Through Household Gardens
 Scaling Seed Kits Through Household Gardens SENEGAL WESTERN SAHARA LIBERIA PORTUGAL REPULIC OF IRELAND COTE D IVOIRE UNITED KINGDOM GHANA NETHERLANDS BELGIUM DENMARK SWITZ. TUNISIA CAMEROON CZECH REPUBLIC
Effects of Business-as-usual anthropogenic emissions on air quality
 Effects of Business-as-usual anthropogenic emissions on air quality A. Pozzer 1,2, P. Zimmermann 2 U.M. Doering 3,, J. van Aardenne 3,, H. Tost 4, F. Dentener 3 G. Janssens-Maenhout 3, J. Lelieveld 2,5,6
Developing a Conflict Vulnerability Index
 ICAT Working Paper Series May 2013 Developing a Conflict Vulnerability Index Kim Fletcher, Marcus Marktanner, and Luc Noiset Kennesaw State University www.kennesaw.edu/icat 1. INTRODUCTION The objective
Online APPENDIX. Further Results for: The Effects of the International Security Environment on National Military Expenditures: A Multi-Country Study
 Online APPENDIX Further Results for: The Effects of the International Security Environment on National Military Expenditures: A Multi-Country Study William Nordhaus*, John R. Oneal**, Bruce Russett***
Does Corruption Persist In Sub-Saharan Africa?
 Int Adv Econ Res (2009) 15:336 350 DOI 10.1007/s11294-009-9210-2 ORIGINAL PAPER Does Corruption Persist In Sub-Saharan Africa? Nicole Bissessar Published online: 12 June 2009 # International Atlantic Economic
Landline & Calls Corporate Pricing Information
 Landline & Calls Corporate Pricing Information O2 Landline Prices Pricing Matrix Line Rental Landline Price per month 11.50 per month One-off s Landline transfer to O2 2.00 New Landline provision 90.00
MOCK EXAMINATION 1. Name Class Date INSTRUCTIONS
 Name Class Date PRIMARY 2 mathematics MOCK EXAMINATION 1 INSTRUCTIONS Total time for Section A, Section B and Section C: 1 hour 45 minutes The use of calculators is not allowed. SECTION A : Multiple Choice
Bilateral Labour Agreements, 2004
 Guest Austria Canada Turkey ( 64) Canada, Czech Republic, Hungary ( 98), Belgium Italy ( 46, 54), Turkey ( 64) Bulgaria ( 99), Pol (02) Germany ( 91) Bulgaria ( 99), Mongolia ( 99), Pol ( 92), Russia (
SuperPack -Light. Data Sources. SuperPack-Light is for sophisticated weather data users who require large volumes of high quality world
 SuperPack -Light Global Data Coverage SuperPack-Light is for sophisticated weather data users who require large volumes of high quality world wide data but who do not need the full-service provided under
2005 Environmental Sustainability Index Benchmarking National Environmental Stewardship. Appendix C Variable Profiles and Data
 2005 Environmental Sustainability Index Benchmarking National Environmental Stewardship Appendix C Variable Profiles and Data 253 This page is intentionally blank. 254 Appendix C: Variable Profiles and
A Note on Human Development Indices with Income Equalities
 MPRA Munich Personal RePEc Archive A Note on Human Development Indices with Income Equalities SK Mishra North-Eastern Hill University, Shillong (India) 11. June 2007 Online at http://mpra.ub.uni-muenchen.de/3793/
Demography, Time and Space
 Demography, Time and Space Martin Bell The University of Queensland WD Borrie Lecture Australian Population Association 2014 Conference Hobart, Tasmania Wednesday December 3rd 2014 Professor WD (Mick)
Oslo, 18 September 1997
 . 5. CONVENTION ON THE PROHIBITION OF THE USE, STOCKPILING, PRODUCTION AND TRANSFER OF ANTI-PERSONNEL MINES AND ON THEIR DESTRUCTION Oslo, 18 September 1997. ENTRY INTO FORCE: 1 March 1999, in accordance
Nigerian Capital Importation QUARTER THREE 2016
 Nigerian Capital Importation QUARTER THREE 2016 _ November 2016 Capital Importation Data The data on Capital Importation used in this report was obtained from the Central Bank of Nigeria (CBN). The data
Florida's Refugee Population Statistical Report
 Florida's Refugee Population Statistical Report October 1 st, 2008 September 30 th, 2009 And Federal Fiscal Year 2005-2009 Courtesy of the US Coast Guard Prepared By: Florida Department of Children & Families
United Nations Environment Programme
 UNITED NATIONS United Nations Environment Programme Distr. GENERAL UNEP/OzL.Pro/ExCom/67/7 18 June 2012 EP ORIGINAL: ENGLISH EXECUTIVE COMMITTEE OF THE MULTILATERAL FUND FOR THE IMPLEMENTATION OF THE MONTREAL