Measurement and Data Processing. Ms.Peace
|
|
|
- Ashlie Armstrong
- 5 years ago
- Views:
Transcription
1 Measurement and Data Processing Ms.Peace
2 Lesson Uncertainties and Errors in Measurements and Results
3 Qualitative vs. Quantitative Qualitative data includes all non-numerical information obtained from observations not from measurement. (Chemical and Physical Properties) Solubility Melting Point Quantitative data are obtained from measurements, and are always associated with random errors/uncertainties, determined by the apparatus, and by human limitations such as reaction times Amount Concentration
4 Qualitative vs. Quantitative
5 What Is An Uncertainty? No measuring instrument (be it a plastic ruler or the world s most accurate thermometer) is perfectly accurate When you make any measurement, there always is some uncertainty as to the exact value. For example: The ruler says this red line is 3.5 cm long Due to imperfections in the design and manufacturing of the ruler, I can t be sure that it is exactly cm, just something close to that, perhaps or 3.521
6 Uncertainty in Measurements Data involving exact numbers-the values are known exactly and there is no uncertainty A dozen donuts 8 students Data involving inexact numbers-there is a degree of uncertainty Height of a student Temperature of a student
7 Measuring Uncertainties Most equipment manufacturers know the level of uncertainty in their instruments, and will tell you. For example: The instruction manual that came with my ruler tells me it is accurate to +/ cm. This means my 3.5 cm line is actually anywhere between 3.45 and 3.55 cm long Importantly: we have no way of knowing where in this range the actual length is, unless we use a more accurate ruler

8 How Big Are The Uncertainties? Most good apparatus will have the uncertainty written on it, so make a note of it. Where this is not the case, use half the smallest division: For example: if a balance can measure to two decimal places, the uncertainty would by +/ g When manually measuring time, you should round to the nearest whole second, and decide the uncertainty based on the nature of your measurement.

9 Analogue Instruments Beaker Graduated Cylinder Volumetric Flask 10 ml $4.44 $13.77 $ ml $3.86 $33.21 $60.55


10 Balances mass Top Pan Balance: measure in a school lab setting Analytical Balance: measure mass to a high degree of precision. Shutters allow the reduction of air flow and dust collection

11 Balance Precision Balance reads to 1 place = $ Balance reads to 0.1 place = $ Balance reads to 0.01 place = $ Balance reads to place = $407.40


12 Precision vs Closeness of agreement between independent test results obtained by applying the experimental procedure under stipulated conditions The smaller the random part of the experimental errors, the more precise the procedure Accuracy Closeness of the agreement between the result of a measurement and the true value of the measurand-the particular quantity to be measured
13 Significant Figures The number of digits reflecting the precision of a given measurement The greater the certainty the greater the certainty about the numerical value of the measured or calculated quantity
14 Scientific Notation Measurement Scientific Notation # of Sig Figs g x 102g dm x 10-3dm kg 3 x 10²kg 2


15 Scientific Notation Multiplying or Dividing The result should be expressed based on the measurement with the smallest number of significant figures Adding or Subtracting The result should be expressed based on the measurement with the smallest number of decimal places
16 Experimental Errors Systematic Errors Associated with flaw in the actual experimental design or with the instrumentation used Imply that the measured quantity will always be greater or less than the true value Types of systematic errors: Instrumentation errors Experimental methodology Personal errors
17 Experimental Errors Systematic Errors Faulty gas syringes that have associated leakage Poorly insulated calorimeter in a thermochemistry experiment Experimental Methodology Error The exact color of a solution at its end point Instrumentation Error Personal Error Systematic error can be reduced by adopting greater care to the experimental design Such errors are consistent and can be detected and ultimately corrected Systematic errors will affect accuracy of results

18 Systematic Error
19 Experimental Errors Random Errors Occur because of uncontrolled variables in an experiment and therefore cannot be eliminated Can be reduced by repeating measurements Affect the precision of the results Examples Estimating quantity which lies between marked graduations of a particular instrument (burette, graduated cylinder) Not being able to read an instrument due to fluctuations in readings (temperature, airflow) Reaction time
20 Absolute and Relative Uncertainty Absolute uncertainty is the actual This is the size of the uncertainty relative to the value measured, and is usually size of the uncertainty in the units expressed as a percentage used to measure it. This is what the previous slide referred to Relative uncertainty can be calculated by dividing the absolute uncertainty by the measured value and multiplying by 100 In our ruler example, the absolute In our ruler example, the relative uncertainty is uncertainty is +/ cm 0.05 / 3.5 x 100 = 1.4% To minimise absolute uncertainty, To minimise relative uncertainty, you should aim to make bigger you should use the most accurate measurements equipment possible.
21 How do uncertainties affect my calculations? If the numbers you are putting into a calculation are uncertain, the result of the calculation will be too You need to be able to calculate the degree of uncertainty The Golden Rules: When adding/subtracting: add the absolute uncertainty When multiplying/dividing: add the relative uncertainty
22 Absolute and Relative Uncertainty Absolute uncertainty: margin of uncertainty associated with the result from a given measurement, ΔA Relative uncertainty: ratio comparing the size of the absolute uncertainty, ΔA, to the size of the measured experimental result relative uncertainty = ΔA A Experimental results should be reported as: experimental result = (A ± ΔA) unit
23 Example: A Titration A calibrated burette has an absolute uncertainty of ±0.02 cm3. During a titration, the volume of a 0.15mol dm-3 solution of hydrochloric acid at the end point was recorded as 12.25cm3. Calculate the associated relative uncertainty Absolute uncertainty = ±0.02 cm3 Measured experimental result (A) = (12.25 ±0.02) cm3 Relative uncertainty = ΔA = 0.02cm3 A 12.25cm3 Relative uncertainty percentage = 0.2% = 2 x 10⁻³
24 Example 2: A rate of reaction In an experiment on the rate of a reaction, a student timed how long it would take to produce 100 cm3 of gas, at a variety of different temperatures. At 30OC, it took seconds. The gas syringe used was accurate to +/ cm3. What is the average rate of reaction, and what is the relative uncertainty in this value? Rate = volume / time = 100 / 27 = 3.70 cm3s-1 Time is rounded to the nearest whole second as human reaction times do not allow for 2 decimal places of accuracy Absolute uncertainty of volume: +/ cm3 Absolute uncertainty of time: +/- 0.5s This is an approximation, taking into account reaction time and the difficulty of pressing stop exactly at 100 cm3. You should make similar approximations whenever you are manually recording time, and should write a short sentence to justify them
25 Example 2 continued Relative uncertainty of volume Relative uncertainty of time % Uncertainty = (absolute uncertainty / measured value) x 100 = 0.25/100 x 100 = 0.25% % Uncertainty = (0.5 / 27) x 100 = 1.85% Relative uncertainty of rate % Uncertainty (rate) = % uncertainty (volume) + % uncertainty (time) = = 2.10% The relative uncertainties were added as the rate calculation required a division calculation
26 Propagation of Uncertainty After identifying the uncertainties associated with experimentally measured quantities, the next step is to figure out how these different uncertainties combine to give the resultant uncertainty Rule 1: When adding or subtracting measurements, the absolute uncertainty associated with the net measured parameter is the square root of the sum of the squares of the absolute uncertainty Rule 2: When multiplying or dividing measurements, the relative uncertainty associated with the net measured parameter is the square root of the sum of the squares of their relative uncertainties

27 Percent Error The literature value for the standard enthalpy change of the decomposition reaction of calcium carbonate was found to be kJ. The experimental value was found to be kJ % error = x 100% = 3.4%
28 Lesson Graphical Techniques
29 Graphical Techniques Graphical techniques are effective means of communicating the effect of an independent variable on a dependent variable, and can lead to the determination of physical quantities Sketched graphs have labelled but unscaled axes, and are used to show qualitative trends, such as variables that are proportional or inversely proportional. Units generally would not be shown on a sketch, only the variables Drawn graphs have labelled and scaled axes, and are based on quantitative measurements. Drawn graphs always diplay the appropriate units for variables
30 Key Terms Dependence: any statistical relationship between two sets of data or between two random variables Independent Variable: the cause is plotted on the x-asix Dependent Variable: the effect is plotted on the y-axis Correlation: statistical measure and technique that indicates the degree and relationship between two sets of variables
31 Key Terms Positive Correlation: where the two variables increase or decrease in parallel to one another Negative Correlation: one variable increases while the second decreases or vice versa Correlation Coefficient: measure of the strength of the relationship between two variables, r r= +1 : perfect positive linear relationship r= 0: no linear relationship exists r= -1: perfect negative linear relationship Scatter Plots: show the scatter of various points on a graph
32

33 Slope or Gradient of Line, m The tangent of the angle that the line makes with the positive direction of the x-axis. Incline: + slope Decline: - slope

34 The Intercept, c The point where the line cuts the y-axis at x=0 The intercept can be found by: Extrapolation: extending the line Equation of the line as long as the slope is known y=mx + c
35 Best-Fit Line Data obtained from an experiment does not always contain data points that lie exactly along the line Best fit line does not always necessarily contain all the experimental data points
36 Lesson Spectroscopic Identification of Organic Compounds
37 Degree of Unsaturation The degree of unsaturation or index of hydrogen deficiency (IHD) can be used to determine from a molecular formula the number of rings or multiple bonds in a molecule Double bond-1 degree of unsaturation Triple bond-2 degrees of unsaturation RIng: 1 degree of unsaturation Aromatic ring-4 degrees of unsaturation
38 Degree of Unsaturation Benzene -One ring - Three double bonds IHD: 4 Cyclopentadiene Cyclobutane -One ring IHD: 1 -One ring -Two double bonds IHD: 3

39 Degree of Unsaturation 2-acetylbenzoic acid (aspirin) -One ring -Five double bonds IHD: 6 Ethyne -One triple bond IHD: 2
40 Degree of Unsaturation CcHhNnOoXx X is a halogen (F, Cl, Br, or I) IHD= 0.5(2c+2-h-x+n) Given C4H8O2 deduce the IHD c=4 h=8 n=0 o=2 x=0 IHD=0.5( ) = 1 The molecule must contain either one double bond or one ring. There are several isomers of C4H8O2


41 Degree of Unsaturation Possible isomers of C4H8O2 with IHD of 1
: 3.00 x 10⁸ ms-1 λ h (Plank s constant): 6.")
42 Electromagnetic Spectrum Energy, E is directly related to the frequency,, and inversely related to wavelength, λ E=h =hc c (speed of light): 3.00 x 10⁸ ms-1 λ h (Plank s constant): x J s
43 Electromagnetic Spectrum The various regions are the basis of different types of spectroscopy (the study of the way matter interacts with radiation) and various techniques are used to identify the structures of substances
44 Regions of the EMS X-rays: high energy, cause electrons to be removed from the inner energy levels of atoms. Diffraction patterns can lead to information such as bond distances and bond angles in a structure Basis for x-ray crystallography Visible light and Ultraviolet (UV) light: give rise to electronic transitions and hence this type of spectroscopy gives information about the electronic energy levels in an atom or molecule. Basis for UV-vis spectroscopy Infrared Radiation: causes certain bonds in a molecule to vibrate (stretch and bend) and provides information on the functional groups present. Basis of IR spectroscopy
45 Regions of the EMS Microwaves: cause molecular rotations and can give information on bond lengths Radio Waves: cause nuclear transitions in a strong magnetic field because radio waves can be absorbed by certain nuclei, which causes their spin states to change. Nuclear Magnetic Resonance (NMR) is based on this and information on different chemical environments of atoms can be deduced, which leads to information on the connectivity of the atoms present in a molecule
46 Types of Spectroscopy Three different types of spectroscopy that form the cornerstone of the spectroscopic identification of organic molecules Infrared (IR) spectroscopy: determines the bonds in organic molecules Proton nuclear magnetic resonance (1H NMR) spectroscopy: shows the chemical environments of isotopes (mostly used with hydrogen) Mass spectrometry (MS): determines the relative atomic and molecular masses. Fragmentation patterns are useful with organic
47 Infrared Spectroscopy IR radiation does not have sufficient energy to result in electronic transitions but can cause molecular vibrations which result from the vibration of certain groups of molecules about their bonds Helps identify various functional groups in a molecule Vibrational transitions correspond to definite energy levels
, bent, or twisted The force required to cause the vibration is based on")
48 Infrared Spectroscopy Spring model: covalent bonds are thought of as springs that have vibrations Spring can be stretched (symmetrically and asymmetrically), bent, or twisted The force required to cause the vibration is based on Hooke s law
49 Infrared Spectroscopy Lighter atoms will vibrate at higher frequencies and heavier atoms will vibrate at lower frequencies Molecule Bond Enthalpy/ kj mol-1 Wavenumber/cm-1 H-Cl H-Br H-I The same applies for multiple bonds Imagine two atoms connected by a spring, the stronger the bond connecting the two atoms the tighter the string will be and therefore more energy is required to stretch it For diatomic molecules only one form of vibration is possible, stretching
50 Infrared Spectroscopy Polyatomic species may have several modes of vibration Symmetric stretch Asymmetric stretch Symmetric bend


51 Infrared Spectroscopy For a covalent bond to absorb IR radiation there must be a change in the molecular dipole moment associated with the vibration mode non-polar IR inactive non-polar IR inactive asymmetric stretch symmetric bend
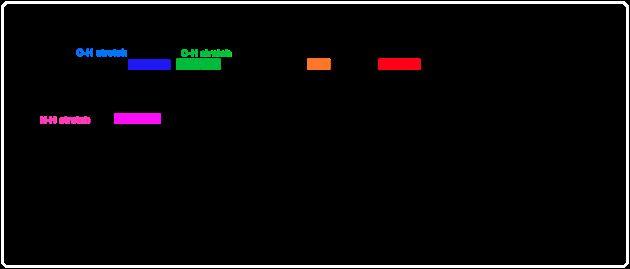
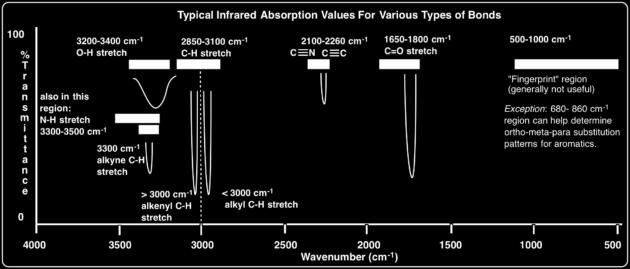
52 Infrared Spectroscopy The absorbance, A, is related to the transmittance by A=-log10T IR spectrum is a plot of the percentage transmittance, %T versus the wavenumber in cm-1, where %T ranges from 0% to 100%. Functional groups can be identified YOU WILL NEED TO BE VERY FAMILIAR WITH THE NAME AND STRUCTURE OF FUNCTIONAL GROUPS
53 Infrared Spectroscopy A bond will only interact with IR radiation if it is a polar covalent bond Non-polar bonds DO NOT absorb IR radiation Intensity depends on dipole moment of bonds: Strong polar bonds produce strong bands Bonds with medium polarity produce medium bonds Weak bonds produce weak bands

54 Infrared Spectroscopy Functional Groups
55 Infrared Spectroscopy Typical proton shift
56 Infrared Spectroscopy

57 Infrared Spectroscopy

58 1 H NMR Spectroscopy Gives information on the different chemical environments of hydrogen atoms in a molecule Considered the most important structural technique available to organic chemists
59 1 H NMR Spectroscopy Nuceli of hydrogen atoms can exist in two possible spin states and behave as tiny magnets When nuclei are placed in magnetic fields the spin states may align with the magnetic field or against it creating two nuclear energy levels
60 1 H NMR Spectroscopy The position of the NMR signal relative to a standard (tetramethylsilane, TMS) is the chemical shift,, expressed in parts per million (ppm) of the proton for TMS is 0 ppm 1 H NMR spectrum shows the number of different chemical environments in which the hydrogen atoms are found
61 1 H NMR Spectroscopy Typical proton shift
62 1 H NMR Spectroscopy
63 1 H NMR Spectroscopy
64 1 H NMR Spectroscopy Integration trace: shows the relative number of hydrogen atoms present Magnetic Resonance Imaging (MRI): gives a 3D view of organs in the human body

65 1 H NMR Spectroscopy Number of peaks 1 chemical environment 1 peak 2 chemical environments 2 peaks 3 chemical environments 3 peaks
66 Mass Spectrometry (MS) When a gaseous molecule is ionized its molecular ion, M+ is formed The molecular ion peak in a mass spectrum corresponds to the molecular mass of the compound Due to the highly energetic ionization process involved in a mass spectrometer, the molecule can break up into fragments, some being ions The fragmentation pattern provides further information on certain functional groups present in a molecule
67 Mass Spectrometry (MS) Ar= (31.5)(23) + (32.5)(10) + (63)(46) + (65)(21) / 100 Ar= 53.2

68 Mass Spectrometry (MS) Lighter particles Heavier particles
69 Mass Spectrometry (MS) When the vaporized organic sample passes into the ionization chamber, it is bombarded by a stream of electrons M(g) + e- M+(g) + 2e- The M+ ion is known as the molecular ion Fragments are produced to produce information about structure
70 Mass Spectrometry (MS) Examples: (Table 15 from Data Booklet) (Mr-15)+ results from the loss of -CH3 (Mr-17)+ results from the loss of -OH (Mr-29)+ results from the loss of -CHO or -CH2CH3 (Mr-31)+ results from the loss of -OCH3 (Mr-45)+ results from the loss of -COOH
71 Mass Spectrometry (MS) Mr C2H3O+ COOH+ CH3+ Peak at m/z 45 Peak at m/z 43 Peak at m/z 15 (60-45)=15 mass loss (60-43)=17 mass loss (60-15)=45 mass loss -CH3 -OH -COOH
72 Lesson Spectroscopic Identification of Organic Compounds
73 High Resolution 1H NMR

74 High Resolution 1H NMR Shows further splitting of some absorptions Splitting patterns result from spin-spin coupling Higher energy Less stable Lower energy More stable

75 +1/2-1/2
76 High Resolution 1H NMR Four combination possible: Ha1 and Ha2 magnetic moment aligned with B0 (deshields Hb, so signal is shifted downfield to higher ) Ha1 magnetic moment aligned with B0 and Ha2 magnetic moment aligned against B0 Ha1 magnetic moment aligned against B0 and Ha2 magnetic moment aligned with B0 Ha1 and Ha2 magnetic moments aligned against B0 (shields Hb, so signal is shifted upfield to a lower ) B0

77 High Resolution 1H NMR Increased magnetic field strength
78 High Resolution 1H NMR Pascal s triangle can be used to deduce the splitting patterns This gives the ratio of intensities
 peaks 2.")
79 High Resolution 1H NMR Spin-Spin coupling depends on the way hydrogens are related to each other in the bonding arrangements within the molecule Two Rules 1. If a proton Ha, has n protons as its nearest neighbors, that is n x Hb, then the peak of Ha will split into (n+1) peaks 2. The ratio of the intensities of the lines of the split peak can be deduced from Pascal s triangle
80 High Resolution 1H NMR 1 1 : 1 1 : 2 : 1 1 : 3 : 3 : 1
81 High Resolution 1H NMR
82 High Resolution 1H NMR Heights can be used to obtain the ratio of the number of protons in each environment

83 High Resolution 1H NMR TMS is used because the 12 protons are in the same chemical environment causing a single peak which will be strong = 0 ppm, protons in organic compounds will typically absorb more downfield in relation to TMS TMS is inert so it is fairly unreactive and will not interfere with the sample being analyzed It can be easily removed from the sample because it is volatile with low boiling point

84 High Resolution 1H NMR Protons in water molecules within human cells can be detected by magnetic resonance imaging (MRI), giving 3D view of organs in the human body MRI instruments can detect chemical changes in the brain This has allowed scientists to pinpoint specific regions of the brain itself where brain activity is taking place and gain an understanding of chemical principles of the thought process

85 X-Ray Crystallography The structural technique of single crystal X-ray crystallography can be used to identify the bond lengths and bond angles of crystalline structures, both organic and inorganic

86 X-Ray Crystallography The X-rays strike the crystals and are diffracted into many specific directions depending on the location of electrons within the sample The 3D model of the electron density can be created and the mean position of the atoms are calculated
All measurement has a limit of precision and accuracy, and this must be taken into account when evaluating experimental results.
 Chapter 11: Measurement and data processing and analysis 11.1 Uncertainty and error in measurement and results All measurement has a limit of precision and accuracy, and this must be taken into account
Unit 11 Instrumentation. Mass, Infrared and NMR Spectroscopy
 Unit 11 Instrumentation Mass, Infrared and NMR Spectroscopy Spectroscopic identification of organic compounds Qualitative analysis: presence but not quantity (i.e. PEDs) Quantitative analysis: quantity
Symmetric Stretch: allows molecule to move through space
 BACKGROUND INFORMATION Infrared Spectroscopy Before introducing the subject of IR spectroscopy, we must first review some aspects of the electromagnetic spectrum. The electromagnetic spectrum is composed
The rest of topic 11 INTRODUCTION TO ORGANIC SPECTROSCOPY
 The rest of topic 11 INTRODUCTION TO ORGANIC SPECTROSCOPY 1. Mass spectrometry: SPECTROSCOPIC TECHNIQUES - A technique capable of identifying the presence of various mass segments of organic molecules.
NUCLEAR MAGNETIC RESONANCE AND INTRODUCTION TO MASS SPECTROMETRY
 NUCLEAR MAGNETIC RESONANCE AND INTRODUCTION TO MASS SPECTROMETRY A STUDENT SHOULD BE ABLE TO: 1. Identify and explain the processes involved in proton ( 1 H) and carbon-13 ( 13 C) nuclear magnetic resonance
Chapter 13 Spectroscopy
 hapter 13 Spectroscopy Infrared spectroscopy Ultraviolet-Visible spectroscopy Nuclear magnetic resonance spectroscopy Mass Spectrometry 13.1 Principles of Molecular Spectroscopy: Electromagnetic Radiation
7a. Structure Elucidation: IR and 13 C-NMR Spectroscopies (text , , 12.10)
") 2009, Department of Chemistry, The University of Western Ontario 7a.1 7a. Structure Elucidation: IR and 13 C-NMR Spectroscopies (text 11.1 11.5, 12.1 12.5, 12.10) A. Electromagnetic Radiation Energy is
2009, Department of Chemistry, The University of Western Ontario 7a.1 7a. Structure Elucidation: IR and 13 C-NMR Spectroscopies (text 11.1 11.5, 12.1 12.5, 12.10) A. Electromagnetic Radiation Energy is
ORGANIC - CLUTCH CH ANALYTICAL TECHNIQUES: IR, NMR, MASS SPECT
 !! www.clutchprep.com CONCEPT: PURPOSE OF ANALYTICAL TECHNIQUES Classical Methods (Wet Chemistry): Chemists needed to run dozens of chemical reactions to determine the type of molecules in a compound.
Principles of Molecular Spectroscopy: Electromagnetic Radiation and Molecular structure. Nuclear Magnetic Resonance (NMR)
") Principles of Molecular Spectroscopy: Electromagnetic Radiation and Molecular structure Nuclear Magnetic Resonance (NMR) !E = h" Electromagnetic radiation is absorbed when the energy of photon corresponds
Principles of Molecular Spectroscopy: Electromagnetic Radiation and Molecular structure Nuclear Magnetic Resonance (NMR) !E = h" Electromagnetic radiation is absorbed when the energy of photon corresponds
IB Topics 1 & 11 Multiple Choice Practice
 IB Topics 1 & 11 Multiple Choice Practice 1. How many atoms of nitrogen are there in 0.50 mol of (NH 4) 2CO 3? 1 2 3.01 10 23 6.02 10 23 2. What is the value of x when 32.2 g of Na 2SO 4 xh 2O are heated
ORGANIC - CLUTCH CH ANALYTICAL TECHNIQUES: IR, NMR, MASS SPECT
 !! www.clutchprep.com CONCEPT: PURPOSE OF ANALYTICAL TECHNIQUES Classical Methods (Wet Chemistry): Chemists needed to run dozens of chemical reactions to determine the type of molecules in a compound.
Structure Determination
 There are more than 5 million organic compounds, the great majority of which are colourless liquids or white solids. Identifying or at least characterising determining some of its properties and features
Unit 3 Organic Chemistry. 3.3 Structural Analysis Part 2:
 Unit 3 Organic Chemistry 3.3 Structural Analysis Part 2: Mass Spectroscopy Infra-red Spectroscopy NMR Proton Spectroscopy Answers to Questions in Notes Learning Outcomes Exam Questions & Answers MODIFIED
Experiment 2 - NMR Spectroscopy
 Experiment 2 - NMR Spectroscopy OBJECTIVE to understand the important role of nuclear magnetic resonance spectroscopy in the study of the structures of organic compounds to develop an understanding of
Welcome to Organic Chemistry II
 Welcome to Organic Chemistry II Erika Bryant, Ph.D. erika.bryant@hccs.edu Class Syllabus 3 CHAPTER 12: STRUCTURE DETERMINATION 4 What is this solution Soda Tea Coffee??? 5 What is this solution Soda Tea
4) protons experience a net magnetic field strength that is smaller than the applied magnetic field.
 protons experience a net magnetic field strength that is smaller than the applied magnetic field.") 1) Which of the following CANNOT be probed by an NMR spectrometer? See sect 15.1 Chapter 15: 1 A) nucleus with odd number of protons & odd number of neutrons B) nucleus with odd number of protons &even
1) Which of the following CANNOT be probed by an NMR spectrometer? See sect 15.1 Chapter 15: 1 A) nucleus with odd number of protons & odd number of neutrons B) nucleus with odd number of protons &even
Spectroscopy. Empirical Formula: Chemical Formula: Index of Hydrogen Deficiency (IHD)
") Spectroscopy Empirical Formula: Chemical Formula: Index of Hydrogen Deficiency (IHD) A)From a structure: B)From a molecular formula, C c H h N n O o X x, Formula for saturated hydrocarbons: Subtract the
Spectroscopy Empirical Formula: Chemical Formula: Index of Hydrogen Deficiency (IHD) A)From a structure: B)From a molecular formula, C c H h N n O o X x, Formula for saturated hydrocarbons: Subtract the
Chapter 9. Nuclear Magnetic Resonance. Ch. 9-1
 Chapter 9 Nuclear Magnetic Resonance Ch. 9-1 1. Introduction Classic methods for organic structure determination Boiling point Refractive index Solubility tests Functional group tests Derivative preparation
Objective 4. Determine (characterize) the structure of a compound using IR, NMR, MS.
 the structure of a compound using IR, NMR, MS.") Objective 4. Determine (characterize) the structure of a compound using IR, NMR, MS. Skills: Draw structure IR: match bond type to IR peak NMR: ID number of non-equivalent H s, relate peak splitting to
Objective 4. Determine (characterize) the structure of a compound using IR, NMR, MS. Skills: Draw structure IR: match bond type to IR peak NMR: ID number of non-equivalent H s, relate peak splitting to
Infrared Spectroscopy
 Infrared Spectroscopy Introduction Spectroscopy is an analytical technique which helps determine structure. It destroys little or no sample. The amount of light absorbed by the sample is measured as wavelength
NMR = Nuclear Magnetic Resonance
 NMR = Nuclear Magnetic Resonance NMR spectroscopy is the most powerful technique available to organic chemists for determining molecular structures. Looks at nuclei with odd mass numbers or odd number
Accuracy: An accurate measurement is a measurement.. It. Is the closeness between the result of a measurement and a value of the measured.
 Chemical Analysis can be of two types: Chapter 11- Measurement and Data Processing: - : Substances are classified on the basis of their or properties, such as - : The amount of the sample determined in
Nuclear Magnetic Resonance (NMR) Spectroscopy Introduction:
 Spectroscopy Introduction:") Nuclear Magnetic Resonance (NMR) Spectroscopy Introduction: Nuclear magnetic resonance spectroscopy (NMR) is the most powerful tool available for organic structure determination. Like IR spectroscopy,
Nuclear Magnetic Resonance (NMR) Spectroscopy Introduction: Nuclear magnetic resonance spectroscopy (NMR) is the most powerful tool available for organic structure determination. Like IR spectroscopy,
4) protons experience a net magnetic field strength that is smaller than the applied magnetic field.
 protons experience a net magnetic field strength that is smaller than the applied magnetic field.") 1) Which of the following CANNOT be probed by an spectrometer? See sect 15.1 Chapter 15: 1 A) nucleus with odd number of protons & odd number of neutrons B) nucleus with odd number of protons &even number
1) Which of the following CANNOT be probed by an spectrometer? See sect 15.1 Chapter 15: 1 A) nucleus with odd number of protons & odd number of neutrons B) nucleus with odd number of protons &even number
Lecture 14 Organic Chemistry 1
 CHEM 232 Organic Chemistry I at Chicago Lecture 14 Organic Chemistry 1 Professor Duncan Wardrop February 25, 2010 1 CHEM 232 Organic Chemistry I at Chicago Mass Spectrometry Sections: 13.24-13.25 2 Spectroscopy
Chapter 12 Mass Spectrometry and Infrared Spectroscopy
 Organic Chemistry, 6 th Edition L. G. Wade, Jr. Chapter 12 Mass Spectrometry and Infrared Spectroscopy Jo Blackburn Richland College, Dallas, TX Dallas County Community College District 2006, Prentice
Spectroscopy in Organic Chemistry. Types of Spectroscopy in Organic
 Spectroscopy in Organic Chemistry Spectroscopy Spectrum dealing with light, or more specifically, radiation Scope to see Organic Spectroscopy therefore deals with examining how organic molecules interact
Nuclear Magnetic Resonance H-NMR Part 1 Introduction to NMR, Instrumentation, Sample Prep, Chemical Shift. Dr. Sapna Gupta
 Nuclear Magnetic Resonance H-NMR Part 1 Introduction to NMR, Instrumentation, Sample Prep, Chemical Shift Dr. Sapna Gupta Introduction NMR is the most powerful tool available for organic structure determination.
Chapter 15 Lecture Outline
 Organic Chemistry, First Edition Janice Gorzynski Smith University of Hawaii Chapter 5 Lecture Outline Introduction to NMR Two common types of NMR spectroscopy are used to characterize organic structure:
ORGANIC - EGE 5E CH NUCLEAR MAGNETIC RESONANCE SPECTROSCOPY
 !! www.clutchprep.com CONCEPT: PURPOSE OF ANALYTICAL TECHNIQUES Classical Methods (Wet Chemistry): Chemists needed to run dozens of chemical reactions to determine the type of molecules in a compound.
Experiment 11: NUCLEAR MAGNETIC RESONANCE SPECTROSCOPY
 Experiment 11: NUCLEAR MAGNETIC RESONANCE SPECTROSCOPY Purpose: This is an exercise to introduce the use of nuclear magnetic resonance spectroscopy, in conjunction with infrared spectroscopy, to determine
Lecture 2 nmr Spectroscopy
 Lecture 2 nmr Spectroscopy Pages 427 430 and Chapter 13 Molecular Spectroscopy Molecular spectroscopy: the study of the frequencies of electromagnetic radiation that are absorbed or emitted by substances
11.1 Uncertainty and error in measurement (1 Hour) 11.2 Uncertainties in calculated results (0.5 Hour) 11.3 Graphical techniques (0.
 11.2 Uncertainties in calculated results (0.5 Hour) 11.3 Graphical techniques (0.") Chapter 11 Measurement and Data Processing Page 1 Students are to read and complete any part that requires answers and will submit this assignment on the first day of class. You may use internet sources
Chapter 11 Measurement and Data Processing Page 1 Students are to read and complete any part that requires answers and will submit this assignment on the first day of class. You may use internet sources
Chapter 13: Molecular Spectroscopy
 Chapter 13: Molecular Spectroscopy Electromagnetic Radiation E = hν h = Planck s Constant (6.63 x 10⁻³⁴ J. s) ν = frequency (s -1 ) c = νλ λ = wavelength (nm) Energy is proportional to frequency Spectrum
3.15 Nuclear Magnetic Resonance Spectroscopy, NMR
 3.15 Nuclear Magnetic Resonance Spectroscopy, NMR What is Nuclear Magnetic Resonance - NMR Developed by chemists and physicists together it works by the interaction of magnetic properties of certain nuclei
16.1 Introduction to NMR. Spectroscopy
 16.1 Introduction to NMR What is spectroscopy? Spectroscopy NUCLEAR MAGNETIC RESNANCE (NMR) spectroscopy may be the most powerful method of gaining structural information about organic compounds. NMR involves
12. Structure Determination: Mass Spectrometry and Infrared Spectroscopy
 12. Structure Determination: Mass Spectrometry and Infrared Spectroscopy Determining the Structure of an Organic Compound The analysis of the outcome of a reaction requires that we know the full structure
Calculate a rate given a species concentration change.
 Kinetics Define a rate for a given process. Change in concentration of a reagent with time. A rate is always positive, and is usually referred to with only magnitude (i.e. no sign) Reaction rates can be
William H. Brown & Christopher S. Foote
 Requests for permission to make copies of any part of the work should be mailed to:permissions Department, Harcourt Brace & Company, 6277 Sea Harbor Drive, Orlando, Florida 32887-6777 William H. Brown
Nuclear spin and the splitting of energy levels in a magnetic field
 Nuclear spin and the splitting of energy levels in a magnetic field Top 3 list for 13 C NMR Interpretation 1. Symmetry 2. Chemical Shifts 3. Multiplicity 13 C NMR of C 3 O 1 NMR of C 3 O 13 C NMR of C
Chapter 14. Nuclear Magnetic Resonance Spectroscopy
 Organic Chemistry, Second Edition Janice Gorzynski Smith University of Hawai i Chapter 14 Nuclear Magnetic Resonance Spectroscopy Prepared by Rabi Ann Musah State University of New York at Albany Copyright
- 1/2. = kb o = hνν + 1/2. B o increasing magnetic field strength. degenerate at B o = 0
 NMR EXPERIMENT When magnetically active nuclei are placed into an external magnetic field, the magnetic fields align themselves with the external field into two orientations. During the experiment, electromagnetic
Infrared Spectroscopy
 Infrared Spectroscopy The Interaction of Light with Matter Electric fields apply forces to charges, according to F = qe In an electric field, a positive charge will experience a force, but a negative charge
Infrared Spectroscopy: Identification of Unknown Substances
 Infrared Spectroscopy: Identification of Unknown Substances Suppose a white powder is one of the four following molecules. How can they be differentiated? H N N H H H H Na H H H H H A technique that is
Chapter 13. R.F.----µ-wave----I.R. (Heat)------Visible------U.V X-Ray------γ-Ray SPECTROSCOPY. Definition: Types to Be Covered:
------Visible------U.V X-Ray------γ-Ray SPECTROSCOPY. Definition: Types to Be Covered:") hamras Glendale ommunity ollege rganic hemistry 105 Exam 4 Materials hapter 13 SPETRSPY Definition: Types to Be overed: A) Infrared Spectroscopy (IR) B) Nuclear Magnetic Resonance Spectroscopy (NMR) )
hamras Glendale ommunity ollege rganic hemistry 105 Exam 4 Materials hapter 13 SPETRSPY Definition: Types to Be overed: A) Infrared Spectroscopy (IR) B) Nuclear Magnetic Resonance Spectroscopy (NMR) )
Nuclear Magnetic Resonance Spectroscopy (NMR)
") OCR Chemistry A 432 Spectroscopy (NMR) What is it? An instrumental method that gives very detailed structural information about molecules. It can tell us - how many of certain types of atom a molecule
OCR Chemistry A 432 Spectroscopy (NMR) What is it? An instrumental method that gives very detailed structural information about molecules. It can tell us - how many of certain types of atom a molecule
IR, MS, UV, NMR SPECTROSCOPY
 CHEMISTRY 318 IR, MS, UV, NMR SPECTROSCOPY PROBLEM SET All Sections CHEMISTRY 318 IR, MS, UV, NMR SPECTROSCOPY PROBLEM SET General Instructions for the 318 Spectroscopy Problem Set Consult the Lab Manual,
CHM 223 Organic Chemistry I Prof. Chad Landrie. Lecture 10: September 20, 2018 Ch. 12: Spectroscopy mass spectrometry infrared spectroscopy
 M 223 Organic hemistry I Prof. had Landrie Lecture 10: September 20, 2018 h. 12: Spectroscopy mass spectrometry infrared spectroscopy i>licker Question onsider a solution that contains 65g R enantiomer
Chapter 14 Spectroscopy
 hapter 14 Spectroscopy There are four major analytical techniques used for identifying the structure of organic molecules 1. Nuclear Magnetic Resonance or NMR is the single most important technique for
NMRis the most valuable spectroscopic technique for organic chemists because it maps the carbon-hydrogen framework of a molecule.
 Chapter 13: Nuclear magnetic resonance spectroscopy NMRis the most valuable spectroscopic technique for organic chemists because it maps the carbon-hydrogen framework of a molecule. 13.2 The nature of
16.1 Introduction to NMR Spectroscopy. Spectroscopy. Spectroscopy. Spectroscopy. Spectroscopy. Spectroscopy 4/11/2013
 What is spectroscopy? NUCLEAR MAGNETIC RESONANCE (NMR) spectroscopy may be the most powerful method of gaining structural information about organic compounds. NMR involves an interaction between electromagnetic
4) protons experience a net magnetic field strength that is smaller than the applied magnetic field.
 protons experience a net magnetic field strength that is smaller than the applied magnetic field.") 1) Which of the following CANNOT be probed by an spectrometer? See sect 16.1 Chapter 16: 1 A) nucleus with odd number of protons & odd number of neutrons B) nucleus with odd number of protons &even number
1) Which of the following CANNOT be probed by an spectrometer? See sect 16.1 Chapter 16: 1 A) nucleus with odd number of protons & odd number of neutrons B) nucleus with odd number of protons &even number
Structure Determination: Nuclear Magnetic Resonance Spectroscopy
 Structure Determination: Nuclear Magnetic Resonance Spectroscopy Why This Chapter? NMR is the most valuable spectroscopic technique used for structure determination More advanced NMR techniques are used
Introduction. The analysis of the outcome of a reaction requires that we know the full structure of the products as well as the reactants
 Introduction The analysis of the outcome of a reaction requires that we know the full structure of the products as well as the reactants Spectroscopy and the Electromagnetic Spectrum Unlike mass spectrometry,
Unit 2 Organic Chemistry. 2.3 Structural Analysis Part 2:
 CFE ADVANCED HIGHER Unit 2 Organic Chemistry 2.3 Structural Analysis Part 2: Mass Spectroscopy Infra-red Spectroscopy NMR Proton Spectroscopy Answers to Questions in Notes Learning Outcomes Exam Questions
Chemistry 151 Spring Section 01 MWF 9:10-10:00 am - MWF 9:10-10:00 am. Course Name: Course Code: N/A
 Course Name: Chemistry 151 Spring 2018 - Section 01 MWF 9:10-10:00 am - MWF 9:10-10:00 am Course Code: N/A ALEKS Course: General Chemistry (First Semester) Instructor: Prof. Hascall Course Dates: Begin:
Lecture 11. IR Theory. Next Class: Lecture Problem 4 due Thin-Layer Chromatography
 Lecture 11 IR Theory Next Class: Lecture Problem 4 due Thin-Layer Chromatography This Week In Lab: Ch 6: Procedures 2 & 3 Procedure 4 (outside of lab) Next Week in Lab: Ch 7: PreLab Due Quiz 4 Ch 5 Final
Chemistry 213 Practical Spectroscopy
 Chemistry 213 Practical Spectroscopy Dave Berg djberg@uvic.ca Elliott 314 A course in determining structure by spectroscopic methods Different types of spectroscopy afford different information about molecules
E35 SPECTROSCOPIC TECHNIQUES IN ORGANIC CHEMISTRY
 E35 SPECTRSCPIC TECNIQUES IN RGANIC CEMISTRY Introductory Comments. These notes are designed to introduce you to the basic spectroscopic techniques which are used for the determination of the structure
Infrared Spectroscopy (IR)
") IR Infrared Spectroscopy (IR) Introduction to Infrared Spectroscopy (IR) IR Infrared Spectroscopy (IR) One of the first scientists to observe infrared radiation was William Herschel in the early 19th
IR Infrared Spectroscopy (IR) Introduction to Infrared Spectroscopy (IR) IR Infrared Spectroscopy (IR) One of the first scientists to observe infrared radiation was William Herschel in the early 19th
Chapter 13 Structure t Determination: Nuclear Magnetic Resonance Spectroscopy
 John E. McMurry www.cengage.com/chemistry/mcmurry Chapter 13 Structure t Determination: ti Nuclear Magnetic Resonance Spectroscopy Revisions by Dr. Daniel Holmes MSU Paul D. Adams University of Arkansas
Module 13: Chemical Shift and Its Measurement
 Subject Chemistry Paper No and Title Module No and Title Module Tag Paper 12: Organic Spectroscopy CHE_P12_M13_e-Text TABLE OF CONTENTS 1. Learning Outcomes 2. Introduction 3. Shielding and deshielding
Lecture 13 Organic Chemistry 1
 EM 232 rganic hemistry I at hicago Lecture 13 rganic hemistry 1 Professor Duncan Wardrop February 23, 2010 1 EM 232 rganic hemistry I at hicago Spectroscopy & Spectrometry hapter 13 2 EM 232 rganic hemistry
Introduction to Organic Spectroscopy
 Introduction to rganic Spectroscopy Chem 8361/4361: Interpretation of rganic Spectra 2009 2013 Andrew Harned & Regents of the University of Minnesota What is spectroscopy?? From Wikipedia Spectroscopy:
January 30, 2018 Chemistry 328N
 Lecture 4 Some More nmr January 30, 2018 Tricks for solving unknowns Review. Empirical formula is lowest common denominator ratio of atomic composition From Homework: unknown has an empirical formula of
ORGANIC - BROWN 8E CH NUCLEAR MAGNETIC RESONANCE.
 !! www.clutchprep.com CONCEPT: 1 H NUCLEAR MAGNETIC RESONANCE- GENERAL FEATURES 1 H (Proton) NMR is a powerful instrumental method that identifies protons in slightly different electronic environments
The Use of NMR Spectroscopy
 Spektroskopi Molekul Organik (SMO): Nuclear Magnetic Resonance (NMR) Spectroscopy All is adopted from McMurry s Organic Chemistry The Use of NMR Spectroscopy Used to determine relative location of atoms
see page 8 of these notes )
") UNIT 1 Note Packet INTRODUCTION TO CHEMISTRY Name: METRICS AND MEASUREMENT In the chemistry classroom and lab, the metric system of measurement is used, so it is important to know what you are measuring,
UNIT 1 Note Packet INTRODUCTION TO CHEMISTRY Name: METRICS AND MEASUREMENT In the chemistry classroom and lab, the metric system of measurement is used, so it is important to know what you are measuring,
CH Exam #4 (Take Home) Date Due: 11/25,26/2013
 Date Due: 11/25,26/2013") CH2710 - Exam #4 (Take Home) Date Due: 11/25,26/2013 Section I - Multiple Choice - Choose the BEST answer from the choices given and place the letter of you choice in the space provided. 1. Energy absorbed
CH2710 - Exam #4 (Take Home) Date Due: 11/25,26/2013 Section I - Multiple Choice - Choose the BEST answer from the choices given and place the letter of you choice in the space provided. 1. Energy absorbed
Spectroscopy. a laboratory method of analyzing matter using electromagnetic radiation.
 Spectroscopy a laboratory method of analyzing matter using electromagnetic radiation. Mass Spectrometry Determines the relative abundance of the different isotopes of an element Used to determine the average
Spectroscopy. a laboratory method of analyzing matter using electromagnetic radiation
 Spectroscopy a laboratory method of analyzing matter using electromagnetic radiation The electromagnetic spectrum Radiation Scale of Absorption involves: Example of spectroscopy Gamma rays pm Nuclear reactions
2. Infrared spectroscopy
 2. Infrared spectroscopy 2-1Theoretical principles An important tool of the organic chemist is Infrared Spectroscopy, or IR. IR spectra are acquired on a special instrument, called an IR spectrometer.
Making measurements and manipulating experimental results
 Making measurements and manipulating experimental results Much of science, including the chemical sciences, is about making measurements and then manipulating them using them to calculate another quantity
Section 3 Using Scientific Measurements. Look at the specifications for electronic balances. How do the instruments vary in precision?
 Lesson Starter Look at the specifications for electronic balances. How do the instruments vary in precision? Discuss using a beaker to measure volume versus using a graduated cylinder. Which is more precise?
where, c is the speed of light, ν is the frequency in wave numbers (cm -1 ) and µ is the reduced mass (in amu) of A and B given by the equation: ma
 and µ is the reduced mass (in amu) of A and B given by the equation: ma") Vibrational Spectroscopy A rough definition of spectroscopy is the study of the interaction of matter with energy (radiation in the electromagnetic spectrum). A molecular vibration is a periodic distortion
Vibrational Spectroscopy A rough definition of spectroscopy is the study of the interaction of matter with energy (radiation in the electromagnetic spectrum). A molecular vibration is a periodic distortion
(2) Read each statement carefully and pick the one that is incorrect in its information.
 Read each statement carefully and pick the one that is incorrect in its information.") Organic Chemistry - Problem Drill 17: IR and Mass Spectra No. 1 of 10 1. Which statement about infrared spectroscopy is incorrect? (A) IR spectroscopy is a method of structure determination based on the
Organic Chemistry - Problem Drill 17: IR and Mass Spectra No. 1 of 10 1. Which statement about infrared spectroscopy is incorrect? (A) IR spectroscopy is a method of structure determination based on the
NMR Spectroscopy. Chapter 19
 NMR Spectroscopy Chapter 19 Nuclear Magnetic Resonance spectroscopy is a powerful analytical technique used to characterize organic molecules by identifying carbon-hydrogen frameworks within molecules.
Electrophiles are attracted to the π bond Addition sees a π bond replaced with a σ bond There are many different types of addition reactions:
 Nucleophiles and Electrophiles Nucleophiles are the atoms that donates the electron pairs and is added to the molecules (In the example above this is the CN) Electrophiles are the atoms that seek electron
AQA A2 CHEMISTRY TOPIC 4.10 ORGANIC SYNTHESIS AND ANALYSIS TOPIC 4.11 STRUCTURE DETERMINATION BOOKLET OF PAST EXAMINATION QUESTIONS
 AQA A2 CHEMISTRY TOPIC 4.10 ORGANIC SYNTHESIS AND ANALYSIS TOPIC 4.11 STRUCTURE DETERMINATION BOOKLET OF PAST EXAMINATION QUESTIONS 1 1. Consider the following reaction sequence. CH 3 CH 3 CH 3 Step 1
Big Idea #5: The laws of thermodynamics describe the essential role of energy and explain and predict the direction of changes in matter.
 KUDs for Unit 6: Chemical Bonding Textbook Reading: Chapters 8 & 9 Big Idea #2: Chemical and physical properties of materials can be explained by the structure and the arrangement of atoms, ion, or molecules
13.24: Mass Spectrometry: molecular weight of the sample
 hapter 13: Spectroscopy Methods of structure determination Nuclear Magnetic Resonances (NMR) Spectroscopy (Sections 13.3-13.19) Infrared (IR) Spectroscopy (Sections 13.20-13.22) Ultraviolet-visible (UV-Vis)
OAT Organic Chemistry - Problem Drill 19: NMR Spectroscopy and Mass Spectrometry
 OAT Organic Chemistry - Problem Drill 19: NMR Spectroscopy and Mass Spectrometry Question No. 1 of 10 Question 1. Which statement concerning NMR spectroscopy is incorrect? Question #01 (A) Only nuclei
CHEM 241 UNIT 5: PART A DETERMINATION OF ORGANIC STRUCTURES BY SPECTROSCOPIC METHODS [MASS SPECTROMETRY]
![CHEM 241 UNIT 5: PART A DETERMINATION OF ORGANIC STRUCTURES BY SPECTROSCOPIC METHODS [MASS SPECTROMETRY]](/thumbs/83/88348834.jpg "CHEM 241 UNIT 5: PART A DETERMINATION OF ORGANIC STRUCTURES BY SPECTROSCOPIC METHODS [MASS SPECTROMETRY]") CHEM 241 UNIT 5: PART A DETERMINATION OF ORGANIC STRUCTURES BY SPECTROSCOPIC METHODS [MASS SPECTROMETRY] 1 Introduction Outline Mass spectrometry (MS) 2 INTRODUCTION The analysis of the outcome of a reaction
CHEM 241 UNIT 5: PART A DETERMINATION OF ORGANIC STRUCTURES BY SPECTROSCOPIC METHODS [MASS SPECTROMETRY] 1 Introduction Outline Mass spectrometry (MS) 2 INTRODUCTION The analysis of the outcome of a reaction
Paper 12: Organic Spectroscopy
 Subject Chemistry Paper No and Title Module No and Title Module Tag Paper 12: Organic Spectroscopy 31: Combined problem on UV, IR, 1 H NMR, 13 C NMR and Mass - Part III CHE_P12_M31 TABLE OF CONTENTS 1.
NMR Nuclear Magnetic Resonance Spectroscopy p. 83. a hydrogen nucleus (a proton) has a charge, spread over the surface
 has a charge, spread over the surface") NMR Nuclear Magnetic Resonance Spectroscopy p. 83 a hydrogen nucleus (a proton) has a charge, spread over the surface a spinning charge produces a magnetic moment (a vector = direction + magnitude) along
NMR Nuclear Magnetic Resonance Spectroscopy p. 83 a hydrogen nucleus (a proton) has a charge, spread over the surface a spinning charge produces a magnetic moment (a vector = direction + magnitude) along
Química Orgânica I. Nuclear Magnetic Resonance Spectroscopy (I) Ciências Farmacêuticas Bioquímica Química AFB QO I 2007/08 1 AFB QO I 2007/08 2
 Ciências Farmacêuticas Bioquímica Química AFB QO I 2007/08 1 AFB QO I 2007/08 2") Química Orgânica I Ciências Farmacêuticas Bioquímica Química AFB QO I 2007/08 1 Nuclear Magnetic Resonance Spectroscopy (I) AFB QO I 2007/08 2 1 Adaptado de: Organic Chemistry, 6th Edition; L. G. Wade,
Química Orgânica I Ciências Farmacêuticas Bioquímica Química AFB QO I 2007/08 1 Nuclear Magnetic Resonance Spectroscopy (I) AFB QO I 2007/08 2 1 Adaptado de: Organic Chemistry, 6th Edition; L. G. Wade,
Measurement and data processing and analysis
 11 Measurement and data processing and analysis Essential ideas 11.1 All measurement has a limit of precision and accuracy, and this must be taken into account when evaluating experimental results. 11.2
CH 3. mirror plane. CH c d
 CAPTER 20 Practice Exercises 20.1 The index of hydrogen deficiency is two. The structural possibilities include two double bonds, a double do 20.3 (a) As this is an alkane, it contains only C and and has
Spectroscopy and Chromatography
 Spectroscopy and Chromatography Introduction Visible light is one very small part of the electromagnetic spectrum. The different properties of the various types of radiation depend upon their wavelength.
Learning Guide for Chapter 3 - Infrared Spectroscopy
 Learning Guide for hapter 3 - Infrared Spectroscopy I. Introduction to spectroscopy - p 1 II. Molecular vibrations - p 3 III. Identifying functional groups - p 6 IV. Interpreting an IR spectrum - p 12
NMR Spectroscopy. for 1 st B.Tech INTRODUCTION Lecture -1 Indian Institute of Technology, Dhanbad
 NMR Spectroscopy for 1 st B.Tech Lecture -1 Indian Institute of Technology, Dhanbad by Dr. R P John & Dr. C. Halder INTRODUCTION Nucleus of any atom has protons and neutrons Both Proton and Neutron has
C h a p t e r S i x t e e n: Nuclear Magnetic Resonance Spectroscopy. An 1 H NMR FID of ethanol
 0.2 0.4 0.6 0.8 1.0 1.2 1.4 1.6 1.8 2.0 2.2 2.4 2.6 2.8 3.0 3.2 3.4 3.6 C h a p t e r S i x t e e n: Nuclear Magnetic Resonance Spectroscopy An 1 NMR FID of ethanol Note: Problems with italicized numbers
Chem 325 NMR Intro. The Electromagnetic Spectrum. Physical properties, chemical properties, formulas Shedding real light on molecular structure:
 Physical properties, chemical properties, formulas Shedding real light on molecular structure: Wavelength Frequency ν Wavelength λ Frequency ν Velocity c = 2.998 10 8 m s -1 The Electromagnetic Spectrum
Vibrational Spectroscopy
 Vibrational Spectroscopy In this part of the course we will look at the kind of spectroscopy which uses light to excite the motion of atoms. The forces required to move atoms are smaller than those required
Topic 11: Measurement and Data Processing and Analysis. Topic Uncertainties and Errors in Measurement and Results
 Topic 11: Measurement and Data Processing and Analysis Topic 11.1- Uncertainties and Errors in Measurement and Results Key Terms Random Error- above or below true value, usually due to limitations of equipment
Chemistry 105: General Chemistry I Dr. Gutow and Dr. Matsuno Spring 2004 Page 1
 Page 1 1) Name You are to keep this copy of the test. Your name is in case you leave it behind. 2) Use only a #2 pencil on the answer sheet. 3) Before starting the exam fill in your student ID# (not your
sample was a solution that was evaporated in the spectrometer (such as with ESI-MS) ions such as H +, Na +, K +, or NH 4
 ions such as H +, Na +, K +, or NH 4") Introduction to Spectroscopy V: Mass Spectrometry Basic Theory: Unlike other forms of spectroscopy used in structure elucidation of organic molecules mass spectrometry does not involve absorption/emission
Introduction to Spectroscopy V: Mass Spectrometry Basic Theory: Unlike other forms of spectroscopy used in structure elucidation of organic molecules mass spectrometry does not involve absorption/emission
Questions on Instrumental Methods of Analysis
 Questions on Instrumental Methods of Analysis 1. Which one of the following techniques can be used for the detection in a liquid chromatograph? a. Ultraviolet absorbance or refractive index measurement.
Nuclear Magnetic Resonance
 Nuclear Magnetic Resonance PRINCIPLES OF NMR SPECTROSCOPY Contents Principles of nuclear magnetic resonance The nmr spectrometer Basic principles in nmr application NMR tools used to obtain information