Guidelines on Raman Handheld Field Identification Devices for Seized Material
|
|
|
- Phyllis Lawson
- 6 years ago
- Views:
Transcription


1 Guidelines on Raman Handheld Field Identification Devices for Seized Material 1
2 Acknowledgements UNODC s Laboratory and Scientific Section (LSS, headed by Dr. Justice Tettey) wishes to express its appreciation and thanks to Ms. Ying Ying Tan, Health Sciences Authority, Singapore, for the preparation of the final draft of the present Guidelines. The preparation of the present Guidelines was coordinated by Ms. Yen Ling Wong, Scientific Affairs Officer, LSS. The contribution of UNODC staff members is gratefully acknowledged.
3 Table of Contents Acknowledgements... 2 Part Introduction Principles of Raman spectroscopy Strengths and weakness of Raman technology General operating principles Preventing cross contamination Interpretation and documentation of scan results Validation of Raman devices... 9 Part Introduction to Trunarc Analyser Key components of Trunarc Analyser Working principle of Trunarc Analyser Trunarc substance library Safety precautions Operation of Trunarc analyser Trunarc admin software References
4 Part 1. General guidelines for Raman devices 3


5 1. Introduction In recent years, there has been a significant increase in the use of Raman spectroscopy for forensic analysis of drugs of abuse. Raman spectrometers are available both as bench-top units as well as handheld devices. The development of handheld Raman spectrometers has drastically impacted end-users ability to conduct field-based as well as in-situ analysis, allowing a rapid and non-destructive identification of unknown samples including controlled drugs, drug precursors, essential chemicals and cutting agents. However, it is also important to recognise and understand the limitations of such devices. For instance, the handheld Raman spectrometers cannot be used to analyse compounds that are dark in colour or fluoresce. Its use in identifying mixtures with complex sample matrix may also be limited. As such, these devices should only be used as a preliminary screening tool to provide information on the possible identity of the seized material and should always be complemented with analysis using a confirmatory technique performed by the laboratory. Preliminary screening Confirmatory testing Fig. 1: Use of Raman handheld device as a preliminary screening tool, followed by confirmatory testing in a laboratory 4
6 2. Principles of Raman spectroscopy Raman spectroscopy 1,2,3 is a form of molecular spectroscopy, based on inelastic scattering of monochromatic light, discovered by C.V. Raman and K.S. Krishnan in In Raman spectroscopy, the sample is first illuminated with a monochromatic laser beam which interacts with the sample molecule, resulting in scattering of light. The majority of the photons (> % 5 ) will be elastically scattered, i.e. photons will be scattered in all directions without a loss in energy or change in frequency. This form of scattering is known as Rayleigh scattering. On the other hand, a small amount of scattered photons will be inelastically scattered (i.e. Raman scattering). A Raman spectrum is a plot of the intensity of Raman scattered light as a function of its frequency difference from the incident radiation (usually expressed in wavenumber, cm -1 ) 5. This difference is commonly known as Raman shifts and such shifts provide information about vibrational and rotational transitions in a molecule. Generally, the vibrational and rotational transitions are unique for every molecule. As such, Raman spectroscopy can be an invaluable and powerful tool in providing molecular information, based on the structure of the molecule and its light scattering properties. Fig. 2: A Raman spectrum of GBL sample (in blue) compared to a reference spectrum (in red). 5
7 3. Strengths and weakness of Raman technology While there are numerous strengths that promotes the use of Raman handheld devices to analyse unknown samples in the field, users have to understand that there are weaknesses and limitations of the device. Some notable strengths and weaknesses of the technology are highlight below: Strengths Analysis is rapid and can be easily performed Non-destructive High selectivity Provides specific functional group information Samples analysed directly through transparent or translucent containers (e.g. plastic, glass) Diverse types of samples possible: solid, liquid or slurry, either transparent or opaque Weaknesses Relatively low sensitivity Fluorescence from sample interferes with analysis Not be suitable for dark samples, which absorbs laser energy and can heat up or ignite Not be suitable for sample with a complex matrix Laser source may experience fluctuation Only qualitative analysis can be performed Little or no sample preparation required No interference from water. Aqueous samples are possible 6
8 4. General operating principles 4.1 Performance check Performance check is conducted to demonstrate that an instrument or equipment is able to perform according to the manufacturer s specifications and is appropriate for routine use. Most handheld Raman spectrometers are equipped with a reference material to conduct this check. Such performance check should be performed once at the beginning of a series of samples scanned. 4.2 Scanning of samples Direct scanning of the samples can be performed using the Raman handheld devices with minimum or no sample preparation. Such devices can be used to scan samples present in different forms such as powder, crystal, tablet, capsule and liquid as well as scan through a thin layer of common packaging material such as transparent or translucent glass or plastic. However, in some cases where the laser beam is unable to penetrate through the packing material, sample preparation may be necessary. For solid samples, transfer an appropriate amount into a transparent plastic packet and for liquid samples, place a small quantity into a transparent glass vial for direct scanning. Scanning is usually performed by holding the test sample close to the laser aperture (for instance through direct contact or point-and-shoot) and pressing a few buttons on the Raman device to initiate the scan. Results of the scan will then appear on the screen in 1 to 2 minutes. TIPS Perform 3 scans in different locations as sample may not be homogeneous To minimise interference from background light, perform scan in a shaded area or away from direct sunlight 7
9 4.3 Safety precautions General safety precautions should be adhered when handling test samples including wearing of gloves and donning on safety glasses, if necessary. As the device makes use of a laser beam, it is also important for all users to understand the potential dangers of this device and the types of samples that require extra care. The following safety precautions should be adhered to at all times when operating the Raman handheld devices:! Handle the device at a safety distance recommended by the manufacturer in all direction during a scan.! Never look directly into the laser source, laser beam path or scattered laser light from any reflective surface.! Never point the device directly at a person.! Avoid scanning dark-coloured compounds. The laser beam in this analyser can potentially cause the dark-coloured substance to burn or ignite if scanned directly.! Avoid scanning sample that is suspected to be explosive as the sample may burn or ignite if scanned directly (for both light- or dark-coloured compounds).! Avoid performing point-and-shoot scan on sample placed on a dark-coloured surface as the surface may absorbed enough laser energy to heat up a potential flammable or explosive material to its ignition point. 8
10 5. Preventing cross contamination All working surfaces where scanning is performed should be properly cleaned with a clean cloth wet with alcohol (e.g. ethanol, isopropanol) prior to performing each scan to prevent cross contamination. Contaminated surfaces often pose a challenge to the users and may result in inaccurate scan result indicated on the Raman device. 6. Interpretation and documentation of scan results Interpretation of scanned results may be necessary when inconclusive results are obtained or addition intelligence information is available. In such situation, further confirmatory testing performed by the laboratory is necessary. Most Raman devices are supported with software which allows the user to upload or copy scan results stored in the device to the computer or laptop for review, generation of test reports or archival. Alternatively, the scan results can be documented manually using a recording sheet including information such as scan ID, date and time of analysis, test results and name of analyst performing the scan. 7. Validation of Raman devices Validation of the Raman devices is recommended to be performed by a laboratory to assess and verify its operational performance and effectiveness in the preliminary screening of seized material. The following studies may be performed: (i) Verification study of the spectral library (ii) Repeatability and reproducibility study (iii) Interference study from packaging materials (iv) Studies on matrix effects using street samples and sample mixtures prepared in-house 9
11 7.1 Verification study of library The validity of the spectral library installed on the device can be verified by scanning a variety of drug reference material of different drug classes to determine if a correct identification can be made. An example is shown below: Drug Classes Amphetamine-type stimulants Benzodiazepines Opiates Synthetic cathinones Synthetic cannabinoids New psychoactive substances Miscellaneous drugs Precursors Essential chemicals Cutting agents/diluents Solvents Drug Reference Standards used for Verification Amphetamine, methamphetamine, MDMA Diazepam, clonazepam, oxazepam Heroin, morphine, oxycodone Mephedrone, MDPV, methylone JWH-018, JWH-073, THJ-2201, UR B-NBOMe, 2C-B, 3-CMC, methoxetamine Cocaine HCl, ketamine, GHB, GBL Ephedrine, phenyl-2-propanone, safrole Acetic anhydride, ammonium chloride Dimethyl sulfone, caffeine, levamisole, lactose, acetaminophen Acetone, methyl ethyl ketone, toluene Table 1: Examples of reference material used for verification study of library 7.2 Repeatability and reproducibility study For the repeatability and reproducibility study, each sample prepared for the above study (i.e. verification study of library in Section 7.1) will be scanned in triplicates by three different operators. The triplicates analysis conducted on each sample will provide the repeatability data while the analysis conducted by three different operators will provide the reproducibility data. 7.3 Interference study from packaging materials Common packaging materials used to contain seized material will be used in this interference study and these may include plastic packet, straw and container as well as glass vial, bottle and tube. An appropriate reference material or street samples will be contained in these packaging materials for direct scanning to determine if a positive identification can be made. 10
12 7.4 Studies on matrix effects Study on matrix effects using sample mixtures Sample mixtures will be prepared by mixing drug reference material with common cutting agents in different proportions. Each mixture will be sufficiently pulverized and homogenized using a mortar and pestle prior to scanning to determine if the drug of interest can be detected and correctly identified. An example is shown below: Mixture Drug of interest Cutting agents No. Controlled substance Percentage (%) Cutting agent Percentage (%) 1 Heroin 75 Caffeine 25 2 Heroin 50 Caffeine 50 3 Heroin 25 Caffeine 75 Table 2: Sample mixtures for study on matrix effects Study on matrix effects using street samples Street samples of the different drug classes with different purity and sample matrix are scanned with the handheld Raman device. The scan results obtained by the handheld device will then be compared against that obtained using a confirmatory analytical technique (e.g. Gas Chromatograph-Mass Sepctrometry, GCMS). Key information Raman Handheld devises should only be used as a screening tools. Follow up confirmatory analysis should be conducted in a laboratory. The device makes use of a laser beam, thus all users should understand the potential dangers of this device and the types of samples that require extra care. 11
13 Part 2. User guide for Trunarc Analyser 12

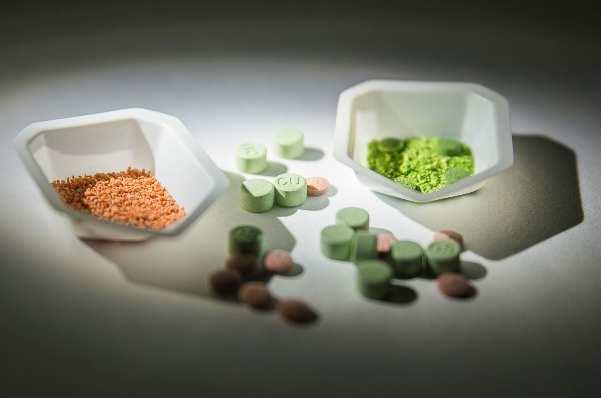
14 1. Introduction to Trunarc Analyser The TruNarc analyser is one of many handheld Raman spectrometers commercially available in the market. It is used for the presumptive screening of suspected controlled substances, drug precursors, essential chemicals and cutting agents. There are also other handheld Raman devices which are capable of screening other analytes such as pharmaceuticals and toxic industrial chemicals. Samples in various forms such as powder, crystal, tablet, capsule and liquid can be screen directly on the TruNarc analyser. Drugs or analytes that can be identified by the TruNarc analyser include: Narcotics such as heroin and oxycodone Stimulants such as cocaine and methamphetamine Depressants such as clonazepam and diazepam Hallucinogens such as ketamine and MDMA (commonly found in Ecstasy tablets) New Psychoactive Substances, NPS, such as synthetic cannabinoids and synthetic cathinones Cough suppressants such as dextromethorphan Drug precursors and essential chemicals such as safrole, ephedrine, piperonal and acetic anhydride Cutting agents and diluents such as caffeine, dimethyl sulfone and lactose. Fig. 1: Common drugs of abuse which can be screened using the TruNarc Analyser 13

15 2. Key components of Trunarc Analyser The key components of the TruNarc analyser include the nose cone, keys on the analyser unit, self-check standard, laser indicator light/aperture, USB connector as well as the AC adaptor cable. Key Components Location on Analyser Function Nose Cone Nose cone Keys Removable black plastic cap used for holding of sample in the correct position for scanning Keys Buttons on the analyser used for the selection of the respective menu options Self-check Standard Removable transparent plastic bar used for the performance of a selfcheck Self-check standard Laser indicator Laser Indicator Light Indicator light on the analyser that glows when the laser light is active during a scan (a safety feature) 14


16 Laser Aperture Laser aperture Nose cone Self-check standard Clear glass window beneath the nose cone where the laser beam exits to strike the sample during a scan USB Connector USB connector Beneath the access door of the analyser is the USB connector which allows two types of cables to be attached: o AC adaptor cable to connect the analyser to an electrical outlet for charging the analyser battery o USB cable to connect the analyser to a computer/laptop for the synchroniaation of scan results from the analyser to the computer/ laptop as well as for software upgrades and library updates of the analyser To open the access door, grasp the tab on the door and tub gently to open it AC adaptor cable Connect to electrical outlet AC adaptor cable connects the analyser to an electrical outlet for charging. A fully charged battery can last for approximately 8 to 10 hours Table 1: Key components of the TruNarc analyser and their functions 15


17 3. Working principle of Trunarc Analyser 3.1 How the TruNarc Analyser Works Fig. 2 below. The TruNarc analyser is based on Raman spectroscopy and how it works can be illustrated in 1. The sample in the packet is placed against the nose cone of the analyser. The key on the analyser to initiate the laser beam is pressed. 2. The laser beam exits the analyser through the nose cone and strikes the sample contained in the packet. 3. The energy of the laser beam excites the molecules in the sample causing them to scatter Raman light. Some of the scattered Raman light enters the analyser through the nose cone, where it is collected and analysed by the detector. 6. If a positive match is found, the identity of the drug of interest will be reflected on the result screen of the TruNarc analyser. 5. The spectrum created is then compared and matched against the TruNarc Substance Library 2 using a cheometric logarithm. 4. The analysis produces information about the wavelength in the collected Raman light and the detector uses this information to create a spectrum. Fig 2: How the TruNarc analyser works 16

18 3.2 Second Derivative Processing of Spectral Plot The TruNarc analyser uses the second derivative processing of spectral plot to sharpen peaks of interest and remove broad fluorescence bands. As such, this helps to improve the sensitivity of this analyser, especially in the detection of drug of interest in sample mixtures. Fig 3: Second derivative processing of spectral plot However, one drawback of the second derivative plot is that the spectrum obtained by the analyser could not be compared with that found in literature. 4. Trunarc substance library The TruNarc Substance Library 2 is used by the TruNarc analyser to identify compounds of interest present in the unknown sample. This library can be updated during software upgrade and such updates will be provided by Thermo Fischer Scientific annually throughout the lifetime of the analyser. Categories Alarm Clear Precursor/ Chemical Warning (Cannot rule out the presence of narcotic) Controlled substances Cutting agents and diluents Types of Compounds Drug precursors and essential chemicals Substances that have strong Raman signals which can potentially mask certain drugs of interest: Paracetamol Aspirin Ephedrine Ibuprofen For the above four substances, an alternative test method is recommended. Table 2: Different categories of compounds of interest in TruNarc Substance Library Background Colour Displayed 17


19 5. Safety precautions The TruNarc analyser makes use of a Class 3B laser to perform scans and this can cause ocular damage. As such, they should be operated by trained personnel who are familiar with the safety precautions when handling such devices. The safety distance of this device is 14 inches or 35 cm from the nose cone of the analyser in all direction. 14 inches (35 cm) Fig. 4: Safety distance from nose cone of analyser when scanning is performed 18


20 6. Operation of Trunarc analyser 6.1 Power On/Off the TruNarc Analyser Power On the TruNarc Analyser The TruNarc analyser can be powered on using the following procedures: 1 1. Press and release the bottom key on the TruNarc analyser. 2. The Activate Laser screen appears. Enter the laser activation code by pressing the button next to each number When you enter the last number of the code, the laser activates and the Welcome screen appears. 3. As the code is entered, asterisk will appear in the boxes on the screen to hide the code number. Fig. 5: Power on the TruNarc analyser 19

21 6.1.2 Power off the TruNarc Analyser The TruNarc analyser can be turned off at any time, even during the scan. When the analyser is turned off, it will be completely powered down. The TruNarc analyser can be powered off using the following procedure: 1 1. Press and hold the bottom key or 10 seconds. 2. After holding for 5 seconds, the analyser will begin a 5 seconds countdown and the analyser will be turned off after 5 seconds. Fig. 6: Power off the TruNarc analyser 6.2 Performing a Self-Check A self-check serves as a performance check to ensure proper functioning of the TruNarc analyser in accordance to the manufacturer s specifications. A self-check is recommended to be performed once at the beginning for a series of samples scanned. The results of such self-checks will be stored in the analyser and they can be uploaded or copied from the analyser to the TruNarc Admin software along with other scan results. Reports of self-check can also be created and printed using this software and be kept as supporting evidence of proper functioning of the analyser during the sample scans. 20
22 For procedures on uploading of self-check results from the analyser to TruNarc Admin software as well as creation and printing of such reports, refer to Section 7.2 and 7.4, respectively. A self-check can be performed using the following procedures: 1 closed position 1. Place the self-checkstandard in the closed position (i.e. flip the self-checkstandard up and insert it into the nose cone). 2. Select the Check option in the Welcome screen by pressing the key next The laser light glows indicating that the laser is active and analyser is performing the scan The Self-check screen appears. Select Check option again by pressing the key next to it 5. The result of the check will appear in the Self-check Result screen after a few seconds. Select OK option by pressing the key next to it to return to the Welcome screen. Fig. 7: Procedures to perform self-check 21

23 6.2.1 Self-check results: Two possible self-check results can be obtained: Pass This result indicates that the analyser is operating in accordance to the factory specifications. Fail This result means that the analyser is not operating correctly. Wipe the self-checkstandard with a clean cloth damped with ethanol. Perform the self-checkagain. If a Pass result is achieved, select the OK option by pressing the key next to it to return to the Welcome screen to start scanning samples. If a Fail result is achieved again, remove the analyser from use and contact Thermo Fisher 6.3 Preparation of Sample for Scanning The TruNarc analyser can be used to scan samples present in different forms, such as powder, crystal, tablet, capsule or liquid. In addition, the analyser can scan through common packaging materials such as transparent or translucent glass or plastic with a thickness of < 2 mm. As such, direct scanning can be easily performed with minimum or no sample preparation except in situations where the Type H test kits are used. For sample preparation procedures using such test kits, refer to Section
 is positioned at the sample inside the packet.")


24 6.4 Scanning of Sample Scanning of Sample through a Plastic Packet Scanning of a sample contained in a plastic packet can be performed using the following procedures Self-check standard should be in the open position. Press the packet of sample firmly against the nose cone of the analyser. Ensure the laser sample point (i.e. 2 mm away from nose cone) is positioned at the sample inside the packet. 2. Select the Scan option in the Welcome screen by pressing the key next to it The laser light glows indicating the laser is active and the analyser scanning. Hold the sample still during the scan to avoid moving the sample during the scan The Scan Ready screen appears. In this screen, select the Scan option again by pressing the key next to it When the laser indicator light turns off, the analysis screen appears. The packet can now be move away from the nose cone. Fig. 8: Procedures to scan samples 4. The analyser will display a result in the Scan Result screen. Select OK to return to the Welcome screen. 23
 since the sample point is only 2 mm from the nose cone.")

25 6.4 Scanning a Sample through a Container Scanning of a sample contained in a plastic or glass container can be performed using the same procedures outlined in Section However, the wall of such containers must be relatively thin (i.e. < 2 mm) since the sample point is only 2 mm from the nose cone. When you try to scan through a thick-wall container, the sample point is inside the container wall instead of the sample contained within the container. This makes it hard for the analyser to collect enough data to identify the sample. 6.5 Scanning a Tablet or Pill Scanning of a tablet or pill can be performed using the same procedures outlined in Section 5.4.1, except that the tablet or pill must be pressed firmly against the nose cone. If the tablet or pill is coated, its coating may interfere with the scan. In such a scenario, the coating can be removed by scraping it off and the resulting exposed surface is then pressed against the nose cone for scanning. Alternatively, the tablet or pill may be broken into half and the exposed interior surface is then scanned. 6.6 Scanning a Spilled Powder Scanning of spilled powder can be performed using the point-and-shoot technique. The powder is first worked into a pile and the nose cone is positioned on the surface of the pile to perform the scan using procedures outlined in Section Types of Scan Results Different types of scan results may be returned by the TruNarc analyser. Examples of possible scan results obtained are shown in Table 5 below. 24


 present in trace amount which is below the detection limit of this analyser.")
26 Type of Scan Results Alarm Precursor/ Chemical Clear Inconclusive Cannot rule out presence of narcotics Display on Result Screen What it means? A controlled substance present in the TruNarc Substance Library is detected and identified on the result screen. If any drug precursor, essential chemical, cutting agent or diluent is also present in combination with the controlled substance, it will not be identified. A drug precursor or essential chemical present in the TruNarc Substance Library used in the manufacture of illicit drugs is detected and identified on the result screen. No controlled substance present in the TruNarc Substance Library is detected and identified. Note: If a controlled substance is present in trace amount as compared to that of the drug precursor or essential chemical, it may not be detected and identified. A cutting agent or diluent present in the TruNarc Substance Library is detected and identified on the result screen. No controlled substance, drug precursor or essential chemical present in the TruNarc Substance Library is detected and identified. Note: If a controlled substance, drug precursor or essential chemical is present in trace amount as compared to that of the cutting agent or diluent, it may not be detected and identified. No controlled substance, drug precursor or essential chemical as well as cutting agent or diluent present in TruNarc Substance Library is detected and identified. However, the possibility of the above substances not present in the library, cannot be ruled out. Other techniques of analysis should be used to identify the unknown sample. Acetaminophen/ Aspirin is detected and identified on the result screen. Such drug is sometimes found in combination with narcotics (e.g. Percocet, Vicodin) present in trace amount which is below the detection limit of this analyser. Other techniques of analysis should be used to rule out the presence of narcotics. Polystryene (check that self-test standard is not in closed position) Polystryene warning indicates that the selfcheckstandard may be in the closed position. Table 3: Different types of scan results shown on TruNarc analyser 25
 to (iii), only substances in the higher priority group will be displayed on the screen. 6.")

27 The priority of scan results displayed on the Scan Result screen is in the following order: (i) Controlled substances (ii) Drug precursors or essential chemicals (iii) Cutting agents or diluents If the sample contains a mixture of substances in group (i) to (iii), only substances in the higher priority group will be displayed on the screen. 6.8 Scanning of High Fluorescence Samples using Type H Test Kits Emission of Fluorescence Light by Test Samples Detection of test samples which fluoresce pose a challenge for the TruNarc analyser. When a laser beam strikes such a sample, it spontaneously emits a high amount of fluorescent light which interferes and masks the Raman signals obtained. As such, this makes it difficult for the analyser to detect and identify any analyte of interest present in the sample and an inconclusive result will be obtained. Some examples of such samples include heroin, diazepam and fentanyl Type H Test Kits To resolve this problem, a special test kit that compensates for the emission of fluorescence light can be used to produce a more reliable scan. This special test kit is known as the Type H test kit. Such test kits are equipped with a small 4 ml vial containing 1 ml of ethanol and a plastic test stick with a scoop at one end. At the base of the scoop is a small metal wafer that has been chemically treated to reduce the amount of fluorescence light emitted by the test samples. Metal wafer chemically treated to reduce the amount of fluorescence light Fig. 9: Components of a Type H test kit 26


28 6.8.3 Preparation of Sample for Scanning using Type H Test Kit Preparation of sample for scanning using the Type H test kits can be performed using the following procedures: 1 1. Open the test kit from the package 2. Remove an appropriate amount of test sample (~10 mg or ¼ scoop) using the scoop of the test kit Remove the test stick and shake it in the air to allow the ethanol to evaporate. A thin film of dried sample will be coated on the metal wafer at the base of the scoop. 3. Insert the scoop containing the sample into the vial and stir gently to dissolve the sample. Ensure the filled scoop is fully submerged in the ethanol solution. Fig. 10: Procedures to prepare sample for scanning using the Type H test kit 27


29 6.8.4 Procedures for Scanning procedures: Scanning of the metal wafer prepared in Section can be performed using the following 1 1. Ensure that the self-check standard is in the open position. Hold the scoop end of the test kit against the nose cone of the analyser to scan the metal wafer.the cup of the scoop should be centered over the opening of the nose cone. Use the forefinger to firmly press against the nose cone. 2.The Scan Ready screen appears. In this screen, select the Scan option again by pressing the key next to it When the test kit is in the correct position, select the Scan option in the Welcome screen by pressing the key next to it. 4 4.The laser light glows in a few seconds indicating that the laser is active and the analyser is performing the scan. Hold the test kit on the nose cone until the laser light turns off. 5 5.When the laser indicator light turns off, the analysis screen appears. The test kit can now be move away from the nose cone. Fig. 11: Procedures to scan samples using Type H test kit 6. When the analysis step completes, the analyser display a result in the Scan Result screen. Select OK to return to the Welcome screen. 28

30 6.9 Reviewing of Scan Results on Analyser The TruNarc analyser saves all sample scan and self-checkresults in the analyser. Both sample scan and self-checkresults can be reviewed at any time from the analyser by performing the following procedures: 1 1. Select the Review option in the Welcome screen by pressing the key next to it. 2. The Review Scans screen appears. Scroll through the list using or option by pressing the key next to it to view the appropriate scan result. Fig. 12: Procedures to review scan results 29
31 7. Trunarc admin software 7.1 Introduction to TruNarc Admin Software The TruNarc Admin software is a program used by the TruNarc analyser to allow users to manage scan results on a computer/laptop. With the scan results uploaded or copied from the analyser to the computer/laptop, users will be able to create a database where he/she can: (i) create customised columns in the database to input additional information such as officer s name, case name etc. (ii) search for scan results by selection of different categories such as name, result type, dates etc. (iii) create, save and print scan results as reports In addition, the TruNarc Admin software also allows the users to: (i) set date and time on the analyser (ii) remove scan results from the analyser (iii) view and update the TruNarc Substance Library on the analyser (iv) revise customer account information and send to customer service support Launching of the TruNarc Admin Software After the TruNarc Admin software has been installed onto the computer/laptop, this program can be launched by double-clicking this software desktop icon as shown on the right. Once the program is opened, the main window of the software appears. If the display area of this window is empty, this means that the user has not synchronised the analyser with the software. On the other hand, if the display area of the main window of this software shows scan results, this means that the analyser has already been synchronised with the software and scan results available on the analyser have been uploaded or copied onto the database. 30 Fig. 13: Main window of TruNarc Admin software with scan results
.")
32 7.1.2 Key Features on Main Window of the TruNarc Admin Software The key features on the main window of the TruNarc Admin software include: (i) Display area showing rows of scan results (available after synchronisation of the analyser with the software has been performed). (ii) Serial number of the analyser that is connected to the computer/laptop (iii) Buttons that are only available when the analyser is connected (iv) Buttons that are always available (i.e. even when analyser is not connected) (v) Tools for searching of scan results by selection of category or date (vi) Buttons for generating scan reports for printing and saving scan data in a different format (eg. PDF) (vii) Check boxes for selection of scan results (viii) Customisable headers for entry of useful information (e.g. officer s name, comments etc) (v) (ii) (i) (viii) (vii) (iii) (iv) (vi) Fig. 14: Key features on main window of the TruNarc Admin software 7.2 Synchronisation of Scan Results Synchronisation is performed to upload or copy scan results from the analyser to the computer/laptop. Such synchronisation process can be performed by the following steps: (i) Open the TruNarc Admin software. (ii) Power on the TruNarc analyser. (iii) Connect the analyser to the computer/laptop with the use of the USB cable. (iv) When the software opens, it will check to see if the analyser contains any new scan results or self-checkresults which have yet to be synchronised with the software. If there are such results available, the software will prompt the user to synchronise these scans. 31

33 (v) The Analyser Detected window appears. Click Yes to initiate the synchronisation process. Fig. 15: Synchronisation of scan results 7.3 Searching for Scan Results The TruNarc Admin software has search tools which allow the users to quickly locate their scans of interest. Such tools can be found in the main window of the software above the header row. Searching for scan results can be performed at any time even when the analyser is not connected to the computer/laptop as long as the required scans have already been synchronised with the software. Search for scan results can be performed either by selecting a category of interest or by selecting a date range Searching for Scan Results by Category Searching for scan results by category can be performed by the following steps: (i) Select the category of interest from the drop-down list by clicking on. (ii) Enter a search term in the box next to Filter scans. (iii) If the search is successful, a list showing all scans containing the specified word in the specified category will appear in the display area. If the search is unsuccessful, the display area will be empty. 32


34 Select a category Enter a search term Successful search showing list of scans containing the specified word in the specified category 33 Fig. 16: Searching for scan results by category
 Select the end date from the drop-down list by clicking on from the second date box.")

35 7.3.2 Searching for Scan Results by Date Range Searching for scan results by date range can be performed by the following steps: (i) Select the start date from the drop-down list by clicking on from the first date box. Any date from the calendar having a white background can be selected. (ii) Select the end date from the drop-down list by clicking on from the second date box. Any date from the calendar having a white background can be selected. (iii) If the search is successful, a list showing all scans performed between the date range will appear in the display area. If the search is unsuccessful, the display area will be empty. (Note: Dates having a grey background cannot be selected as these dates fall after the date where the last scan result is synchronised to the software.) Selection of start date Selection of end date 34

36 Successful search showing list of scans performed between the selected date range Successful search showing list of scans performed between the date range Fig. 14: Searching for scan results by date range Fig. 17: Searching for scan results by category 7.4 Report Files Information on Report File A report file is a printable record of a specific scan result which can be attached to case records. Multiple report files can be easily created at any one time and information on such report files include: (i) Scan spectrum which is the spectrum created by TruNarc analyser from the scan data it collects. (ii) Library spectrum which is the spectrum that is saved in the TruNarc Substance Library. (iii) Summary of information about the scan and self checks performed before and after the scan: Scan Result Scan ID Self Check (Before and after scan) Result Scan ID Date and Time of Scan Date and Time of Scan Name of Compound (iv) Thermo Fisher Scientific logo which can be replaced with the organisational logo. - Analyser Serial No. 35
 Select the scan of interest by clicking")
 Click the Report button located at the bottom of the screen. (iv) The Report Preview Window will appear immediately.")
37 (iii) Summary of Information (iv) Logo (i) Scan spectrum (ii) Library spectrum Creation of Report Files Fig. 18: Example of a report file Report files can be created using the TruNarc Admin software by performing the following steps: (i) Select the scan of interest by clicking on the check boxes of the scan. (ii) Once the scans are selected (i.e. check boxes are ticked), the rows will be highlighted in yellow. (iii) Click the Report button located at the bottom of the screen. (iv) The Report Preview Window will appear immediately. (v) If multiple scans are selected, click on or to scroll through the preview of each report. Click on the check boxes to select the scans 36

 Click on the Print button located at the")
38 The selected scans are highlighted in yellow Click on left or right arrow to scroll through the preview of each report Printing of Report Files Fig. 19: Creation of report files The report files created can be printed by performing the following steps: (i) Click on the Print button located at the bottom of the screen. 37
 Click Print. Click on Print button and the Print window appears Fig.")
 Click on the Save button located at the bottom of the")
39 Click on Save button and the Save PDF window appears (ii) The Print window appears. Select the printer, specify the number of copies and the reports to be printed (iii) Click Print. Click on Print button and the Print window appears Fig. 20: Printing of report files Saving of Report Files A PDF copy of report files created can be saved by performing the following steps: (i) Click on the Save button located at the bottom of the screen. (ii) The Save PDF window appears. Specify the filename and location of the PDF file to be saved. (iii) Click Save. (Note: If the report preview shows more than one report, the PDF file saved will include all reports created.) 38

 Open the TruNarc Admin software. (ii) Power on the TruNarc analyser.")
40 Fig. 21: Saving of report files 7.5 Resetting of Date/Time/Time Zone on TruNarc Analyser It is important to update the date, time and time zone of the TruNarc analyser to match the local date and time of your country so that the timestamp on the scan results will be correct. Time setting on the TruNarc analyser can be changed using the TruNarc Admin software by performing the following steps: (i) Open the TruNarc Admin software. (ii) Power on the TruNarc analyser. (iii) Connect the analyser to the computer/laptop with the use of the USB cable. (iv) Click on the Analyser Settings button located on the right hand column. (v) The Analyser Setting window appears and shows the date, time and time zone currently set on the analyser. Note: Format of date setting: Year-Month-Day (e.g ) Format of time setting: Hour-Minutes-Seconds (e.g. 09: 52: 16) (vi) To reset the date and time on the analyser, click on Same Time as This Computer check box. The date and time on the analyser will be updated to match that of the computer or laptop. (vii) To reset the time zone, click on from the time zone drop-down list. Select the appropriate time zone and click Set. Click on Analyser Settings Date and time set on analyser: Date Setting: Time Setting: 09:52:16 39

 Open the TruNarc Admin software.")
41 To reset time zone, Click on to select the appropriate time zone Fig. 22: Resetting of date, time and time zone on TruNarc analyser 7.6 Removing of Scan Results from TruNarc Analyser Scan results may be removed from the TruNarc analyser once these scans have been uploaded or copied to the computer/laptop after synchronisation. For scan results that have yet to be synchronised, the TruNarc Admin software will prompt the user to perform synchronisation before he/she is allowed to remove these scans. Once the scan results are removed, they cannot be restored. Scan results from the TruNarc analyser can be removed by performing the following steps: (i) Open the TruNarc Admin software. (ii) Power on the TruNarc analyser. (iii) Connect the analyser to the computer/laptop with the use of the USB cable. (iv) Click on the Remove Scans from Analyser button located on right hand column. (v) The Remove Scans window appears. Click Yes. Click on Remove Scans from Analyser button to launch the Remove Scans window 40
 Click on the View TruNarc Library button located on the right hand column.")
42 7.7 Viewing and Updating of TruNarc Substance Library The list of compounds present in the TruNarc Substance Library installed on the TruNarc analyser can be viewed using the TruNarc Admin software by performing the following steps: (i) Click on the View TruNarc Library button located on the right hand column. (ii) The TruNarc Substance Library window appears showing three columns, namely Alarm, Warning and Benign. Alarm Warning Benign Controlled substances Drug precursors, essential chemicals as well as acetaminophen, aspirin and substances that create special scan warnings (e.g. polycarbonate and polystyrene) Cutting agents and diluents (iii) Click on Close button to exit this window after viewing. Click on View TruNarc Library button to launch the TruNarc Substance Library window Fig. 24: Viewing of TruNarc Substance Library 41
43 8. References 1. D.A. Skoog, F.J. Holler and S.R. Crouch, Principles of Instrumental Analysis, Cengage Learning, 6 th edition, H.H. Willard, L.L. Meritt Jr., J.J. Dean. F.A. Settle Jr. Instrumental Methods of Analysis, CBS Publisher & Distributors, 7 th Edition, New Delhi, G.S. Bumbrah, R. M. Sharma, Raman Spectroscopy Basic Principles, Instrumentation and Selected Applications for the Characterisation of Drugs of Abuse, Egyptian Journal of Forensic Science, Vol. 6, Issue 3, 2016, page C.V. Raman, K.S. Krishnan, A New Type of Secondary Radiation, Nature, 121, 3048, 1928, page Raman Spectroscopy, Technical Notes, B&W Tek. 7. TruNarc Technical Evaluation Report, Thermo Scientific. 8. TruNarc Narcotics Analyser, Training Guide, Thermo Scientific. 9. TruNarc Substance Library: Traceability, Ver 1.7, Thermo Scientific, Aug TruNarc Technical Evaluation Report, Thermo Scientific. 42
44 43

45 ANNEX A: TRUNARC SUBSTANCE LIBRARY 2 44

46 ANNEX A: TRUNARC SUBSTANCE LIBRARY 8 45
Guidelines on Handheld Raman Field Identification Devices for Seized Material
 Guidelines on Handheld Raman Field Identification Devices for Seized Material 1 Acknowledgements UNODC s Laboratory and Scientific Section (LSS, headed by Dr. Justice Tettey) wishes to express its appreciation
Rapid Field Testing of Ecstasy Pills Using a 1064-nm Handheld Raman Device
 Rapid Field Testing of Ecstasy Pills Using a 1064-nm Handheld Raman Device Dawn Yang, Kristen Frano, John Maticchio B&W Tek, Newark, DE Introduction In recent years, handheld Raman devices have become
mylab: Chemical Safety Module Last Updated: January 19, 2018
 : Chemical Safety Module Contents Introduction... 1 Getting started... 1 Login... 1 Receiving Items from MMP Order... 3 Inventory... 4 Show me Chemicals where... 4 Items Received on... 5 All Items... 5
Photoluminescence Spectrometer (FLS980)
") Photoluminescence Spectrometer (FLS980) Instrument Summary: The Edinburgh Instruments FLS980 photoluminescence spectrometer offers both steady state and time resolved (lifetime) fluorescence spectroscopy
Photoluminescence Spectrometer (FLS980) Instrument Summary: The Edinburgh Instruments FLS980 photoluminescence spectrometer offers both steady state and time resolved (lifetime) fluorescence spectroscopy
Technical Procedure for Concentration Determination of Methamphetamine in Liquids via HPLC
 Technical Procedure for Concentration Determination of 1.0 Purpose This procedure specifies the required elements for the preparation and use of the Agilent 1100/1200 series High Performance Liquid Chromatograph
The Evaluation of Portable Handheld Raman Systems. for the Presumptive Identification of Narcotics: Systems PGR-1064
 The Evaluation of Portable Handheld Raman Systems for the Presumptive Identification of Narcotics: Thermo Scientific TruNarc and Chemring Detection Systems PGR-1064 Cristina Spicher, B.S, Tate Yeatman,
Lab 5 Enthalpy of Solution Formation
 Chemistry 3202 Lab 5 Enthalpy of Solution Formation Page 1 of 9 Lab 5 Enthalpy of Solution Formation Introduction This lab activity will introduce you to the measurement of energy change associated with
CHM Salicylic Acid Properties (r16) 1/11
 1/11") CHM 111 - Salicylic Acid Properties (r16) 1/11 Purpose In this lab, you will perform several tests to attempt to confirm the identity and assess the purity of the substance you synthesized in last week's
CHM 111 - Salicylic Acid Properties (r16) 1/11 Purpose In this lab, you will perform several tests to attempt to confirm the identity and assess the purity of the substance you synthesized in last week's
The Epidemic is coming (Tucson News KOLD/KMSB)
") 2 The Epidemic is coming (Tucson News KOLD/KMSB) Synthetic Analog Problem DEA Temporary Placement of JWH-018, JWH-073, JWH-200, CP47,497 and CP47,497 C8 homolog, MDPV, Mephedrone, Methylone on Schedule
2 The Epidemic is coming (Tucson News KOLD/KMSB) Synthetic Analog Problem DEA Temporary Placement of JWH-018, JWH-073, JWH-200, CP47,497 and CP47,497 C8 homolog, MDPV, Mephedrone, Methylone on Schedule
Individual Laboratory Safety & Chemical Hygiene Plan
 APPENDIX A: CHEMICAL HYGIENE PLAN Part B Individual Laboratory Safety & Chemical Hygiene Plan Principal Investigator Date filed Department Building/Floor/Room E-mail address @Pace.edu Phone Facsimile Laboratory
DAY LABORATORY EXERCISE: SPECTROSCOPY
 AS101 - Day Laboratory: Spectroscopy Page 1 DAY LABORATORY EXERCISE: SPECTROSCOPY Goals: To see light dispersed into its constituent colors To study how temperature, light intensity, and light color are
Protocol Particle size distribution by centrifugal sedimentation (CPS)
") Protocol Particle size distribution by centrifugal sedimentation (CPS) 1. Method The CPS Disc Centrifuge separates particles by size using centrifugal sedimentation in a liquid medium. The sedimentation
Protocol Particle size distribution by centrifugal sedimentation (CPS) 1. Method The CPS Disc Centrifuge separates particles by size using centrifugal sedimentation in a liquid medium. The sedimentation
Marquis (210 ml): Add 10 ml of 40% formaldehyde solution to 200 ml of concentrated sulfuric acid.
: Add 10 ml of 40% formaldehyde solution to 200 ml of concentrated sulfuric acid.") Introduction Spot tests are color tests used for rapid screening of samples to determine what drugs may or may not be present. The principal behind spot tests is based on the fact that classes of compounds
Introduction Spot tests are color tests used for rapid screening of samples to determine what drugs may or may not be present. The principal behind spot tests is based on the fact that classes of compounds
Snowy Range Instruments
 Snowy Range Instruments Cary 81 2000 W Hg Arc JY U-1000 5 W Ar + Laser DL Solution 852 200 mw SnRI CBEx 785 100 mw What is Raman Spectroscopy? Raman spectroscopy is a form of molecular spectroscopy. It
INVESTIGATING GAS CHROMATOGRAPHY rev 8/12
 EXPERIMENT 2 INVESTIGATING GAS CHROMATOGRAPHY rev 8/12 GOAL In this experiment, you will measure and analyze the chromatogram of a mixture of seven compounds using a Vernier Mini GC. You will then vary
Infrared Spectroscopy
 Reminder: These notes are meant to supplement, not replace, the laboratory manual. Infrared Spectroscopy History and Application: Infrared (IR) radiation is simply one segment of the electromagnetic spectrum
Mira Metrohm Instant Raman Analyzer. Always ready to measure
 Mira Metrohm Instant Raman Analyzer Always ready to measure Robust and handy materials identification 02 The Metrohm Instant Raman Analyzers (Mira) are handheld, high-performance Raman spectrometers for
and Environmental Science Centre
 1. Purpose The purpose of this document is to familiarize the user with the mode of function of the FT-Raman available at the facility, and to describe the sampling procedure. 2. Introduction Raman spectroscopy
Eppendorf UVette. Instructions for use
 Instructions for use Instructions Eppendorf see Fig. Tab. p. p. UVette for use Copyright 2014 Eppendorf AG, Hamburg, Germany. All rights reserved, including graphics and images. No part of this publication
Thin Layer Chromatography
 Thin Layer Chromatography Thin-layer chromatography involves the same principles as column chromatography, it also is a form of solid-liquid adsorption chromatography. In this case, however, the solid
Waters GPC User Guide and Tutorial for Using the GPC in the Reynolds Research Group 2 nd Edition: April 2012
 Waters GPC User Guide and Tutorial for Using the GPC in the Reynolds Research Group 2 nd Edition: April 2012 Georgia Institute of Technology School of Chemistry & Biochemistry School of Materials Science
PTG-NIR Powder Characterisation System (not yet released for selling to end users)
") Powder Characterisation System - PTG-NIR PTG-NIR Powder Characterisation System (not yet released for selling to end users) The PTG-NIR automatic powder and granule inspection system with integrated NIR
Powder Characterisation System - PTG-NIR PTG-NIR Powder Characterisation System (not yet released for selling to end users) The PTG-NIR automatic powder and granule inspection system with integrated NIR
Fourier Transform Infrared Spectroscopy (Perkin Elmer - Spectrum One)
") Fourier Transform Infrared Spectroscopy (Perkin Elmer - Spectrum One) This operating procedure intends to provide guidance for transmission/absorbance measurements with the FTIR. For additional modes of
Fourier Transform Infrared Spectroscopy (Perkin Elmer - Spectrum One) This operating procedure intends to provide guidance for transmission/absorbance measurements with the FTIR. For additional modes of
Kinetics of Crystal Violet Bleaching
 Kinetics of Crystal Violet Bleaching Authors: V. C. Dew and J. M. McCormick* From Update March 12, 2013 with revisions Nov. 29, 2016 Introduction Chemists are always interested in whether a chemical reaction
USGS Troy WSC Laboratory Inductively Coupled Plasma- NH4Cl Soil Extracts SOP 425 Jordan Road Rev. No. 2.0 Troy, NY Date: 03/16/2012 Page 1 of 7
 Troy, NY 12180 Date: 03/16/2012 Page 1 of 7 USGS District Laboratory, Troy, NY Inductively Coupled Plasma Optical Emission Spectrometry Standard Operating Procedure 1. Scope and Application 1.1 Analytes
N) manual. Biomaster Operating manual
 manual. Biomaster Operating manual") 830 ual N) manual Operating manual Copyright 2013 Eppendorf AG, Hamburg. No part of this publication may be reproduced without the prior permission of the copyright owner. Trademarks Eppendorf and the
830 ual N) manual Operating manual Copyright 2013 Eppendorf AG, Hamburg. No part of this publication may be reproduced without the prior permission of the copyright owner. Trademarks Eppendorf and the
Ocean Optics Red Tide UV-VIS Spectrometer (Order Code: SPRT-UV-VIS)
") Ocean Optics Red Tide UV-VIS Spectrometer (Order Code: SPRT-UV-VIS) The UV-VIS spectrometer is a portable ultraviolet light and visible light spectrophotometer, combining a spectrometer and a light source/cuvette
Ocean Optics Red Tide UV-VIS Spectrometer (Order Code: SPRT-UV-VIS) The UV-VIS spectrometer is a portable ultraviolet light and visible light spectrophotometer, combining a spectrometer and a light source/cuvette
Experiment. Quantification of Ascorbic acid by Fluorescence Spectroscopy1
 Experiment. Quantification of Ascorbic acid by Fluorescence Spectroscopy Modified 10/2017 Experiment. Quantification of Ascorbic acid by Fluorescence Spectroscopy1 Objective: The goal of this experiment
Lab Activity H4 It s Snow Big Deal
 Lab Activity H4 It s Snow Big Deal OUTCOMES After completing this lab activity, the student should be able to use computer-based data acquisition techniques to measure temperatures. draw appropriate conclusions
Operation Manual. SPECTRO-NANO4 Nucleic Acid Analyzer PLEASE READ THIS MANUAL CAREFULLY BEFORE OPERATION
 Operation Manual SPECTRO-NANO4 Nucleic Acid Analyzer PLEASE READ THIS MANUAL CAREFULLY BEFORE OPERATION 3, Hagavish st. Israel 58817 Tel: 972 3 5595252, Fax: 972 3 5594529 mrc@mrclab.com MRC. 4.18 Foreword
Technical Procedure for Glass Refractive Index Measurement System 3 (GRIM 3)
") Technical Procedure for Glass Refractive Index Measurement System 3 (GRIM 3) 1.0 Purpose - This technical procedure shall be followed for the operation of the GRIM 3. 2.0 Scope - This procedure applies
Technical Procedure for Glass Refractive Index Measurement System 3 (GRIM 3) 1.0 Purpose - This technical procedure shall be followed for the operation of the GRIM 3. 2.0 Scope - This procedure applies
Experiment C-15 Distillation - part 1
 1 Experiment C-15 Distillation - part 1 Objectives To learn about the three classical phases of matter, phase changes, and heating and cooling curves. To investigate the technique of distillation and to
University of Colorado Denver Anschutz Medical Campus Online Chemical Inventory System User s Manual
 University of Colorado Denver Anschutz Medical Campus Online Chemical Inventory System User s Manual Hazardous Materials Division 303-724-0345 chemical.inventory@ucdenver.edu May, 2017 Table of Contents
Thin Layer Chromatography
 Experiment: Thin Layer Chromatography Chromatography is a technique widely used by organic chemists to separate and identify components in a mixture. There are many types of chromatography, but all involve
UV-Vis optical fiber assisted spectroscopy in thin films and solutions
 UV-Vis optical fiber assisted spectroscopy in thin films and solutions Description UV-Visible absorption and transmission spectra provide fundamental information for all experiments related to the attenuation
RATE LAW DETERMINATION OF CRYSTAL VIOLET HYDROXYLATION
 Rate Law Determination of Crystal Violet Hydroxylation Revised 5/22/12 RATE LAW DETERMINATION OF CRYSTAL VIOLET HYDROXYLATION Adapted from "Chemistry with Computers" Vernier Software, Portland OR, 1997
Plop Plop, Fizz Fizz, Oh What A Relief It Is (Which Pain Reliever Works Fastest)
") Page 1 of 7 Plop Plop, Fizz Fizz, Oh What A Relief It Is (Which Pain Reliever Works Fastest) Learning Objectives: Study the dissolution rate (how quickly the compound dissolves) of common OTC (over the
Page 1 of 7 Plop Plop, Fizz Fizz, Oh What A Relief It Is (Which Pain Reliever Works Fastest) Learning Objectives: Study the dissolution rate (how quickly the compound dissolves) of common OTC (over the
Chemistry 3202 Lab 6 Hess s Law 1
 Chemistry 3202 Lab 6 Hess s Law 1 Lab 6 Hess's Law Introduction Chemical and physical changes are always accompanied by a change in energy. Energy changes may be observed by detecting heat flow between
The PEAC-WMD Gamma Radiation Dose Calculator
 The PEAC-WMD Gamma Radiation Dose Calculator During the last couple of months newsletters I ve discussed some of the new computational tools included in the PEAC-WMD 2007 (v5.5) application. This month
Test Equipment Depot Washington Street Melrose, MA TestEquipmentDepot.com INSTRUCTION MANUAL. Milwaukee Refractometer
 Test Equipment Depot - 800.517.8431-99 Washington Street Melrose, MA 02176 TestEquipmentDepot.com INSTRUCTION MANUAL Milwaukee Refractometer MA871 Refractometer for Sucrose Measurements 1 Instruction Manual
Experiment 13. Dilutions and Data Handling in a Spreadsheet rev 1/2013
 Absorbance Experiment 13 Dilutions and Data Handling in a Spreadsheet rev 1/2013 GOAL: This lab experiment will provide practice in making dilutions using pipets and introduce basic spreadsheet skills
Session #1: Theoretical background and computer simulations of molecular vibrations.
 Raman Spectroscopy Session #1: Theoretical background and computer simulations of molecular vibrations. Goals: Understand the origin of the Raman effect. Understand the vibrational normal modes of molecules.
FIELD SPECTROMETER QUICK-START GUIDE FOR FIELD DATA COLLECTION (LAST UPDATED 23MAR2011)
") FIELD SPECTROMETER QUICK-START GUIDE FOR FIELD DATA COLLECTION (LAST UPDATED 23MAR2011) The ASD Inc FieldSpec Max spectrometer is a precision instrument designed for obtaining high spectral resolution
FIELD SPECTROMETER QUICK-START GUIDE FOR FIELD DATA COLLECTION (LAST UPDATED 23MAR2011) The ASD Inc FieldSpec Max spectrometer is a precision instrument designed for obtaining high spectral resolution
How to Make Photometric & Colorimetric Measurements of Light Sources using an Ocean Optics Spectrometer and SpectraSuite Software
 How to Make Photometric & Colorimetric Measurements of Light Sources using an Ocean Optics Spectrometer and SpectraSuite Software This is a concise guide to setting up and calibrating your Ocean Optics
Determining the K sp of Calcium Hydroxide
 Determining the K sp of Calcium Hydroxide (Titration Method) Computer 23 Calcium hydroxide is an ionic solid that is sparingly soluble in water. A saturated, aqueous, solution of Ca(OH) 2 is represented
ON SITE SYSTEMS Chemical Safety Assistant
 ON SITE SYSTEMS Chemical Safety Assistant CS ASSISTANT WEB USERS MANUAL On Site Systems 23 N. Gore Ave. Suite 200 St. Louis, MO 63119 Phone 314-963-9934 Fax 314-963-9281 Table of Contents INTRODUCTION
Rapid RH Portable ph Meter. User's Manual
 Rapid RH Portable ph Meter User's Manual This page intentionally left blank. 2 Contents 1. Introduction... 4 2. Included with the Rapid RH Portable ph Meter... 4 3. Understanding ph... 5 4. Calibrating
Zetasizer Nano-ZS User Instructions
 Zetasizer Nano-ZS User Instructions 1. Activate the instrument computer by logging in to CORAL. If needed, log in to the local instrument computer Username: zetasizer. Password: zetasizer. 2. Instrument
Technical Procedure for Solid Phase Extraction of THC and THC-COOH for GC-MS Analysis
 Technical Procedure for Solid Phase Extraction of THC and THC-COOH 1.0 Purpose - This procedure specifies the required elements for the extraction of THC and THC-COOH using United Technologies Styre Screen
IDENTIFICATION TESTS FOR DURACOR TABLETS
 PAGE 1 OF 8 IDENTIFICATION TESTS FOR DURACOR TABLETS PAGE 2 OF 8 PROTOCOL APPROVALS Norvin Pharma Inc. Signature and Date Author Analytical Laboratory Approver Analytical Laboratory Group Leader Approver
New Developments in Raman Spectroscopic Analysis
 New Developments in Raman Spectroscopic Analysis Mike Kayat B&W Tek, Inc 19 Shea Way Newark, DE 19713 United States of America +1 302 368 7824 mikek@bwtek.com 1 Overview Raman spectroscopy is now an established
Using a mini-gas Chromatograph (GC): Identifying Unknown Compounds
: Identifying Unknown Compounds") Experiment Using a mini-gas Chromatograph (GC): Identifying Unknown Compounds There are many different types of chromatography: paper, thin layer, liquid, high-pressure liquid (HPLC) and gas (GC). Chromatography
Experiment Using a mini-gas Chromatograph (GC): Identifying Unknown Compounds There are many different types of chromatography: paper, thin layer, liquid, high-pressure liquid (HPLC) and gas (GC). Chromatography
Introduction to Fourier Transform Infrared Spectroscopy
 molecular spectroscopy Introduction to Fourier Transform Infrared Spectroscopy Part of Thermo Fisher Scientific Introduction What is FT-IR? FT-IR stands for Fourier Transform InfraRed, the preferred method
ph electrode Instruction Manual For use with the RAH-210 & RPH-250
 ph electrode Instruction Manual For use with the RAH-210 & RPH-250 The information in this manual was current at the time of printing. The most current versions of all Hydro Instruments manuals can be
EXPERIMENT 6 INTRODUCTION TO SPECTROSCOPY
 EXPERIMENT 6 INTRODUCTION TO SPECTROSCOPY INTRODUCTION Much of what we know about the structures of atoms and molecules has been learned through experiments in which photons (electromagnetic radiation
Spectrometer User s Guide
 Spectrometer User s Guide (Order Codes: V-SPEC, SPRT-VIS, SP-VIS, SP-UV-VIS, ESRT-VIS) The spectrometer is a portable light spectrophotometer, combining a spectrometer and a light source/cuvette holder.
Zinc Metal Determination Perkin Elmer Atomic Absorption Spectrometer AAnalyst Procedures
 Villanova University Date: Oct 2011 Page 1 of 9 Villanova University Villanova Urban Stormwater Partnership Watersheds Laboratory Standard Operating Procedure VUSP F Zinc Metal Determination Perkin Elmer
L E A. Laser Elemental Analyzer
 L E A Laser Elemental Analyzer The Future of handheld analysis The LEA is a hand-held analyzer which uses a low power laser beam to provide instant, on-site, elemental fingerprinting of materials. The
CHEMICAL INVENTORY ENTRY GUIDE
 CHEMICAL INVENTORY ENTRY GUIDE Version Date Comments 1 October 2013 Initial A. SUMMARY All chemicals located in research and instructional laboratories at George Mason University are required to be input
Determining the Concentration of a Solution: Beer s Law
 Determining the Concentration of a Solution: Beer s Law Vernier Spectrometer 1 The primary objective of this experiment is to determine the concentration of an unknown copper (II) sulfate solution. You
Concentrations that absorb. Measuring percentage transmittance of solutions at different concentrations
 Measuring percentage transmittance of solutions at different Dimension 2 Cross Cutting Concepts Dimension 1 Science and Engineering Practices FRAMEWORK FOR K-12 SCIENCE EDUCATION 2012 Concentrations that
The Synthesis and Analysis of Aspirin
 The Synthesis and Analysis of Aspirin Computer 22 Aspirin, the ubiquitous pain reliever, goes by the chemical name acetylsalicylic acid. One of the compounds used in the synthesis of aspirin is salicylic
Environment Department CoSHH Assessment Form
 Environment Department CoSHH Assessment Form This document should be completed electronically or in handwritten block capitals and by consulting current Safety Data Sheets (SDS). Completed forms should
Title: ASML Stepper Semiconductor & Microsystems Fabrication Laboratory Revision: B Rev Date: 12/21/2010
 Approved by: Process Engineer / / / / Equipment Engineer 1 SCOPE The purpose of this document is to detail the use of the ASML PAS 5500 Stepper. All users are expected to have read and understood this
R I T. Title: GCA Stepper Operations. Semiconductor & Microsystems Fabrication Laboratory Revision: F Rev Date: 08/09/ SCOPE
 Approved by: Process Engineer / / / / Equipment Engineer 1 SCOPE The purpose of this document is to detail the use of the GCA Stepper. All users are expected to have read and understood this document.
INSTRUCTION MANUAL Milwaukee Refractometer MA886 Refractometer for Sodium Chloride Measurements
 Milwaukee Refractometer MA886 Refractometer for Sodium Chloride Measurements www.milwaukeeinst.com INSTRUCTION MANUAL www.milwaukeeinst.com 1 Instruction Manual MA886 Refractometer for Sodium Chloride
INSTRUCTION MANUAL Milwaukee Refractometer MA881 Refractometer for Invert Sugar Measurements
 www.milwaukeeinst.com INSTRUCTION MANUAL Milwaukee Refractometer MA881 Refractometer for Invert Sugar Measurements www.milwaukeeinst.com 1 Instruction Manual MA881 Refractometer for Invert Sugar Measurements
HL-800K Infrared Laser Thermometer. -50 C to +800 C (13:1 ratio) User Manual
 User Manual") HL-800K Infrared Laser Thermometer -50 C to +800 C (13:1 ratio) User Manual TABLE OF CONTENTS INTRODUCTION... 3 FEATURES... 3 WIDE APPLICATION RANGE... 3 SAFETY... 3 DISTANCE & SPOT SIZE... 4 SPECIFICATIONS...
HL-800K Infrared Laser Thermometer -50 C to +800 C (13:1 ratio) User Manual TABLE OF CONTENTS INTRODUCTION... 3 FEATURES... 3 WIDE APPLICATION RANGE... 3 SAFETY... 3 DISTANCE & SPOT SIZE... 4 SPECIFICATIONS...
Measuring ph with Smart Cuvettes
 1 Measuring ph with Smart Cuvettes Hardware Setup for ph Measurements ph is measured in Absorbance mode. Configure your spectroscopy components for Absorbance measurements. Sample Absorbance setups for
Fluorescence Spectrophotometry
 Chemistry 422L Manual Page 27 I. Introduction Fluorescence Spectrophotometry Ru(bpy) 3 2+, where bpy = 2, 2' bipyridine, has been one of the most widely studied metal complexes in recent years. Interest
Reference Standards Page 156 For calibrating your spectrometer. PIKECalc Page 159 For FTIR sampling computations
 Standards, Software, Databases We strive to provide you with useful sampling tools for spectroscopy and offer these additional products and information to serve your laboratory requirements. If you have
Experiment 9. Emission Spectra. measure the emission spectrum of a source of light using the digital spectrometer.
 Experiment 9 Emission Spectra 9.1 Objectives By the end of this experiment, you will be able to: measure the emission spectrum of a source of light using the digital spectrometer. find the wavelength of
Determination of the Equivalent Weight and the K a or K b for a Weak Acid or Base
 INTRODUCTION Determination of the Equivalent Weight and the K a or K b for a Weak Acid or Base Chemists frequently make use of the equivalent weight (eq. wt.) as the basis for volumetric calculations.
Chemical Storage Guide
 1 P a g e Chemical Storage Guide It is the responsibility of every occupant, owner, tenant, contractor, employee & visitor and ALL users of this facility to ensure they take all reasonably practical steps
In Association With. Introduces. TPT Contractor
 In Association With Introduces TPT Contractor Software for Contractors with TENSIONMETERS Table of Contents Capabilities 4 Setup and Use 7 The Dashboard 12 Tower Setup Form 18 Field Calibration Verification
Experiment C-10 Titration of a Strong Acid and a Strong Base
 1 Experiment C-10 Titration of a Strong Acid and a Strong Base Objectives To study the titration process. To follow changes in the ph during the titration process while adding a strong base to a strong
IDRaman reader and IDRaman mini: Raster Orbital Scanning (ROS)
") IDRaman reader and IDRaman mini: Raster Orbital Scanning (ROS) Tightly focused beam may give noisy signals or miss the Raman active target completely leading to false negatives from unidentified samples
IDRaman reader and IDRaman mini: Raster Orbital Scanning (ROS) Tightly focused beam may give noisy signals or miss the Raman active target completely leading to false negatives from unidentified samples
Figure 1. Structures of compounds to be analyzed by IR.
 Experiment 4 IR Exercise Reading Assignment Mohrig Chapter 21 and watch IR videos online In this experiment, students will study the infrared (IR) spectra of compounds with different functional groups.
GUIDE TO LABORATORY SURVEYS. Introduction
 APPENDIX - V GUIDE TO LABORATORY SURVEYS Introduction Routine laboratory surveys are an important part of the overall radiation safety program in a laboratory. Surveys provide a direct measure of the presence
CHEMISTRY 170. Radioisotopes
 CHEMISTRY 170 Radioisotopes Positron Emission Tomography or PET scans use the radioisotope 18 F to create an image of the brain. DEPARTMENT OF CHEMISTRY UNIVERSITY OF KANSAS Radioisotopes Introduction
Plop Plop, Fizz Fizz, Oh What A Relief It Is (Which Pain Reliever Works Fastest)
") Page 1 of 8 Plop Plop, Fizz Fizz, Oh What A Relief It Is (Which Pain Reliever Works Fastest) Learning Objectives: Study the dissolution rate (how quickly the compound dissolves) of common OTC (over the
Page 1 of 8 Plop Plop, Fizz Fizz, Oh What A Relief It Is (Which Pain Reliever Works Fastest) Learning Objectives: Study the dissolution rate (how quickly the compound dissolves) of common OTC (over the
COMPLEX HEROIN COMPARISON INVESTIGATION
 COMPLEX HEROIN COMPARISON INVESTIGATION Michael A. DROZDOV, Andrei V. KAMAEV, Tatiana B. KIMSTACH Forensic Science Centre, Moscow, Russia ABSTRACT: The identification and quantitation of illicit heroin
Psychoactive Drugs Urine LC-MS/MS Analysis Kit User Manual
 Page 1 / 18 Psychoactive Drugs Urine LC-MS/MS Analysis Kit User Manual ZV-2001-0200-20 200 2-8 C Page 2 / 18 Table of Contents 1. INTENDED USE... 3 2. SUMMARY AND EXPLANATION... 3 3. TEST PRINCIPLE...
Separating the Mixture
 Separating the Mixture 40- to 1 50-minute session ACTIVITY OVERVIEW I N V E S T 5 I O N I G AT Students perform their procedures written in Activity 3, A Plan to Separate the Mixture, to physically separate
Application Note 12: Fully Automated Compound Screening and Verification Using Spinsolve and MestReNova
 Application Note : Fully Automated Compound Screening and Verification Using Spinsolve and MestReNova Paul Bowyer, Magritek, Inc. and Mark Dixon, Mestrelab Sample screening to verify the identity or integrity
Sodium Sealed Electrode Sensor Bundle Product Number: ENSOD051
 imagine explore learn Sodium Sealed Electrode Sensor Bundle Product Number: ENSOD051 Overview Sodium is highly abundant in the lithosphere (Earth s outer shell) where it occurs as rock salt deposits as
SC400 Colorimeter. Silica. Photometer-System. Instruction Manual. SiO 2. Bedienungsanleitung Seite Instruction Manual Page 19 33
 Photometer-System SC400 Colorimeter SiO 2 Silica DE GB FR IT ES Bedienungsanleitung Seite 3 17 Instruction Manual Page 19 33 d'emploi Page 35 49 Instruction Manual Istruzioni d'uso Pagina 51 65 Instrucciones
Introduction. Concepts Kinetics Order of reaction Reaction rate Colorimetry. Background
 Introduction Phenolphthalein is a dye that is used as an acid-base indicator. It is colorless in acidic or neutral solutions and turns bright red-violet (fuschia) as the solution becomes basic. In strongly
3. Chemical Hygiene Plan: Laboratory Standard Operating Procedures. A. Laboratory Specific Information and Signatures
 3. Chemical Hygiene Plan: Laboratory Standard Operating Procedures A. Laboratory Specific Information and Signatures The Chemical Hygiene Plan: Laboratory Standard Operating Procedures (section 3 only),
Instruction Manual HI Refractometer for Sodium Chloride Measurements
 Instruction Manual HI 96821 Refractometer for Sodium Chloride Measurements www.hannainst.com 1 Dear Customer, Thank you for choosing a Hanna Instruments product. Please read this instruction manual carefully
Aspirin Lab By Maya Parks Partner: Ben Seufert 6/5/15, 6/8/15
 Aspirin Lab By Maya Parks Partner: Ben Seufert 6/5/15, 6/8/15 Abstract: This lab was performed to synthesize acetyl salicylic acid or aspirin from a carboxylic acid and an alcohol. We had learned in class
hydrideicp Hydride Generation System
 HG-MP2-4-A hydrideicp Generation System hydrideicp Hydride Generation System User Manual MP 2 hydrideicp Generation System Elemental Scientific Phone: 1.402.991.7800 Email: esi@icpms.com 1500 North 24th
Experiment 2: The Beer-Lambert Law for Thiocyanatoiron (III)
") Chem 1B Dr. White 11 Experiment 2: The Beer-Lambert Law for Thiocyanatoiron (III) Objectives To use spectroscopy to relate the absorbance of a colored solution to its concentration. To prepare a Beer s
Chem 1B Dr. White 11 Experiment 2: The Beer-Lambert Law for Thiocyanatoiron (III) Objectives To use spectroscopy to relate the absorbance of a colored solution to its concentration. To prepare a Beer s
Optical density measurements automatically corrected to a 1-cm pathlength with PathCheck Technology
 APPLICATION NOTE Optical density measurements automatically corrected to a 1-cm pathlength with PathCheck Technology Introduction UV/VIS spectrophotometers and microplate readers differ fundamentally in
CHEMISTRY 130 General Chemistry I. Radioisotopes
 CHEMISTRY 130 General Chemistry I Radioisotopes Positron Emission Tomography or PET scans use the radioisotope 18 F to create an image of the brain. DEPARTMENT OF CHEMISTRY UNIVERSITY OF KANSAS Radioisotopes
Chemwatch How To. Create Labels for Chemicals, Products & Mixtures.
 Chemwatch How To. Create Labels for Chemicals, Products & Mixtures. Dr Ian Lane Radiation and Chemical Manager Faculty of Science Version 1.0, April 2017 Outline: (i) Important Note! Part A: Creating a
2. Synthesis of Aspirin
 This is a two-part laboratory experiment. In part one, you will synthesize (make) the active ingredient in aspirin through a reaction involving a catalyst. The resulting product will then be purified through
David A. Katz Department of Chemistry Pima Community College, 2202 W. Anklam Rd. Tucson, AZ 85709, USA
 EXPERIMENTS FOR NUCLEAR CHEMISTRY 2013, 2010, 2008, 2004, 1972 by David A. Katz. All rights reserved. Permission for classroom use provided original copyright is included. David A. Katz Department of Chemistry
CHEMICAL SEPARATION EXPERIMENT 2
 CHEMICAL SEPARATION EXPERIMENT 2 INTRODUCTION The term analysis in chemistry usually refer to the quantitative and qualitative determination of the components of a sample. Qualitative refering to the identity
Chromatographic Methods of Analysis Section 2: Planar Chromatography. Prof. Tarek A. Fayed
 Chromatographic Methods of Analysis Section 2: Planar Chromatography Prof. Tarek A. Fayed Planar chromatography includes two types: 1- Thin Layer Chromatography (TLC). 2- Paper Chromatography (PC). Thin