ATM 507 Meeting 6. ftp://ftp.nilu.no/pub/nilu/geir/assessment-2006/10%20q&aschapter.pdf
|
|
|
- Jean Hopkins
- 5 years ago
- Views:
Transcription
1 ATM 507 Meeting 6 Text reading Section 5.7 Problem Set # 4 due Oct. 11 Today s topics Polar Stratospheric Chemistry and the Ozone Hole, Global Ozone Trends Required reading: 20 Questions and Answers from the 2006 WMO report on Ozone Depletion: ftp://ftp.nilu.no/pub/nilu/geir/assessment-2006/10%20q&aschapter.pdf 1
2 Ozone Depletion over South Pole Balloon borne ozone profiles measured at South Pole: blue is the average of several profiles measured in September and October during before the Antarctic ozone hole; red is on the day of the maximum ozone loss in 2001; green is the lowest total ozone recorded in 1986, the first year of CMDL's sounding program at the South Pole. Total column ozone is given in Dobson Units (DU) for each of the profiles. 2
3 Airplane missions ER-2 range up to ~ 20 km. Real-time measurements of O 3, NO, NO 2, NO y, ClO, BrO, N 2 O, H 2 O, CN (particles), and more. DC-8 Flew at lower altitudes but included some additional instruments like FT interferometer, LIDAR, and whole air sampler. ER-2 measurements provided the smoking gun. 3
4 Smoking Gun Measurements Outside vortex Inside vortex Outside vortex Inside vortex 4
5 What the measurements show Huge increases of active chlorine inside the vortex ( times previously observed mid-latitude values at these altitudes). In late August, ozone inside and outside the vortex are essentially the same. Boundary of the vortex moves around some, and can get a little ragged. After 3 weeks of reaction time, ozone is down by a factor of two (or more) inside the vortex only. At the same time active chlorine (ClO) is up another 50% inside the vortex. Note the very strong anti-correlation between O 3 and ClO near the edge of the vortex on the second flight. 5
6 Why so different than the mid-latitudes? This phenomenon was a huge surprise to the scientific community. As it turns out, this was the first example of significant perturbation of atmospheric chemistry due to heterogeneous chemistry, in this case the chemistry occurring on/in ice clouds. For our purposes: Homogeneous chemistry: gas phase reactions only; Heterogeneous chemistry: gas/solid, gas/liquid, and/or gas/liquid/solid phase reactions all considered. Current understanding of polar ozone depletion centers around Polar Stratospheric Clouds or PSCs. Since there is very little H 2 O in the stratosphere (a few ppmv), very low temperatures are needed to form PSCs. 6
7 Recap Reservoir species and holding cycle reactions tend to keep the stratospheric ozone in balance. There is potential for large ozone destruction if the balance is disrupted. The disruption can occur if there are large unchecked emissions of the source gas in one chemical family (i.e., CFCs); or large removal of the radicals in one chemical family (i.e., NO x removal). Antarctic Ozone Hole appears around Polar night, polar votex, cold temperatures Spring time only (return of sun triggers loss) Occurs in km altitude range New chemistry required to explain What is the link with Polar Stratospheric Clouds? 7
8 PSC Formation (Polar Stratospheric Clouds) In the Antarctic polar night the temperatures do routinely go below 190 K (and stay there). This is cold enough to force condensation. Step 1. As temperatures drop below K, water condenses on the existing background aerosol particles, which are predominantly concentrated H 2 SO 4 droplets (~75% H 2 SO 4, ~25% H 2 O). As temperatures drop further, these particles take up additional water, become larger and more dilute. (Recall, mr of water in the stratosphere is ~ 3-5 ppmv, so VERY cold temperatures needed to condense the vapor.) 8
9 Simple Picture of PSC Formation 9
10 PSC Formation (cont.) Step 2. As the temperature approaches 195 K, small crystals of HNO 3 3(H 2 O) {NAT} form. These are called Type I PSCs. (size ~ 1 µm diameter) Step 3. As the temperature decreases below 190 K, crystals get larger and more dilute, with diameters of 10 µm and larger. These Type II PSCs can settle out of the stratosphere (due to gravity), removing NO x and H 2 O from the surrounding air. The Denitrification and Dehydration provide the strong perturbation required to disrupt the standard chemistry, i.e., the ozone balance. 10
11 11
12 Temperature and PSC Formation Temperature (white bars) and PSC observations (black bars) For the given temperature bin, ratio of number of PSC observations to number of temperature observations (i.e., for low enough temperatures, PSCs are common.) 12
. The photograph was taken just at sunrise for the lower atmosphere.")
13 Polar Stratospheric Cloud, seen from the NASA DC-8 on 4 February 2003 (photograph by Mark Schoeberl, GSFC). This cloud was formed due to turbulent air motion over Iceland (mountain waves). Lidar measurements revealed the primary cloud was composed of ice (Type 2 PSC). The photograph was taken just at sunrise for the lower atmosphere. Under these conditions, the polar stratospheric cloud is illuminated directly by the sun while the lower atmosphere is still shaded from the 13 direct sunlight, accounting for the brilliant appearance of this cloud.

14 Polar Stratospheric Cloud, seen from the NASA DC-8 on 14 January 2003 (photograph by Paul Newman, GSFC). These are naturally occurring clouds composed of small nitric acid and water particles. The clouds have a colorful appearance because they contain similar sized, small particles each of which refracts sunlight in a similar manner. This image is notable for illustrating the high altitude (approximately 70,000 ft) of the polar stratospheric clouds, well above the cirrus cloud deck that lies below the DC-8 airplane. Reactions that occur on the surface of these clouds convert chlorine, most of which is due to human sources, from relatively inert forms to compounds that lead to rapid ozone destruction. 14
15 PSC Processing of Air 1. Most of the HNO 3 (the reservoir for NO x radicals) is tied up in PSC ice crystals and removed from the air mass. 2. HCl (one of the reservoirs for ClO X ) is also taken up by the ice crystals, but unlike HNO 3, it undergoes a chemical reaction before the crystals settle out: I. ClNO 3 + HCl(s) Cl 2 + HNO 3 (s) Note that ClNO 3 and HCl contain most of the Cl that has been liberated from the chlorine sources. 15
16 Unperturbed partitioning of chlorine species between sources, reservoirs, and active forms Note: ClONO 2 and ClNO 3 are the same thing. 16
17 Textbook Figure 5.14 Another picture of the unperturbed distribution of chlorine species in the stratosphere. Note the dominance of HCl and the importance of ClONO 2 (once the Cl is liberated from the CCl y source gases). 17
18 Chlorine liberation and Ozone destruction I. ClNO 3 + HCl(s) Cl 2 + HNO 3 (s) The ClNO 3 + HCl can proceed as long as the PSCs persist (days weeks). When sunlight returns to the region II. Cl 2 + hv Cl + Cl (very fast) III. 2[Cl + O 3 ClO + O 2 ] IV. 2[ClO + NO 2 + M ClNO 3 + M ] NET: HCl + 2 O NO 2 ClNO 3 + 2O 2 + HNO 3 (s) These reactions (I IV) continue until either: HCl(s) is gone (used up) pre-1979 NO 2 is all converted (via ClNO 3 ) to HNO 3, at which point the ClO builds up and the Cl species are dramatically repartitioned. 18
19 Polar Ozone Chemistry (cont.) KEY IDEA: Inactive forms of Cl (HCl, ClNO 3 ) are transformed into active forms of Cl (Cl 2, then Cl and ClO) through PSC processing. In the simple reaction scheme shown above, if complete processing is assumed (i.e., reaction I fast), then large amounts of active chlorine (as ClO) are built up if: [HCl] i > ½ [NO X ] i Summarizing the necessary conditions: Denitrification required (to lower [NO x ]) [HCl] must be above some minimum level 19
20 Other heterogeneous reactions ClNO 3 + H 2 O(s) HOCl + HNO 3 (s) HOCl + HCl(s) Cl 2 + H 2 O(s) Ties up NO x Liberates active Cl Liberates active Cl N 2 O 5 + HCl(s) ClNO 2 + HNO 3 (s) N 2 O 5 + H 2 O(s) 2HNO 3 (s) Ties up NO x Liberates active Cl Ties up NO x These reactions also pave the way for chemical loss of O 3. 20
21 Chemical Loss of O 3 (review) ClO dimer mechanism ClO + ClO + M ClOOCl + M ClOOCl + hv Cl + ClOO ClOO + M Cl + O 2 + M 2[ Cl + O 3 ClO + O 2 ] NET: 2O 3 + hv 3O 2 ClO-BrO mechanism Cl + O 3 ClO + O 2 Br + O 3 BrO + O 2 BrO + ClO Br + Cl + O 2 * NET: 2O 3 3O 2 21

22 Contributions of ClO dimer and ClO-BrO cycles 22
23 Chlorine ozone hole chemistry (excluding Bromine) 23
24 Observed Ozone loss in the northern polar region 24
25 February 1989 ER-2 measurement campaign. Flight track from Norway to Greenland and back. Highly elevated ClO in PSC processed air concentration levels comparable to Antarctica. (Shorter lifetime and coverage of PSCs explains much lower total overall ozone loss.) 25
26 Recap 1. PSC formation esp. Type II with large particles that remove gaseous HNO Reactions on PSCs that remove NO x and liberate active ClO X. 3. Cl 2, HOCl, and ClNO 2 photolyze rapidly when the sun returns. 4. NO X buffers the release of active ClO X by forming ClNO 3, which in turn reacts with PSCs to form active ClO x and HNO When air is denitrified, active ClO x builds up and large scale O 3 depletion occurs via ClO + ClO, ClO + BrO, etc. 26
27 Schematic time series of chlorine and temperature in polar ozone depletion period. 27
28 Final comments Chemical models now include both gas phase and heterogeneous processes and do a reasonable job of describing polar ozone loss. ClO dimer mechanism accounts for up to 60-80% of the polar ozone loss ClO-BrO mechanism is the next biggest contributor There are outstanding problems (recall Stratospheric warming and 2002). Heterogeneous chemistry in the global stratosphere is an area of active research. Natural stratospheric aerosols Aircraft emissions Volcanoes 28
29 Q & A on Stratospheric Ozone 20 Questions and Answers from the 2006 WMO report on Ozone Depletion: ftp://ftp.nilu.no/pub/nilu/geir/assessment-2006/10%20q&aschapter.pdf Required reading this may show up on the midterm! 29

30 From the 1998 Q&A set. 30
31 Ozone Trend Analysis Measurements of the total ozone column from ground stations and from satellites have been analyzed for trends in ozone. Some of the confounding factors include: The annual cycle Quasi-biennial oscillation (QBO) El Nino Southern Oscillation (ENSO) The 11 year solar cycle Volcanic eruptions Indications are, that on a global scale, ozone had decreased about 3% from Little change (slight increase?) since then. 31
32 Ground-Based Ozone Trend 32
33 Trend reversal? 33
34 Satellite Ozone Trend notice time range 34

35 Trend by Latitude and Season 35
36 Trends from Three Sets of Measurements 36
37 2006 Assessment Report 37


38 More sophisticated analysis from the 2006 Assessment EESC Effective Equivalent Stratospheric Chlorine 38
39 39
40 Ozone Assessments Scientific Assessment of Ozone Depletion World Meteorological Organization (WMO) 2010: 2006: sst_report.html 2002: html 1998: : 1991: 1989: Atmospheric Ozone:
41 From the Ozone Assessments TOTAL COLUMN OZONE 2010: Average total ozone values in have remained at the same level for the past decade, about 3.5% and 2.5% below the averages respectively for 90 S-90 N and 60 S-60 N. 2010: The latitude dependence of simulated total column ozone trends generally agrees with that derived from measurements, showing large negative trends at Southern Hemisphere mid and high latitudes and Northern Hemisphere midlatitudes for the period of ODS (ozone depleting substances) increase. 41
42 POLAR OZONE (2010 Assessment) The Antarctic ozone hole continued to appear each spring from 2006 to This is expected because decreases in stratospheric chlorine and bromine have been moderate over the last few years. Analysis shows that since 1979 the abundance of total column ozone in the Antarctic ozone hole has evolved in a manner consistent with the time evolution of ODSs. Since about 1997 the ODS amounts have been nearly constant and the depth and magnitude of the ozone hole have been controlled by variations in temperature and dynamics. The October mean column ozone within the vortex has been about 40% below 1980 values for the past fifteen years. Arctic winter and spring ozone loss has varied between 2007 and 2010, but remained in a range comparable to the values that have prevailed since the early 1990s. Chemical loss of about 80% of the losses observed in the record cold winters of 1999/2000 and 2004/2005 has occurred in recent cold winters. Recent laboratory measurements of the chlorine monoxide dimer (ClOOCl) dissociation cross section and analyses of observations from aircraft and satellites have reaffirmed the fundamental understanding that polar springtime ozone depletion is caused primarily by the ClO + ClO catalytic ozone destruction cycle, with significant contributions from the BrO + ClO cycle. Polar stratospheric clouds (PSCs) over Antarctica occur more frequently in early June and less frequently in September than expected based on the previous satellite PSC climatology. This result is obtained from measurements by a new class of satellite instruments that provide daily vortex-wide information concerning PSC composition and occurrence in both hemispheres. The previous satellite PSC climatology was developed from solar occultation instruments that have limited daily coverage. Calculations constrained to match observed temperatures and halogen levels produce Antarctic ozone losses that are close to those derived from data. Without constraints, CCMs simulate many aspects of the Antarctic ozone hole, however they do not simultaneously produce the cold temperatures, isolation from middle latitudes, deep descent, and high amounts of halogens in the polar vortex. Furthermore, most CCMs underestimate the Arctic ozone loss that 42 is derived from observations, primarily because the simulated northern winter vortices are too warm.
43 43
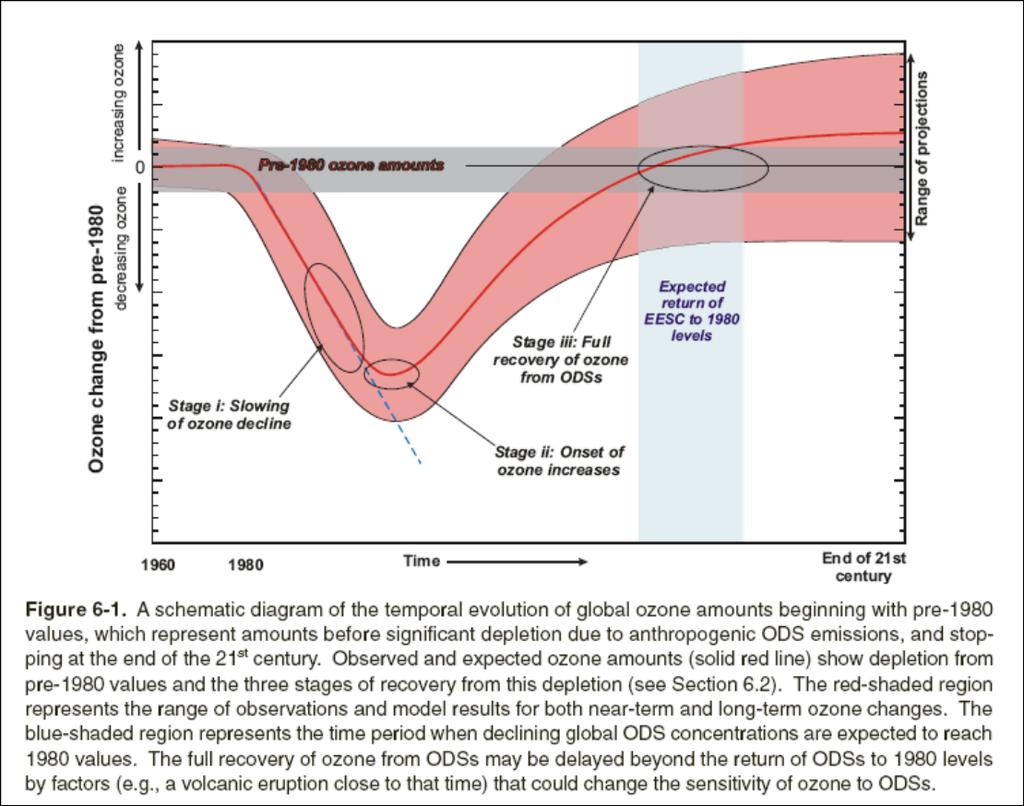
44 Measurements plus Projections 44

45 45
46 Trends and Predictions Note the large dip in the early 1990 s this led to overly high projections of ozone loss until the 1998 assessment. The extra loss is thought to be due to the effects of the Pinatubo volcano. Recovery (timing and magnitude) depends on emissions scenarios. 46
47 Linkage of Ozone and UV Radiation Less ozone means more UV at the Earth s surface. Analysis of this trend is also very important. Effect is not linear, but for small changes in the ozone column it can be approximated as linear. 47
48 Relation between ozone and UV changes Dependence of erythemal ultraviolet (UV) radiation at the Earth's surface on atmospheric ozone, measured on cloud-free days at various locations, at fixed solar zenith angles. Legend: South Pole (Booth and Madronich, 1994); Mauna Loa, Hawaii (Bodhaine et al., 1997); Lauder, New Zealand (McKenzie et al., 1998); Thessaloniki, Greece (updated from Zerefos et al., 1997); Garmisch, Germany (Mayer et al., 1997); and Toronto, Canada (updated from Fioletov et al., 1997). Solid curve shows model prediction with a power rule using RAF =
49 Radiation Amplification Factor (RAF) Radiation Amplification Factor (RAF) is defined as the percentage increase in UV bio that would result from a 1% decrease in the column amount of atmospheric ozone. The radiation amplification factors are given in for a number of different known effects. The RAFs can generally be used only to estimate effects of small ozone changes, e.g. of a few percent, because the relationship between ozone and UV bio becomes non-linear for larger ozone changes. 49
50 Trends in biologically active UV from TOMS ( ) - increasing. Latitude band - degrees Trend (a) - % per decade Uncertainty (b) ±2 sigma 70 S 60 S S 50 S S 40 S S 30 S S 20 S S 10 S S N N 20 N N 30 N N 40 N N 50 N N 60 N N 70 N Trends in biologically active radiation (weighted with the erythemal action spectrum of McKinlay and Diffey, 1987), derived from total ozone and cloud reflectivity measurements from the Total Ozone Mapping Spectrometer (TOMS, version 7) over Adapted from Herman et al. (1996). (a) Zonally averaged trend over given latitude band, values rounded to nearest half percent. (b) As corrected by Herman et al. (1998) and includes combined instrumental error and variability of 50 UV radiances.
51 51
52 52
53 Also from Ozone Assessment Ground-based UV reconstructions and satellite UV retrievals, supported in the later years by direct ground-based UV measurements, show that erythemal ("sunburning") irradiance over midlatitudes has increased since the late 1970s, in qualitative agreement with the observed decrease in column ozone. The increase in satellite-derived erythemal irradiance over midlatitudes during is statistically significant, while there are no significant changes in the tropics. Satellite estimates of UV are difficult to interpret over the polar regions. In the Antarctic, large ozone losses produce a clear increase in surface UV radiation. Ground-based measurements show that the average spring erythemal irradiance for is up to 85% greater than the modeled irradiance for , depending on site. The Antarctic spring erythemal irradiance is approximately twice that measured in the Arctic for the same season. Clear-sky UV observations from unpolluted sites in midlatitudes show that since the late 1990s, UV irradiance levels have been approximately constant, consistent with ozone column observations over this period. Surface UV levels and trends have also been significantly influenced by clouds and aerosols, in addition to stratospheric ozone. Daily measurements under all atmospheric conditions at sites in Europe and Japan show that erythemal irradiance has continued to increase in recent years due to net reductions in the effects of clouds and aerosols. In contrast, in southern midlatitudes, zonal and annual average erythemal irradiance increases due to ozone decreases since 1979 have been offset by almost a half due to net increases in the effects of clouds and aerosols. 53
54 Chemical Models of the Stratosphere Concepts of atmospheric models (as applied to the lower atmosphere) are presented in Chapter 25 Models needed for understanding past and present; and for predicting future outcomes. Future outcomes depend on emission scenarios. Source gas emissions for the stratosphere are better understood than those for the troposphere. 54
55 Models (cont.) Models include 1. Reaction Rate Coefficients 2. Photolysis Rate Coefficients (these vary with solar flux, i.e., SZA, ozone, aerosol, albedo) 3. Initial conditions for species and meteorological quantities (p, T, [species], ) 4. Met forecast model or parameterization of transport (including fluxes of source gases to the stratosphere) 5. Treatment of heterogeneous chemistry and physics Types of calculations 1. Steady-State Calculation: Fixed inputs, run until stable outputs 2. Prognostic Calculation: Estimate changes in inputs (chemical, solar, transport) and run model to predict or project possible outcomes 55
56 Types of Models 0-D or box model: only variable is time 1-D model: Vary time and altitude (vertical transport is estimated using eddy diffusion ) 2-D model: vary time, altitude, and latitude (transport estimated with 2x2 matrix of transport coefficients) 3-D model: becoming more common, but resolution is quite coarse in many cases, and requires greater computer resources. Usually coupled with met model. 56
57 Ozone Depletion Potential Start with an Ozone Depletion Model Reference Species is CFCl 3 (CFC-11 or Freon 11). All other ozone depleting species (mostly chlorine and bromine containing compounds) are compared to CFC-11. Properties of CFC-11 (CFCl 3 ): 3 Cl atoms per molecule Unreactive in troposphere, so it is (eventually) transported to the stratosphere, where its lifetime with respect to photolysis is ~45 years It is photolyzed in the stratosphere to yield Cl atoms Chlorine catalyzed ozone destruction occurs in polar regions and in midlatitudes (different mechanisms) 57
58 Ozone Depletion Potential (cont.) BY DEFINITION ODP OF CFC-11 = 1. The ODP is a property of the species. All other species ODP s are referenced to the ODP of CFC-11. Consider HCFC-22 HCFC-22 = CHF 2 Cl (= X in our example) Properties of HCFC-22: 1 Cl atom per molecule Reacts slowly in the troposphere (chemical lifetime ~12 years) If it penetrates into the stratosphere, it can be photolyzed to release Cl and destroy O 3. 58
59 Methods of Calculating ODP Better (but computationally more difficult) method 1. Find the emission rate of CFC-11 (kg/yr) that results in a 1% O 3 depletion. Call this emission rate A. 2. Find the emission rate of compound X (kg/yr) that results in a 1% O 3 depletion. Call this emission rate B. 3. ODP of X = A/B. More practical (but less rigorous) method 1. Calculate ΔO 3 per unit mass emission rate of CFC- 11. Call this ΔO 3 A. 2. Calculate ΔO 3 per unit mass emission rate of compound X. Call this ΔO 3 B. 3. ODP of X = B /A. 59
60 GLOBALLY AVERAGED ODP Ozone Depletion Potential ODP = ΔO ΔO z z Θ Θ t t 3 3 ( z, Θ, t) ( z, Θ, t) for X for CFC 11 cosθ cosθ z = altitude, Θ = latitude, t = time ΔO 3 = change in O 3 at steady state (per unit mass emission rate) Examples of global ODP s HCFC -22 ODP = HCFC-142b (CH 3 CF 2 Cl) ODP = CH 3 CCl 3 ODP = 0.13 CF 3 Br (H-3101) ODP = NOTE: Local ODP s vary greatly (e.g. Polar Spring) 60
61 Trends of Controlled Ozone Depleting Chemicals 61
62 EECl = Effective Equivalent Chlorine (as Cl 2 ) 62

63 The factor of two difference in the scale on this slide compared to the last one comes about because Cl 2 contains two Cl atoms. 63
 ATM 507 Lecture 9 Text reading Section 5.7 Problem Set # 2 due Sept. 30 Next Class Tuesday, Sept. 30 Today s topics Polar Stratospheric Chemistry and the Ozone Hole, Required reading: 20 Questions and
ClO + O -> Cl + O 2 Net: O 3 + O -> O 2 + O 2
 Lecture 36. Stratospheric ozone chemistry. Part2: Threats against ozone. Objectives: 1. Chlorine chemistry. 2. Volcanic stratospheric aerosols. 3. Polar stratospheric clouds (PSCs). Readings: Turco: p.
Measurements of Ozone. Why is Ozone Important?
 Anthropogenic Climate Changes CO 2 CFC CH 4 Human production of freons (CFCs) Ozone Hole Depletion Human production of CO2 and CH4 Global Warming Human change of land use Deforestation (from Earth s Climate:
Atmospheric Chemistry III
 Atmospheric Chemistry III Chapman chemistry, catalytic cycles: reminder Source of catalysts, transport to stratosphere: reminder Effect of major (O 2 ) and minor (N 2 O, CH 4 ) biogenic gases on [O 3 ]:
Chapman. 4. O + O 3 2 O 2 ; k 4 5. NO + O 3 NO 2 + O 2 ; k 5 6. NO 2 + O NO + O 2 ; k 6 7. NO 2 + hν NO + O; k 7. NO X Catalytic.
 ATM 507 Lecture 8 Text reading Section 5.7 Problem Set # 2 due Sept. 30 Note: next week class as usual Tuesday, no class on Thursday Today s topics Mid-latitude Stratosphere Lower Stratosphere 1 Let s
ATOC 3500/CHEM 3151 Week 9, 2016 The Game Changer. Some perspective The British Antarctic Survey The Ozone Hole International Regulations
 ATOC 3500/CHEM 3151 Week 9, 2016 The Game Changer Some perspective The British Antarctic Survey The Ozone Hole International Regulations Rowland (1974): The work is going very well, but it may mean the
2. Sketch a plot of R vs. z. Comment on the shape. Explain physically why R(z) has a maximum in the atmospheric column.
 has a maximum in the atmospheric column.") 190 PROBLEMS 10. 1 Shape of the ozone layer Consider a beam of solar radiation of wavelength λ propagating downward in the vertical direction with an actinic flux I at the top of the atmosphere. Assume
190 PROBLEMS 10. 1 Shape of the ozone layer Consider a beam of solar radiation of wavelength λ propagating downward in the vertical direction with an actinic flux I at the top of the atmosphere. Assume
Chemistry 471/671. Atmospheric Chemistry III: Stratospheric Ozone Depletion
 Chemistry 471/671 Atmospheric Chemistry III: Stratospheric Ozone Depletion 2 The Chapman Mechanism O 2 + hn 2 O( 1 D) O( 1 D) + O 2 + M O 3 + M Exothermic O( 1 D) + O 3 2 O 2 O 3 + hn O( 1 D) + O 2 ( 1
Global Warming and Climate Change Part I: Ozone Depletion
 GCOE-ARS : November 18, 2010 Global Warming and Climate Change Part I: Ozone Depletion YODEN Shigeo Department of Geophysics, Kyoto University 1. Stratospheric Ozone and History of the Earth 2. Observations
Stratospheric O 3 : Overview
 Stratospheric Chemistry READING: Chapter 10 of text Mid-latitude Ozone Chemistry (and depletion) Polar Ozone Destruction (the Ozone Hole) Stratospheric O 3 : Overview Most O 3 (90%) in stratosphere. Remaining
Topic # 13 (cont.) OZONE DEPLETION IN THE STRATOSPHERE Part II
 OZONE DEPLETION IN THE STRATOSPHERE Part II") Topic # 13 (cont.) OZONE DEPLETION IN THE STRATOSPHERE Part II A Story of Anthropogenic Disruption of a Natural Steady State p 77-79 in Class Notes THE DESTRUCTION OF STRATOSPHERIC OZONE The ozone hole
Topic # 13 (cont.) OZONE DEPLETION IN THE STRATOSPHERE Part II A Story of Anthropogenic Disruption of a Natural Steady State p 77-79 in Class Notes THE DESTRUCTION OF STRATOSPHERIC OZONE The ozone hole
NATS 101 Section 13: Lecture 31. Air Pollution Part II
 NATS 101 Section 13: Lecture 31 Air Pollution Part II Last time we talked mainly about two types of smog:. 1. London-type smog 2. L.A.-type smog or photochemical smog What are the necessary ingredients
Lecture 15 Antarctic Ozone Hole ATOC/CHEM 5151
 Lecture 15 Antarctic Ozone Hole ATOC/CHEM 5151 1 Ozone Hole Theories 1. Solar activity: During periods of high solar activity, energetic particles are deposited high in the atmosphere, creating NOx. Perhaps
Measured Ozone Depletion
 Measured Ozone Depletion Global Ozone After carefully accounting for all of the known natural variations, a net decrease of about 3% per decade for the period 1978-1991 was found. This is a global average
warmest (coldest) temperatures at summer heat dispersed upward by vertical motion Prof. Jin-Yi Yu ESS200A heated by solar radiation at the base
 temperatures at summer heat dispersed upward by vertical motion Prof. Jin-Yi Yu ESS200A heated by solar radiation at the base") Pole Eq Lecture 3: ATMOSPHERE (Outline) JS JP Hadley Cell Ferrel Cell Polar Cell (driven by eddies) L H L H Basic Structures and Dynamics General Circulation in the Troposphere General Circulation in the
Pole Eq Lecture 3: ATMOSPHERE (Outline) JS JP Hadley Cell Ferrel Cell Polar Cell (driven by eddies) L H L H Basic Structures and Dynamics General Circulation in the Troposphere General Circulation in the
SCIAMACHY book. Ozone variability and long-term changes Michel Van Roozendael, BIRA-IASB
 SCIAMACHY book Ozone variability and long-term changes Michel Van Roozendael, BIRA-IASB 1928: start of CFC production 1971: 1 st observation of CFC in the atmosphere (J. Lovelock) 1974: identification
CHEM/ENVS 380 S14, Midterm Exam ANSWERS 1 Apr 2014
 PART- A. Multiple Choice Questions (5 points each): Each question may have more than one correct answer. You must select ALL correct answers, and correct answers only, to receive full credit. 1. Which
OZONE AND ULTRAVIOLET RADIATION
 OZONE AND ULTRAVIOLET RADIATION Alfio Parisi, Michael Kimlin Imagine if the earth s protective atmosphere did not exist and the earth was subjected to the harmful ultraviolet energy from the sun. Life
). It is a gas produced naturally in the stratosphere where it strongly absorbs incoming
. It is a gas produced naturally in the stratosphere where it strongly absorbs incoming") Page 1 of 6 What Determines How Much Ultraviolet Radiation Reaches the Earth s Surface? The amount of UV radiation reaching the Earth s surface varies widely around the globe and through time. Several
Page 1 of 6 What Determines How Much Ultraviolet Radiation Reaches the Earth s Surface? The amount of UV radiation reaching the Earth s surface varies widely around the globe and through time. Several
Understanding the Relation between V PSC and Arctic Ozone Loss
 Understanding the Relation between V PSC and Arctic Ozone Loss Neil Harris European Ozone Research Coordinating Unit Department of Chemistry, University of Cambridge Ralph Lehmann, Markus Rex, Peter von
Stratospheric Ozone: An Online Learning Module
 Stratospheric Ozone: An Online Learning Module Using your favorite browser open Ozone/index.htm or go to http://cs.clark.edu/~mac/geol390/stratosphericozone/startozoneactivity.html Work through the web
SUSTAINABILITY MATTERS FACT SHEET 7: THE HOLE IN THE OZONE LAYER
 SUSTAINABILITY MATTERS FACT SHEET 7: THE HOLE IN THE OZONE LAYER What is the ozone layer? Ozone is an allotrope of oxygen, which means it is a pure element, but has a different chemical structure to that
Tananyag fejlesztés idegen nyelven
 Tananyag fejlesztés idegen nyelven Prevention of the atmosphere KÖRNYEZETGAZDÁLKODÁSI AGRÁRMÉRNÖKI MSC (MSc IN AGRO-ENVIRONMENTAL STUDIES) Fundamentals to atmospheric chemical reactions. The stratospheric
CREATE Summer School. Tim Canty
 CREATE Summer School Tim Canty Understanding Halogens in the Arctic Today: Will focus on chlorine and bromine How lab studies affect our view of ozone loss Using observations and models to probe the atmosphere
Environmental Science Chapter 13 Atmosphere and Climate Change Review
 Environmental Science Chapter 13 Atmosphere and Climate Change Review Multiple Choice Identify the choice that best completes the statement or answers the question. 1. Climate in a region is a. the long-term,
Simulation of Polar Ozone Depletion: An Update
 Simulation of Polar Ozone Depletion: An Update Image taken from www.zmescience.com D. Kinnison (NCAR), S. Solomon (MIT), and J. Bandoro (MIT) February 17, 2015 WACCM Working Group Meeting, Boulder Co.
10. Stratospheric chemistry. Daniel J. Jacob, Atmospheric Chemistry, Harvard University, Spring 2017
 10. Stratospheric chemistry Daniel J. Jacob, Atmospheric Chemistry, Harvard University, Spring 2017 The ozone layer Dobson unit: physical thickness (0.01 mm) of ozone layer if compressed to 1 atm, 0 o
Volcanoes drive climate variability by
 Volcanoes drive climate variability by 1. emitting ozone weeks before eruptions, 2. forming lower stratospheric aerosols that cool Earth, 3. causing sustained ozone depletion, surface warming, and lower
Chapman Cycle. The cycle describes reactions of O 2 and O 3 in stratosphere
 Chapman Cycle The cycle describes reactions of O 2 and O 3 in stratosphere Even though reactions are happening, the concentration of O 3 remains constant This is an example of a dynamic equilibrium or
STRATOSPHERIC OZONE DEPLETION. Adapted from K. Sturges at MBHS
 STRATOSPHERIC OZONE DEPLETION Adapted from K. Sturges at MBHS Ozone Layer Ozone is Good up high Stratosphere Bad nearby Troposphere Solar Radiation - range of electromagnetic waves UV shortest we see if
Stratospheric Chemistry: Polar Ozone Depletion AOSC 433/633 & CHEM 433. Ross Salawitch
 Stratospheric Chemistry: Polar Ozone Depletion AOSC 433/633 & CHEM 433 Ross Salawitch Class Web Site: http://www.atmos.umd.edu/~rjs/class/spr2017 Today: Processes that govern the formation of the Antarctic
1. The frequency of an electromagnetic wave is proportional to its wavelength. a. directly *b. inversely
 CHAPTER 3 SOLAR AND TERRESTRIAL RADIATION MULTIPLE CHOICE QUESTIONS 1. The frequency of an electromagnetic wave is proportional to its wavelength. a. directly *b. inversely 2. is the distance between successive
Environment Canada:
 2010 2011 Polar Stratospheric t Ozone David W. Tarasick, Air Quality Research Division : http://exp-studies.tor.ec.gc.ca/ tor ec ca/ 2014 Connaught Summer School in Arctic Science, July 14 18, 18, 2014-1
Stratospheric Chemistry: Polar Ozone Depletion AOSC 433/633 & CHEM 433/633. Ross Salawitch
 Stratospheric Chemistry: Polar Ozone Depletion AOSC 433/633 & CHEM 433/633 Ross Salawitch Class Web Site: http://www.atmos.umd.edu/~rjs/class/spr2013 Today: Processes that govern the formation of the Antarctic
Stratospheric Chemistry and Processes. Sophie Godin-Beekmann LATMOS, OVSQ, IPSL
 Stratospheric Chemistry and Processes Sophie Godin-Beekmann LATMOS, OVSQ, IPSL 1 The Stratosphere Layer just above the troposphere Altitude depends on latitude and season (higher in the tropics and summer)
Stratospheric Chemistry
 Stratospheric Chemistry Stratospheric Chemistry Why Ozone? Part of global energy balance determines T and hence u. Protection of the biosphere from UV. Sensitive to human pollution. Search for extraterrestrial
Stratosphere and Ozone
 Stratosphere and Ozone Ozone (Greek, ozein, to smell) O 3 Chapman Mechanism O 2 + hv O + O O + O 3 2O 2 O 3 + hv O 2 + O O + O 2 + M O 3 + M third-body. anything What units are used to report the amount
FORCING ANTHROPOGENIC
 NATURAL CLIMATIC FORCING Earth-Sun orbital relationships, changing landsea distribution (due to plate tectonics), solar variability & VOLCANIC ERUPTIONS vs. ANTHROPOGENIC FORCING Human-Enhanced GH Effect,
Chapter 7. Stratospheric Chemistry.
 Chapter 7. Stratospheric Chemistry. Stratospheric chemistry became environmental chemistry in the early 1970 s when scientists studied the potential stratospheric effects of supersonic aircraft (Crutzen,
PROBLEMS Sources of CO Sources of tropospheric ozone
 220 PROBLEMS 11. 1 Sources of CO The two principal sources of CO to the atmosphere are oxidation of CH 4 and combustion. Mean rate constants for oxidation of CH 4 and CO by OH in the troposphere are k
Supporting Online Material for
 www.sciencemag.org/cgi/content/full/1153966/dc1 Supporting Online Material for The Sensitivity of Polar Ozone Depletion to Proposed Geoengineering Schemes Simone Tilmes,* Rolf Müller, Ross Salawitch *To
CHAPTER 10. STRATOSPHERIC OZONE
 The stratospheric ozone layer, centered at about 20 km above the surface of the Earth ( Figure 10-1 ), protects life on Earth by absorbing UV radiation from the Sun. In this chapter we examine the mechanisms
Simulated Radiances for OMI
 Simulated Radiances for OMI document: KNMI-OMI-2000-004 version: 1.0 date: 11 February 2000 author: J.P. Veefkind approved: G.H.J. van den Oord checked: J. de Haan Index 0. Abstract 1. Introduction 2.
WACCM: The High-Top Model
 WACCM: The High-Top Model WACCM top Michael Mills CAM top WACCM Liaison mmills@ucar.edu (303) 497-1425 http://bb.cgd.ucar.edu/ 40 km Ozone Layer Jarvis, Bridging the Atmospheric Divide, Science, 293, 2218,
What is a Sudden Stratospheric Warming?
 What is a Sudden Stratospheric Warming? rapid increase of T at h~32 km from Evelyn De Wachter (PhD thesis, IAP-Bern):!"#$%&'()*+,-*../0** DA /%:,'$,&?/.%0.$ 34$ N3&%8$ 9.%&$ 1.9:./%1/.$ 34$ 93/.$ 17%&$
Simulation of Polar Ozone Depletion in SD-WACCM4 / MERRA
 Simulation of Polar Ozone Depletion in SD-WACCM4 / MERRA D. Kinnison (NCAR), S. Solomon (MIT), J. Bandoro (MIT), and R. Garcia (NCAR) June 16, 2015 WACCM Working Group Meeting, Baltimore MD. Image courtesy
Chapter 10 Planetary Atmospheres: Earth and the Other Terrestrial Worlds. What is an atmosphere? About 10 km thick
 Chapter 10 Planetary Atmospheres: Earth and the Other Terrestrial Worlds What is an atmosphere? Sources of Gas Losses of Gas Thermal Escape Earth s Atmosphere About 10 km thick Consists mostly of molecular
(Figure 2) Science coursework
 Science coursework") Dobson was a scientist that devoted most of his life to the observation of the atmospheric ozone. The results of his devotion to the study of the atmospheric led to a great understanding of the structure
Dobson was a scientist that devoted most of his life to the observation of the atmospheric ozone. The results of his devotion to the study of the atmospheric led to a great understanding of the structure
ATOC 3500/CHEM 3151 Air Pollution Chemistry Lecture 1
 ATOC 3500/CHEM 3151 Air Pollution Chemistry Lecture 1 Note Page numbers refer to Daniel Jacob s online textbook: http://acmg.seas.harvard.edu/publications/ jacobbook/index.html Atmos = vapor + sphaira
Chapter 11 Lecture Outline. Heating the Atmosphere
 Chapter 11 Lecture Outline Heating the Atmosphere They are still here! Focus on the Atmosphere Weather Occurs over a short period of time Constantly changing Climate Averaged over a long period of time
An assessment of changing ozone loss rates at South Pole: Twenty five years of ozonesonde measurements
 JOURNAL OF GEOPHYSICAL RESEARCH, VOL. 116,, doi:10.1029/2011jd016353, 2011 An assessment of changing ozone loss rates at South Pole: Twenty five years of ozonesonde measurements B. Hassler, 1,2 J. S. Daniel,
Global Atmospheric Circulation
 Global Atmospheric Circulation Polar Climatology & Climate Variability Lecture 11 Nov. 22, 2010 Global Atmospheric Circulation Global Atmospheric Circulation Global Atmospheric Circulation The Polar Vortex
Ozone Depletion. Dana Desonie, Ph.D. Say Thanks to the Authors Click (No sign in required)
") Ozone Depletion Dana Desonie, Ph.D. Say Thanks to the Authors Click http://www.ck12.org/saythanks (No sign in required) To access a customizable version of this book, as well as other interactive content,
Ozone Depletion Dana Desonie, Ph.D. Say Thanks to the Authors Click http://www.ck12.org/saythanks (No sign in required) To access a customizable version of this book, as well as other interactive content,
Evolution of inorganic chlorine partitioning in the Arctic polar vortex
 JOURNAL OF GEOPHYSICAL RESEARCH, VOL. 111,, doi:10.1029/2005jd006951, 2006 Evolution of inorganic chlorine partitioning in the Arctic polar vortex D. M. Wilmouth, 1 R. M. Stimpfle, 1 J. G. Anderson, 1
An Interpretation of Natural Healing of Ozone Holes
 ISSN 2278 0211 (Online) An Interpretation of Natural Healing of Ozone Holes Vasudevan Tachoth Nirvan Industries, Private Industrial Estate, Post Sidco Near Railway Gate, Kuruchi Coimbatore, India Abstract:
Class: Chemistry Topic:_atomic structure & ozone layer
 Class: Chemistry Topic:_atomic structure & ozone layer Directions: Please read both articles and write a 5 paragraph comparative essay on each. You should include examples provided in the articles to prove
Extremely cold and persistent stratospheric Arctic vortex in the winter of
 Article Atmospheric Science September 2013 Vol.58 No.25: 3155 3160 doi: 10.1007/s11434-013-5945-5 Extremely cold and persistent stratospheric Arctic vortex in the winter of 2010 2011 HU YongYun 1* & XIA
On Cosmic-Ray-Driven Electron Reaction Mechanism for Ozone Hole and Chlorofluorocarbon Mechanism for Global Climate Change
 On Cosmic-Ray-Driven Electron Reaction Mechanism for Ozone Hole and Chlorofluorocarbon Mechanism for Global Climate Change Qing-Bin Lu Department of Physics and Astronomy, University of Waterloo, Waterloo,
Chapter 10 Planetary Atmospheres: Earth and the Other Terrestrial Worlds. What is an atmosphere? Earth s Atmosphere. Atmospheric Pressure
 Chapter 10 Planetary Atmospheres: Earth and the Other Terrestrial Worlds 10.1 Atmospheric Basics Our goals for learning What is an atmosphere? How does the greenhouse effect warm a planet? Why do atmospheric
Chapter 10 Planetary Atmospheres: Earth and the Other Terrestrial Worlds
 Chapter 10 Planetary Atmospheres: Earth and the Other Terrestrial Worlds 10.1 Atmospheric Basics Our goals for learning What is an atmosphere? How does the greenhouse effect warm a planet? Why do atmospheric
CLIMATE AND CLIMATE CHANGE MIDTERM EXAM ATM S 211 FEB 9TH 2012 V1
 CLIMATE AND CLIMATE CHANGE MIDTERM EXAM ATM S 211 FEB 9TH 2012 V1 Name: Student ID: Please answer the following questions on your Scantron Multiple Choice [1 point each] (1) The gases that contribute to
Chemical Change in the Arctic Vortex During AASE II
 Chemical Change in the Arctic Vortex During AASE II Wesley A. Traub, Kenneth W. Jucks, David G. Johnson, and Kelly V. Chance Smithsonian Astrophysical Observatory, Cambridge, Massachusetts Abstract We
Chapter 10 Planetary Atmospheres Earth and the Other Terrestrial Worlds
 Chapter 10 Planetary Atmospheres Earth and the Other Terrestrial Worlds 10.1 Atmospheric Basics Our goals for learning: What is an atmosphere? How does the greenhouse effect warm a planet? Why do atmospheric
Chapter 2 Protecting the Ozone Layer. The Ozone Hole
 Today (Tues 2/24) Newspaper Articles: Ciara Rodwell and Melissa Regan Intro to Ozone, Ozone Hole, & Chapter 2 Light, matter, and human health! Laboratory: Experiment 4 You design investigation Start Ozone
Table of Contents. Chapter: Atmosphere. Section 1: Earth's Atmosphere. Section 2: Energy Transfer in the Atmosphere. Section 3: Air Movement
 Table of Contents Chapter: Atmosphere Section 1: Earth's Atmosphere Section 2: Energy Transfer in the Atmosphere Section 3: Air Movement Table of Contents Chapter 4: Atmosphere Section 1: Earth's Atmosphere
Chapter outline. Reference 12/13/2016
 Chapter 2. observation CC EST 5103 Climate Change Science Rezaul Karim Environmental Science & Technology Jessore University of science & Technology Chapter outline Temperature in the instrumental record
Winter. Here s what a weak La Nina usually brings to the nation with tempseraures:
 2017-2018 Winter Time again for my annual Winter Weather Outlook. Here's just a small part of the items I considered this year and how I think they will play out with our winter of 2017-2018. El Nino /
Where is the ozone layer? Global ozone column abundance
 Where is the ozone layer? Altitude (km) 85 10 0 Thermosphere 20-30km Mesosphere Stratosphere Troposphere 100 200 300 Temperature (K) Mesopause Stratopause Tropopause Global ozone column abundance WMO,
Answer Key for Practice Test #2
 Answer Key for Practice Test #2 Section 1. Multiple-choice questions. Choose the one alternative that best completes the statement or answers the question. Mark your choice on the optical scan sheet. 1.
Recent Climate History - The Instrumental Era.
 2002 Recent Climate History - The Instrumental Era. Figure 1. Reconstructed surface temperature record. Strong warming in the first and late part of the century. El Ninos and major volcanic eruptions are
Table of Contents. Chapter: Atmosphere. Section 1: Earth's Atmosphere. Section 2: Energy Transfer in the Atmosphere. Section 3: Air Movement
 Table of Contents Chapter: Atmosphere Section 1: Earth's Atmosphere Section 2: Energy Transfer in the Atmosphere Section 3: Air Movement 1 Earth s Atmosphere Importance of the Atmosphere Earth's atmosphere
Chapter 10 Planetary Atmospheres Earth and the Other Terrestrial Worlds
 Chapter 10 Planetary Atmospheres Earth and the Other Terrestrial Worlds What is an atmosphere? 10.1 Atmospheric Basics Our goals for learning:! What is an atmosphere?! How does the greenhouse effect warm
Major climate change triggers
 Major climate change triggers Variations in solar output Milankovitch cycles Elevation & distribution of continents Ocean interactions Atmospheric composition change (CO 2 and other volcanic gasses) Biological
Emission Limb sounders (MIPAS)
") Emission Limb sounders (MIPAS) Bruno Carli ENVISAT ATMOSPHERIC PACKAGE MIPAS Michelson Interferometric Passive Atmospheric Sounder GOMOS Global Ozone Monitoring by Occultation of Stars SCIAMACHY Scanning
Emission Limb sounders (MIPAS) Bruno Carli ENVISAT ATMOSPHERIC PACKAGE MIPAS Michelson Interferometric Passive Atmospheric Sounder GOMOS Global Ozone Monitoring by Occultation of Stars SCIAMACHY Scanning
surrounds Earth and protects it somewhat from solar radiation. Like all other matter, air has weight,
 The air that we breathe comes from the atmosphere, a thin gaseous layer that surrounds Earth and protects it somewhat from solar radiation. Like all other matter, air has weight, but this weight varies
Stratospheric Chemistry Part 1 (Chapter 4, p , , , )
") Stratospheric Chemistry Part 1 (Chapter 4, p 155-169, 174-176, 198-222, 231-238) zone Discovery and History The Stratosphere and circulation Chapman Chemistry Catalysts The Controversy The zone Hole International
Stratospheric Chemistry Part 1 (Chapter 4, p 155-169, 174-176, 198-222, 231-238) zone Discovery and History The Stratosphere and circulation Chapman Chemistry Catalysts The Controversy The zone Hole International
Impact of wind changes in the upper troposphere lower stratosphere on tropical ozone
 Impact of wind changes in the upper troposphere lower stratosphere on tropical ozone Martin Dameris Deutsches Zentrum für Luft- und Raumfahrt (DLR) Institut für Physik der Atmosphäre, Oberpfaffenhofen
Is the ozone layer recovering? Johannes Staehelin
 Is the ozone layer recovering? Johannes Staehelin Institute for Atmospheric and Climate Science (IACETH), Swiss Federal Institute of Technology Zürich (ETHZ) Universitätstrasse 16 CH-8092 Zürich, Switzerland
2. Fargo, North Dakota receives more snow than Charleston, South Carolina.
 2015 National Tournament Division B Meteorology Section 1: Weather versus Climate Chose the answer that best answers the question 1. The sky is partly cloudy this morning in Lincoln, Nebraska. 2. Fargo,
WACCM: The High-Top Model
 WACCM: The High-Top Model WACCM top Michael Mills CAM top WACCM Liaison mmills@ucar.edu (303) 497-1425 http://bb.cgd.ucar.edu/ 40 km Ozone Layer Jarvis, Bridging the Atmospheric Divide, Science, 293, 2218,
TIME SERIES COMPARISONS OF MIPAS LEVEL 2 NEAR REAL TIME PRODUCTS WITH CLIMATOLOGY
 TIME SERIES COMPARISONS OF MIPAS LEVEL 2 NEAR REAL TIME PRODUCTS WITH CLIMATOLOGY Vivienne Payne, Anu Dudhia, and Chiara Piccolo Atmospheric, Oceanic and Planetary Physics, Department of Physics, University
Outline. Chemical lifetime. Photochemistry. Ozone chemistry Chapman model Catalytic cycles Ozone hole. Institute of Applied Physics University of Bern
 Institute of Applied Physics University of Bern Outline Introduction Chemical reactions between stable molecules are quite slow in planetary s Absorption of solar UV-radiation leads to the production of
Enhanced UV radiation a new problem for the marine environment
 1 Enhanced UV radiation a new problem for the marine environment Robert F. Whitehead, Stephen J. de Mora* and Serge Demers 1.1 Introduction UV irradiance at the earth s surface is intimately related to
Chemistry of Ozone. Explain the following terms: resonance, resonance hybrid, delocalisation
 Chemistry of Ozone Ozone is triatomic oxygen, O 3. (Ozone is from the Greek ozein, to smell. ) It is a form of oxygen in which the atoms combine in threes, (correct IUPAC name: trioxygen, O 3 ), rather
Temperature. Vertical Thermal Structure. Earth s Climate System. Lecture 1: Introduction to the Climate System
 Lecture 1: Introduction to the Climate System T mass (& radiation) T & mass relation in vertical mass (& energy, weather..) Energy T vertical stability vertical motion thunderstorm What are included in
Chapter 10 Planetary Atmospheres Earth and the Other Terrestrial Worlds. What is an atmosphere? Planetary Atmospheres
 Chapter 10 Planetary Atmospheres Earth and the Other Terrestrial Worlds What is an atmosphere? Planetary Atmospheres Pressure Composition Greenhouse effect Atmospheric structure Color of the sky 1 Atmospheres
The Atmosphere. All of it. In one hour. Mikael Witte 10/27/2010
 The Atmosphere All of it. In one hour. Mikael Witte 10/27/2010 Outline Structure Dynamics - heat transport Composition Trace constituent compounds Some Atmospheric Processes Ozone destruction in stratosphere
Aura Microwave Limb Sounder (MLS) ozone profile data record characteristics, quality and applications
 ozone profile data record characteristics, quality and applications") Aura Microwave Limb Sounder (MLS) ozone profile data record characteristics, quality and applications A presentation for the 2016 meeting of the Committee on Earth Observation Satellites (COES) Atmospheric
Aura Microwave Limb Sounder (MLS) ozone profile data record characteristics, quality and applications A presentation for the 2016 meeting of the Committee on Earth Observation Satellites (COES) Atmospheric
Peter Bernath. Old Dominion University, Norfolk, VA and University of Waterloo, Waterloo, ON
 THE ATMOSPHERIC CHEMISTRY EXPERIMENT (ACE): Greenhouse Gas Measurements of CO 2, CFCs and HFCs Peter Bernath Old Dominion University, Norfolk, VA and University of Waterloo, Waterloo, ON ACE Satellite
What are Aerosols? Suspension of very small solid particles or liquid droplets Radii typically in the range of 10nm to
 What are Aerosols? Suspension of very small solid particles or liquid droplets Radii typically in the range of 10nm to 10µm Concentrations decrease exponentially with height N(z) = N(0)exp(-z/H) Long-lived
Chapter 2: Protecting the Ozone Layer
 Chapter 2: Protecting the Ozone Layer Student: 1. O2 and O3 molecules are A. allotropes. B. structural isomers. C. isotopes. D. geometrical isomers. 2. How many protons, neutrons, and electrons are there
Comparison of Results Between the Miniature FASat-Bravo Ozone Mapping Detector (OMAD) and NASA s Total Ozone Mapping Spectrometer (TOMS)
 and NASA s Total Ozone Mapping Spectrometer (TOMS)") Comparison of Results Between the Miniature FASat-Bravo Ozone Mapping Detector (OMAD) and NASA s Total Ozone Mapping Spectrometer (TOMS) Juan A. Fernandez-Saldivar, Craig I. Underwood Surrey Space Centre,
Comparison of Results Between the Miniature FASat-Bravo Ozone Mapping Detector (OMAD) and NASA s Total Ozone Mapping Spectrometer (TOMS) Juan A. Fernandez-Saldivar, Craig I. Underwood Surrey Space Centre,
Total ozone (Dobson units) Total ozone (Dobson units) 500
 Total ozone (Dobson units) 500") Representation of ozone in the ECMWF model A. Dethof and E. Hólm European Centre for Medium-Range Weather Forecasts 1 Introduction Ozone is fully integrated into the ECMWF forecast model and analysis system
Representation of ozone in the ECMWF model A. Dethof and E. Hólm European Centre for Medium-Range Weather Forecasts 1 Introduction Ozone is fully integrated into the ECMWF forecast model and analysis system
The Scientific Value of Stratospheric Wind Measurements
 Working Group on Space-based Lidar Winds, Monterey, 2008 The Scientific Value of Stratospheric Wind Measurements Ted Shepherd Department of Physics University of Toronto The distribution of ozone (important
Math 19a - Reading 8.1 outline for discussion section
 Math 9a - Reading 8. outline for discussion section due Monday, February 25, 28. How do you, guys, feel about vectors and matrices? Have you seen such things before? What did you think of the lecture on
Here s what a weak El Nino usually brings to the nation with temperatures:
 Time again for my annual Winter Weather Outlook. Here's just a small part of the items I considered this year and how I think they will play out with our winter of 2018-2019. El Nino / La Nina: When looking
Scientific Challenges of UV-B Forecasting
 Scientific Challenges of UV-B Forecasting Henning Staiger, German Meteorological Service (DWD) International activities and the UV Index UV Index definition and forecasting requirements Challenges in calculation
Attendance Sign-Up Sheet. A L: Light Yellow-Green. M Y: Bright Orange
 Attendance Sign-Up Sheet Last Name A L: Light Yellow-Green M Y: Bright Orange Lecture #02 January 13, 2010, Wednesday (1) Thickness of the atmosphere (2) Composition of the atmosphere (3) Thermodynamic
HEATING THE ATMOSPHERE
 HEATING THE ATMOSPHERE Earth and Sun 99.9% of Earth s heat comes from Sun But
Edinburgh Research Explorer
 Edinburgh Research Explorer Polar processing and development of the 2004 Antarctic ozone hole: First results from MLS on Aura Citation for published version: Santee, ML, Manney, GL, Livesey, NJ, Froidevaux,