Michael Yaffe Lecture #4 (((A,B)C)D) Database Searching & Molecular Phylogenetics A B C D B C D
|
|
|
- Melvyn Dennis
- 5 years ago
- Views:
Transcription
1 7.91 Lecture #4 Database Searching & Molecular Phylogenetics Michael Yaffe A B C D A B C D (((A,B)C)D)
2 Outline FASTA, Blast searching, Smith-Waterman Psi-Blast Review of enomic DNA structure Substitution patterns and mutation rates Synonymous and non-synonymous substitutions Jukes-Cantor Model Kimura s Two-Parameter Model Molecular Clocks Phylogenetic Trees rooted and unrooted Distance Matrix Methods Neighbor-Joining Method and Related Neighbor Methods Maximum Likelihood
3 Outline (cont) Parsimony Branch and Bound Heuristic Seaching Consensus Trees Software (PHYLIP, PAUP) The Tree of Life Reading: Mount, p , ,
4 Database Searching Problem is simple: I want to find homologues to my protein in the database How do I do it? Do the obvious compare my protein against every other protein in the database and look for local alignments by dynamic programming Uh Oh! 1 n For k sequences in the Database this becomes an O(mnk) problem! m essentially an O(mn) problem
5 Database Searching Still, this can be done - ~ 50x slower than Blast/FASTA, Smith-Waterman algorithm SSEARCH (ftp.virginia.edu/pub/fasta) do it locally! But in the old days, needed a faster method 2 approaches Blast, FASTA both heuristic (i.e. tried and true) almost always finds related Proteins but cannot guarantee optimal solution FASTA: Basic Idea 1- Search for matching sequence patterns or words Called k-tuples, which are exact matches of k characters between the two sequences i.e. RW = 2-tuple Seq 1: AHFYRWNKLCV Seq 2: DRWNLFCVATYWE
6 Database Searching FASTA: Basic Idea 2- Repeat for all possible k-tuples i.e. CV = 2-tuple Seq 1: AHFYRWNKLCV Seq 2: DRWNLFCVATYWE 3- Make a Hash Table (Hashing) that has the position of each k-tuple in each sequence i.e. 2-tuple pos. in Seq1 pos in Seq 2 Offset (pos1-pos2) RW CV AH
7 Database Searching Seq 1: AHFYRWNKLCV Seq 2: DRWNLFCVATYWE 3- Make a Hash Table (Hashing) that has the position of each k-tuple in each sequence i.e. 2-tuple pos. in Seq1 pos in Seq 2 Offset (pos1-pos2) RW CV AH Look for words (k-tuples) with same offset These are in-phase and reveal a region of alignment between the two sequences. 5- Build a local alignment based on these, extend it outwards Seq 1: AHFYRWNKLCV Seq 2: DRWNLFCVATYWE
8 Database Searching With hashing, number of comparisons is proportional To the average sequence length (i.e. an O(n) problem), Not an O(mn) problem as in dynamic programming. Proteins ktup = 1-2, Nucleotides, ktup=4-6 One big problem low complexity regions. Seq 1: AHFYPPPPPPPPFSER Seq 2: DVATPPPPPPPPPPPNLFK
9 Database Searching BLAST Same basic idea as FASTA, but faster and more sensitive! How? BLAST searches for common words or k-tuples, but limits the search for k-tuples that are most significant, by using the log-odds values in the Blosum62 amino acid substitution matrix i.e. look for WHK and might accept WHR but not HFK as a possible match (note 8000 possibilities) Repeat for all 3-tuples in the query Search the database for a match to the top 50 3-tuples that match the first query position in the sequence, the second query position, etc. Use any match to seed an ungapped alignment (old BLAST)
10 Database Searching Word length is fixed: 3-tuple for proteins 11-tuple for nucleotides By default, filters out low complexity regions. Determine if the alignment is statistically significant. calculates the probability of observing a score greater than or equal to your alignment based on extreme value distribution. Calculates an E-value = expectation value: This is the probability of finding an unrelated sequence that shows this good an alignment just by chance. Remember if p=.0001 and my database has 500,000 sequences, I will have an E=50! (normal starting E=10)
11
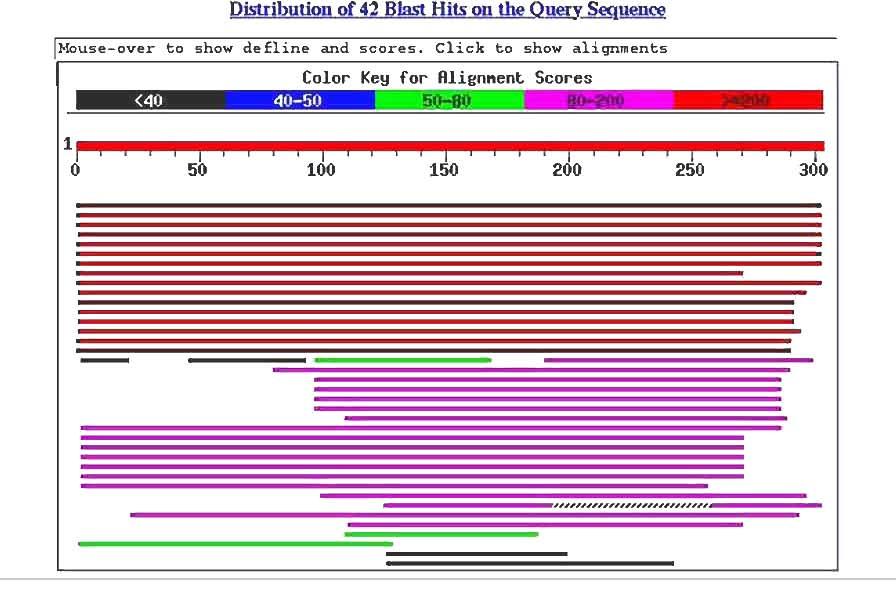
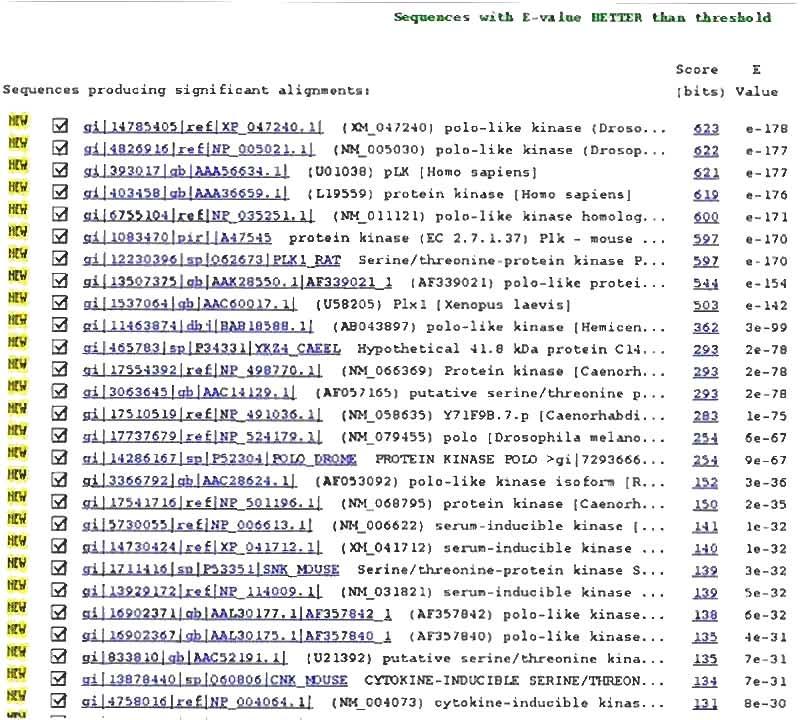
12 Psi-BLAST Position-specific iterative BLAST Combines BLAST searching with PSSMs! 1- Start with regular BLAST search look at the results
13
14 Psi-BLAST Position-specific iterative BLAST Combines BLAST searching with PSSMs! 1- Start with regular BLAST search look at the results 2- Pick the ones you believe are really homologous
15
16 Psi-BLAST Position-specific iterative BLAST Combines BLAST searching with PSSMs! 1- Start with regular BLAST search look at the results 2- Pick the ones you believe are really homologous 3- Now align these sequences to the query sequence and make up a PSSM that tells how much to weigh each amino acid in each position in the alignment 4- Use this PSSM to do another BLAST search 5- Add any new sequences that come up to the old ones if you believe they are really homologous 6- Repeat the alignment to make a new and improved PSSM that tells how much to weigh each amino acid in each position in the alignment

17
18 Psi-BLAST 7-- Use this PSSM to do another BLAST search 8 Keep iterating until no new sequences are found Very good for finding weakly related sequences on to Molecular Phylogenetics
19 ene Structure 5 Flank AU Flank exon intron Poly(A) addition splicing 3 UTR 5 UTR AU UA AAAAAAA
20 Mutation Rates Mutations: deleterious neutral advantageous substantial minority Consider 2 sequences K= # of substitutions since they shared a common ancestor T= divergence time R = mutation rate = K/(2T) KEY PREMISE OF PHYLOENETICS: If R=constant for all species, then K will provide insight into evolutionary relatedness for which no other physical evidence is available.
21 Mutation Rates Mutations: refined by process of natural selection Often, but not always at the protein level Functional constraint
22 5 Flank AU Flank exon intron 5 UTR AU Poly(A) addition splicing 3 UTR UA AAAAAAA Human, mouse, rabbit and cow beta-globin # Pairwise Substitution rate Length, bp s (mean) (subs/site x 10 9 years) Noncoding, overall Coding, overall Flank rapid 5 UTR 50 9 changes Intron UTR Flank 300 Common ancestor 100 million years ago generally true 3.04 functionally constrained
23 Synonymous vs Nonsynonymous Substitutions 18 out of 20 amino acids have more than one codon, C, U, A lycine C U A s here same aa synonymous substitution nonsynonymous substitution, C Alanine Human and rabbit beta-globin genes: 47 substitutions in coding sequence 27 synonymous substitutions 20 nonsynonymous substitutions but 3x as many opportunities!
24 Synonymous vs Nonsynonymous Substitutions Not all positions in a codon equally likely to give non-synonymous substitutions C U A For ly, 4-fold degenerate AU AC AA A Asp lu 2-fold degenerate UUU CUU AUU UU Phe Leu Ile Val Non-degenerate
25 Synonymous vs Nonsynonymous Substitutions If natural selection operates at protein level, expect nucleotide substitutions appear most rapidly at 4-fold sites and least rapidly at non-degenerate sites What does data show? Human vs rabbit beta-globin genes (coding region) Sub. Rate Region # sites (bp) #changes Subs/site.10 9 years Non-deg fold deg fold deg
26 Mutation versus Substitutions Mutation: changes in nucleotide sequences due to errors in DNA replication or repair Substitution: mutations that pass through the filter of natural selection Synonymous substitution rates, Ks, reflect actual mutation rate Non-synonymous substitution rates, Ka, do NOT reflect actual mutation rate, as subject to natural selection New alleles (versions of a gene) typically begin at low frequencies q = 1/(2N) where N=# of diploid reproducing organisms Why are there persistant high levels of variation in populations? Why not q 0, q 1? Most mutations are selectively neutral!
27 Estimating Substitution Numbers Infrequent substitutions between 2 sequences: Count em gives K More frequent substitutions counting will significantly UNDERestimate the number of true substitutions since they shared a common ancestor Why? Time Scenario 1 Scenario 2 T Sampling time
28 α Jukes-Cantor Model Assume each nucleotide equally likely α T to change into any other nt, α with rate of change=α. α α Overall rate of substitution = 3α A α C so if at t=0, at t=1, P (1) =1-3α and P (2) =(1-3α)P (1) +α [1 P (1) ] Expanding this gives P (t) =1/4 + (3/4)e -4αt Can show that this gives K = -3/4 ln[1-(4/3)(p)] K = true number of substitutions that have occurred, P = fraction of nt that differ by a simple count. Captures general behaviour
29 Compare J-C with real data assumption of global uniformity in α was unrealistic still provides a useful framework Nucleotides: two categories: purines: A, pyrimidines: C, T, U Exchange nucleotides within or between classes happens at different rates! Transitions: purine purine, pyrmidine pyrimidine three times as commmon as Transversions: purine pyrimidine or pyrimidine purine Led to Kimura s Two Parameter Model
30 Kimura s Two Parameter Model Transitions occur at rate α α A β β β β T C α Transversions occur at rate β Now P (1) = 1- α -2 β P (2) : 4 possibilities: Time Scenario 1 Scenario 2 Scenario 3 Scenario 4 A C T No 1 Transition 2Transversions
31 α A β β β β Kimura s Two Parameter Model T α Transitions occur at rate α Transversions occur at rate β P (1) = 1- α -2 β C P (2) : 4 possibilities: Time Scenario 1 Scenario 2 Scenario 3 Scenario 4 A C T No 1 Transition 2 Transversions P (2) = (1- α -2 β) P (1) + αp A(1) + βp C(1) + βp T(1) expanding P (t) = ¼ + (1/4)e -4βt + (1/2)e -2(α+β)t
32 α A β β β β Kimura s Two Parameter Model T C α Transitions occur at rate α Transversions occur at rate β expanding P (2) = (1- α -2 β) P (1) + αp A(1) + βp (1) + βp (1) P (t) = 1/4 + (1/4)e -4βt + (1/2)e -2(α+β)t Manipulating equation gives estimate of true number of substitutions if only two sequences are available, K = 1/2 ln[1/(1-2p-q)] + 1/4 ln[1/(1-2q)] Where K = true number of substitutions P = fraction of nts undergoing transitions by simple count Q = fraction of nts undergoing tranversions by simple count
33 δ A α ε φ β More complex Parameter Models Possible T γ C Could even make A C C A A δ α ε φ β λ T γ C Problem is sampling error not enough data to get ood parameters within a single gene family, usually Why not combine different genes?
34 Find strikingly different rates of evolution between different enes up to and greater than 200-fold. RATE DEPENDS ON FUNCTION! Histones each aa interacts with DNA slowest rate of substitution known HLA gene locus involved in immune system recognition of foreign antigens needs to adapt rapidly - one of the Highest substitution rates known However, rates of molecular evolution for loci with similar functional constraints often very uniform over long periods of evolutionary time.
35 Molecular Clocks 1960s: Emile Zuckerkandl and Linus Pauling Postulate: Substitution rates so constant within homologous proteins over long periods of evolutionary time that accumulation of amino acid changes reflects the steady ticking of a molecular clock. Clock may run at different rates for different proteins WAS CONTROVERSIAL # aa substitutions per 100 residues s mamma l Fibrinopeptides h 150 Hemoglobin Reptiles/fis Birds/reptile s mammals/re ptile s rey Carp/lamp n /i s e Vertebrat sects AS DIVERENCE TIMES NOT ACCURATELY KNOWN Cytochrome C Millions of years since divergence 1400
36 Relative Rate Test of Molecular Clock Hypothesis 1973: Sarich and Wilson Consider relative rate of substitution in lineage for species 1 and 2 Need to designate a less related species 3 as an outgroup i.e. 1=humans, 2=gorillas, 3= baboons Phylogenetic tree (more soon!) and 2 diverged from a common ancestor, A A Number of substitutions between any two species = sum of number of substitutions along branches of the tree that connect them
37 1 A 1 and 2 diverged from a common 2 3 ancestor, A Number of substitutions between Any two species = sum of number of Substitutions along branches of the tree That connect them d 13, d 23, d 12 can measure directly d 13 = d A1 + d A3 d 23 = d A2 + d A3 d 12 = d A1 + d A2 Algebra: d A1 = (d 12 + d 13 d 23 )/2 d A2 = (d 12 + d 23 d 13 )/2 Theorum 1 Molecular clock predicts d A1 =d A2 Find, for the most part, this is true, but not always, depending on species So bottom line when comparing two species need to prove Theorum 1 before using the molecular clock!
38 Distance-Based Phylogenetics Phylogenetic Trees also called dendrograms Made by arranging nodes and branches. raphical representation of evolutionary relatedness of 3 or more sequences Nodes distinct taxonomical unit Terminal nodes: gene or organism for which data has been collected Internal node inferred common ancestor that gave rise to 2 lineages D B A C For the mathematicians: Tree - special graph with n nodes, n-1 links, no circuits
39 Distance-Based Phylogenetics 1 D C 5 Newick notation (((1,2), (3,4)),5) B A Scaled trees Branch length is α difference between pairs of neighboring nodes. Ideally, scaled trees should be additive Unscaled trees Only convey relative kinship information without representing number of changes that separate sequences
40 Distance-Based Phylogenetics 1 D C 5 root B A Time Rooted trees Make an inference about common ancestor and direction of evolution. A single node is designated as common ancestor with unique path from it through evolutionary time to any other node. Root is assigned through use of an outgroup something that unambiguously separated earlier than species being considered.
41 Distance-Based Phylogenetics C D B A 5 3 Unrooted trees Only specifies relationship between nodes. Says nothing about the direction of evolution 4 Why not always use rooted trees?
42 Distance-Based Phylogenetics Why not always use rooted trees? 1 Need a clear outgroup 2 Computational difficulty Consider 3 sequences 1, 2, and 3: 3 possible rooted trees Only 1 possible unrooted tree 1 2 3
43 Distance-Based Phylogenetics Why not always use rooted trees? Number of Number of Number of sequences rooted trees unrooted trees ,459,425 2,027, ,458,046,767,875 7,905,853,580, N R =(2n-3)!/2 n-2 (n-2)! N U =(2n-5)!/2 n-3 (n-3)! Shortcuts
44 UPMA Unweighted pair-group method with arithmetic mean Oldest distance method, statistically based Requires data be condensed to a measure of genetic distance **Build a distance matrix between taxa (I.e. sequences) ** Consider 4 sequences A, B, C, D Species A B C B C d d AB AB is distance Between A and B d AC d BC D d AD d BD d CD Step 1: Cluster the two closest sequences into composite group, i.e. if d AB is smallest, make new group (AB).
45 UPMA Consider 4 sequences A, B, C, D Species A B C B C d d AB AB is distance Between A and B d AC d BC D d AD d BD d CD Step 1: Cluster the two closest sequences into composite group, i.e. if d AB is smallest, make new group (AB). Step 2: Create a new distance matrix between (AB) and C and D. d (AB)C =1/2 (d AC + d BC ); d (AB)D =1/2 (d AD + d BD )
46 UPMA Consider 4 sequences A, B, C, D Species A B C B C d d AB AB is distance Between A and B d AC d BC D d AD d BD d CD Step 1: Cluster the two closest sequences into composite group, i.e. if d AB is smallest, make new group (AB). Step 2: Create a new distance matrix between (AB) and C and D. d (AB)C =1/2 (d AC + d BC ); d (AB)D =1/2 (d AD + d BD ) Step 3: Using new matrix, cluster the two closest sequences into composite group. Repeat above until all species have been grouped.
47 UPMA Species A B C d AB is distance B d AB Between A and B C d AC d BC D d AD d BD d CD Step 1: Cluster the two closest sequences into composite group, i.e. if d AB is smallest, make new group (AB). Step 2: Create a new distance matrix between (AB) and C and D. d (AB)C =1/2 (d AC + d BC ); d (AB)D =1/2 (d AD + d BD ) Step 3: Using new matrix, cluster the two closest sequences into composite group. Repeat above until all species have been grouped. Step 4: For scaled branch lengths, put node halfway between grouped species.
48 UPMA - example Species A B C D B 9 C 8 11 D E D (D,E) E
49 UPMA - example Species A B C D B 9 C 8 11 D E D (D,E) E Species A B C A C D E B 9 C 8 11 DE (A,C) (D,E)
50 UPMA - example Species A B C B 9 C 8 11 A C D E DE (A,C) (D,E) Species B AC AC 10 A C B D E DE (((A,C)B)(D,E))
51 UPMA adding distances Species A B C D B 9 C 8 11 D E D E (D,E) Species A B C 4 A C 4 D 2.5 E 2.5 B 9 C 8 11 DE (A,C) (D,E)
52 UPMA adding distances Species B AC A C D E AC DE
53 Branch lengths for scaled unrooted tree = Fitch-Margoliash Algorithm for 3 sequences A x d AC = x+y y d AB = x+z C d BC = y+z B z x=(d AB +d AC d BC )/2 y=(d AC +d BC d AB )/2 z=(d AB +d BC d AC )/2 Note: F-M assumes additivity of branch lengths but DOES NOT Assume equal rates of evolution along branches. (Can specify this though : Kitsch-Margoliash)
54 Fitch-Margoliash Algorithm for >3 sequences A B a b f c g d e E Steps: 1- Find closest 2 sequences (D,E) 2- Treat rest as composite and take average of D to (ABC), E to (ABC) 3- Use these to calculate d, e 4- Make new composite DE 5- Make new distance table 6- Find next most closely related pair and repeat from step 2 Now repeat starting with another pair as the closest starting pair In the end, calculate all predicted distances for all trees, and choose What best fits data C D
55 Transformed Distance Method UPMA assumes constant rate Of evolution across all lineages Can allow different rates of evolution across different lineages if you normalize using an external reference that diverged early i.e. use an outgroup Define d D =average distance A B C D Between outgroup and all ingroups d ij = (d ij d id d jd )/2 + d D Now use d ij to do the clustering..basically just comes from the insight that ingroups evolved separately from each other ONLY AFTER they diverged from outgroup
56 Neighbor s Relation Method Variant of UPMA that pairs species in a way that creates a tree with minimal overall branch lengths. Pairs of sequences separated by only 1 node are said to be neighbors. single central branch A a c C e terminal branches B b d D For this tree topology d AC +d BD = d AD +d BC = a + b + c + d + 2e =d AB + d CD +2e For neighbor relations, four-point condition will be true: d AB +d CD < d AC +d BD and d AB +d CD < d AD +d BC So just have to consider all pairwise arrangements and determine which one satisfies the four-point condition.
57 Neighbor-Joining Methods Start with star-like tree. Find neighbors sequentially to minimize total length of all branches A B A C C D B D Studier & Kepler 1988: Q 12 =(N-2)d 12 - Σd 1i - Σd 2i Where any 2 sequences can be 1 and 2 Try all possible sequence combinations. Whichever combination of pairs gives the smallest Q 12 is the final tree!
58 Maximum Likelihood A purely statistical method. Probablilities for every nucleotide substitution in a set of aligned sequences is considered. Calculation of probabilities is complex since ancestor is unknown Test all possible trees and calculate the aggregate probablility. Tree with single highest aggregate probablilty is the most likely to reflect the true phylogenetic tree. VERY COMPUTATIONALLY INTENSE
59 Parsimony Parsimony: a derogatory term from the 1930s and 1940s To describe someone who was especially careful with Spending money. Biologically: Attach preference to an evolutionary pathway That minimizes the number of mutational events since (1) Mutations are rare events, and (2) The more unlikely events a model postulates, the less l likely the model is to be true. Parsimony: a character-based method, NOT a distance-based method.
60 Parsimony For parsimony analysis, positions in a sequence alignment fall into one of two categories: informative and uninformative. Position Sequence A T 3 A T A 4 A T C A T Only 3 possible unrooted trees you can make
61 Parsimony Position Sequence A T 3 A T A 4 A T C A T Which tree is the right one?
62 Parsimony Position Sequence A T A T A A T C A T Invariant positions contain NO INFORMATION uninformative
63 Parsimony Position Sequence A A T A T A T C A T A A 4 4 A Equally uninformative need one mutation in each tree
64 Parsimony Position Sequence A A T A T T A C A T 1 A Å 2 A Å 2 Å T 4 3 Å A T 4 4 Å Å T A 3 Also uninformative need two mutations in each tree
65 Parsimony Position Sequence A 4 A T A T C A A T T 1 T 3 1 A 2 1 A 2 Å T Å A Å A Å Å 2 Å A C 4 3 Å T C 4 4 C Å Å T 3 Also uninformative need three mutations in each tree
66 Parsimony Position Sequence A 3 A T 4 A T C A A T T 1 A Å 2 A 2 Å A 4 3 Å A A 4 4 A Å Å A 3 Informative! need only one mutation in one tree but two In the other trees!
67 Parsimony Position Sequence A 3 A T A 4 A T C A T T T 2 1 Å T 2 ÅT Å 2 Å Å T T 4 3 T 4 4 T 3 Informative! need only one mutation in one tree but two In the other trees!
68 Parsimony Position Sequence A A T A T C A A T T So to be Informative, need at least 2 different nucleotides And each has to be present at least twice. Every tree is considered for every site, maintaining a running score of the number of mutations required. The tree with the smallest number of invoked mutations is the most parsimonious
69 Parsimony 1 A Å 2 A 2 Å A 4 3 Å A A 4 4 A Å Å A 3 Mathematically, most likely candidate nts at an Internal node are: {descendent node 1} Ω {descendant node 2} IF this is null set, then most likely candidate nts are: {descendent node 1} U {descendant node 2} Σ U = minimum number of substitutions required to account for nts at terminal nodes since they last shared common ancestor Total number of substitutions, informative + uninformative = tree length
70 Parsimony 1 A Å 2 A 2 Å A 4 3 Å A A 4 4 A Å Å A 3 If you use parsimony but weigh the mutations by some kind of scoring system that accounts for the likelihood of each mutation weighted parsimony By-product of parsimony is inference of nt identity in the ancestral sequence
71 Parsimony 10 sequences: > 2 million possible trees Need a better way Branch and bound (Hardy and Penny, 1982) Step 1: Determine an upper bound to the length of the most parsimonious tree = L - either chosen randomly, or else using a computationally fast way like UPMA Step 2: row trees incrementally by adding branches to a smaller tree that describes just some of the sequences. Step 3: If at any point, the number of required substitutions is > L, abandon that tree. Step 4: As soon as you get a tree with fewer substiitutions than L, use that tree as the new upper bound to make remainder of the search even more efficient. Works for <= 20 sequences
72 For > 20 sequences Heuristic Searches Parsimony Assumption: Alternative trees are not all independent of each other. Most parsimonious trees have similar topologies. Step 1: Construct an initial tree as a good guess: UPMA, and use it as a starting point. Step 2: Branch-swap subtrees and graft them onto the starting tree, keeping overall topology. See how many are shorter than the starting tree. The prune and re-graft, and see if it keeps getting better. Step 3: Repeat until a round of branch swapping fails to generate any better trees
73 Parsimony Often get tens or hundreds of equally parsimonious trees Build a consensus tree any internal node supported by At least half the trees becomes a simple bifurcation.
74 Phylogenetic Software PHYLIP: Phylogenetics Inference Package free at Includes many programs including various distance methods, maximum likelihood, parsimony, with many of the options we ve discussed. PAUP: Phylogenetic Analysis Using Parsimony - NOT FREE Now includes maximum likelihood and distance methods as well
75 Tree of Life Carl Woese and colleagues, 1970s Used 16S rrna all organisms possess. Found 3 major evolutionary groups: Bacteria Eucarya Archea (including thermophilic bacteria Human Origins: mt DNA sequences huan populations differ by ~ 0.33% (very small). reatest differences NOT between current populations on different continents, but between human populations residing in Africa out of Africa theory Mitochondrial eve and Y-chromosome adam
Michael Yaffe Lecture #5 (((A,B)C)D) Database Searching & Molecular Phylogenetics A B C D B C D
C)D) Database Searching & Molecular Phylogenetics A B C D B C D") 7.91 Lecture #5 Database Searching & Molecular Phylogenetics Michael Yaffe B C D B C D (((,B)C)D) Outline Distance Matrix Methods Neighbor-Joining Method and Related Neighbor Methods Maximum Likelihood
7.91 Lecture #5 Database Searching & Molecular Phylogenetics Michael Yaffe B C D B C D (((,B)C)D) Outline Distance Matrix Methods Neighbor-Joining Method and Related Neighbor Methods Maximum Likelihood
"Nothing in biology makes sense except in the light of evolution Theodosius Dobzhansky
 MOLECULAR PHYLOGENY "Nothing in biology makes sense except in the light of evolution Theodosius Dobzhansky EVOLUTION - theory that groups of organisms change over time so that descendeants differ structurally
Constructing Evolutionary/Phylogenetic Trees
 Constructing Evolutionary/Phylogenetic Trees 2 broad categories: istance-based methods Ultrametric Additive: UPGMA Transformed istance Neighbor-Joining Character-based Maximum Parsimony Maximum Likelihood
Phylogenetic Analysis. Han Liang, Ph.D. Assistant Professor of Bioinformatics and Computational Biology UT MD Anderson Cancer Center
 Phylogenetic Analysis Han Liang, Ph.D. Assistant Professor of Bioinformatics and Computational Biology UT MD Anderson Cancer Center Outline Basic Concepts Tree Construction Methods Distance-based methods
THEORY. Based on sequence Length According to the length of sequence being compared it is of following two types
 Exp 11- THEORY Sequence Alignment is a process of aligning two sequences to achieve maximum levels of identity between them. This help to derive functional, structural and evolutionary relationships between
Understanding relationship between homologous sequences
 Molecular Evolution Molecular Evolution How and when were genes and proteins created? How old is a gene? How can we calculate the age of a gene? How did the gene evolve to the present form? What selective
POPULATION GENETICS Winter 2005 Lecture 17 Molecular phylogenetics
 POPULATION GENETICS Winter 2005 Lecture 17 Molecular phylogenetics - in deriving a phylogeny our goal is simply to reconstruct the historical relationships between a group of taxa. - before we review the
Bioinformatics 1. Sepp Hochreiter. Biology, Sequences, Phylogenetics Part 4. Bioinformatics 1: Biology, Sequences, Phylogenetics
 Bioinformatics 1 Biology, Sequences, Phylogenetics Part 4 Sepp Hochreiter Klausur Mo. 30.01.2011 Zeit: 15:30 17:00 Raum: HS14 Anmeldung Kusss Contents Methods and Bootstrapping of Maximum Methods Methods
Sequence Analysis 17: lecture 5. Substitution matrices Multiple sequence alignment
 Sequence Analysis 17: lecture 5 Substitution matrices Multiple sequence alignment Substitution matrices Used to score aligned positions, usually of amino acids. Expressed as the log-likelihood ratio of
Bio 1B Lecture Outline (please print and bring along) Fall, 2007
 Fall, 2007") Bio 1B Lecture Outline (please print and bring along) Fall, 2007 B.D. Mishler, Dept. of Integrative Biology 2-6810, bmishler@berkeley.edu Evolution lecture #5 -- Molecular genetics and molecular evolution
Bio 1B Lecture Outline (please print and bring along) Fall, 2007 B.D. Mishler, Dept. of Integrative Biology 2-6810, bmishler@berkeley.edu Evolution lecture #5 -- Molecular genetics and molecular evolution
C3020 Molecular Evolution. Exercises #3: Phylogenetics
 C3020 Molecular Evolution Exercises #3: Phylogenetics Consider the following sequences for five taxa 1-5 and the known outgroup O, which has the ancestral states (note that sequence 3 has changed from
 Tree of Life iological Sequence nalysis Chapter http://tolweb.org/tree/ Phylogenetic Prediction ll organisms on Earth have a common ancestor. ll species are related. The relationship is called a phylogeny
Constructing Evolutionary/Phylogenetic Trees
 Constructing Evolutionary/Phylogenetic Trees 2 broad categories: Distance-based methods Ultrametric Additive: UPGMA Transformed Distance Neighbor-Joining Character-based Maximum Parsimony Maximum Likelihood
Amira A. AL-Hosary PhD of infectious diseases Department of Animal Medicine (Infectious Diseases) Faculty of Veterinary Medicine Assiut
 Faculty of Veterinary Medicine Assiut") Amira A. AL-Hosary PhD of infectious diseases Department of Animal Medicine (Infectious Diseases) Faculty of Veterinary Medicine Assiut University-Egypt Phylogenetic analysis Phylogenetic Basics: Biological
Amira A. AL-Hosary PhD of infectious diseases Department of Animal Medicine (Infectious Diseases) Faculty of Veterinary Medicine Assiut University-Egypt Phylogenetic analysis Phylogenetic Basics: Biological
Quantifying sequence similarity
 Quantifying sequence similarity Bas E. Dutilh Systems Biology: Bioinformatic Data Analysis Utrecht University, February 16 th 2016 After this lecture, you can define homology, similarity, and identity
Phylogenetic Trees. Phylogenetic Trees Five. Phylogeny: Inference Tool. Phylogeny Terminology. Picture of Last Quagga. Importance of Phylogeny 5.
 Five Sami Khuri Department of Computer Science San José State University San José, California, USA sami.khuri@sjsu.edu v Distance Methods v Character Methods v Molecular Clock v UPGMA v Maximum Parsimony
Phylogenetic Tree Reconstruction
 I519 Introduction to Bioinformatics, 2011 Phylogenetic Tree Reconstruction Yuzhen Ye (yye@indiana.edu) School of Informatics & Computing, IUB Evolution theory Speciation Evolution of new organisms is driven
Phylogenetic inference
 Phylogenetic inference Bas E. Dutilh Systems Biology: Bioinformatic Data Analysis Utrecht University, March 7 th 016 After this lecture, you can discuss (dis-) advantages of different information types
Massachusetts Institute of Technology Computational Evolutionary Biology, Fall, 2005 Notes for November 7: Molecular evolution
 Massachusetts Institute of Technology 6.877 Computational Evolutionary Biology, Fall, 2005 Notes for November 7: Molecular evolution 1. Rates of amino acid replacement The initial motivation for the neutral
Dr. Amira A. AL-Hosary
 Phylogenetic analysis Amira A. AL-Hosary PhD of infectious diseases Department of Animal Medicine (Infectious Diseases) Faculty of Veterinary Medicine Assiut University-Egypt Phylogenetic Basics: Biological
BINF6201/8201. Molecular phylogenetic methods
 BINF60/80 Molecular phylogenetic methods 0-7-06 Phylogenetics Ø According to the evolutionary theory, all life forms on this planet are related to one another by descent. Ø Traditionally, phylogenetics
Algorithms in Bioinformatics
 Algorithms in Bioinformatics Sami Khuri Department of Computer Science San José State University San José, California, USA khuri@cs.sjsu.edu www.cs.sjsu.edu/faculty/khuri Distance Methods Character Methods
Evolutionary Tree Analysis. Overview
 CSI/BINF 5330 Evolutionary Tree Analysis Young-Rae Cho Associate Professor Department of Computer Science Baylor University Overview Backgrounds Distance-Based Evolutionary Tree Reconstruction Character-Based
Algorithms in Bioinformatics FOUR Pairwise Sequence Alignment. Pairwise Sequence Alignment. Convention: DNA Sequences 5. Sequence Alignment
 Algorithms in Bioinformatics FOUR Sami Khuri Department of Computer Science San José State University Pairwise Sequence Alignment Homology Similarity Global string alignment Local string alignment Dot
Sequence Alignments. Dynamic programming approaches, scoring, and significance. Lucy Skrabanek ICB, WMC January 31, 2013
 Sequence Alignments Dynamic programming approaches, scoring, and significance Lucy Skrabanek ICB, WMC January 31, 213 Sequence alignment Compare two (or more) sequences to: Find regions of conservation
Phylogeny: traditional and Bayesian approaches
 Phylogeny: traditional and Bayesian approaches 5-Feb-2014 DEKM book Notes from Dr. B. John Holder and Lewis, Nature Reviews Genetics 4, 275-284, 2003 1 Phylogeny A graph depicting the ancestor-descendent
EVOLUTIONARY DISTANCES
 EVOLUTIONARY DISTANCES FROM STRINGS TO TREES Luca Bortolussi 1 1 Dipartimento di Matematica ed Informatica Università degli studi di Trieste luca@dmi.units.it Trieste, 14 th November 2007 OUTLINE 1 STRINGS:
Lecture 4: Evolutionary Models and Substitution Matrices (PAM and BLOSUM)
") Bioinformatics II Probability and Statistics Universität Zürich and ETH Zürich Spring Semester 2009 Lecture 4: Evolutionary Models and Substitution Matrices (PAM and BLOSUM) Dr Fraser Daly adapted from
Bioinformatics II Probability and Statistics Universität Zürich and ETH Zürich Spring Semester 2009 Lecture 4: Evolutionary Models and Substitution Matrices (PAM and BLOSUM) Dr Fraser Daly adapted from
Phylogenetic analyses. Kirsi Kostamo
 Phylogenetic analyses Kirsi Kostamo The aim: To construct a visual representation (a tree) to describe the assumed evolution occurring between and among different groups (individuals, populations, species,
Sara C. Madeira. Universidade da Beira Interior. (Thanks to Ana Teresa Freitas, IST for useful resources on this subject)
") Bioinformática Sequence Alignment Pairwise Sequence Alignment Universidade da Beira Interior (Thanks to Ana Teresa Freitas, IST for useful resources on this subject) 1 16/3/29 & 23/3/29 27/4/29 Outline
Bioinformática Sequence Alignment Pairwise Sequence Alignment Universidade da Beira Interior (Thanks to Ana Teresa Freitas, IST for useful resources on this subject) 1 16/3/29 & 23/3/29 27/4/29 Outline
Phylogenetic Trees. What They Are Why We Do It & How To Do It. Presented by Amy Harris Dr Brad Morantz
 Phylogenetic Trees What They Are Why We Do It & How To Do It Presented by Amy Harris Dr Brad Morantz Overview What is a phylogenetic tree Why do we do it How do we do it Methods and programs Parallels
Evolutionary trees. Describe the relationship between objects, e.g. species or genes
 Evolutionary trees Bonobo Chimpanzee Human Neanderthal Gorilla Orangutan Describe the relationship between objects, e.g. species or genes Early evolutionary studies The evolutionary relationships between
Phylogenetics: Distance Methods. COMP Spring 2015 Luay Nakhleh, Rice University
 Phylogenetics: Distance Methods COMP 571 - Spring 2015 Luay Nakhleh, Rice University Outline Evolutionary models and distance corrections Distance-based methods Evolutionary Models and Distance Correction
7. Tests for selection
 Sequence analysis and genomics 7. Tests for selection Dr. Katja Nowick Group leader TFome and Transcriptome Evolution Bioinformatics group Paul-Flechsig-Institute for Brain Research www. nowicklab.info
What is Phylogenetics
 What is Phylogenetics Phylogenetics is the area of research concerned with finding the genetic connections and relationships between species. The basic idea is to compare specific characters (features)
Chapter 5. Proteomics and the analysis of protein sequence Ⅱ
 Proteomics Chapter 5. Proteomics and the analysis of protein sequence Ⅱ 1 Pairwise similarity searching (1) Figure 5.5: manual alignment One of the amino acids in the top sequence has no equivalent and
9/30/11. Evolution theory. Phylogenetic Tree Reconstruction. Phylogenetic trees (binary trees) Phylogeny (phylogenetic tree)
 Phylogeny (phylogenetic tree)") I9 Introduction to Bioinformatics, 0 Phylogenetic ree Reconstruction Yuzhen Ye (yye@indiana.edu) School of Informatics & omputing, IUB Evolution theory Speciation Evolution of new organisms is driven by
I9 Introduction to Bioinformatics, 0 Phylogenetic ree Reconstruction Yuzhen Ye (yye@indiana.edu) School of Informatics & omputing, IUB Evolution theory Speciation Evolution of new organisms is driven by
Estimating Phylogenies (Evolutionary Trees) II. Biol4230 Thurs, March 2, 2017 Bill Pearson Jordan 6-057
 II. Biol4230 Thurs, March 2, 2017 Bill Pearson Jordan 6-057") Estimating Phylogenies (Evolutionary Trees) II Biol4230 Thurs, March 2, 2017 Bill Pearson wrp@virginia.edu 4-2818 Jordan 6-057 Tree estimation strategies: Parsimony?no model, simply count minimum number
Estimating Phylogenies (Evolutionary Trees) II Biol4230 Thurs, March 2, 2017 Bill Pearson wrp@virginia.edu 4-2818 Jordan 6-057 Tree estimation strategies: Parsimony?no model, simply count minimum number
GENETICS - CLUTCH CH.22 EVOLUTIONARY GENETICS.
 !! www.clutchprep.com CONCEPT: OVERVIEW OF EVOLUTION Evolution is a process through which variation in individuals makes it more likely for them to survive and reproduce There are principles to the theory
Cladistics and Bioinformatics Questions 2013
 AP Biology Name Cladistics and Bioinformatics Questions 2013 1. The following table shows the percentage similarity in sequences of nucleotides from a homologous gene derived from five different species
Multiple Sequence Alignment. Sequences
 Multiple Sequence Alignment Sequences > YOR020c mstllksaksivplmdrvlvqrikaqaktasglylpe knveklnqaevvavgpgftdangnkvvpqvkvgdqvl ipqfggstiklgnddevilfrdaeilakiakd > crassa mattvrsvksliplldrvlvqrvkaeaktasgiflpe
How to read and make phylogenetic trees Zuzana Starostová
 How to read and make phylogenetic trees Zuzana Starostová How to make phylogenetic trees? Workflow: obtain DNA sequence quality check sequence alignment calculating genetic distances phylogeny estimation
Natural selection on the molecular level
 Natural selection on the molecular level Fundamentals of molecular evolution How DNA and protein sequences evolve? Genetic variability in evolution } Mutations } forming novel alleles } Inversions } change
Phylogenetics. BIOL 7711 Computational Bioscience
 Consortium for Comparative Genomics! University of Colorado School of Medicine Phylogenetics BIOL 7711 Computational Bioscience Biochemistry and Molecular Genetics Computational Bioscience Program Consortium
Lecture Notes: BIOL2007 Molecular Evolution
 Lecture Notes: BIOL2007 Molecular Evolution Kanchon Dasmahapatra (k.dasmahapatra@ucl.ac.uk) Introduction By now we all are familiar and understand, or think we understand, how evolution works on traits
Bioinformatics 1 -- lecture 9. Phylogenetic trees Distance-based tree building Parsimony
 ioinformatics -- lecture 9 Phylogenetic trees istance-based tree building Parsimony (,(,(,))) rees can be represented in "parenthesis notation". Each set of parentheses represents a branch-point (bifurcation),
Bioinformatics tools for phylogeny and visualization. Yanbin Yin
 Bioinformatics tools for phylogeny and visualization Yanbin Yin 1 Homework assignment 5 1. Take the MAFFT alignment http://cys.bios.niu.edu/yyin/teach/pbb/purdue.cellwall.list.lignin.f a.aln as input and
A Phylogenetic Network Construction due to Constrained Recombination
 A Phylogenetic Network Construction due to Constrained Recombination Mohd. Abdul Hai Zahid Research Scholar Research Supervisors: Dr. R.C. Joshi Dr. Ankush Mittal Department of Electronics and Computer
Chapter 26: Phylogeny and the Tree of Life Phylogenies Show Evolutionary Relationships
 Chapter 26: Phylogeny and the Tree of Life You Must Know The taxonomic categories and how they indicate relatedness. How systematics is used to develop phylogenetic trees. How to construct a phylogenetic
Week 5: Distance methods, DNA and protein models
 Week 5: Distance methods, DNA and protein models Genome 570 February, 2016 Week 5: Distance methods, DNA and protein models p.1/69 A tree and the expected distances it predicts E A 0.08 0.05 0.06 0.03
Molecular Phylogenetics (part 1 of 2) Computational Biology Course João André Carriço
 Computational Biology Course João André Carriço") Molecular Phylogenetics (part 1 of 2) Computational Biology Course João André Carriço jcarrico@fm.ul.pt Charles Darwin (1809-1882) Charles Darwin s tree of life in Notebook B, 1837-1838 Ernst Haeckel (1934-1919)
Molecular Phylogenetics (part 1 of 2) Computational Biology Course João André Carriço jcarrico@fm.ul.pt Charles Darwin (1809-1882) Charles Darwin s tree of life in Notebook B, 1837-1838 Ernst Haeckel (1934-1919)
A (short) introduction to phylogenetics
 introduction to phylogenetics") A (short) introduction to phylogenetics Thibaut Jombart, Marie-Pauline Beugin MRC Centre for Outbreak Analysis and Modelling Imperial College London Genetic data analysis with PR Statistics, Millport Field
A (short) introduction to phylogenetics Thibaut Jombart, Marie-Pauline Beugin MRC Centre for Outbreak Analysis and Modelling Imperial College London Genetic data analysis with PR Statistics, Millport Field
Molecular phylogeny - Using molecular sequences to infer evolutionary relationships. Tore Samuelsson Feb 2016
 Molecular phylogeny - Using molecular sequences to infer evolutionary relationships Tore Samuelsson Feb 2016 Molecular phylogeny is being used in the identification and characterization of new pathogens,
CHAPTERS 24-25: Evidence for Evolution and Phylogeny
 CHAPTERS 24-25: Evidence for Evolution and Phylogeny 1. For each of the following, indicate how it is used as evidence of evolution by natural selection or shown as an evolutionary trend: a. Paleontology
7.36/7.91 recitation CB Lecture #4
 7.36/7.91 recitation 2-19-2014 CB Lecture #4 1 Announcements / Reminders Homework: - PS#1 due Feb. 20th at noon. - Late policy: ½ credit if received within 24 hrs of due date, otherwise no credit - Answer
The neutral theory of molecular evolution
 The neutral theory of molecular evolution Introduction I didn t make a big deal of it in what we just went over, but in deriving the Jukes-Cantor equation I used the phrase substitution rate instead of
Theory of Evolution Charles Darwin
 Theory of Evolution Charles arwin 858-59: Origin of Species 5 year voyage of H.M.S. eagle (83-36) Populations have variations. Natural Selection & Survival of the fittest: nature selects best adapted varieties
Practical considerations of working with sequencing data
 Practical considerations of working with sequencing data File Types Fastq ->aligner -> reference(genome) coordinates Coordinate files SAM/BAM most complete, contains all of the info in fastq and more!
Q1) Explain how background selection and genetic hitchhiking could explain the positive correlation between genetic diversity and recombination rate.
 Explain how background selection and genetic hitchhiking could explain the positive correlation between genetic diversity and recombination rate.") OEB 242 Exam Practice Problems Answer Key Q1) Explain how background selection and genetic hitchhiking could explain the positive correlation between genetic diversity and recombination rate. First, recall
OEB 242 Exam Practice Problems Answer Key Q1) Explain how background selection and genetic hitchhiking could explain the positive correlation between genetic diversity and recombination rate. First, recall
InDel 3-5. InDel 8-9. InDel 3-5. InDel 8-9. InDel InDel 8-9
 Lecture 5 Alignment I. Introduction. For sequence data, the process of generating an alignment establishes positional homologies; that is, alignment provides the identification of homologous phylogenetic
Inferring Phylogenetic Trees. Distance Approaches. Representing distances. in rooted and unrooted trees. The distance approach to phylogenies
 Inferring Phylogenetic Trees Distance Approaches Representing distances in rooted and unrooted trees The distance approach to phylogenies given: an n n matrix M where M ij is the distance between taxa
3. SEQUENCE ANALYSIS BIOINFORMATICS COURSE MTAT
 3. SEQUENCE ANALYSIS BIOINFORMATICS COURSE MTAT.03.239 25.09.2012 SEQUENCE ANALYSIS IS IMPORTANT FOR... Prediction of function Gene finding the process of identifying the regions of genomic DNA that encode
METHODS FOR DETERMINING PHYLOGENY. In Chapter 11, we discovered that classifying organisms into groups was, and still is, a difficult task.
 Chapter 12 (Strikberger) Molecular Phylogenies and Evolution METHODS FOR DETERMINING PHYLOGENY In Chapter 11, we discovered that classifying organisms into groups was, and still is, a difficult task. Modern
Bioinformatics. Scoring Matrices. David Gilbert Bioinformatics Research Centre
 Bioinformatics Scoring Matrices David Gilbert Bioinformatics Research Centre www.brc.dcs.gla.ac.uk Department of Computing Science, University of Glasgow Learning Objectives To explain the requirement
FUNDAMENTALS OF MOLECULAR EVOLUTION
 FUNDAMENTALS OF MOLECULAR EVOLUTION Second Edition Dan Graur TELAVIV UNIVERSITY Wen-Hsiung Li UNIVERSITY OF CHICAGO SINAUER ASSOCIATES, INC., Publishers Sunderland, Massachusetts Contents Preface xiii
Sequence Alignment: A General Overview. COMP Fall 2010 Luay Nakhleh, Rice University
 Sequence Alignment: A General Overview COMP 571 - Fall 2010 Luay Nakhleh, Rice University Life through Evolution All living organisms are related to each other through evolution This means: any pair of
C.DARWIN ( )
") C.DARWIN (1809-1882) LAMARCK Each evolutionary lineage has evolved, transforming itself, from a ancestor appeared by spontaneous generation DARWIN All organisms are historically interconnected. Their relationships
C.DARWIN (1809-1882) LAMARCK Each evolutionary lineage has evolved, transforming itself, from a ancestor appeared by spontaneous generation DARWIN All organisms are historically interconnected. Their relationships
Evolutionary Theory and Principles of Phylogenetics. Lucy Skrabanek ICB, WMC March 19, 2008
 Evolutionary Theory and Principles of Phylogenetics Lucy Skrabanek ICB, WMC March 19, 2008 Theory of evolution Evolution: process of change over time 2 competing models Phyletic gradualism Punctuated equilibrium
Lecture 27. Phylogeny methods, part 4 (Models of DNA and protein change) p.1/26
 p.1/26") Lecture 27. Phylogeny methods, part 4 (Models of DNA and protein change) Joe Felsenstein Department of Genome Sciences and Department of Biology Lecture 27. Phylogeny methods, part 4 (Models of DNA and
Lecture 27. Phylogeny methods, part 4 (Models of DNA and protein change) Joe Felsenstein Department of Genome Sciences and Department of Biology Lecture 27. Phylogeny methods, part 4 (Models of DNA and
Comparative Bioinformatics Midterm II Fall 2004
 Comparative Bioinformatics Midterm II Fall 2004 Objective Answer, part I: For each of the following, select the single best answer or completion of the phrase. (3 points each) 1. Deinococcus radiodurans
Phylogeny: building the tree of life
 Phylogeny: building the tree of life Dr. Fayyaz ul Amir Afsar Minhas Department of Computer and Information Sciences Pakistan Institute of Engineering & Applied Sciences PO Nilore, Islamabad, Pakistan
Probabilistic modeling and molecular phylogeny
 Probabilistic modeling and molecular phylogeny Anders Gorm Pedersen Molecular Evolution Group Center for Biological Sequence Analysis Technical University of Denmark (DTU) What is a model? Mathematical
MULTIPLE SEQUENCE ALIGNMENT FOR CONSTRUCTION OF PHYLOGENETIC TREE
 MULTIPLE SEQUENCE ALIGNMENT FOR CONSTRUCTION OF PHYLOGENETIC TREE Manmeet Kaur 1, Navneet Kaur Bawa 2 1 M-tech research scholar (CSE Dept) ACET, Manawala,Asr 2 Associate Professor (CSE Dept) ACET, Manawala,Asr
Evolutionary Models. Evolutionary Models
 Edit Operators In standard pairwise alignment, what are the allowed edit operators that transform one sequence into the other? Describe how each of these edit operations are represented on a sequence alignment
Computational Biology
 Computational Biology Lecture 6 31 October 2004 1 Overview Scoring matrices (Thanks to Shannon McWeeney) BLAST algorithm Start sequence alignment 2 1 What is a homologous sequence? A homologous sequence,
Lecture 6 Phylogenetic Inference
 Lecture 6 Phylogenetic Inference From Darwin s notebook in 1837 Charles Darwin Willi Hennig From The Origin in 1859 Cladistics Phylogenetic inference Willi Hennig, Cladistics 1. Clade, Monophyletic group,
Processes of Evolution
 15 Processes of Evolution Forces of Evolution Concept 15.4 Selection Can Be Stabilizing, Directional, or Disruptive Natural selection can act on quantitative traits in three ways: Stabilizing selection
How Molecules Evolve. Advantages of Molecular Data for Tree Building. Advantages of Molecular Data for Tree Building
 How Molecules Evolve Guest Lecture: Principles and Methods of Systematic Biology 11 November 2013 Chris Simon Approaching phylogenetics from the point of view of the data Understanding how sequences evolve
Bioinformatics Exercises
 Bioinformatics Exercises AP Biology Teachers Workshop Susan Cates, Ph.D. Evolution of Species Phylogenetic Trees show the relatedness of organisms Common Ancestor (Root of the tree) 1 Rooted vs. Unrooted
Bioinformatics (GLOBEX, Summer 2015) Pairwise sequence alignment
 Pairwise sequence alignment") Bioinformatics (GLOBEX, Summer 2015) Pairwise sequence alignment Substitution score matrices, PAM, BLOSUM Needleman-Wunsch algorithm (Global) Smith-Waterman algorithm (Local) BLAST (local, heuristic) E-value
Bioinformatics (GLOBEX, Summer 2015) Pairwise sequence alignment Substitution score matrices, PAM, BLOSUM Needleman-Wunsch algorithm (Global) Smith-Waterman algorithm (Local) BLAST (local, heuristic) E-value
8/23/2014. Phylogeny and the Tree of Life
 Phylogeny and the Tree of Life Chapter 26 Objectives Explain the following characteristics of the Linnaean system of classification: a. binomial nomenclature b. hierarchical classification List the major
Single alignment: Substitution Matrix. 16 march 2017
 Single alignment: Substitution Matrix 16 march 2017 BLOSUM Matrix BLOSUM Matrix [2] (Blocks Amino Acid Substitution Matrices ) It is based on the amino acids substitutions observed in ~2000 conserved block
Page 1. Evolutionary Trees. Why build evolutionary tree? Outline
 Page Evolutionary Trees Russ. ltman MI S 7 Outline. Why build evolutionary trees?. istance-based vs. character-based methods. istance-based: Ultrametric Trees dditive Trees. haracter-based: Perfect phylogeny
G4120: Introduction to Computational Biology
 ICB Fall 2004 G4120: Introduction to Computational Biology Oliver Jovanovic, Ph.D. Columbia University Department of Microbiology Copyright 2004 Oliver Jovanovic, All Rights Reserved. Alignment Alignment
Molecular evolution. Joe Felsenstein. GENOME 453, Autumn Molecular evolution p.1/49
 Molecular evolution Joe Felsenstein GENOME 453, utumn 2009 Molecular evolution p.1/49 data example for phylogeny inference Five DN sequences, for some gene in an imaginary group of species whose names
DNA Phylogeny. Signals and Systems in Biology Kushal EE, IIT Delhi
 DNA Phylogeny Signals and Systems in Biology Kushal Shah @ EE, IIT Delhi Phylogenetics Grouping and Division of organisms Keeps changing with time Splitting, hybridization and termination Cladistics :
Phylogeny Tree Algorithms
 Phylogeny Tree lgorithms Jianlin heng, PhD School of Electrical Engineering and omputer Science University of entral Florida 2006 Free for academic use. opyright @ Jianlin heng & original sources for some
Evolutionary trees. Describe the relationship between objects, e.g. species or genes
 Evolutionary trees Bonobo Chimpanzee Human Neanderthal Gorilla Orangutan Describe the relationship between objects, e.g. species or genes Early evolutionary studies Anatomical features were the dominant
Pairwise sequence alignment
 Department of Evolutionary Biology Example Alignment between very similar human alpha- and beta globins: GSAQVKGHGKKVADALTNAVAHVDDMPNALSALSDLHAHKL G+ +VK+HGKKV A+++++AH+D++ +++++LS+LH KL GNPKVKAHGKKVLGAFSDGLAHLDNLKGTFATLSELHCDKL
Lecture 11 Friday, October 21, 2011
 Lecture 11 Friday, October 21, 2011 Phylogenetic tree (phylogeny) Darwin and classification: In the Origin, Darwin said that descent from a common ancestral species could explain why the Linnaean system
SEQUENCE DIVERGENCE,FUNCTIONAL CONSTRAINT, AND SELECTION IN PROTEIN EVOLUTION
 Annu. Rev. Genomics Hum. Genet. 2003. 4:213 35 doi: 10.1146/annurev.genom.4.020303.162528 Copyright c 2003 by Annual Reviews. All rights reserved First published online as a Review in Advance on June 4,
Theory of Evolution. Charles Darwin
 Theory of Evolution harles arwin 858-59: Origin of Species 5 year voyage of H.M.S. eagle (8-6) Populations have variations. Natural Selection & Survival of the fittest: nature selects best adapted varieties
Early History up to Schedule. Proteins DNA & RNA Schwann and Schleiden Cell Theory Charles Darwin publishes Origin of Species
 Schedule Bioinformatics and Computational Biology: History and Biological Background (JH) 0.0 he Parsimony criterion GKN.0 Stochastic Models of Sequence Evolution GKN 7.0 he Likelihood criterion GKN 0.0
Gene Families part 2. Review: Gene Families /727 Lecture 8. Protein family. (Multi)gene family
gene family") Review: Gene Families Gene Families part 2 03 327/727 Lecture 8 What is a Case study: ian globin genes Gene trees and how they differ from species trees Homology, orthology, and paralogy Last tuesday 1
Review: Gene Families Gene Families part 2 03 327/727 Lecture 8 What is a Case study: ian globin genes Gene trees and how they differ from species trees Homology, orthology, and paralogy Last tuesday 1
Lecture 4: Evolutionary models and substitution matrices (PAM and BLOSUM).
.") 1 Bioinformatics: In-depth PROBABILITY & STATISTICS Spring Semester 2011 University of Zürich and ETH Zürich Lecture 4: Evolutionary models and substitution matrices (PAM and BLOSUM). Dr. Stefanie Muff
1 Bioinformatics: In-depth PROBABILITY & STATISTICS Spring Semester 2011 University of Zürich and ETH Zürich Lecture 4: Evolutionary models and substitution matrices (PAM and BLOSUM). Dr. Stefanie Muff
Statistical Machine Learning Methods for Bioinformatics II. Hidden Markov Model for Biological Sequences
 Statistical Machine Learning Methods for Bioinformatics II. Hidden Markov Model for Biological Sequences Jianlin Cheng, PhD Department of Computer Science University of Missouri 2008 Free for Academic
An Introduction to Sequence Similarity ( Homology ) Searching
 Searching") An Introduction to Sequence Similarity ( Homology ) Searching Gary D. Stormo 1 UNIT 3.1 1 Washington University, School of Medicine, St. Louis, Missouri ABSTRACT Homologous sequences usually have the same,
An Introduction to Sequence Similarity ( Homology ) Searching Gary D. Stormo 1 UNIT 3.1 1 Washington University, School of Medicine, St. Louis, Missouri ABSTRACT Homologous sequences usually have the same,
Tools and Algorithms in Bioinformatics
 Tools and Algorithms in Bioinformatics GCBA815, Fall 2013 Week3: Blast Algorithm, theory and practice Babu Guda, Ph.D. Department of Genetics, Cell Biology & Anatomy Bioinformatics and Systems Biology
Today s Lecture: HMMs
 Today s Lecture: HMMs Definitions Examples Probability calculations WDAG Dynamic programming algorithms: Forward Viterbi Parameter estimation Viterbi training 1 Hidden Markov Models Probability models
Phylogenetics: Building Phylogenetic Trees
 1 Phylogenetics: Building Phylogenetic Trees COMP 571 Luay Nakhleh, Rice University 2 Four Questions Need to be Answered What data should we use? Which method should we use? Which evolutionary model should