Evaluation of building-scale heat-stress analysis system (BioCAS) based on mortality observation in Seoul
|
|
|
- Anabel Bishop
- 5 years ago
- Views:
Transcription

1 ICUC9 9th International Congress on Urban Climate July, 2015, Toulouse France Evaluation of building-scale heat-stress analysis system (BioCAS) based on mortality observation in Seoul National Institute of Meteorological Research, KMA, Korea Kyu Rang Kim Ji-Sun Lee Byoung-Choel Choi Weather Information Service Engine project Chaeyeon Yi Technical Univ. of Berlin, Germany Dieter Scherer


2 How do you assess the Impact of heat stress by urban development? 2002 : Before the construction 2011 : After the new town development Heat vulnerability? Ventilation condition?


3


4
5 Mortality increase during heat waves 80 more people (24 July, 1994 in Seoul) ~3000 more people (1994 in Korea) Can we assess the impact of increase as mortality increase by the construction of buildings or parks?
6 BioCAS: Impact Assessment System for Heat Stress Integration of four models: Climate Analysis Seoul (CAS, T) Evaluated by weather observation Solar Radiation (SOLWEIG, T mrt ) Klima-Michel Model (KMM, PT) Excess Mortality Rate (r EM ) Published: Needs extensive evaluation on the health impact Evaluation by observed health impact Mortality and No. of hospital visits of patient by heat waves at district level in Seoul
7 CAS High-resolution input data (LiDAR ) SOLWEIG Mean radiant Air KMM Relative humidity and wind at SWS Perceived Daily maximum perceived Daily death counts in Seoul EMR Heat risk map Flowchart of the BioCAS - Bio-Climatic impact Assessment System
8 CAS High-resolution input data (LiDAR ) SOLWEIG Mean radiant KMM Perceived Air Relative humidity and wind at SWS Climate Analysis Seoul (CAS) Daily maximum perceived Daily death counts in Seoul EMR Heat risk map Input: Airborne LiDAR and satellite images for hi-res DEM & Land Cover Process: meso-scale wind conditions, thermal load of buildings and vegetation Output: distribution, building configuration (for SOLWEIG)
 Daily maximum perceived Daily death counts in Seoul EMR Heat")

9 CAS High-resolution input data (LiDAR ) SOLWEIG Mean radiant KMM Perceived Air Relative humidity and wind at SWS Climate Analysis Seoul (CAS) Daily maximum perceived Daily death counts in Seoul EMR Heat risk map Input: Airborne LiDAR and satellite images for hi-res DEM & Land Cover Process: thermal load of buildings and vegetation, wind conditions Output: distribution, building configuration (for SOLWEIG)


: 6 sites building configuration T-RH observation (for")
10 CAS High-resolution input data (LiDAR ) SOLWEIG Mean radiant KMM Perceived Air Relative humidity and wind at SWS Climate Analysis Seoul (CAS) Daily maximum perceived Daily death counts in Seoul EMR Heat risk map Input: Airborne LiDAR and satellite images for hi-res DEM & Land Cover Meso-scale wind Cold air stagnation Surface influence Total air Process: Thermal Load of buildings and vegetation, Wind Conditions Model optimization by high density observation - more than 30 observational sites & humidity observation (1.5m):18 sites Output: distribution, wind observation (3.0m): 6 sites building configuration T-RH observation (for at 4 SOLWEIG) heights: 12 sites Satellite and thermal infrared images

11 CAS High-resolution input data (LiDAR ) SOLWEIG Mean radiant KMM Perceived Air Relative humidity and wind at SWS Climate Analysis Seoul (CAS) Daily maximum perceived Daily death counts in Seoul EMR Heat risk map Input: Airborne LiDAR and satellite New town images for hi-res DEM & Land Cover Process: thermal load of buildings and vegetation, wind conditions Old town Resolution = 5 meters Output: distribution, (+building configuration for SOLWEIG) Yi et al. 2015: Estimating spatial patterns of air at building-resolving spatial resolution in Seoul, Korea. IJC (online first)
12 CAS SOLWEIG Mean radiant KMM Perceived Daily maximum perceived EMR Heat risk map High-resolution input data (LiDAR ) Air Relative humidity and wind at SWS Daily death counts in Seoul Solar Long Wave Environmental Irradiance Geometry (SOLWEIG) Input: building configuration from CAS hourly T, RH, Solar Rad at SWS Process: sky view factor, solar angle, shadow Output: mean radiant (T mrt )
13 Solar radiation Air Relative humidity Wind speed Solar Radiation (W/m2 Relative Humidity (%) 38 5 Air Temperature Wind Speed (m/s) Radiation (W/m2) Time Relative Humidity (%) Hourly weather conditions observed at the reference station SWS during the heat event on August 5, 2012

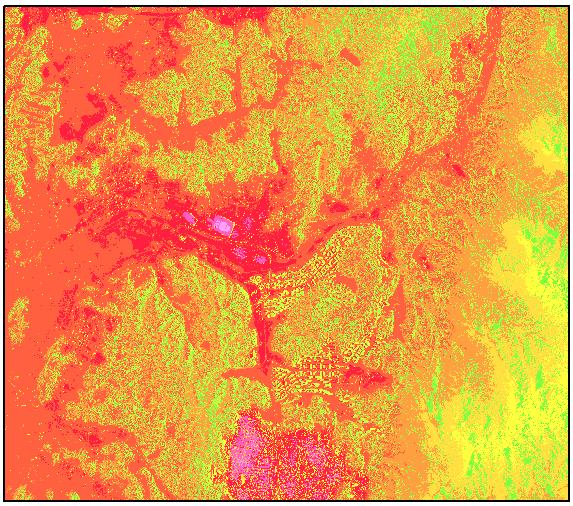
14 Digital Surface Model (DSM) from CAS Produced by TUB using CAS (CAP v2.1); data source: NIMR


15 Produced by TUB using SOLWEIG; DSM data source: NIMR Sky View Factor Longwave Radiation Shortwave Radiation Mean Radiant Temperature (Tmrt)

16 T mrt at DR Eunpyeong during a heat wave event on August 5, :00KST A: old town, B: new town
17 CAS High-resolution input data (LiDAR ) SOLWEIG Mean radiant KMM Perceived Air Relative humidity and wind at SWS Klima-Michel Model (KMM) Daily maximum perceived Daily death counts in Seoul EMR Heat risk map Input: T, T mrt, RH, Wind speed The Thermal Environment Process Thermal balance between the human body and the environment R E E Q L Q H A M D Q R E E K M Q S w R I E R Output: Perceived (PT)
18 Perceived Temperature (PT) PT calculates heat stress according to radiation (T mrt )
 on a heat wave event of Aug.")
19 T mrt and PT Produced by TUB (a, T mrt ) and NIMR (b, PT) on a heat wave event of Aug. 5, 2012, 12:00 KST


20 PT: 15:00 20:00 Aug. 5, :00 16:00 17:00 18:00 19:00 20:00

21 Maximum PT, PT max at the DR during the heat wave event on August 5, 2012 A: old town, B: new town
22 CAS High-resolution input data (LiDAR ) SOLWEIG Mean radiant KMM Perceived Air Relative humidity and wind at SWS Excess Mortality Rate (r EM ) Daily maximum perceived EMR Heat risk map Daily death counts in Seoul Purpose: quantify the risk of a heat wave Model development Y(r EM ): increase in daily mortality rate relative to the expected base mortality rate* X(PT max ): daily maximum PT ICD Code Causes of the death E00~99 Endocrine, nutritional and metabolic disease F00~99 Mental and behavioral disorders G00~99 Diseases of the nervous system I00~99 Diseases of the circulatory system J00~99 Diseases of the respiratory system R00~99 Symptoms, signs and abnormal clinical and laboratory findings, NEC * Daily base mortality rate was estimated as Kysely (2004).
23 Excess Mortality Rate (r EM ) Excess mortality rate Simple regression 95% Confidence band 95% Prediction band r EM = PT max N = 21, R 2 = 0.57 r 2 = Daily maximum perceived ( o C)
24 Impact Assessment of an Urban Development Heat Wave Event: Aug. 5, 2012 Hourly weather conditions from SWS Re-development Area: DR of CAS Old and New town areas are included TD & TD from CAS, T mrt, PT, and r EM DR: Detail Region CAS: Climate Analysis Seoul TD: Total Temperature Deviation TD : Temperature Distribution PT: Perceived Temperature T mrt : Mean Radiant Temperature r EM : Excess Mortality Rate
 0 0.086 ~ 0 0.001 0.1 % * Record high r EM = 1.")
25 Assessment of a new town area Old town vs. New town Area Minimum Maximum Mean Std. dev. Area: r EM > 0 Old town (A) % New town (B) ~ % * Record high r EM = 1.12 (25 July, 1994) (112% increased mortality)
26 BioCAS : a New Tool for Bio- Climatic Impact Assessment Biometeorological models were integrated with high resolution climate analysis system for impact assessment of heat stress over complex urban area. CAS SOLWEIG Mean radiant KMM Perceived Daily maximum perceived EMR High-resolution input data (LiDAR ) Air Relative humidity and wind at SWS Daily death counts in Seoul Heat risk map Kim et al. 2014: BioCAS: Biometeorological Climate impact Assessment System for buildingscale impact assessment of heat-stress related mortality. DIE ERDE 145 (1-2): 62-79
27 Evaluation of the BioCAS at the Whole City Area of Seoul Challenges: Scalability: Impact assessment over the entire Seoul at very high resolution of 5 m is challenging. Validity: Evaluation of the assessed impact based on observed human response is also very challenging. The evaluation was performed at districtlevel by comparing the mortality difference and estimated heat wave impact.
28 Evaluation of BioCAS based on Health Impact at District Level BioCAS analysis Entire Seoul area (SR) Heat wave event date: Aug. 5, 2012 Analysis data and period Daily mortality: (10 years) Daily visits by patients: (6 years) Heat specific deaths and visits only Statistical comparison Correlation analysis between PT max / r EM and observed mortality / hospital visits by patients
29 Evaluation: BioCAS over SR Input < 5 m resolution (37 x 30 km) Digital Building Model Digital Vegetation Model Land Cover Computational problem 25 m res.
30 Evaluation: BioCAS over SR BioCAS analysis over Seoul city (SR) Distribution of T, T mrt, PT, PT max, and r 25 m resolution Heat wave event date: Aug. 5, 2012 Other conditions were set as the same as in the impact assessment of the new town Data aggregation for the 25 districts PT max and r EM Over the entire district area / over residential area only


31 Evaluation: BioCAS over SR Temperature of Seoul on Aug. 5, 2012 Estimated by CAS 09:00 LST 12:00 LST 15:00 LST

32 Evaluation: BioCAS over SR Mean Radiant Temperature (T mrt ) on Aug. 5, 2012 Estimated by SOLWEIG 09:00 LST 12:00 LST 15:00 LST
33 Evaluation: BioCAS over SR Hourly Perceived Temperature (PT) of Seoul on Aug. 5, 2012 Estimated by KMM 09:00 LST 12:00 LST 15:00 LST
34 Evaluation: BioCAS over SR Daily Max PT (PT max ) of Seoul Estimated by the KMM
 Estimated by")
35 Evaluation: BioCAS over SR Excess Mortality Rate (r EM ) Estimated by the EMR
36 Evaluation: BioCAS over SR Data aggregation for the 25 districts PT max and r EM Over the entire district and over residential area only
37 Evaluation: BioCAS over SR Data aggregation for the 25 districts Over the entire district PT max by district r EM by district
38 Evaluation: BioCAS over SR Data aggregation for the 25 districts Over residential area only PT max by district r EM by district
39 Evaluation: Mortality and hospital visit by patients data Analysis data and period Daily mortality: (10 years) Daily visits by patients: (6 years) Heat specific mortality and # of visits only Mortality ( ) No. of Patients ( )
40 Evaluation: Statistical Comparison Pearson s correlation coefficients Estimated PT residential area vs. observed mortality / visits Mortality (/10,000 person) PT max Spatial Minimum Maximum Mean Spatial minimum of PTmax Mortality 0.53 ** ** NS (p) (0.007) (0.002) (0.26) Hosp. Visits NS * NS (p) (0.10) (0.036) (0.93) Min. and Max. of the spatial PT max distribution were positively correlated to mortality and # of visits by patients, but mean was not. Spatial averaging of PT max may not explain heat-induced vulnerability.
41 Evaluation: Statistical Comparison Pearson s correlation coefficients Estimated r EM vs. observed mortality / visits by patients No. of Inpatients r EM Spatial Spatial Total r EM Maximum Mean Total Mortality NS NS 0.11 NS (p) (0.62) (0.24) (0.60) Hosp. Visits ** NS * (p) (0.009) (0.73) (0.06) Max. and Total of the spatial r EM distribution were positively correlated to # of visits by patients, but mean was not. Spatial averaging of r EM also may not explain heat-induced vulnerability. The r EM model needs update based on observed data at district-level.
42 Conclusion First evaluation of bio-climatic impact assessment system (BioCAS) based on real-world observed human response to heat waves. It was evaluated at district-level by comparing the mortality and hospital visits by patients to the assessed heat impact. Spatial maximum or minimum of heat wave impact was more important than mean values. The evaluation demonstrated that the localized heat wave vulnerability by buildings and vegetation did cause deaths and other health problems. Building-resolving analysis is essential for bio-climatic assessment!
The impact of urban geometry on the radiant environment in outdoor spaces
 ICUC9 9 th International Conference on Urban Climate 20 th -24 th July 2015, Toulouse, France The impact of urban geometry on the radiant environment in outdoor spaces Christina Chatzipoulka*, Marialena
J17.3 Impact Assessment on Local Meteorology due to the Land Use Changes During Urban Development in Seoul
 J17.3 Impact Assessment on Local Meteorology due to the Land Use Changes During Urban Development in Seoul Hae-Jung Koo *, Kyu Rang Kim, Young-Jean Choi, Tae Heon Kwon, Yeon-Hee Kim, and Chee-Young Choi
Comparing the Relationships Between Heat Stress Indices and Mortality in North Carolina
 Comparing the Relationships Between Heat Stress Indices and Mortality in North Carolina Jordan Clark PhD Student CISA Research Assistant Department of Geography UNC-Chapel Hill 10/30/2018 Overview Background
Statistical methods for evaluating air pollution and temperature effects on human health
 Statistical methods for evaluating air pollution and temperature effects on human health Ho Kim School of Public Health, Seoul National University ISES-ISEE 2010 Workshop August 28, 2010, COEX, Seoul,
Validation Results of a Spatially Fine-Scale Air Temperature Statistical Model in New York City
 Validation Results of a Spatially Fine-Scale Air Temperature Statistical Model in New York City Brian Vant-Hull, Maryam Karimi, Awalou Sossa, Louis Waxman, Estatio Guiterrez, Sarah Johnson*, Rouzbeh Nazari
Analysis of wind and radiant environment in street canyons for production of urban climate maps at district scale
 Academic Article Journal of Heat Island Institute International Vol. 12-2 (217) Analysis of wind and radiant environment in street canyons for production of urban climate maps at district scale Hideki
RELATIONSHIP BETWEEN MEAN RADIANT TEM- PERATURE AND SOLAR ANGLE FOR PEDESTRIANS
 M. A. Schnabel (ed.), Cutting Edge: 47 th International Conference of the Architectural Science Association, pp. 251 260. 2013, The Architectural Science Association (ANZAScA), Australia RELATIONSHIP BETWEEN
Mapping of UTCI in local scale (the case of Warsaw) Krzysztof BłaŜejczyk
 Krzysztof BłaŜejczyk") Prace i Studia Geograficzne WGSR UW, 47, 2011, p. 275-283 Mapping of UTCI in local scale (the case of Warsaw) Krzysztof BłaŜejczyk Faculty of Geography and Regional Studies, University of Warsaw, Poland
Prace i Studia Geograficzne WGSR UW, 47, 2011, p. 275-283 Mapping of UTCI in local scale (the case of Warsaw) Krzysztof BłaŜejczyk Faculty of Geography and Regional Studies, University of Warsaw, Poland
Heat Stroke Information in Japan.
 Heat Stroke Information in Japan. Michihiko Tonouchi (*1), Masaji Ono (*2),Koji Murayama (*1) *1 Japan Meteorological Business Support Center, Japan *2 National Institute for Environmental Studies, Japan
DEVELOPMENT OF ROAD SURFACE TEMPERATURE PREDICTION MODEL
 International Journal of Civil, Structural, Environmental and Infrastructure Engineering Research and Development (IJCSEIERD) ISSN(P): 2249-6866; ISSN(E): 2249-7978 Vol. 6, Issue 6, Dec 2016, 27-34 TJPRC
Examples of using gridded observed climate datasets at the Finnish Environment Institute
 Examples of using gridded observed climate datasets at the Finnish Environment Institute Stefan Fronzek, Timothy Carter, Nina Pirttioja Finnish Environment Institute (SYKE) Workshop New gridded climate
Prognostication of Ozone Concentration in the Air
 Prognostication of Ozone Concentration in the Air Nedialkov D. 1, Angelova M. 2, Krastev A. 1, Hristova H. 1 1 Institute of Control and System Research Bulgarian Academy of Science 2 Acad. G. Bonchev Str.,
Thermal Comfort Conditions for a Tropical City, Salvador Brazil
 September 2004 Page 1 of 1 Thermal Comfort Conditions for a Tropical City, Salvador Brazil Telma Andrade 1,2, Jussana Nery 1, Tereza Freire 1, Lutz Katzschner 3 and Danilo Fortuna 1 1 Federal University
Energy flows and modelling approaches
 Energy flows and modelling approaches Energy flows in buildings external convection infiltration & ventilation diffuse solar external long-wave radiation to sky and ground local generation fabric heat
ANALYSIS OF URBAN LOCAL CLIMATE USING IN-SITU MEASUREMENTS
 ANALYSIS OF URBAN LOCAL CLIMATE USING IN-SITU MEASUREMENTS CSENGE DIAN 1, RITA PONGRÁCZ 1, JUDIT BARTHOLY 1, ZSUZSANNA DEZSŐ 1 ABSTRACT. - Analysis of Urban Local Climate Using In-Situ Measurements Concentrated
Naoshi Kakitsuba * Meijo University, JAPAN
 1C.7 ANALYSES OF ENVIRONMENTAL FACTORS AFFECTING CHANGE IN MICROCLIMATE Naoshi Kakitsuba * Meijo University, JAPAN 1. INTRODUCTION Microclimate in Japan has been extensively studied by meteorologists (for
Hourly Solar Radiation Analysis of Buildings within 48 Facings in FuZhou, China
 UIA 2017 Seoul World Architects Congress O-0201 ourly Solar Radiation Analysis of Buildings within 48 Facings in FuZhou, China Chou, Chia-Peng *1, Yu, Zhihong * 2 1 Professor, College of Architecture and
Lecture 5: Greenhouse Effect
 Lecture 5: Greenhouse Effect S/4 * (1-A) T A 4 T S 4 T A 4 Wien s Law Shortwave and Longwave Radiation Selected Absorption Greenhouse Effect Global Energy Balance terrestrial radiation cooling Solar radiation
SEASONAL AND DAILY TEMPERATURES
 1 2 3 4 5 6 7 8 9 10 11 12 SEASONAL AND DAILY TEMPERATURES Chapter 3 Earth revolves in elliptical path around sun every 365 days. Earth rotates counterclockwise or eastward every 24 hours. Earth closest
Changes in Earth s Albedo Measured by satellite
 Changes in Earth s Albedo Measured by satellite Bruce A. Wielicki, Takmeng Wong, Norman Loeb, Patrick Minnis, Kory Priestley, Robert Kandel Presented by Yunsoo Choi Earth s albedo Earth s albedo The climate
Application of Unified Model (UM) weather prediction data for rice disease forecast
 weather prediction data for rice disease forecast") Application of Unified Model (UM) weather prediction data for rice disease forecast Ki Seok Do, Hyo-suk Kim, and Eun Woo Park National Center for Agricultural Meteorology Seoul National University Moon
Application of Unified Model (UM) weather prediction data for rice disease forecast Ki Seok Do, Hyo-suk Kim, and Eun Woo Park National Center for Agricultural Meteorology Seoul National University Moon
Institut national des sciences appliquées de Strasbourg GENIE CLIMATIQUE ET ENERGETIQUE APPENDICES
 Institut national des sciences appliquées de Strasbourg GENIE CLIMATIQUE ET ENERGETIQUE APPENDICES DEVELOPMENT OF A TOOL, BASED ON THE THERMAL DYNAMIC SIMULATION SOFTWARE TRNSYS, WHICH RUNS PARAMETRIC
Roles of NGII in successful disaster management
 The Second UN-GGIM-AP Plenary Meeting Roles of NGII in successful disaster management Republic of Korea Teheran Iran 28 October 2013 Sanghoon Lee, Ph.D. NGII Outline Type of Disasters Occur in Korea Practical
Why the Earth has seasons. Why the Earth has seasons 1/20/11
 Chapter 3 Earth revolves in elliptical path around sun every 365 days. Earth rotates counterclockwise or eastward every 24 hours. Earth closest to Sun (147 million km) in January, farthest from Sun (152
Ultra-High Resolution Time Traveling AgMet Information from Seeding to Harvesting
 Ultra-High Resolution Time Traveling AgMet Information from Seeding to Harvesting - seamless data for prospect estimation of crop yields - Dec. 5, 2016 Jai-ho Oh & Kyung-Min Choi Dept. Env. & Atmos. Sci.,
Towards a simplified calculation of perceived temperature within the urban canopy layer
 Meteorol. Inst. - MeMi Group Towards a simplified calculation of perceived temperature within the urban canopy layer Jana Fischereit Meteorological Inst., CEN, University of Hamburg, Germany, correspondence:
Radiative Climatology of the North Slope of Alaska and the Adjacent Arctic Ocean
 Radiative Climatology of the North Slope of Alaska and the Adjacent Arctic Ocean C. Marty, R. Storvold, and X. Xiong Geophysical Institute University of Alaska Fairbanks, Alaska K. H. Stamnes Stevens Institute
URBAN HEAT ISLAND IN SEOUL
 URBAN HEAT ISLAND IN SEOUL Jong-Jin Baik *, Yeon-Hee Kim ** *Seoul National University; ** Meteorological Research Institute/KMA, Korea Abstract The spatial and temporal structure of the urban heat island
Daylight and Sun Study
 Ulleråker Existing project Daylight and Sun Study 2018-03-20 New Proposal Shadow Range Analysis from sunrise to sunset on 21st of June for existing condition and new proposal. Daylight Facts Quality: -
Projekt Vorlage. Klima-Herausforderung WM 2022 in Katar Nachhaltige Konzepte zwischen Klimaanlage und künstlicher Wolke
 TRANSSOLAR KLIMAENGINEERING Technologies for energy efficient design and thermal comfort in buildings Stuttgart - Munich - New York Dipl.-Ing. Martin Engelhardt Dr. Wolfgang Kessling Projekt Vorlage Klima-Herausforderung
ASSESSMENT OF THERMAL SENSATION OF RESIDENTS IN THE SOUTHERN GREAT PLAIN, HUNGARY
 ASSESSMENT OF THERMAL SENSATION OF RESIDENTS IN THE SOUTHERN GREAT PLAIN, HUNGARY KOVÁCS A. 1, KÁNTOR NOÉMI 2, ÉGERHÁZI LILLA ANDREA 1 ABSTRACT. Assessment of thermal sensation of residents in the Southern
Memo. I. Executive Summary. II. ALERT Data Source. III. General System-Wide Reporting Summary. Date: January 26, 2009 To: From: Subject:
 Memo Date: January 26, 2009 To: From: Subject: Kevin Stewart Markus Ritsch 2010 Annual Legacy ALERT Data Analysis Summary Report I. Executive Summary The Urban Drainage and Flood Control District (District)
Dr. Haritini Tsangari Associate Professor of Statistics University of Nicosia, Cyprus
 Dr. Haritini Tsangari Associate Professor of Statistics University of Nicosia, Cyprus H. Tsangari (presenting) 1, Z. Konsoula 1, S. Christou 1, K. E. Georgiou 2, K. Ioannou 3, T. Mesimeris 3, S. Kleanthous
Evaluating Thermal Comfort in City Life and Its Relation to Socio-Economic Activities
 Evaluating Thermal Comfort in City Life and Its Relation to Socio-Economic Activities Noriko Okamura 1*, Wataru Takeuchi 1, Shin Akatsuka 2 and Kei Oyoshi 3 1 Institute of Industrial Science, The University
Improve Air Ventilation by Better Urban Planning
 Parametric Studies of Urban Morphologies of High Density Cities and Their Air Ventilation Performance under Neutral and Unstable Atmospheric Conditions Using Advanced Large-Eddy Simulations ICUC9, 20 th
GIS and Remote Sensing
 Spring School Land use and the vulnerability of socio-ecosystems to climate change: remote sensing and modelling techniques GIS and Remote Sensing Katerina Tzavella Project Researcher PhD candidate Technology
Climate services in support of the energy transformation
 services in support of the energy transformation EGU 11 April 2018, Vienna, Austria Climate Alberto Troccoli, Sylvie Parey, and the C3S ECEM team O u t l i n e Background of the C3S European Climatic Energy
Mesonet Cattle Comfort Advisor Description Edited May 26, 2016
 Mesonet Cattle Comfort Advisor Description Edited May 26, 2016 INTRODUCTION Comfortable cattle are productive cattle. Comfortable cattle gain better and maintain a higher level of health. The Mesonet Cattle
CIMIS. California Irrigation Management Information System
 CIMIS California Irrigation Management Information System What is CIMIS? A network of over 130 fully automated weather stations that collect weather data throughout California and provide estimates of
Results of the ESA-DUE UHI project
 13/12/2011 Results of the ESA-DUE UHI project Bino Maiheu (bino.maiheu@vito.be), on behalf of the UHI project Outline» Urban heat island problem» The ESA-DUE urban heat island project» UHI air temperature
SENSITIVITY OF THE SURFEX LAND SURFACE MODEL TO FORCING SETTINGS IN URBAN CLIMATE MODELLING
 SENSITIVITY OF THE SURFEX LAND SURFACE MODEL TO FORCING SETTINGS IN URBAN CLIMATE MODELLING Gabriella Zsebeházi PhD supervisor: Gabriella Szépszó Regional Climate Modelling Group, Hungarian Meteorological
A FIRST INVESTIGATION OF TEMPORAL ALBEDO DEVELOPMENT OVER A MAIZE PLOT
 1 A FIRST INVESTIGATION OF TEMPORAL ALBEDO DEVELOPMENT OVER A MAIZE PLOT Robert Beyer May 1, 2007 INTRODUCTION Albedo, also known as shortwave reflectivity, is defined as the ratio of incoming radiation
Open space design strategies based on thermal confort analysis
 Open space design strategies based on thermal confort analysis Lutz Katzschner Department of Architecture and Urban Planning, University Kassel, Germany ABSRTACT: Design strategies for open spaces need
STUDY OF FUTURE WEATHER DATA CONSIDERING GLOBAL AND LOCAL CLIMATE CHANGE FOR BUILDING ENERGY SIMULATION
 STUDY OF FUTURE WEATHER DATA CONSIDERING GLOBAL AND LOCAL CLIMATE CHANGE FOR BUILDING ENERGY SIMULATION Hideki Kikumoto 1, Ryozo Ooka 2, Yusuke Arima 3, And Toru Yamanaka 4 1 Research Associate, Institute
CLIMATE AND BIOCLIMATE INFORMATION FOR TOURISM THE EXAMPLE OF EVROS PREFECTURE. A. Matzarakis
 CLIMATE AND BIOCLIMATE INFORMATION FOR TOURISM THE EXAMPLE OF EVROS PREFECTURE A. Matzarakis Meteorological Institute, University of Freiburg, D-79085 Freiburg, Germany andreas.matzarakis@meteo.uni-freiburg.de
The Arable Mark: Accuracy and Applications
 The Arable Mark: Accuracy and Applications January 7, 2018 Overview Physical and Biological Observations Precipitation Air temperature, humidity, pressure Shortwave (SW) radiation (down & upwelling) Longwave
Interannual variation of MODIS NDVI in Lake Taihu and its relation to climate in submerged macrophyte region
 Yale-NUIST Center on Atmospheric Environment Interannual variation of MODIS NDVI in Lake Taihu and its relation to climate in submerged macrophyte region ZhangZhen 2015.07.10 1 Outline Introduction Data
A Survey of Refuge and Evacuation Path on Seoul Flood Disaster Information Map
 , pp.142-146 http://dx.doi.org/10.14257/astl.2015.89.29 A Survey of Refuge and Path on Seoul Flood Disaster Information Map Ji-Eun Sun 1, Ji-Soo Lee 2, Won-Hwa Hong 3, 1 Graduate Student, Department of
Expanding Boundaries: Systems Thinking for the Built Environment
 Distributed Energy Systems and Infrastructure 9 TOPIC & PROGRAM WORKSHOPS KEYNOTE SPEAKERS PANEL DISCUSSION CONFERENCE PAPERS SITE VISITS APPENDIX Kämpf, Jérôme Zurich, June 5-7 6 Sustainable Built Environment
PREDICTING OVERHEATING RISK IN HOMES
 PREDICTING OVERHEATING RISK IN HOMES Susie Diamond Inkling Anastasia Mylona CIBSE Simulation for Health and Wellbeing 27th June 2016 - CIBSE About Inkling Building Physics Consultancy Susie Diamond Claire
Building Energy Demand under Urban Climate and Climate Change conditions with consideration of Urban Morphology and Building Typology
 Building Energy Demand under Urban Climate and Climate Change conditions with consideration of Urban Morphology and Building Typology - GIS Mapping of the City of Stuttgart Limei Ji Fazia Ali-Toudert 1,
Reducing Vulnerability to Extreme Heat: Science-Policy Interface
 Reducing Vulnerability to Extreme Heat: Science-Policy Interface Olga Wilhelmi, Mary Hayden, Jennifer Boehnert, Ursula Lauper and SIMMER research team October 23, 2013 Toronto SIMMER workshop Science-Policy
Satellite Observations and Climate Modeling: What They Can and Cannot Reveal About Future Climate
 Satellite Observations and Climate Modeling: What They Can and Cannot Reveal About Future Climate INCOSE Chesapeake Chapter JHU/APL March 21, 2012 Albert Arking Dept of Earth and Planetary Sciences Johns
Long term weather trends in Phaltan, Maharashtra. French intern at NARI, student from Ecole Centrale de Lyon, Ecully 69130, France.
 Long term weather trends in Phaltan, Maharashtra A. Jacob and Anil K. Rajvanshi French intern at NARI, student from Ecole Centrale de Lyon, Ecully 693, France. Director NARI, Nimbkar Agricultural Research
DEPENDENCE OF URBAN TEMPERATURE ELEVATION ON LAND COVER TYPES. Ping CHEN, Soo Chin LIEW and Leong Keong KWOH
 DEPENDENCE OF URBAN TEMPERATURE ELEVATION ON LAND COVER TYPES Ping CHEN, Soo Chin LIEW and Leong Keong KWOH Centre for Remote Imaging, Sensing and Processing, National University of Singapore, Lower Kent
MÉRA: Met Éireann ReAnalysis Global Shortwave Radiation
 MÉRA: Met Éireann ReAnalysis Global Shortwave Radiation Emily Gleeson, Met Éireann Kristian Pagh Nielsen, DMI Eoin Whelan, Met Éireann Special thanks to the ALADIN- HIRLAM consortium Some facts about MÉRA
Looking at Communities: Comparing Urban and Rural Neighborhoods
 Looking at Communities: Comparing Urban and Rural Neighborhoods OVERVIEW & OBJECTIVES Our urban areas have become so dominant that frequently the children we teach have no connection with and very few
SOUTH MOUNTAIN WEATHER STATION: REPORT FOR QUARTER 2 (APRIL JUNE) 2011
 2011") SOUTH MOUNTAIN WEATHER STATION: REPORT FOR QUARTER 2 (APRIL JUNE) 2011 Prepared for ESTANCIA BASIN WATERSHED HEALTH, RESTORATION AND MONITORING STEERING COMMITTEE c/o CLAUNCH-PINTO SOIL AND WATER CONSERVATION
SOUTH MOUNTAIN WEATHER STATION: REPORT FOR QUARTER 2 (APRIL JUNE) 2011 Prepared for ESTANCIA BASIN WATERSHED HEALTH, RESTORATION AND MONITORING STEERING COMMITTEE c/o CLAUNCH-PINTO SOIL AND WATER CONSERVATION
Impact on Agriculture
 Weather Variability and the Impact on Agriculture InfoAg 2017 Copyright 2017, awhere. All Rights Reserved The Problem: The Earth s Atmosphere is a Heat Engine In transition 1 C warming of atmosphere Triples
Urban-rural humidity and temperature differences in the Beijing area
 Theor Appl Climatol (9) 9:1 7 DOI 1.17/s7 ORIGINAL PAPER Urban-rural humidity and temperature differences in the Beijing area Weidong Liu & Huanling You & Junxia Dou Received: 5 June 7 /Accepted: 7 March
Health-related Weather Forecasts in Korea: Current Status and Perspectives
 13 Health-related Weather Forecasts in Korea: Current Status and Perspectives Jiyoung KIM 1*, Heon-Ae KIM 2, Byoung-Cheol CHOI 1, Youngsin CHUN 3, Kyu Rang KIM 1, Dae-Geun LEE 1, Jae-Won OH 4, Il Kyu YANG
Modelling the Atmospheric Urban Heat Island and its Contributing Spatial Characteristics
 the Atmospheric Urban Heat Island and its Contributing Characteristics The Case of The Hague, the Netherlands Anna-Maria Ntarladima Alexander Wandl Hugo Ledoux 02/11/2016 Urban Heat Island (UHI) is a phenomenon
Study on Links between Cerebral Infarction and Climate Change Based on Hidden Markov Models
 International Journal of Social Science Studies Vol. 3, No. 5; September 2015 ISSN 2324-8033 E-ISSN 2324-8041 Published by Redfame Publishing URL: http://ijsss.redfame.com Study on Links between Cerebral
EXPLORING THE URBAN HEAT ISLAND INTENSITY OF DUTCH CITIES
 EXPLORING THE URBAN HEAT ISLAND INTENSITY OF DUTCH CITIES L.W.A. van Hove 1,2, C.M.J. Jacobs 3, B.G. Heusinkveld 1, J.A. Elbers 3, G.J. Steeneveld 1, S. Koopmans 1, E.J. Moors 3, A.A.M. Holtslag 1 1 Wageningen
Treatment of Land-Use and Urbanization
 Treatment of Land-Use and Urbanization LECTURE 9 Alexander Mahura Danish Meteorological Institute, DMI, Copenhagen, Denmark NetFAM Summer School on Integrated Modelling 7-12 July 2008, Zelenogorsk, Russia
P1.34 MULTISEASONALVALIDATION OF GOES-BASED INSOLATION ESTIMATES. Jason A. Otkin*, Martha C. Anderson*, and John R. Mecikalski #
 P1.34 MULTISEASONALVALIDATION OF GOES-BASED INSOLATION ESTIMATES Jason A. Otkin*, Martha C. Anderson*, and John R. Mecikalski # *Cooperative Institute for Meteorological Satellite Studies, University of
Mobile Meteorological Measurements during the 2015 Toronto Games
 Mobile Meteorological Measurements during the 2015 Toronto Games PanAm/ParaPanAm Legacy Workshop January 12, 2017 Timothy Wiechers & James Voogt Overview A total of 23 vehicle traverses were completed
Lecture 5: Greenhouse Effect
 /30/2018 Lecture 5: Greenhouse Effect Global Energy Balance S/ * (1-A) terrestrial radiation cooling Solar radiation warming T S Global Temperature atmosphere Wien s Law Shortwave and Longwave Radiation
ECMWF global reanalyses: Resources for the wind energy community
 ECMWF global reanalyses: Resources for the wind energy community (and a few myth-busters) Paul Poli European Centre for Medium-range Weather Forecasts (ECMWF) Shinfield Park, RG2 9AX, Reading, UK paul.poli
Remote Sensing Applications for Land/Atmosphere: Earth Radiation Balance
 Remote Sensing Applications for Land/Atmosphere: Earth Radiation Balance - Introduction - Deriving surface energy balance fluxes from net radiation measurements - Estimation of surface net radiation from
Critical review of the Climate Change Impact on urban areas by assessment of Heat Island effect
 Critical review of the Climate Change Impact on urban areas by assessment of Heat Island effect Case of Pune, India Town Planning, Civil Department Prof. Omkar Parishwad, ogp.civil@coep.ac.in Climate Change
Improving the accuracy of solar irradiance forecasts based on Numerical Weather Prediction
 Improving the accuracy of solar irradiance forecasts based on Numerical Weather Prediction Bibek Joshi, Alistair Bruce Sproul, Jessie Kai Copper, Merlinde Kay Why solar power forecasting? Electricity grid
Elements of a subseasonal-to-seasonal excessive heat outlook system (SEHOS) Augustin Vintzileos
 Augustin Vintzileos") Elements of a subseasonal-to-seasonal excessive heat outlook system (SEHOS) Augustin Vintzileos University of Maryland ESSIC/CICS This study is supported by NOAA grants: NA15OAR4310081 NA14NES4320003 NA16OAR4310147
Elements of a subseasonal-to-seasonal excessive heat outlook system (SEHOS) Augustin Vintzileos University of Maryland ESSIC/CICS This study is supported by NOAA grants: NA15OAR4310081 NA14NES4320003 NA16OAR4310147
Spectrum of Radiation. Importance of Radiation Transfer. Radiation Intensity and Wavelength. Lecture 3: Atmospheric Radiative Transfer and Climate
 Lecture 3: Atmospheric Radiative Transfer and Climate Radiation Intensity and Wavelength frequency Planck s constant Solar and infrared radiation selective absorption and emission Selective absorption
TELE-EPIDEMIOLOGY URBAN MALARIA MAPPING
 TELE-EPIDEMIOLOGY URBAN MALARIA MAPPING Ministère de la Défense Vanessa Machault Advances in Geospatial Technologies for Health 12-13/09/2011 Objective To develop a robust pre-operational methodology to
EPIDEMIOLOGY FOR URBAN MALARIA MAPPING
 TELE-EPIDEMIOLOGY EPIDEMIOLOGY FOR URBAN MALARIA MAPPING @IRD/M Dukhan Vanessa Machault Observatoire Midi-Pyrénées, Laboratoire d Aérologie Pleiades days 17/01/2012 The concept of Tele-epidemiology The
Ramani Geosystems. Putting Africa On The Map. Authorized Resellers
 Ramani Geosystems Putting Africa On The Map Authorized Resellers Ramani Profile Started in 1999 Aerial, Land Surveying & Mapping Solutions + 10 Countries in the region + 80 Staff working in projects Asset
Outdoor Thermal Comfort and Local Climate Change: Exploring Connections
 Outdoor Thermal Comfort and Local Climate Change: Exploring Connections ROBERTA COCCI GRIFONI 1, MARIANO PIERANTOZZI 2, SIMONE TASCINI 1 1 School of Architecture and Design E. Vittoria, University of Camerino,
Lecture 3: Atmospheric Radiative Transfer and Climate
 Lecture 3: Atmospheric Radiative Transfer and Climate Solar and infrared radiation selective absorption and emission Selective absorption and emission Cloud and radiation Radiative-convective equilibrium
Accuracy of Meteonorm ( )
") Accuracy of Meteonorm (7.1.6.14035) A detailed look at the model steps and uncertainties 22.10.2015 Jan Remund Contents The atmosphere is a choatic system, not as exactly describable as many technical
Accuracy of Meteonorm (7.1.6.14035) A detailed look at the model steps and uncertainties 22.10.2015 Jan Remund Contents The atmosphere is a choatic system, not as exactly describable as many technical
 In a small time t: BMR; BMR BMR BMR BMR BMR The brain constitutes only 2.5% of body weight, but is responsible for 20% of the BMR (dreams). It requires a fair amount of oxygen consumption. Weight
Seasonal Variations of the Urban Heat Island Effect:
 Seasonal Variations of the Urban Heat Island Effect: Examining the Differences in Temperature Between the City of Philadelphia and its Outlying Suburbs By: Frank Vecchio 1 P a g e We re calling for a high
Maggie M. Kovach. Department of Geography University of North Carolina at Chapel Hill
 Maggie M. Kovach Department of Geography University of North Carolina at Chapel Hill Rationale What is heat-related illness? Why is it important? Who is at risk for heat-related illness and death? Urban
Be relevant and effective thinking beyond accuracy and timeliness
 The Fourth Technical Conference on the Management of Meteorological and Hydrological Services in WMO RA II (Asia) Be relevant and effective thinking beyond accuracy and timeliness C. Y. LAM Hong Kong Observatory
ASSESSING CLIMATE CHANGE IN CITIES USING URBCLIM. Hooyberghs, H.; De Ridder, K.; Lauwaet, D.; Maiheu, B.; Lefebvre, W.
 ASSESSING CLIMATE CHANGE IN CITIES USING URBCLIM Hooyberghs, H.; De Ridder, K.; Lauwaet, D.; Maiheu, B.; Lefebvre, W. Overview» The urban heat island» UrbClim model» Description» Validation» Current climate
Mass Concentration and Size-Distribution of Atmospheric Particulate Matter in an Urban Environment
 Mass Concentration and Size-Distribution of Atmospheric Particulate Matter in an Urban Environment Sabrina Rovelli 1, Andrea Cattaneo 1, Francesca Borghi 1, Andrea Spinazzè 1, Davide Campagnolo 2, Andreas
Understanding Weather and Climate Risk. Matthew Perry Sharing an Uncertain World Conference The Geological Society, 13 July 2017
 Understanding Weather and Climate Risk Matthew Perry Sharing an Uncertain World Conference The Geological Society, 13 July 2017 What is risk in a weather and climate context? Hazard: something with the
Surface temperature what does this data tell us about micro-meteorological processes?
 Surface temperature what does this data tell us about micro-meteorological processes? Prof. Dr. Eberhard Parlow Meteorology, Climatology and Remote Sensing (MCR Lab) Department of Environmental Sciences
NCEP non-hydrostatic regional model and surface scheme LAPS: A dynamical scaling tool for use in agricultural models
 NCEP non-hydrostatic regional model and surface scheme LAPS: A dynamical scaling tool for use in agricultural models D.T. Mihailović and B. Lalić Faculty of Agriculture, University of Novi Sad, Novi Sad,
Ozone: Earth s shield from UV radiation
 Outline Ozone: Earth s shield from UV radiation Review electromagnetic radiation absorptivity by selective gases temperature vs. height in atmosphere Ozone production and destruction natural balance anthropogenic
Urban Integrated Services and Multi-Hazard Early Warning Systems
 WMO for UN New Urban Agenda Urban Integrated Services and Multi-Hazard Early Warning Systems Gregory R. Carmichael WMO WMO Priority: Urbanization - Research and services for megacities and large urban
Heat and Health: Reducing the Impact of the Leading Weather-Related Killer
 Heat and Health: Reducing the Impact of the Leading Weather-Related Killer Laurence S. Kalkstein, Ph.D. Department of Public Health Sciences Miller School of Medicine University of Miami June, 2017 Quick
Chapter 2 Solar and Infrared Radiation
 Chapter 2 Solar and Infrared Radiation Chapter overview: Fluxes Energy transfer Seasonal and daily changes in radiation Surface radiation budget Fluxes Flux (F): The transfer of a quantity per unit area
Extreme Weather Events: Infrastructure Damage and Impact on Vulnerable Populations
 Extreme Weather Events: Infrastructure Damage and Impact on Vulnerable Populations Cindy L. Parker MD, MPH Physicians for Social Responsibility Johns Hopkins Bloomberg School of Public Health 1 Climate
RAYMAN: A TOOL FOR TOURISM AND APPLIED CLIMATOLOGY. A. Matzarakis 1 and F. Rutz 2.
 RAYMAN: A TOOL FOR TOURISM AND APPLIED CLIMATOLOGY A. Matzarakis 1 and F. Rutz 2 1 Meteorological Institute, University of Freiburg, Freiburg, Germany 2 Fraunhofer Institute for Applied Solid-State Physics,
Determining the Optimal Grid Size of Local Climate Zones for Spatial Mapping in High-density Cities
 Determining the Optimal Grid Size of Local Climate Zones for Spatial Mapping in High-density Cities Kevin Ka-Lun Lau, Chao Ren, Yuan Shi, Venessa Zheng,, Hong Kong Background Urbanization results in distinctive
Nicole Mahlkow (FU Berlin)
") Nicole Mahlkow (FU Berlin) Heat - a risk factor Foto: Patrick Pleul / DPA Challenges for cities Source: UNISDR Prevention Web: Europe, heat wave events, 1980-2008 Source: US National Oceanic and Atmospheric
Nicole Mahlkow (FU Berlin) Heat - a risk factor Foto: Patrick Pleul / DPA Challenges for cities Source: UNISDR Prevention Web: Europe, heat wave events, 1980-2008 Source: US National Oceanic and Atmospheric
Multi-scale Modelling of Chicago Urban Heat Island and Climate- Change Impacts
 Multi-scale Modelling of Chicago Urban Heat Island and Climate- Change Impacts Patrick Conry, Ashish Sharma, Mark Potosnak, Jessica Hellmann, and H.J.S. Fernando Chicago Heat Island Chicago and Climate
Zachary Holden - US Forest Service Region 1, Missoula MT Alan Swanson University of Montana Dept. of Geography David Affleck University of Montana
 Progress modeling topographic variation in temperature and moisture for inland Northwest forest management Zachary Holden - US Forest Service Region 1, Missoula MT Alan Swanson University of Montana Dept.
Aalborg Universitet. CLIMA proceedings of the 12th REHVA World Congress Heiselberg, Per Kvols. Publication date: 2016
 Aalborg Universitet CLIMA 2016 - proceedings of the 12th REHVA World Congress Heiselberg, Per Kvols Publication date: 2016 Document Version Final published version Link to publication from Aalborg University