DESIGN ENGINEERING ANALYSIS FOR TERMINAL GROIN LENGTH
|
|
|
- Derrick Mills
- 5 years ago
- Views:
Transcription
1 APPENDIX I DESIGN ENGINEERING ANALYSIS FOR TERMINAL GROIN LENGTH (Prepared by Olsen Associates, Inc.) Final Environmental Impact Statement Village of Bald Head Island Shoreline Protection Project Brunswick County, North Carolina
2 An Evaluation of Varying Terminal Groin Lengths and the Feasibility of Phasing Construction Olsen Associates, Inc Herschel Street Jacksonville, FL (904) September 23, 2013 An initially preferred (maximum) design length for the proposed terminal groin on Bald Head Island was investigated through extrapolation of numerical model results and application of practical coastal engineering principles and experience. The resulting analysis focused on the potential ability of different terminal groin lengths to protect varying lengths of updrift shoreline along South Beach while minimizing negative impacts to the downdrift (west) beaches. For purposes of discussion, the predicted performance of three (3) conceptual terminal groin lengths were compared: a short groin (~1,100 feet total length), a mid-length groin (~1,900 feet total length), and a long groin (~2,900 feet total length). The landward point of attachment and general structural orientation of each groin alternative are self-similar. Each alternative was considered to be relatively permeable with respect to its ability to allow some level of sand transport over and through the structure. This is in contrast to conventional groin or jetty structures which are typically designed to be sand-tight. The spatial extent of updrift benefits associated with a leaky terminal groin will be essentially proportional to the length of the terminal structure. Conversely, it is expected that at some point, potentially negative downdrift impacts are also proportional to increasing structure length. A mid-length terminal groin therefore appears to offer an acceptable balance between maintaining the updrift objective of the structure while minimizing the probability of downdrift impacts. The primary purpose of a terminal groin at Bald Head is to stabilize the westernmost segment of South Beach nearest the inlet channel and to protect both private and public upland structures and infrastructure from chronic coastal erosion occurring immediately eastward thereof. Sediment transport at this location is directed strongly towards the inlet, in the net. Numerical studies and physical monitoring both indicate that the rate of alongshore sediment transport accelerates with proximity to the inlet. Once beach sediments reach the inlet they are either transported into the navigation channel or deposited into various shoal formations. In either event these sediments are effectively lost from the littoral system on Bald Head resulting in beach profile erosion that is significant enough to warrant repeated application of erosion control 1 olsen associates, inc.
3 measures along the affected South Beach shoreline via beach fill, placement of sand filled tube groins, and sand bag revetments. Over the last 12 years, the shoreline orientation at the west end of Bald Head has progressively rotated clockwise to an increasing north-to-south orientation thereby resulting in increased obliqueness between the island and incident breaking waves (see Figure 1). This relationship is currently a significant factor in the chronically increasing rate of sediment transport off the island at this location. The installation of a terminal groin and episodic beach fill are intended to strategically reorient the shoreline counter-clockwise to a more northwest-to-southeast orientation. This will decrease the effective angle between the shoreline and incident breaking waves -- thereby reducing sediment transport along the South Beach shoreline segment nearest the inlet. Simplistically, the resultant amount of shoreline reorientation can be considered to be directly dependent upon the effective length of any terminal groin constructed and its associated updrift impoundment fillet. Along westernmost South Beach on Bald Head Island, three fundamental shoreline orientations are currently evident, A, B, and C, as presented in Figure 1. Shoreline orientation A, which trends north-to-south, is associated with the aforementioned highest present-day erosional segment of South Beach. Future terminal groin performance will be predicated on developing a stable westerly extension more typical of shoreline orientation B throughout the chronically eroded westernmost reach thereby essentially reversing the significant negative effects that currently exist with orientation A. Establishing or approaching some variation of orientation B in the long-term, in order to decrease the strong erosional gradient existing along west Bald Head Island, requires large-scale structural stabilization such as a terminal groin of suitable length. 2 olsen associates, inc.
 fails to achieve the most desirable shoreline orientation (i.e., B).")
4 Figure 1: Fundamental shoreline orientations, A, B, and C, observed along western Bald Head Island. It can be readily seen that a very short groin alternative of 1,100 ft or less in length (see Figure 2) fails to achieve the most desirable shoreline orientation (i.e., B). Hence its expected updrift impoundment effect does not necessarily extend throughout the most critically eroded section of developed shorefront. Instead, the westerly extension of orientation B forms the basis for defining the requisite length of the mid-length terminal groin (see Figure 3), for which the updrift effects are predicted to extend through the critically eroded area. To emulate the westerly extension of orientation C would require a significantly longer terminal structure approaching 2,900 feet (see Figure 4). Conversely, the updrift effects of a long terminal groin would likely extend eastward through most of the existing sand tube groinfield; however, it entails an exceptionally long structural footprint and presents much greater potential for adverse impacts to both of the inlet-facing shorelines located northward thereof (i.e., the Point and West Beach). The calibrated Delft3D model was employed in order to predict the short- and long-term responses to construction of the proposed mid-length terminal groin. Delft3D model simulations are described by Olsen (2013). The results suggest that the mid-length terminal groin is capable of protecting currently threatened upland infrastructure and residential structures while reducing sediment transport along western Bald Head Island to rates consistent with those computed under historic shoreline conditions -- without significant or wide-spread downdrift impacts, relative to 3 olsen associates, inc.
5 existing conditions. In order to ensure adequate post-construction sand bypassing such a structure would necessitate constructing a ~0.5 Mcy fillet of sand immediately updrift of the structure. Implementation would likewise need to be coincident with a federal beach disposal project that would function as a feeder beach. Extrapolation of the numerical modeling results for the mid-length terminal groin was employed to initially infer the predicted physical performance of the shorter and longer terminal groin alternatives. For example, given the smaller post-construction impoundment fillet supported by the very short groin (Figure 2) this structure was predicted to offer benefits more akin to those afforded by the existing sand tube groins (with fill), albeit somewhat enhanced. That is, the area of direct updrift benefit is somewhat limited in scope and leaves several beachfront structures reliant upon the continued maintenance of the sand tube groins. Given that the Delft3D modeling of the mid-length groin suggests minimal short- and long-term downdrift impacts relative to existing conditions, it is reasonable to conclude that the increased sediment supply afforded by a shorter terminal structure would likewise achieve similar minimal downdrift impacts. However, relative to the mid-length structure a short terminal groin would over time allow a greater volume of sediment to pass onto the downdrift beaches. Moderation of this effect would be afforded by strategic beach disposal to the east on South Beach. Conversely, extending the terminal groin a significant length beyond the mid-length shore normal dimension in order to maximize updrift impoundment potential (i.e., in general accordance with shoreline orientation C), would require a structure similar in length to that shown in Figure 4. The resulting fillet is defined by a shoreline that is nearly east-west in orientation and spans nearly the entire existing tube groin field. While theoretically possible, the resultant shoreline configuration would exceed that which would be expected at the terminal end of a barrier island at this location. In contrast to post-construction sediment transport rates predicted for the mid-length terminal groin, the very long terminal groin is likely to result in development of multiple updrift transport reversals including an increased potential for episodic crenulate bay formation immediately eastward of the structure. Additionally, the transport of sediment through and/or over the long terminal groin would likely occur predominantly near the structure s seaward terminus. This, combined with the overall length of the structure, suggests a decreased potential for sand to reach the downdrift shoreline, with sediment instead principally directed towards the navigation channel and/or onto Bald Head Shoal. Such a condition would be highly impactive to the Point and to West Beach. From the preliminary investigation, it was concluded that the mid-length permeable terminal groin (on the order of 1,900 feet in total length, or less) is the longest length to reasonably and successfully achieve the objectives of decreasing erosion along the western end of South Beach and extending the easternmost limit of benefit. It is noted that this effective length was defined on the basis of the 2012 eroded shoreline location and includes a tie-back into both the existing 4 olsen associates, inc.
 mean high water location.")
6 upland and the requirement of a 0.5 Mcy fillet to be constructed concurrently with structure implementation. Hence, much of the structure stem would be below grade thereby resulting in an effectively much shorter length relative to the new (post-construction) mean high water location. Figure 2: Conceptual illustration of updrift performance of a short terminal groin. 5 olsen associates, inc.
7 Figure 3: Conceptual illustration of updrift performance of a mid-length terminal groin. 6 olsen associates, inc.
8 Figure 4: Conceptual illustration of updrift performance of a long terminal groin. The Village of Bald Head Island intends to permit the construction of a terminal structure extending a maximum of 1,900 ft +/- in length seaward of the existing, seaward-most upland dune line. Such a project would be initiated in concert with a federal beach disposal project constructed eastward thereof in order to maximize benefits to the South Beach littoral system. Additional sand beyond that placed by the federal maintenance dredging and disposal to the beach would need to be placed updrift of an approximately 1,900 ft long terminal groin in order to facilitate rapid and complete infilling of the requisite sand fillet at the structure. A 7 olsen associates, inc.
9 supplementary sand (borrow) source located at Jay Bird Shoals would be required to dredge and place approximately 0.5 Mcy of sand needed for fillet creation. In order to expedite beneficial post-groin shoreline equilibration conditions (both updrift and downdrift of the structure, and including formation of the sand fillet), the Village will permit the option to address construction of a terminal groin in Two phases. Phase I would first construct the landward two-thirds of the structure s overall length, more or less, coincident with the next beach disposal of dredged material from the navigation channel. Phase II would extend the seaward end of the structure to complete the structure s overall length, at an appropriately timed future date. A Phase I structure (currently estimated at 1,300 ft +/- in length) would be shorter than the terminal groin s overall design length, but is nonetheless deemed sufficient to initiate stabilization of the western limit of South Beach through beneficial shoreline realignment and associated reduction of sediment losses to the inlet. Moreover, the shorter Phase I structure is expected to be more conducive to the timely facilitation of sand bypassing to the downdrift shoreline. Supplementary sand source requirements for a Phase I structure would be substantially less. Fillet formation through entrapment of sand placed upon South Beach from the federal channel dredging may potentially obviate the immediate need for the use of a remote (additional) sand source. At the very least, supplementary sand placement if deemed necessary, would be substantially reduced over the 0.5 Mcy initially required for the full 1,900 ft structure. Additional numerical modeling analyses for a 1,300 foot-long (Phase I) structure were specifically performed for purposes of comparison with existing model results for the full 1,900 ft (Phase II) terminal groin length. More specifically, the Delft3D model was used to simulate the near-term response of Bald Head Island to the construction of a Phase I permeable terminal groin along with periodic beach fill placement. Under this scenario, beach fill sand is derived from both the maintenance dredging of the federal navigation channel and non-federally sponsored beach disposal/nourishment projects. Disposal of maintenance material excavated from the federal project is assumed to be placed onto Bald Head Island in conjunction with two of every three maintenance events, in accordance with the tenets of the current WHSMP. The aforementioned non-federal beach nourishment efforts are intended to supplement the federal disposal during every third maintenance event. For the purposes of this analysis, sand was numerically placed onto Bald Head Island concurrent with channel dredging every three years throughout the nine year model run. For the simulation, the initial modeled bathymetry was identical to that applied to all other longterm modeling efforts conducted in support of developing an EIS. The present bathymetry includes the addition of a semi-permeable terminal groin located at the western end of the Island s South Beach along with the existing sand-filled tube groin field. The modeled terminal groin was approximately 1,300 feet long and is designed to work in conjunction with a beach fill placement east of the structure -- the intent of which is to reorient the shoreline towards the 8 olsen associates, inc.
10 southwest, a more historically appropriate orientation. Initial structural conditions used for model input are shown in Figure 5. The figure graphically compares the Phase I shortened terminal groin to the previously simulated Phase II terminal structure. The Phase I structure therefore represents the partial construction of the originally proposed and modeled 1,900 footlong terminal groin in the EIS documentation (ref: Alternatives 5 and 6). The Phase I terminal groin lies on the same footprint as the full Phase II terminal groin. The Phase I terminal groin was likewise modeled as leaky using porous plates which are by definition infinitely high, semi-permeable numerical structures. The permeability of porous plates is numerically controlled by a friction term, roughly representing a level of permeability between about 10 and 30 percent, which is identical to the Phase II structure previously modeled. The existing tube groins are included in the model and are numerically described as thin dams, which act as impermeable, infinitely high barriers to sediment transport, which are mildly transmissive with respect to wave energy. The depth-averaged Delft3D model of Bald Head Island and the Cape Fear River Entrance was previously calibrated in order to accurately simulate average annual alongshore sediment transport along Bald Head Island s South Beach shoreline (Olsen, 2012). The initial modeled bathymetry comprising the nearshore zone and navigation channel were updated to reflect nearshore conditions existing in spring Nearshore bathymetry was described by survey data measured in May 2011 while upland topography away from the beach was described by LIDAR data collected in 2005/06. Conditions within the navigation channel were initially described by those measured in February 2011 in conjunction with the U.S. Army Corps of Engineers (USACE) condition survey. These conditions describe a generally eroded beach condition and a shoaled navigation channel, particularly in the Bald Head Shoal I and II reaches, as shown in Figure 6. The numerical model was set up in order to simulate periodic channel dredging along with coincident placement of sand onto the Bald Head shoreline. Dredging and/or disposal/nourishment operations were initiated every three years during the simulation. Upon initiation of the dredge and fill operations, the entire navigation channel was numerically dredged to a uniform depth of (44+2) feet, the presently authorized channel depth. All dredge spoils were removed from the model. At the same time step, approximately 1,200,000 cubic yards (cy) of sand were placed onto South Beach within a fixed boundary extending from about Station near the terminal groin to about Station (see Figure 6). The offshore limits of sand placement remain the same as in previously analyzed simulations of the Phase II terminal groin (except in the immediate vicinity of the terminal groin). Relative to the Phase II terminal groin, the eastern limit of fill for the Phase I was adjusted westward in order to accommodate the reduced fill area required for the pre-construction of a fillet updrift of the Phase I groin, which is required by Statute. As such, the simulated western limit of fill includes 9 olsen associates, inc.
 with the")
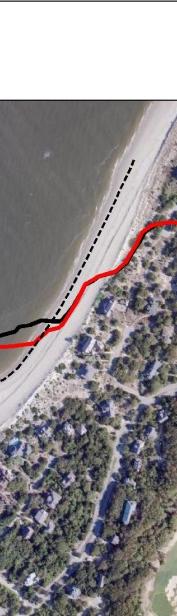
11 the entire length of the terminal groin. For purposes of direct comparison with previous analyses, an initial dredge and sand placement event was specified to occur immediately after the start of the simulation (time zero) with the subsequent events occurring at years 3 and 6. This simulation assumes sediment availability every three years and does not consider the effects of skipping fill placement/disposal on Bald Head Island. Phase I Terminal Groin Phase II Terminal Groin Figure 5: Conceptual illustrations of the presently simulated Phase I terminal groin and the previously modeled Phase II terminal groin (beach disposal not shown). Note: the estimated area of principal terminal groin influence is hypothetical and not based on model results. 10 olsen associates, inc.

12 West Beach The Point Figure 6: Approximate limits of periodic sand placement for simulation of a Phase I terminal groin. In the model simulations, beach placement occurs every three years and is coincident with channel dredging. 11 olsen associates, inc.
13 Figure 7 plots the predicted bathymetry throughout the 9 year simulation for the Phase I terminal groin with sand-filled tube groin scenario. Each pane of the plot represents bathymetries predicted in the project area at years 3, 6, and 9 immediately prior to the next placement/dredge event. The approximate mean lower low water (MLLW) contour is shown in bold for reference in each plot. Areas shaded in green represent those which are expected to remain dry for at least a portion of the tidal cycle typically areas above the MLLW elevation. The model results indicate that with the porous Phase I terminal groin and sand-filled tube groins in-place, the downdrift shoreline, the Point, is expected to remain accretional throughout the 9-year simulation. The majority of this accretion is predicted to occur on the downdrift (west) side of the terminal groin, just north of the structure s landward end. This result is similar to that indicated for the Phase II terminal groin (see Figure 8) although the MLLW shoreline at Point tends to migrate into a broader tidally-influenced shoal feature relative to the Phase I structure. The subaqueous shoal at the seaward end of the Phase I terminal groin, however, is significantly smaller than that resulting from the Phase II groin, which is expected. Figure 9 plots the predicted MLLW contours at years 3, 6, and 9 for the Phase I terminal groin condition. For comparison, Figure 10 plots the predicted MLLW contours at years 3, 6, and 9 following construction of the Phase II terminal groin. The results are similar for both structural lengths and highlight the aforementioned continued accretion of the Point throughout the simulation period under both terminal groin lengths. This is in comparison to a northward rolling back of the Point shoal under each non-terminal groin condition investigated for the EIS documentation (Olsen, 2013). The model indicates continued erosion along portions of West Beach throughout both the Phase I and II terminal groin simulations, which is consistent with existing conditions as well as other non-terminal groin modeling results. The severity of the erosion signal indicated along West Beach (north of the Point) is similar between the Phase I and Phase II results but is likely overstated in both instances. That said, the model predicts that after 9 years the location of the shoreline coincides with the existing escarpment (bluff) along West Beach -- similar erosion patterns in the nearshore portions of West Beach are indicated in all simulations (structural and non-structural), away from areas affected by Point migration (Olsen, 2013). North of the Point, West Beach is generally protected from ocean waves and its location inside the entrance suggests that the principal physical mechanisms for morphological change along West Beach are not solely governed by normal open coast processes. It is likely that sediment transport here is dominated by local wind generated waves, river currents, ship wakes, etc., which, excepting typical currents, are not described in the model. The response along West Beach should therefore be estimated by relative comparison between similar model simulations and not as an absolute prediction of beach response. Such a comparison suggests few significant differences along West Beach as a result of phasing the construction of the terminal groin. 12 olsen associates, inc.
14 Figure 11 compares the predicted MLLW shorelines for the Phase I and II scenarios at year 9 of the simulations. The resulting growth of an impoundment fillet on the east side of the terminal groin in time is clearly visible in both terminal groin scenarios. For the Phase I terminal groin the updrift fillet is predicted to extend through the westernmost three or four existing tube groins by year 9. The remainder of the South Beach shoreline presently within the groin field would continue to be dependent upon their maintenance and performance in order to avoid potential impacts from erosion. For the Phase II terminal groin, the fillet is predicted to extend through the westernmost six or seven tube groins, which should afford greater protection to habitable structures which have historically been at risk within the groin field (principally those which are seaward of the vegetation line). For both terminal groin phases, seaward growth of the fillet slows over time in the model, likely as a result of the terminal groin approaching its capacity with respect to the volume of material is can impound. While the defined beach placement area extends to the seaward end of the terminal groin, the initial disposal event does not create an elevated berm along the eastern edge of the terminal groin due to the nature in which the model places sediment for beach placement. Rather than fully fill the terminal structure with a berm that extends near the groin s seaward end (which is what might be constructed), the Delft3D model inherently places the specified volume of sediment uniformly within the placement area up to a specified berm elevation. This process results in placement of material along the terminal groin at every event. Periodic sand placement along with the natural impoundment of sediment against the terminal groin, results in a more gradual formation of a full berm across the terminal groin. The process indicated herein is likely conservative with respect to the evolution of both the updrift and downdrift shorelines. 13 olsen associates, inc.

15 Figure 7: Bathymetry predicted throughout the simulation at years 3, 6, and 9 for a Phase I groin alternative. Each depicts conditions prior to the subsequent sand placement interval. 14 olsen associates, inc.
16 Figure 8: Bathymetry predicted throughout the simulation at years 3, 6, and 9 for a mid-length groin alternative. Each depicts conditions prior to the subsequent sand placement interval. 15 olsen associates, inc.


17 Initial, t=0 Legend 3 Yrs 6Yrs 9 Yrs Figure 9: Approximate MLLW contour predicted at years 0, 3, 6, and 9 years for the Phase I groin scenario prior to the subsequent sand placement/ dredge event.. 16 olsen associates, inc.


18 Initial, t= 0 Legend 3 Yrs 6Yrs 9 Yrs Figure 10: Approximate MLLW contour predicted at years 0,, 3, 6, and 9 years for the Phase II groin scenario prior to the subsequent sand placement/ dredge event.. 17 olsen associates, inc.


19 Initial, t=0 PHASE EI PHASE II Figure 11 1: Comparison n of MLLW predicted p shoreline contouurs at year 9 fo for the Phase I and Phase III terminal groin g scenario os. 18 olssen associates, inc.
20 Figures 12 through 14 plot the predicted cumulative sedimentation and erosion patterns for the short terminal groin alternative after 3, 6, and 9 years, respectively. Red shading in the model indicates net erosion of the seabed while blue shading suggests net sedimentation. The approximate seaward limit of development is indicated by the black dashed line. The vectors represent the direction and scaled magnitude of mean total transport which is computed throughout the simulation. The effects of recurrent sand placement are included in these results. Similar to the predicted results for the Phase II terminal structure described under separate cover, the model suggests that the South Beach shoreline is effectively maintained by the combination of the Phase I terminal groin, existing tube groins, and periodic sand placement. North of the terminal groin, the model indicates the development of a largely submerged sand platform immediately adjacent to the Phase I terminal groin owing to the transport of sand through, over, and around the structure. Net erosion along the Point and southern West Beach is indicated by the results and is manifest as a northward migration of the existing spit shoal. This erosion does not propagate into the limit of development after 9 years. Further north along West Beach (but away from the numerical boundary), the model predicts erosion which extends to the seaward limit of development after 9 years. This result is consistent with model predictions made for the simulation of existing conditions and does not appear to be induced by either the Phase I or Phase II terminal groins (Olsen, 2013). That said, the results predict a modest increase in erosion of the nearshore which is limited in scope resulting from the Phase I terminal groin. The northern model boundary behaves similarly to all other modeled conditions suggesting no causation between this alternative and the (likely grossly overestimated) erosion predicted there. 19 olsen associates, inc.

21 Accretion Seaward Limit of Development Erosion Figure 12: Cumulative sedimentation and erosion after 3 years for a short terminal groin alternative. The effects of repeated sand placement events are included in this result. 20 olsen associates, inc.
22 Accretion Seaward Limit of Development Erosion Figure 13: Cumulative sedimentation and erosion after 6 years for a short terminal groin alternative. The effects of repeated sand placement events are included in this result. 21 olsen associates, inc.
23 Accretion Seaward Limit of Development Erosion Figure 14: Cumulative sedimentation and erosion after 9 years for a short terminal groin alternative. The effects of repeated sand placement events are included in this result. 22 olsen associates, inc.
24 The Phase I terminal groin model results indicate continued post-construction accretion at the Point, particularly within the subaqueous and tidally influenced portions of this feature. The model suggests continued mild erosion along West Beach under this scenario (see Figure 14). In order to assess the predicted magnitude of downdrift changes attributable to the Phase I terminal groin alternative, the final predicted bathymetries for the Phase I terminal groin and sand-filled tube groin only (existing condition) were directly compared (differenced) and the results are plotted in Figure 15. Red shading in the figure indicates areas where the seabed is lower with the Phase I terminal groin while blue shading indicates areas where the seabed is higher with the Phase I terminal groin, relative to the sand-filled tube groin alternative. The results of this comparative analysis reflect the prediction of a much improved Point condition particularly at the landward base of the terminal groin 9 years after construction of a Phase I terminal groin (blue shading) relative to a tube groin only alternative. The results also suggest relative volume losses which are attributable to the terminal groin along more northerly portions of West Beach principally associated with a reduction in the size of the shoal near the navigation channel (denoted by red shading). These losses represent reduced accretion or increased erosion relative to the results predicted for the tube groin only scenario. It does not appear that the Phase I terminal groin induces large scale downdrift erosion along West Beach. Relative differences in volumetric changes between the Phase I terminal structure and sand-filled tube groin only condition (i.e., Alternative No. 3) west and north of the Phase I terminal groin were computed based on the results shown in Figure 15. Under the Phase I terminal groin scenario, the nearshore area north of the terminal groin (from the landward terminus of the groin northward) is predicted to experience a total relative net volume increase of about +1,785 cy through 9 years. This nearshore net difference is comprised of a gross gain of about +33,842 cy and a gross loss of about -32,057 cy, over the 9 year period. On an average annual basis, the predicted gross losses attributable to the Phase I terminal groin are about -3,600 cy/yr. Gross nearshore gains induced by the Phase I structure tend to align with accretion of the nearshore immediately north of the terminal groin along the Point. Gross nearshore losses induced by the Phase I terminal groin are realized along a narrow reach of northern West Beach and tend to align with an existing escarpment visible in the aerial photography. This volume computation does not include the losses seaward of the -3 or -4m contour as such volume change, interpreted as reduced accretion which is attributable to the Phase I terminal groin s predicted ability to arrest, or slow, the northward migration of the Point which would otherwise occur. Quantification of the predicted volume changes attributable to the Phase I terminal groin along West Beach suggest either little to no direct impacts or those which are mild in scope and mitigated for via the ongoing management of erosion along West Beach, plus an estimated additional 3,600 cy per year to offset the predicted gross effects of the Phase I terminal groin. For reference, the additional sediment requirement along West Beach following construction of the Phase II terminal groin was estimated to be about 5,200 cy/yr, on average (Olsen, 2013). 23 olsen associates, inc.


25 24 Figure 15: Difference in seabed elevation after 9 years between the Phase I terminal groin and sand-tube the seabed is groin only (existing condition) scenario. Red shading in the figure indicates areas where lower with the Phase I terminal groin while blue shading indicates areas where the seabed is higher with the Phase I terminal groin, relative to the sand-filled tube groin alternative.. Along South Beach, the comparison of the with Phase I terminal groin and sand-filled tube groin results suggests that the spatial extent of the shortened terminal groin s impact is limited to an area extending about 400 meters east of the terminal groin (see Figure 15). The net effect is induced deposition owing to both the direct placement of sand and the groin s ability to impound sand naturally transported from the east. Over the 9 year simulation, the periodic addition of 1.2Mcy in combination with the Phase I terminal groinn and the existing sand-filled tube groin olsen associates, inc.
26 field is predicted to be sufficient to provide stabilization of the western end of Bald Head Island, albeit at a reduced scale than that predicted for the Phase II terminal structure. Similar results were identified by modeling of the Phase II terminal groin. Simulations which do not include a terminal groin do not achieve this goal as the model predicts impacts to upland infrastructure due to erosion at and immediately west of the existing westernmost tube groin. Accordingly, the sand-tube groin field with fill only scenario (existing condition) is expected to require implementation of emergency measures in addition to the periodic deposition of 1.2 Mcy of sand in order to avoid property damage similar in nature to what was required between 2010 and 2013, prior to the most recent federal beach disposal event (Spring 2013). A cyclic renourishment volume of 1.2Mcy every three years represents a conservatively likely volume of material available from the navigation channel under the current SMP typically there is 1.5 to 1.8 Mcy available. However, the current SMP requires that Bald Head Island receive no sand every third renourishment. This requires the Village to supplement the entire volume with supplementary sediment from an alternate borrow source. In summary, the Delft3D model was used to simulate 9 years of morphological change following construction of a semi-permeable Phase I terminal groin at the west end of Bald Head Island. The modeled Phase I terminal structure measures about 1,300 feet long and represents the potential initial construction phase of the Phase II terminal groin which is about 1,800 feet long in the model. Both structures are identical in location and model characteristics excepting overall length. The existing sand-filled tube groins were included in the model in their current locations. Periodic sand placement on South Beach was prescribed to occur at years 0, 3, and 6 concurrent with maintenance of the federal channel. Sand volume was held constant at 1.2 Mcy and placed between Station near the terminal groin and Station The initial beach and channel conditions were representative of those measured in the spring of The first dredge/disposal event is simulated to occur immediately after the model s initiation (at time zero). The model results indicate the Phase I terminal groin in combination with the existing sand-filled tube groins and recurrent sand placement is sufficient to maintain the South Beach and Point shorelines through the 9 year simulation, thereby fulfilling its design objective in a manner similar to the Phase II structure. Upland development located more than meters east of the terminal groin would continue to depend on the existing soft armoring for protection from erosion. Construction of the Phase II terminal groin is expected to provide a direct benefit which extends further east an additional 200 to 250 meters. The present depth-averaged model suggests continued northward migration of material passing through the Phase I terminal groin which is deposited as a predominantly subaqueous platform immediately adjacent to, and slightly north of, the terminal groin. Further, a spit shoal north of 25 olsen associates, inc.
27 the terminal groin is expected to continue to provide a near-term, post-construction Point feature -- in contrast to comparative non-terminal groin scenarios which result in the predicted erosion of such a Point at the west end of the island. The model predicts continued erosion along West Beach which is generally consistent in spatial area to that indicated by simulation of scenarios containing only sand-filled tube groins (existing conditions). Erosion along West Beach is expected to continue as a maintenance issue rather than a significant project-related impact. Specifically, the Phase I terminal groin is expected to require a maintenance volume of about 3,600 cy per year in addition to that presently provided by episodic renourishment events. It is anticipated that the post-construction performance of the Phase I terminal structure would be monitored with respect to its ability to (a) facilitate sand bypassing to the downdrift shoreline, (b) reduce the rate of sand loss from South Beach, and (c) maintain an updrift fillet, and to assess the alongshore extent of benefits derived therefrom. The timing and extent of the Phase II construction would benefit from the guidance provided by the Phase I monitoring program. It is reasonable to assume that the minimum time required to adequately assess the performance of the Phase I structure would be one to two channel-dredging and beach disposal cycles (approximately 2 to 4 years). Additionally, the implementation of a Phase I structure would reduce the amount of time that beachfront construction operations would extend beyond the typical 1 May Moratorium date. Depending upon shoreline conditions at the time, it is likely that any Phase II extension contract activities may potentially be scheduled to better coincide with construction outside of the Moratorium window. Both the Phase I and Phase II terminal groin lengths continue to necessitate the maintenance of the existing sand tube groinfield located eastward of the new structure. Ultimately, however, any sand tube groins considered by the Village to be non-essential or counter-productive to terminal groin performance would be removed or modified. A decision in this regard would be based upon the results of shoreline monitoring. A post-construction monitoring program for the Phase I structure would consist of biannual surveys intended to specifically quantify fillet volume, spit or platform formations associated with sand bypassing, and the condition of immediate updrift and downdrift shorelines. In order to facilitate the effort, only minor modifications to the Village s existing comprehensive shoreline monitoring program would be required. More specifically, these modifications would include additional survey lines in the vicinity of the groin structure, the fillet, and the downdrift shoreline. The existing biannual controlled aerial photography program would be continued; however, interim (quarterly) oblique photography would be acquired for purposes of highfrequency qualitative assessments of shoreline conditions. Any decision as to when and how far to extend the Phase I structure would be closely coordinated with both State and Federal regulatory staff. In no event, however, would the groin 26 olsen associates, inc.
28 be extended beyond its full 1,900 ft permitted length. A Notice-to-Proceed (NTP) for a Phase II extension would be given by the Village for purposes of notification to all affected agencies, stakeholders and navigational interests. References Cited Olsen (2012). Calibration of a Delft3D model for Bald Head Island and the Cape Fear River Entrance Phase I. Prepared for Village of Bald Head Island. Prepared by Olsen Associates, Inc Hershel Street, Jacksonville, FL April Olsen (2013). Shoreline Stabilization Analysis. Bald Head Island, N.C. Prepared for Village of Bald Head Island. Prepared by Olsen Associates, Inc Herschel Street. Jacksonville, FL 32204, July olsen associates, inc.
DESIGN ENGINEERING ANALYSIS FOR TERMINAL GROIN LENGTH
 APPENDIX F DESIGN ENGINEERING ANALYSIS FOR TERMINAL GROIN LENGTH (Prepared by Olsen Associates, Inc.) DRAFT Environmental Impact Statement Village of Bald Head Island Shoreline Protection Project Brunswick
DIVISION OF COASTAL MANAGEMENT TO STUDY CURRENT LONG-TERM EROSION RATES ADJACENT TO TERMINAL GROINS
 DIVISION OF COASTAL MANAGEMENT TO STUDY CURRENT LONG-TERM EROSION RATES ADJACENT TO TERMINAL GROINS North Carolina Department of Environmental Quality Division of Coastal Management February 22, 2018 N.
MODELING OF EROSION CONTROL ALTERNATIVES AT STUMP PASS, CHARLOTTE COUNTY
 2014 NATIONAL CONFERENCE ON BEACH PRESERVATION TECHNOLOGY FEBRUARY 13, 2014 MODELING OF EROSION CONTROL ALTERNATIVES AT STUMP PASS, CHARLOTTE COUNTY 1 VADIM ALYMOV, PH.D. 2 CHUCK MOPPS 3 MICHAEL POFF,
ENGINEERING APPROACHES TO SHORELINE PLACEMENT FROM COAST TO COAST
 ENGINEERING APPROACHES TO SHORELINE PLACEMENT FROM COAST TO COAST 237 237 237 217 217 217 200 200 200 0 0 0 163 163 163 131 132 122 80 119 27 252 174.59 83 36 118 110 135 120 112 92 56 62 102 130 Comparing
Regional Sediment Management at East Rockaway Inlet, NY, Utilizing the USACE Coastal Modeling System
 Regional Sediment Management at East Rockaway Inlet, NY, Utilizing the USACE Coastal Modeling System by US Army Engineer District, New York PURPOSE: This Coastal and Hydraulics Engineering Technical Note
Connecticut Coastal Management Program
 Connecticut Coastal Management Program Fact Sheet for SHORELINE FLOOD AND EROSION CONTROL STRUCTURES What are Shoreline Flood and Erosion Control Structures? The Connecticut General Statutes (CGS) define
EAST PASS UP-DATE SUMMARY OF FINDINGS REPORT and INLET MANAGEMENT IMPLEMENTATION PLAN
 EAST PASS 2013 UP-DATE SUMMARY OF FINDINGS REPORT and INLET MANAGEMENT IMPLEMENTATION PLAN Introduction On June 8, 2000, the Florida Department of Environmental Protection adopted the East Pass Inlet Management
The U.S. Army Corps of Engineers Philadelphia District
 The U.S. Army Corps of Engineers Philadelphia District The Atlantic Coast of New Jersey Regional Sediment Budget 1986-2003 Cape May Point to Manasquan Inlet Final Report March 2006 The Atlantic Coast of
A SEDIMENT BUDGET ANALYSIS AND MANAGEMENT STRATEGY FOR FORT PIERCE INLET, FL
 A SEDIMENT BUDGET ANALYSIS AND MANAGEMENT STRATEGY FOR FORT PIERCE INLET, FL By Elba Rodriguez and Robert G. Dean Department of Civil and Coastal Engineering University of Florida Gainesville, FL 32611,
CHAPTER 212 THE EXTENT OF INLET IMPACTS UPON ADJACENT SHORELINES. Kevin R. Bodge, Ph.D., Member ASCE 1
 CHAPTER 212 THE EXTENT OF INLET IMPACTS UPON ADJACENT SHORELINES Kevin R. Bodge, Ph.D., Member ASCE 1 Abstract The erosional impacts of improved inlets upon adjacent shorelines may be best estimated by
BYPASS IN GROYNE FIELDS: CASE STUDY ALONG THE LOBITO SPIT
 BYPASS IN GROYNE FIELDS: CASE STUDY ALONG THE LOBITO SPIT Sten Esbjørn Kristensen 1, Nils Drønen 2, Rolf Deigaard 3, Berry Elfrink 4 Abstract The Lobito spit, in Angola, is fronted by a groyne field along
3. MARINE HABITAT RESTORATION
 Feasibility Study for Restoration of Titlow Lagoon Fish Passage South Puget Sound Salmon Enhancement Group 3. MARINE HABITAT RESTORATION Marine habitat restoration at Titlow Park could include restoration
ENGINEERING WITH NATURE: NEARSHORE BERM PLACEMENTS AT FORT MYERS BEACH AND PERDIDO KEY, FLORIDA, USA
 1 ENGINEERING WITH NATURE: NEARSHORE BERM PLACEMENTS AT FORT MYERS BEACH AND PERDIDO KEY, FLORIDA, USA KATHERINE E. BRUTSCHÉ 1, PING WANG 2, JULIE D. ROSATI 1, CHERYL E. POLLOCK 1 1. U.S. Army Engineer
Annual transport rates at two locations on the fore-slope.
 Sediment Transport by Currents Fore-slope Sediment transport rates and sediment concentrations were computed from the hydrodynamic model runs as well as from direct measurements of current velocities at
INFLUENCE OF INLET / SHOAL COMPLEX ON ADJACENT SHORELINES VIA INLET SINK METHOD
 INFLUENCE OF INLET / SHOAL COMPLEX ON ADJACENT SHORELINES VIA INLET SINK METHOD Kelly R. Legault, Ph.D., P.E. 1, Tanya M. Beck 2 and Jason A. Engle, P.E. 3 The region of influence of the inlet on the adjacent
Appendix I. Dredged Volume Estimates. Draft Contractor Document: Subject to Continuing Agency Review
 Appendix I Dredged Volume Estimates Draft Contractor Document: Subject to Continuing Agency Review Interoffice Correspondence Date: April 6, 2007 To: L. Bossi (WHI) Copy: S. Thompson (WHI), B. Fidler (NNJ)
The Sediment Budget Calculator: A Webtool to Develop a Family of Viable Inlet and Adjacent Beach Sediment Budget Solutions
 The Sediment Budget Calculator: A Webtool to Develop a Family of Viable Inlet and Adjacent Beach Sediment Budget Solutions by Julie Dean Rosati, Charles A. Sumner, and Derek A. Wilson PURPOSE: This Coastal
Pinellas, Manatee, and Sarasota Counties, Florida; Regional Sediment Budget
 Pinellas, Manatee, and Sarasota Counties, Florida; Regional Sediment Budget by Kelly R. Legault and Ashley E. Frey PURPOSE: This U.S. Army Corps of Engineers (USACE) Regional Sediment Management Technical
SEGMENTED BREAKWATERS AND THEIR USE IN COASTAL LOUISIANA
 SEGMENTED BREAKWATERS AND THEIR USE IN COASTAL LOUISIANA Prepared by: Louisiana Coastal Protection and Restoration Authority Engineering Division March 2016 The geology of Louisiana s coastal zone is intimately
GenCade. Combining and Extending the GENESIS and Cascade Models for Planning and Design in a Regional Sediment Management Framework
 GenCade Combining and Extending the GENESIS and Cascade Models for Planning and Design in a Regional Sediment Management Framework G Presented by Nicholas C. Kraus For the GenCade Development Team Ken
South Carolina BMA. Jurisdictional Line Revisions
 South Carolina BMA Jurisdictional Line Revisions 40 Year Retreat Policy A forty year policy of retreat from the shoreline is established. The department must implement this policy and utilize the best
Coastal Inlets Research Program US Army Corps of Engineers Engineering Research and Development Center
 Coastal Inlets Research Program US Army Corps of Engineers Engineering Research and Development Center Site of Moriches Inlet Nov. 1951 Julie Dean Rosati and Nicholas C. Kraus, CIRP Program Manager Shinnecock
Erosion Information Paper - Barrow, Alaska Current as of September 14, 2007
 U.S. Army Corps of Engineers ALASKA BASELINE EROSION ASSESSMENT Erosion Information Paper - Barrow, Alaska Current as of September 14, 2007 Community Information Barrow (BARE-row, a.k.a. Ukpeagvik), population
Engineering with Nature: Nearshore Berm Placements at Fort Myers Beach and Perdido Key, Florida, USA
 Engineering with Nature: Nearshore Berm Placements at Fort Myers Beach and Perdido Key, Florida, USA Katherine E. Brutsché, Ph.D. Research Physical Scientist ERDC-Coastal & Hydraulics Laboratory May 14,
SHORELINE AND BEACH PROCESSES: PART 2. Implications for Coastal Engineering
 SHORELINE AND BEACH PROCESSES: PART 2 Implications for Coastal Engineering Objectives of the lecture: Part 2 Show examples of coastal engineering Discuss the practical difficulties of ocean engineering
Regional Sediment Management
 Regional Sediment Management Linda S. Lillycrop Program Manager Coastal Engineer US Army Engineer Research and Development Center Coastal and Hydraulics Laboratory Q AVG Coastal Resilience: The Environmental,
Sediment Budget Analysis System (SBAS)
") Coastal Engineering Technical Note IV-20 Sediment Budget Analysis System (SBAS) by Julie Dean Rosati and Nicholas C. Kraus PURPOSE: The Coastal Engineering Technical Note (CETN) herein presents the Sediment
Coastal Engineering Technical Note IV-20 Sediment Budget Analysis System (SBAS) by Julie Dean Rosati and Nicholas C. Kraus PURPOSE: The Coastal Engineering Technical Note (CETN) herein presents the Sediment
Nearshore Placement as a Regional Sediment Management Practice
 Nearshore Placement as a Regional Sediment Management Practice Katherine E. Brutsché, Ph.D. Brian C. McFall, Ph.D., P.E. Coastal and Hydraulics Laboratory US Army Engineer R&D Center ASBPA National Coastal
Material Workshop. Galveston District 2012 Beneficial Use of Dredged. Material Workshop. Custodians of the Coast
 Galveston District 2012 Beneficial Use of Dredged Material Workshop Galveston District 2012 Beneficial Use of Dredged Material Workshop US Army Corps of Engineers BUILDING STRONG Welcome Opening Remarks
MISSISSIPPI COASTAL IMPROVEMENTS
 MISSISSIPPI COASTAL IMPROVEMENTS PROGRAM (MsCIP) Comprehensive Barrier 237 27 200 237 27 200 Island 237 Restoration 27 200 Plan 80 9 27 252 74.59 255 255 255 0 0 0 63 63 63 3 32 22 239 65 53 0 35 20 2
Protecting the Storm Damage Prevention and Flood Control Interests of Coastal Resource Areas
 Protecting the Storm Damage Prevention and Flood Control Interests of Coastal Resource Areas Presented by: Massachusetts Department of Environmental Protection & Massachusetts Office of Coastal Zone Management
Morphological Modeling of Inlets and Adjacent Shorelines on Engineering Timescales
 CB&I Morphological Modeling of Inlets and Adjacent Shorelines on Engineering Timescales Challenges and Model Improvements based on Recent Studies Dobrochinski, J.P.H.; Benedet, L.; Signorin, M.; Pierro,
Mark H. Horwitz Ping Wang PhD Coastal Research Laboratory, School of Geosciences University of South Florida
 Mark H. Horwitz Ping Wang PhD Coastal Research Laboratory, School of Geosciences University of South Florida American Shore & Beach Preservation Association 2015 National Coastal Conference, New Orleans,
Coastal Sediment Properties and Longshore Sediment Transport
 Coastal Sediment Properties and Longshore Sediment Transport Julie Rosati Julie.D.Rosati@erdc.usace.army.mil 601-634-3005 Coastal Planning Course Lesson #8 Tuesday 8:00-9:00 am CEM III-1, III-2 1. Coastal
Highland Lake Bathymetric Survey
 Highland Lake Bathymetric Survey Final Report, Prepared For: The Town of Highland Lake 612 Lakeshore Drive Oneonta, AL 35121 Prepared By: Tetra Tech 2110 Powers Ferry Road SE Suite 202 Atlanta, GA 30339
SAVANNAH HARBOR EXPANSION BANK EROSION STUDY UPDATE
 CESAS-EN-GS SAVANNAH HARBOR EXPANSION BANK EROSION STUDY UPDATE GEOTECHNICAL AND HTRW BRANCH SOILS SECTION CITY FRONT, BIGHT SECTION, FORT PULASKI & NORTH TYBEE ISLAND GEORGIA 23 June 2011 CESAW-TS-EG
Linking Inlet Hydrodynamics and Morphologic Response at Oregon Inlet, NC
 Linking Inlet Hydrodynamics and Morphologic Response at Oregon Inlet, NC Prepared for: Sharon Ahlers Engineering Communications Program Cornell University Prepared by: Justin Vandever School of Civil and
COASTAL SEDIMENT BUDGET FOR JUPITER INLET, FLORIDA
 COASTAL SEDIMENT BUDGET FOR JUPITER INLET, FLORIDA By KRISTEN MARIE ODRONIEC A THESIS PRESENTED TO THE GRADUATE SCHOOL OF THE UNIVERSITY OF FLORIDA IN PARTIAL FULFILLMENT OF THE REQUIREMENTS FOR THE DEGREE
Alexandra Carvalho, Ph.D., GISP Kathy Fitzpatrick, P.E.
 Coastal Data Organization for Project Management and Coastal Planning Martin County, Florida Alexandra Carvalho, Ph.D., GISP Kathy Fitzpatrick, P.E. Outline County Coastal Programs Coastal Geodatabase
Planning for the Future of Humboldt Bay: Sea Level Rise, Sediment Management, Sand Spits and Salt Marshes. Joel Gerwein
 Planning for the Future of Humboldt Bay: Sea Level Rise, Sediment Management, Sand Spits and Salt Marshes Joel Gerwein Introduction to Humboldt Bay Setting Economy, community, and environment Sediment
ST. JOHNS COUNTY, FLORIDA South Ponte Vedra Beach, Vilano Beach, and Summer Haven Reaches
 ST. JOHNS COUNTY, FLORIDA South Ponte Vedra Beach, Vilano Beach, and Summer Haven Reaches COASTAL STORM RISK MANAGEMENT PROJECT DRAFT INTEGRATED FEASIBILITY STUDY AND ENVIRONMENTAL ASSESSMENT APPENDIX
Sediment Budget Analysis System (SBAS)
") Coastal Engineering Technical Note IV-20 US Army Corps of Engineers Sediment Budget Analysis System (SBAS) by Julie Dean Rosati and Nicholas C. Kraus PURPOSE: The Coastal Engineering Technical Note (CETN)
Coastal Engineering Technical Note IV-20 US Army Corps of Engineers Sediment Budget Analysis System (SBAS) by Julie Dean Rosati and Nicholas C. Kraus PURPOSE: The Coastal Engineering Technical Note (CETN)
Regional Sediment Management: The Long Island Coastal Planning Project
 Regional Sediment Management: The Long Island Coastal Planning Project Lynn M. Bocamazo Senior Coastal Engineer USACE-New York District 22 September 2009 US Army Corps of Engineers Outline Project Location
KEYWORDS: erosion shoreline change nourishment community issues
 UNC Coastal Studies Institute 1 TITLE: Sand, Soil, Sediment Selection for Beach Nourishment KEYWORDS: erosion shoreline change nourishment community issues ABSTRACT: North Carolina s barrier islands are
Draft exercise for share fair at Bozeman workshop only. This exercise is not ready for distribution. Please send helpful suggestions to
 Draft exercise for share fair at Bozeman workshop only. This exercise is not ready for distribution. Please send helpful suggestions to foleyd@plu.edu Figure list 1. Trailer photograph 2. Location map
Coastal Sediment Transport
 Coastal & Marine Coastal Sediment Transport Mazen Abualtayef Assistant Prof., IUG, Palestine Sediment Transport Sediment is any particulate matter that can be transported by fluid flow and which eventually
memorandum Preliminary Implementation Options Overview Coastal Armor by Reach San Francisco Littoral Cell CRSMP Stakeholder Advisory Group
 550 Kearny Street Suite 900 San Francisco, CA 94108 415.262.2300 phone 415.262.2303 fax www.pwa-ltd.com memorandum date June 5, 2012 to from subject San Francisco Littoral Cell CRSMP Stakeholder Advisory
Coastal and Hydraulics Laboratory
 ERDC/CHL TR-12-14 Coastal Inlets Research Program Optimization of Ebb Shoal Mining and Beach Nourishment at St. Johns County, St. Augustine Inlet, Florida Report 3 Tanya M. Beck and Kelly Legault August
Geology Setting Management Options Management Structure
 Geology Setting Management Options Management Structure WFF = Wallops Flight Facility LST = Longshore sediment transport SLR = Sea level rise September 29, 2015 Accomack County/Accomack Northampton County
Port of Kalama, 2013 TEMCO Berth Maintenance Dredging and In-water Flow-Lane Placement Project
 2014 WEDA ENVIRONMENTAL EXCELLENCE AWARDS Category: Navigation Dredging Port of Kalama, 2013 TEMCO Berth Maintenance Dredging and In-water Flow-Lane Placement Project Port of Kalama, Washington 18 April
SEDIMENT BUDGET: MISSISSIPPI SOUND BARRIER ISLANDS*
 2366 SEDIMENT BUDGET: MISSISSIPPI SOUND BARRIER ISLANDS* MARK R. BYRNES 1, JULIE D. ROSATI 2, SARAH F. GRIFFEE 1 1. Applied Coastal Research and Engineering, Inc., 766 Falmouth Road, Suite A-1, Mashpee,
Sediment Management in the Coastal Bays
 Sediment Management in the Coastal Bays Introduction Need for ecosystem view of sediment management in Coastal Bays Island loss and restoration Navigation needs Habitat Trade offs Living Shoreline Requirements
APPENDIX C INLET MANAGEMENT PLAN
 APPENDIX C INLET MANAGEMENT PLAN DRAFT INLET MANAGEMENT PLAN LOCKWOODS FOLLY INLET, NC 1.0 INTRODUCTION The Town of Holden Beach (herein referred to as the Town ) has proposed the construction of a terminal
Coastal Processes and Shoreline Erosion on the Oregon Coast, Cascade Head to Cape Kiwanda
 State of Oregon Department of Geology and Mineral Industries Vicki S. McConnell, State Geologist Open File Report OFR O-04-11 Coastal Processes and Shoreline Erosion on the Oregon Coast, Cascade Head to
MEMORANDUM FOR SWG
 MEMORANDUM FOR SWG-2007-1623 Subject: Jurisdictional Determination (JD) for SWG-2007-1623 on Interdunal Wetlands Adjacent to Traditional Navigable Waters (TNWs) Summary The U.S. Environmental Protection
Heather Schlosser Army Corps of Engineers Coastal Studies Group August 28, 2008
 Got sand? Regional Sediment Management in Orange County Heather Schlosser Army Corps of Engineers Coastal Studies Group August 28, 2008 Regional Sediment Management Regional sediment management recognizes
Whiskey Island Marsh Creation Rolling with the Punches
 Whiskey Island Marsh Creation Rolling with the Punches Santiago Alfageme, M&N Jerry Carroll, LADNR Brad Miller, LADNR Project Location Historic Island Retreat Previous Restoration Project Whiskey Island
The use of MIKE21 to study the. barrier beach system of Inner Dingle Bay, Co. Kerry, Ireland. Dr. Michael O Shea Malachy Walsh and Partners
 The use of MIKE21 to study the morphodynamic evolution of the mid-bay barrier beach system of Inner Dingle Bay, Co. Kerry, Ireland Dr. Michael O Shea Malachy Walsh and Partners Contents Why Study Morphodynamics
Del Mar Sediment Management Study
 Del Mar Sediment Management Study Shoreline Preservation Working Group, June 7, 2018 Lindsey Sheehan Current work in Del Mar 2016 Sea-Level Rise Vulnerability Assessment 2018 Adaptation Plan 2018 Sediment
FILL SUITABILITY CHARACTERIZATION OF A COMPLEX COASTAL AREA: DARE COUNTY, NORTH CAROLINA
 FILL SUITABILITY CHARACTERIZATION OF A COMPLEX COASTAL AREA: DARE COUNTY, NORTH CAROLINA Donald K. Stauble 1, William Birkemeier, Michael F. Forte and William A. Dennis 3 ABSTRACT As part of the design
Primer on Coastal Erosion And Habitat Creation
 2 nd Regional Conference Dredging, Beach Nourishment & Bird Conservation Primer on Coastal Erosion And Habitat Creation Timothy Kana Ph.D Source: Newsday 1962 Photo by Kelsey Aerials 1978 Source: U Mass
THIN-LAYER PLACEMENT OF DREDGE MATERIAL FOR MARSH NOURISHMENT, RESOTRATION, AND RESPONSE TO SEA LEVEL RISE
 THIN-LAYER PLACEMENT OF DREDGE MATERIAL FOR MARSH NOURISHMENT, RESOTRATION, AND RESPONSE TO SEA LEVEL RISE Case studies and lesson learned regarding thin-layer deposition projects in Delaware, New Jersey,
NEWS RELEASE UNDER SECTION 404 OF THE CLEAN WATER ACT (33 USC 1344) ACTION NUMBER SPA ABQ
 ACTION NUMBER SPA ABQ") PUBLIC NOTICE Public Notice Issue Date: //6/07 Albuquerque District Comments due: /6/08 NEWS RELEASE UNDER SECTION 0 OF THE CLEAN WATER ACT ( USC ) ACTION NUMBER SPA-06-00-ABQ BANK STABILIZATION ALONG
PUBLIC NOTICE Public Notice Issue Date: //6/07 Albuquerque District Comments due: /6/08 NEWS RELEASE UNDER SECTION 0 OF THE CLEAN WATER ACT ( USC ) ACTION NUMBER SPA-06-00-ABQ BANK STABILIZATION ALONG
Holderness Erosion and Evolution of the Spurn Peninsula
 Holderness Erosion and Evolution of the Spurn Peninsula Prof. Ken Pye and Dr. Simon Blott Kenneth Pye Associates Ltd. Outline of the Presentation Overview of historical erosion trends Effects of coast
Appendix G.19 Hatch Report Pacific NorthWest LNG Lelu Island LNG Maintenance Dredging at the Materials Offloading Facility
 Appendix G.19 Hatch Report Pacific NorthWest LNG Lelu Island LNG Maintenance Dredging at the Materials Offloading Facility Project Memo H345670 To: Capt. David Kyle From: O. Sayao/L. Absalonsen December
Ludington Project July 1993
 Ludington Project July 1993 DLH Photos by Marge Beaver Nov. 1984 Photo by DLHolmberg Ludington Project July 1986 July 2005 19 Years Later Photos by DLHolmberg Ludington Project Nov.1985 July 2005 20 Years
RESULTS FROM THE TEXAS COASTAL SEDIMENT SOURCES: A GENERAL EVALUATION STUDY
 RESULTS FROM THE TEXAS COASTAL SEDIMENT SOURCES: A GENERAL EVALUATION STUDY JUAN MOYA KELSEY CALVEZ CRIS WEBER ANTHONY RISKO *KEVIN FRENZEL FREESE AND NICHOLS, INC. COASTAL AND WATERWAYS GROUP OBJECTIVES
RESERVOIR DRAWDOWN RATES/RESERVOIR DRAWDOWN TEST Iron Gate, Copco (I & II), and JC Boyle Dams
, and JC Boyle Dams") TECHNICAL MEMORANDUM No. 1 TO: Michael Bowen California Coastal Conservancy Geotechnical & Earthquake Engineering Consultants CC: Eric Ginney Philip Williams & Associates PREPARED BY: Paul Grant SUBJECT:
TECHNICAL MEMORANDUM No. 1 TO: Michael Bowen California Coastal Conservancy Geotechnical & Earthquake Engineering Consultants CC: Eric Ginney Philip Williams & Associates PREPARED BY: Paul Grant SUBJECT:
Redwood City Harbor, California, Navigation Improvement Feasibility Study. Appendix D. Geotechnical Engineering. DRAFT April 2015
 1 Redwood City Harbor, California, Navigation Improvement Feasibility Study Appendix D Geotechnical Engineering DRAFT April 2015 2 Contents 1 Purposes of Report... 3 2 Background... 3 3 References and
Coastal Barrier Island Network (CBIN): Management strategies for the future
: Management strategies for the future") Coastal Barrier Island Network (CBIN): Management strategies for the future Heather Joesting*, Amy Williams**, Rusty Feagin**, and William K. Smith* *Department of Biology, Wake Forest University, Winston
Coastal Barrier Island Network (CBIN): Management strategies for the future Heather Joesting*, Amy Williams**, Rusty Feagin**, and William K. Smith* *Department of Biology, Wake Forest University, Winston
The Use of Geographic Information Systems to Assess Change in Salt Marsh Ecosystems Under Rising Sea Level Scenarios.
 The Use of Geographic Information Systems to Assess Change in Salt Marsh Ecosystems Under Rising Sea Level Scenarios Robert Hancock The ecological challenges presented by global climate change are vast,
Materials. Use materials meeting the following.
 208.01 Section 208. SOIL EROSION AND SEDIMENTATION CONTROL 208.01 Description. Install and maintain erosion and sedimentation controls to minimize soil erosion and to control sedimentation from affecting
B805 TEMPORARY EROSION AND SEDIMENT CONTROL MEASURES - OPSS 805
 B805 MEASURES - OPSS 805 805.1 GENERAL Construction activities frequently remove protective cover and expose soil to accelerated rates of erosion. Sediments generated thereby can be conveyed via runoff
Environmental concerns for marina planning in the Gulf of Suez
 Journal of Coastal Conservation 6: 51-56, 2000 EUCC; Opulus Press Uppsala. Printed in Sweden - Environmental concerns for marina planning in the Gulf of Suez - 51 Environmental concerns for marina planning
Mapping Coastal Change Using LiDAR and Multispectral Imagery
 Mapping Coastal Change Using LiDAR and Multispectral Imagery Contributor: Patrick Collins, Technical Solutions Engineer Presented by TABLE OF CONTENTS Introduction... 1 Coastal Change... 1 Mapping Coastal
SHORELINE MANAGEMENT PLAN FOR OWEN ANCHORAGE AND COCKBURN SOUND SHORELINE MONITORING PLAN
 SHORELINE MANAGEMENT PLAN FOR OWEN ANCHORAGE AND COCKBURN SOUND SHORELINE MONITORING PLAN CHAPTER EIGHT OF DOCUMENT: LONG-TERM SHELLSAND DREDGING, OWEN ANCHORAGE ENVIRONMENTAL MANAGEMENT PROGRAMME JUNE
HAWAII REGIONAL SEDIMENT MANAGEMENT
 HAWAII REGIONAL SEDIMENT MANAGEMENT KAUAI Workshop January 20, 2011 Kauai Veteran s Center Kihei, HI of Engineers, Honolulu District AGENDA 1300-1310 Welcome and Introductions Conger Conant 1310-1330 Regional
Estimated Sediment Volume: Bridge Street Dam Impoundment, Royal River, Yarmouth, Maine
 University of Southern Maine USM Digital Commons Publications Casco Bay Estuary Partnership (CBEP) 2015 Estimated Sediment Volume: Bridge Street Dam Impoundment, Royal River, Yarmouth, Maine Stantec Follow
Appendix D Geotechnical
 USACE JACKSONVIE DISTRICT Appendix D Geotechnical LEE COUNTY GASPARIA SHORE PROTECTION PROJECT 934 REPORT June 216 TABLE OF CONTENTS 1 Background... 1 1.1 Regional Geology... 1 1.2 Local Geology... 2 2
Seaton to Seaton Hole SUMMARY OF PREFERRED PLAN RECOMMENDATIONS AND JUSTIFICATION
 Location reference: Policy Unit reference: Plan: Seaton to Seaton Hole 6a29 and 6a30 SUMMARY OF PREFERRED PLAN RECOMMENDATIONS AND JUSTIFICATION The large number of properties and assets at risk in the
CHAPTER 135 COASTAL ARMORING: EFFECTS, PRINCIPLES AND MITIGATION. R. G. Dean*
 CHAPTER 135 COASTAL ARMORING: EFFECTS, PRINCIPLES AND MITIGATION by R. G. Dean* ABSTRACT An attempt is made to conduct a rational assessment of the potential adverse effects of coastal armoring on adjacent
PRESENTATION TITLE. Regional Sediment Management Application of a Coastal Model at the St. Johns River Entrance BUILDING STRONG
 PRESENTATION TITLE Regional Sediment Management Application of a Coastal Model at the St. Johns River Entrance Steven Bratos Senior Coastal Engineer U.S. Army Corps of Engineers Jacksonville District February
RE: Inadequacy of December 2017 Draft Supplemental Environmental Assessment Review of Recent Storm Events and Flooding
 December 29, 2017 U.S. Corps of Engineers Jacksonville District ATTN: Paul Stodola 701 San Marco Boulevard Jacksonville, Florida 32207-8175 TO: FROM: Paul Stodola U.S. Corps of Engineers Jacksonville District
Appendix G.18 Hatch Report Pacific NorthWest LNG Lelu Island LNG Potential Impacts of the Marine Structures on the Hydrodynamics and Sedimentation
 Appendix G.18 Hatch Report Pacific NorthWest LNG Lelu Island LNG Potential Impacts of the Marine Structures on the Hydrodynamics and Sedimentation Patterns Project Memo H345670 To: Capt. David Kyle From:
Coastal Processes 101. Greg Berman (Woods Hole Sea Grant & Cape Cod Cooperative Extension)
") Coastal Processes 101 Greg Berman (Woods Hole Sea Grant & Cape Cod Cooperative Extension) January 23, 2019 Coastal Processes 101 Outline: ~30 min talk Coastal Processes What is Erosion? Value of the Ecosystem
Coastal Processes 101 Greg Berman (Woods Hole Sea Grant & Cape Cod Cooperative Extension) January 23, 2019 Coastal Processes 101 Outline: ~30 min talk Coastal Processes What is Erosion? Value of the Ecosystem
Presentation Outline. Project Overview. Sea Level Rise Assessment & Decision Tools. Community Engagement. Tina Whitman, Friends of the San Juans
 Healthy Beaches for People & Fish Sea Level Rise Adaptation Tools for San Juan County, WA Tina Whitman & Andrea MacLennan December 10, 2015 Presentation Outline Project Overview Tina Whitman, Friends of
2.2.7 Backbarrier flats
 FIGURE 24. VERTICAL PHOTOGRAPH SHOWING THE DEVELOPMENT OF SMALL PARABOLIC DUNES FROM BLOWOUTS IN A LARGE RELICT FOREDUNE NORTHWEST OF HUNTER'S CREEK. PHOTOGRAPH COURTESY OF CAR'T'ER HOLT HARVEY FORESTS
L OWER N OOKSACK R IVER P ROJECT: A LTERNATIVES A NALYSIS A PPENDIX A: H YDRAULIC M ODELING. PREPARED BY: LandC, etc, LLC
 L OWER N OOKSACK R IVER P ROJECT: A LTERNATIVES A NALYSIS A PPENDIX A: H YDRAULIC M ODELING PREPARED BY: LandC, etc, LLC TABLE OF CONTENTS 1 Introduction... 1 2 Methods... 1 2.1 Hydraulic Model... 1 2.2
Coastal Flood Risk Study Project for East Coast Central Florida Study Area
 Coastal Flood Risk Study Project for East Coast Central Florida Study Area St Lucie County, Florida Flood Risk Review Meeting March 28, 2017 Introductions Risk MAP Project Team FEMA Region IV BakerAECOM,
Geol 117 Lecture 18 Beaches & Coastlines. I. Types of Coastlines A. Definition:
 I. Types of Coastlines A. Definition: 1. Shore = narrow zone where ocean meets land (e.g. beach) 2. Coast is a broad area where both ocean and land processes act a. Includes onshore marshes, dunes, sea
The last three sections of the main body of this report consist of:
 Threatened and Endangered Species Geological Hazards Floodplains Cultural Resources Hazardous Materials A Cost Analysis section that provides comparative conceptual-level costs follows the Environmental
Solutions to Flooding on Pescadero Creek Road
 Hydrology Hydraulics Geomorphology Design Field Services Photo courtesy Half Moon Bay Review Solutions to Flooding on Pescadero Creek Road Prepared for: San Mateo County Resource Conservation District
Palm Beach County, Florida Jupiter-Carlin Segment Section 934 Report. Appendix A Engineering Appendix
 Palm Beach County, Florida Jupiter-Carlin Segment Section 934 Report Appendix A Engineering Appendix Table of Contents 1 Background... 1 2 Purpose... 1 3 Natural Forces... 2 3.1 Winds... 2 3.2 Waves...
Beach Nourishment on the Florida East Coast. Boca Raton
 Beach Nourishment on the Florida East Coast Past Future Boca Raton Erosion is the Main Reason for Beach Past - Erosion on the east coast was mainly caused by inlets created or modified for navigation Nourishment
Sea Level Rise in Miami-Dade County Florida Implications for Management of Coastal Wetlands and the Everglades
 Sea Level Rise in Miami-Dade County Florida Implications for Management of Coastal Wetlands and the Everglades Peter W. Harlem Dr. John F. Meeder Florida International University Southeast Environmental
Sea-level Rise on Cape Cod: How Vulnerable Are We? Rob Thieler U.S. Geological Survey Woods Hole, MA
 Sea-level Rise on Cape Cod: How Vulnerable Are We? Rob Thieler U.S. Geological Survey Woods Hole, MA Outline Sea-level and coastal processes Past sea-level change Predictions for the future Coastal responses
Regional-scale understanding of the geologic character and sand resources of the Atlantic inner continental shelf, Maine to Virginia
 Regional-scale understanding of the geologic character and sand resources of the Atlantic inner continental shelf, Maine to Virginia Workshop on Dredging, Beach Nourishment and Bird Conservation Atlantic
ST. JOHNS COUNTY, FLORIDA
 ST. JOHNS COUNTY, FLORIDA South onte Vedra Beach, Vilano Beach, and Summer Haven Reaches COASTAL STORM RISK MANAGEMENT ROJECT DRAFT INTEGRATED FEASIBILITY STUDY AND ENVIRONMENTAL ASSESSMENT AENDIX D Geotechnical
ERDC/LAB TR-0X-X 100. Figure 7-3 Maximum velocity magnitudes for existing conditions for 100-year flood event
 ERDC/LAB TR-0X-X 100 Figure 7-3 Maximum velocity magnitudes for existing conditions for 100-year flood event ERDC/LAB TR-0X-X 101 Figure 7-4 Model schematization of Option 1 Figure 7-5 Bed displacement
Nantasket Beach Characterization Study 2005
 Nantasket Beach Characterization Study 2005 Prepared for: The Commonwealth of Massachusetts Department of Conservation and Recreation (DCR) Engineering and Construction Prepared by: U.S. Army Corps of