August 4, 2009, DPRI-Kyoto University, Uji
|
|
|
- Lawrence Flowers
- 5 years ago
- Views:
Transcription
1 McGill University Montreal, Quebec, Canada Brace Centre for Water Resources Management Global Environmental and Climate Change Centre Department of Civil Engineering and Applied Mechanics School of Environment SOME ADVANCES IN DOWNSCALING METHODS FOR CLIMATE-RELATED IMPACT AND ADAPTATION STUDIES Van-Thanh-Van Nguyen and Students 1
2 OUTLINE INTRODUCTION n Extreme Rainfall Estimation (IDF Relations) Issues? n Climate Variability and Climate Change Impacts? n Design Storm Concept Issues? OBJECTIVES METHODOLOGY n Downscaling Methods n The Spatial-Temporal Downscaling Method APPLICATIONS CONCLUSIONS 2


 in 1996: $8 million dollars. n Average annual flood damages in the U.S. are US$2.")
3 INTRODUCTION Information on rainfall characteristics is essential for planning, design, and management of various hydraulic structures (flood protection works, urban sewers, etc.) Rainfall records by raingages or radar are usually limited (< 5 years) and are not sufficient for assessing reliability of hydraulic structure design. Stochastic simulation of rainfall processes is needed to generate many long rainfall series. Several rainfall samples of adequate record length are needed to be able to determine how different system designs and operating policies i might perform. the variability and the range of future system performance are better understood, and better system designs and policies could be selected. Extreme storms and floods account for more losses than any other natural disaster (both in terms of loss of lives and economic costs). n Damages due to Saguenay flood in Quebec (Canada) in 1996: $8 million dollars. n Average annual flood damages in the U.S. are US$2.1 billion dollars. n Increased trends in number of natural disasters and related costs. Design Rainfall = maximum amount of precipitation at agivensitefor a specified duration and return period. 3
4 EXTREME RAINFALL ESTIMATION (IDF Relations) At-site or Regional Frequency Analysis of Extreme Rainfalls Intensity-Duration-Frequency (IDF) Relations DESIGN STORM ESTIMATION. Traditional IDF estimation methods: n Time scaling problem: no consideration of rainfall properties at different time scales; n Spatial scaling problem: results limited to data availability at a local site; n Climate change: no consideration. (WMO Guides to Hydrological Practices: 1 st Edition th Edition: Section 5.7, in press) 4
5 Extreme Rainfall Estimation Issues (1) The scale problem n The properties of a variable depend on the scale of measurement or observation. n Are there scale-invariance i properties? And how to determine these scaling properties? n Existing methods are limited to the specific time scale associated with the data used. n Existing methods cannot take into account the properties of the physical process over different scales. 5
6 Extreme Rainfall Estimation Issues (2) Climate Variability and Change will have important impacts on the hydrologic cycle, and in particular the precipitation process! How to quantify Climate Change? General Circulation Models (GCMs): A credible simulation of the average large-scale seasonal distribution of atmospheric pressure, temperature, and circulation. (AMIP 1 Project, 31 modeling groups) Climate change simulations from GCMs are inadequate for impact studies on regional scales: Spatial resolution ~ 5, km 2 Temporal resolution ~ daily, month, seasonal Reliability of some GCM output variables (such as cloudiness precipitation)? 6
7 n How to develop Climate Change scenarios for impacts studies in hydrology? Spatial scale ~ afewkm 2 to several 1 km 2 Temporal scale ~ minutes to years A scale mismatch between the information that GCM can confidently provide and scales required by impacts studies. Downscaling methods are necessary!!! GCM Climate Simulations Precipitation (Extremes) at a Local Site 7
8 DESIGN STORM CONCEPT A design storm describes completely the distribution of rainfall intensity during the storm duration for a given return period. Two main types of synthetic design storms: n Design Storms derived from the IDF relationships. n Design Storms resulted from analysing and synthesising the characteristics of historical storm data. Intensity Atypical design storm: I max n Maximum Intensity: I MAX n Time to peak: T p n Duration: T n Temporal pattern T p T Time 8
9 Design Storm Estimation Issues Different synthetic ti design storm models available in various countries: n US Chicago storm model (Keifer and Chu, 1957) n US Normalized storm pattern by Huff (1967) n Czechoslovakian storm pattern by Sifalda (1973) n Australian design storm by Pilgrim and Cordery (1975) n UK Mean symmetric pattern (Flood Studies Report, 1975) n French storm model by Desbordes (1978) n US storm pattern by Yen and Chow (198) n Canadian Atmospheric Environment Service (198) n US balanced storm model (Army Corps of Engineer, 1982) n Canadian temporal rainfall patterns (Nguyen, 1981, ) n Canadian storm model by Watt et al. (1986) No general agreement as to which temporal storm pattern should be used for a particular site How to choose? How to compare? 9
10 Design Storm Comparison (Peyron et al., 25) For runoff peak flows: n the Canadian AES design storm n the Desbordes model (with a peak intensity duration of 3 minutes) For runoff volumes: n the Canadian pattern proposed by Watt et al. None of the eight design storms was able to provide accurate estimation of both runoff parameters. 1
11 The 1-hr optimal storm pattern for southern Quebec (Canada) Intensity 1.4 I 15min Total Volume = 1.3 V 1hr 2 15 PROPOSED DESIGN STORM Return Period: 2 years 5 years 1 years 5 years 1 years.8 I 15min Intensity (m mm/hr) min 25 min Time min Time (min) 6 min 11
12 Assessment of the Proposed Optimal Storm Pattern Runoff peak flows Basin shape Imperviousness Desbordes AES (%) (3 min) Watt Proposed Square Rectangular L/W= Rectangular L/W= Rectangular (Residential) Runoff volumes Basin shape Imperviousness Desbordes AES (%) (3 min) Watt Proposed Square Rectangular L/W= Rectangular L/W= Rectangular (Residential)
13 OBJECTIVES To assess the performance of statistical downscaling methods to find the best method in the simulation of daily precipitation time series for climate change impact studies. To develop an approach that t could link daily simulated climate variables from GCMs to sub-daily precipitation characteristics at a regional or local scale (the spatial-temporal temporal downscaling method). To assess the climate change impacts on extreme rainfalls, design storms, and the resulting runoff characteristics. 13
14 METHODOOGY DOWNSCALING METHODS Scenarios 14
15 (SPATIAL) DYNAMIC DOWNSCALING METHODS Coarse GCM + High resolution AGCM Variable resolution GCM (high resolution over the area of interest) GCM + RCM or LAM (Nested Modeling Approach) n More accurate downscaled d results as compared to the use of GCM outputs alone. n Spatial scales for RCM results ~ 2 to 5 km still larges for many hydrologic models. n Considerable computing resource requirement. 15
16 (SPATIAL) STATISTICAL DOWNSCALING METHODS Weather Typing or Classification n Generation daily weather series at a local site. n Classification schemes are somewhat subjective. Stochastic Weather Generators n Generation of realistic statistical properties of daily weather series at a local site. n Inexpensive computing resources n Climate change scenarios based on results predicted by GCM (unreliable for precipitation) Regression-Based Approaches n Generation daily weather series at a local site. n Results limited to local climatic conditions. n Long series of historical data needed. n Large-scale and local-scale parameter relations remain valid for future climate conditions. n Simple computational requirements. 16
17 SUMMARY Downscaling is necessary!!! GCM Climate Predictors Is it feasible? Local Daily Precipitation Series Is it feasible? Daily Extreme Precipitations Is it feasible? Sub-Daily Extreme Precipitations 17
18 The Spatial-Temporal Downscaling Approach GCMs: HadCM3 and CGCM2. NCEP Re-analysis data. Spatial downscaling method: the statistical downscaling model SDSM (Wilby et al., 22). Temporal downscaling method: the scaling GEV model (Nguyen et al. 22). 18
19 APPLICATIONS LARS-WG Stochastic ti Weather Generator (Semenov et al., 1998) n Generation of synthetic series of daily weather data at a local site (daily precipitation, maximum and minimum temperature, and daily solar radiation) n Procedure: 4Use semi-empiricalempirical probability distributions to describe the state of a day (wet or dry). 4Use semi-empirical empirical distributions for precipitation amounts (parameters estimated for each month). 4Use normal distributions for daily minimum and maximum temperatures. These distributions are conditioned on the wet/dry status of the day. Constant Lag-1 autocorrelation and cross-correlation correlation are assumed. 4Use semi-empiricalempirical distribution for daily solar radiation. This distribution is conditioned on the wet/dry status of the day. Constant Lag-1 autocorrelation is assumed. 19
20 Statistical Downscaling Model (SDSM) (Wilby et al., 21) n Generation of synthetic series of daily weather data at a local site based on empirical relationships between local-scale predictands (daily temperature and precipitation) and large- scale predictors (atmospheric variables) n Procedure: 4Identify large-scale predictors (X) that could control the local parameters (Y). 4Find a statistical relationship between X and Y. 4Validate the relationship with independent data. 4Generate Y using values of X from GCM data. 2


21 Geographical locations of sites under study. Geographical coordinates of the stations Station Lat ( o ) Long ( o ) Alt (m) Dorval 45 o o Drummondville 45 o o Maniwaki 46 o o Montreal McGill 45 o 3-73 o
22 DATA: n Observed daily yp precipitation p and temperature extremes at four sites in the Greater Montreal Region (Quebec, Canada) for the period. n NCEP re-analysis daily data for the period. n Calibration: ; validation: Variable Level of measurement Mean sea level pressure Airflow strength surface 85 hpa 5 hpa Zonal velocity surface 85 hpa 5 hpa Meridional velocity surface 85 hpa 5 hpa Vorticity surface 85 hpa 5 hpa Wind direction surface 85 hpa 5 hpa Divergence surface 85 hpa 5 hpa Specific humidity near surface 85 hpa 5 hpa Geopotential height 85 hpa 5 hpa 22
23 No Code Unit Time scale Description 1 Prcp1 % Season Percentage of wet days (daily precipitation i i 1 mm) 2 SDII mm/r.day Season Daily Mean: sum of daily precipitations / number of wet days 3 CDD days Season Maximum number of consecutive dry days (daily precipitation < 1 mm) 4 R3days mm Season Maximum 3-day precipitation total 5 Prec9p mm Season 9 th percentile of daily precipitation amount 6 Precip_mean mm/day Month Sum of daily precipitation in a month / number of days in that month 7 Precip_sd mm Month Standard deviation of daily precipitation in a month Evaluation indices and statistics 23
24 (mm) The mean of daily precipitation for the period of Dorval J F M A M J J A S O N D OBSERVED vs. SDSM-GENERATED MEAN (mm) (mm) Dorval ova Dorval OBS SDSM LARS J F M A M J J A S O N D 6 BIAS = Mean (Obs.) Mean (Est.) J F M A M J J A S O N D OBSERVED vs. LARS-WG-GENERATED MEAN 24
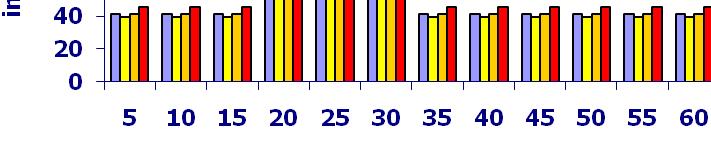
25 The mean of daily tmax for the period of (oc) 3 McGill J F M A M J J A S O N D OBSERVED vs. SDSM- AND LARS-WG-MEAN OF TMAX MGill McGill LARS SDSM OBS BIAS (oc) J F M A M J J A S O N D 25
![GCM and Downscaling Results (Precipitation Extremes ) 1- Observed 2- SDSM [CGCM1] 3- SDSM](/docs-images/87/95433935/images/26-1.jpg "[HADCM3] 4- CGCM1-Raw data 5- HADCM3-Raw data From CCAF Project Report by Gachon et al.")
26 GCM and Downscaling Results (Precipitation Extremes ) 1- Observed 2- SDSM [CGCM1] 3- SDSM [HADCM3] 4- CGCM1-Raw data 5- HADCM3-Raw data From CCAF Project Report by Gachon et al. (25) 26
27 SUMMARY Downscaling is necessary!!! LARS-WG and SDSM models could provide good good but generally biased biased estimates of the observed statistics of daily precipitation at a local site. GCM-Simulated Daily Precipitation Series Is it feasible? Daily Extreme Precipitations Is it feasible? Sub-Daily Extreme Precipitations 27
28 The Scaling Generalized Extreme-Value (GEV) Distribution. The scaling concept f ( t ) = C ( λ ). C ( λ ) = λ λ f ( λ t ) β k μ k = E { f ( t )} = α ( k ) β k The cumulative distribution function: F ( x ) = The quantile: exp 1 κ ( x ξ ) α t 1 / κ α X ( F ) = ξ + F ] κ { κ 1 [ ln } 28
29 The Scaling GEV Distribution The Scaling GEV Distribution ) ( ) (λ ) ( ) ( ) ( ) ( t t t t α λ λ α κ λ κ β = ) ( ) ( ) (. ) ( t t t t ξ λ λ ξ α λ λ α β β = = ) (. ) ( ) (. ) ( t X t X t t T T λ λ ξ λ λ ξ β = = ) ( ) ( T T ) ( where 1 t λ μ λ β = 29 ) ( μ 1 t
30 APPLICATION: Estimation of Extreme Rainfalls for Gaged Sites Data used: Raingage network: 88 stations in Quebec (Canada). Rainfall durations: from 5 minutes to 1 day. Record lengths: from 15 yrs. to 48 yrs. 3
31 Scaling of NCMs of extreme rainfalls with durations: 5-min to 1-hour and 1-hour to 1-day. 1.E+ 6 MONTREAL JEAN BREBEUF 1.E+ 6 MONTREAL McGILL 1.E+ 6 MONTREAL DORVAL 1.E+ 5 1.E+ 5 1.E+ 5 1.E+ 4 1.E+ 4 1.E+ 4 1.E+ 3 1.E+ 3 1.E+ 3 1.E+ 2 1.E+ 2 1.E+ 2 1.E+ 1 1.E+ 1 1.E+ 1 1.E Durations (min.) 1.E Durations (min.) 1.E Durations (min.) 1.E+ 6 SHAWVILLE 1.E+ 6 MANIWAKI 1.E+ 6 QUEBEC CITY 1.E+ 5 1.E+ 5 1.E+ 5 1.E+ 4 1.E+ 4 1.E+ 4 1.E+ 3 1.E+ 3 1.E+ 3 1.E+ 2 1.E+ 2 1.E+ 2 1.E+ 1 1.E+ 1 1.E+ 1 1E+ 1.E Durations (min.) 1E+ 1.E Durations (min.) 1E+ 1.E Durations (min.) 1.E+ 6 RIMOUSKI 1.E+ 6 AMOS 1.E+ 6 OKA LA TRAPPE 1.E+ 5 1.E+ 5 1.E+ 5 1E+4 1.E+4 1E+4 1.E+4 1E+4 1.E+4 1.E+ 3 1.E+ 3 1.E+ 3 1.E+ 2 1.E+ 2 1.E+ 2 1.E+ 1 1.E+ 1 1.E+ 1 1.E+ 1.E+ 1.E Durations (min.) Duratio ns (min.) Durations (min.) red: 1 st NCM; blue: 2 nd NCM; black: 3 rd NCM; markers: observed values; lines: fitted regression 31
32 Results on scaling regimes: Non-central moments are scaling. Two scaling regimes: 5-min. to 1-hour interval. 1-hour to 1-day interval. Based on these results, two estimations were made: 5-min. extreme rainfalls from 1-hr rainfalls. 1-hr. extreme rainfalls from 1-day rainfalls. 32
33 5-min Extreme Rainfalls estimated from 1-hour Extreme Rainfalls 2 MONTREAL DORVAL 2 MONTREAL JEAN BREBEUF 2 L'ASSOMPTION CDA Pro b ab ility Probability Probability 2 DRUMMONDVILLE 2 STE. AGATHE DES MONTS 3 MONTREAL McGILL Probability Pro b ab ility Probability 2 MANIWAKI 1 FORESTVILLE 2 SHAWINIGAN Pro b ab ility Probability Pro b ab ility markers: observed values lines: values estimated by scaling method markers: observed values lines: values estimated by scaling method 33
34 1-hour Extreme Rainfalls estimated from 1-day Extreme Rainfalls 6 MONTREAL DORVAL 6 STE. ANNE DE BELLEVUE 4 WEST DITTON Pro b ab ility Pro b ab ility Pro b ab ility 5 MONTREAL JEAN BREBEUF 9 MONTREAL McGILL 4 L'ASSOMPTION CDA Pro b ab ility Pro b ab ility Pro b ab ility 5 STE. AGATHE DES MONTS 5 MANIWAKI 3 SEPT-ILES AIRPORT Pro b ab ility Pro b ab ility Pro b ab ilty markers: observed values lines: values estimated by scaling method 34

.")


35 The Spatial-Temporal Downscaling: Application Study Region n Precipitation records from a network of 15 raingages in Quebec (Canada). Data n GCM outputs: 4HadCM3A2, HadCM3B2, 4CGMC2A2, CGCM2B2, 4Periods: , 199, 22s, 25s, 28s. n Observed data: 4Daily precipitation data, 4AMP for 5 min., 15 min., 3 min., 1hr., 2 hrs., 6 hrs., 12 hrs. 4Periods:
36 Daily AMPs estimated from GCMs versus observed daily AMPs at Dorval. Calibration period: Dist. of AM Daily Precip. before and after adjustment, , 1975 Dorval 1 Dist. of AM Daily Precip. before and after adjustment, , 1975 Dorval 9 9 AM Daily Precipitation (m mm) m) AM Daily Precipitation (m Observed CGCM2A2 Adj-CGCM2A Return period (years) 4 Observed HadCM3A2 Adj-HadCM3A Return period (years) CGCMA2 HadCM3A2 36
37 Residual = Daily AMP (GCM) - Observed daily AMP (local) Calibration period: CGCM2A2 estimates vs Residuals, HadCM3A2 estimates vs Residuals, Residuals 8 6 Residuals Residuals Fitted curve CGCM2A2 estimates Residuals Fitted curve HadCM3A2 estimates CGCMA2 HadCM3A2 37
38 Daily AMPs estimated from GCMs versus observed daily AMPs at Dorval. Validation period: Dist. of AM Daily Precip. before and after adjustment, , 1975 Dorval 1 Dist. of AM Daily Precip. before and after adjustment, , 1975 Dorval 9 9 AM Daily Precipitation (m mm) m) AM Daily Precipitation (m Observed CGCM2A2 Adj-CGCM2A Return period (years) 4 Observed HadCM3A2 Adj-HadCM3A Return period (years) CGCMA2 HadCM3A2 Adjusted Daily AMP (GCM) = Daily AMP (GCM) + Residual 38
39 13 Dist. of AM Daily Precip. after adjustment (CGCM2A2),Dorval 11 Dist. of AM Daily Precip. after adjustment (HadCM3A2),Dorval ) AM Daily Precipitation (mm) s 4 25s 28s Return period (years) 2 18 GEV Dist. of AM 5 min Precip. after adjustment (CGCM2A2), Dorval ) AM Daily Precipitation (mm) s 25s 28s Return period (years) GEV Dist. of AM 5 min Precip. after adjustment (HadCM3A2), Dorval AM 5 min Precipitation (mm) s 6 25s CGCMA2 28s Return period (years) Precipitation (mm) AM 5 min s 25s HadCM3A2 28s Return period (years) 39


40 CGCMA2 HadCM3A s 25s 28s A 5-year design storm by Peyron et al. based on CGCMA2 and HadCM3A2 scenarios 4
41 s 25s 28s A square area of 1 ha with 65% imperviousness 41
42 CONCLUSIONS (1) Significant advances have been achieved regarding the global climate modeling. However, GCM outputs are still not appropriate for assessing climate change impacts on the hydrologic cycle. Downscaling methods provide useful tools for this assessment. In general, LARS-WG and SDSM models could provide good but biased estimates of the observed statistical properties of the daily precipitation process at a local site. Differences between quantile estimates from observed daily AMPs and from GCM-based daily AMPs could be described by a second-order order non-linear function. Observed AMPs in Quebec exhibit two different scaling regimes for time scales ranging from 1 day to 1 hour, and from 1 hour to 5 minutes. 42
43 CONCLUSIONS (2) The proposed scaling GEV method could provide accurate AMP quantiles for sub-daily durations from daily AMPs. It is feasible to link daily GCM-simulated climate variables with sub-daily AMPs based on the proposed spatial- temporal downscaling method. IDF relations and design storms for different climate change scenarios could be constructed. AMPs derived from CGCM2A2 outputs show a large increasing trend for future periods, while those given by HadCM3A2 did NOT exhibit a large (increasing or decreasing) trend. Similar results were found for peak flows and volumes from urban areas of different sizes, shapes, and impervious conditions. 43
44 Thank you for your attention! 44
45 Slides required for presentations 45
46 I (mm/hr) True image time (hr) I (mm/hr) time (hr) 46
47 47


48 Climate Scenario development need: from coarse to high resolution A mismatch of scales between what climate models can supply and what environmental impact models require. Impact models require... 1km 1m km 5 3km GCMs or RCMs supply... Point P. Gachon 48
49 Data Points Regression curves 2 years 2 years 5 years 5 years 1 years 1 years 5 years 5 years 1 years 1 years Duration (min) Intensity-Duration-Frequency curves for Montreal area. 49
50 I 7 ntensity (mm/hr) Time (min) Return Period: 2 years 5 years 1 years 5 years 1 years I ( t ) = Chicago a ( b + t) IDF c i a[(1 c)( τ / ρ) [( τ / ρ) + b] = c+ 1 τ = t p τ = t t p t i( τ ) dτ = I ( t) t t a t i( τ ) dτ = (b b + t ) + b] t and ρ = r = t and ρ = 1 r b Design Storm / D for t t for t t p c p 5
51 Frequency of Natural Disasters in Canada (19-25) 16 Wildfires Avalanches 14 Cold Waves/Heat Waves Droughts Disasters Numb ber of Natural Earthquakes/Landslides Floods Freezing Rain Hail/Thunderstorms Hurricane/Typhoon Storms Tornados Tsunamis/Storm Surges 6 years data! Year Period Environment Canada (H. Auld) 51


 Trends in")
 Trends in")

52 Climate Trends and Variability Maximum and minimum temperatures have increased at similar rate Warming in the south and west, and cooling in the northeast (winter & spring) Trends in Winter Mean Temp ( C / 49 years) Trends in Spring Mean Temp ( C / 49 years) Trends in Summer Mean Temp ( C / 49 years) Trends in Fall Mean Temp ( C / 49 years) From X. Zhang, L. Vincent, B. Hogg and A. Niitsoo, Atmosphere-Ocean, 2 52
53 Validation of GCMs for Current Period ( ) Winter Temperature ( C) Model mean =all flux & non-flux corrected results (vs NCEP/NCAR dataset) [Source: IPCC TAR, 21, chap. 8] 53
A Spatial-Temporal Downscaling Approach To Construction Of Rainfall Intensity-Duration- Frequency Relations In The Context Of Climate Change
 City University of New York (CUNY) CUNY Academic Works International Conference on Hydroinformatics 8-1-2014 A Spatial-Temporal Downscaling Approach To Construction Of Rainfall Intensity-Duration- Frequency
Thessaloniki, Greece
 9th International Conference on Urban Drainage Modelling Effects of Climate Change on the Estimation of Intensity-Duration- Frequency (IDF) curves for, Greece, Greece G. Terti, P. Galiatsatou, P. Prinos
Indices of droughts (SPI & PDSI) over Canada as simulated by a statistical downscaling model: current and future periods
 over Canada as simulated by a statistical downscaling model: current and future periods") Indices of droughts (SPI & PDSI) over Canada as simulated by a statistical downscaling model: current and future periods Philippe Gachon 1, Rabah Aider 1 & Grace Koshida Adaptation & Impacts Research Division,
Indices of droughts (SPI & PDSI) over Canada as simulated by a statistical downscaling model: current and future periods Philippe Gachon 1, Rabah Aider 1 & Grace Koshida Adaptation & Impacts Research Division,
The Analysis of Uncertainty of Climate Change by Means of SDSM Model Case Study: Kermanshah
 World Applied Sciences Journal 23 (1): 1392-1398, 213 ISSN 1818-4952 IDOSI Publications, 213 DOI: 1.5829/idosi.wasj.213.23.1.3152 The Analysis of Uncertainty of Climate Change by Means of SDSM Model Case
CLIMATE CHANGE IMPACT PREDICTION IN UPPER MAHAWELI BASIN
 6 th International Conference on Structural Engineering and Construction Management 2015, Kandy, Sri Lanka, 11 th -13 th December 2015 SECM/15/163 CLIMATE CHANGE IMPACT PREDICTION IN UPPER MAHAWELI BASIN
Uncertainty analysis of statistically downscaled temperature and precipitation regimes in Northern Canada
 Theor. Appl. Climatol. 91, 149 170 (2008) DOI 10.1007/s00704-007-0299-z Printed in The Netherlands 1 OURANOS Consortium on Regional Climatology and Adaptation to Climate Change, Montreal (QC), Canada 2
Indices of droughts over Canada as simulated by a statistical downscaling model: current and future periods
 Indices of droughts over Canada as simulated by a statistical downscaling model: current and future periods Philippe Gachon 1, Rabah Aider 1 & Grace Koshida Adaptation & Impacts Research Section, Climate
Southern New England s Changing Climate. Raymond S. Bradley and Liang Ning Northeast Climate Science Center University of Massachusetts, Amherst
 Southern New England s Changing Climate Raymond S. Bradley and Liang Ning Northeast Climate Science Center University of Massachusetts, Amherst Historical perspective (instrumental data) IPCC scenarios
Estimation of Intensity Duration Frequency Curves for Current and Future Climates
 Estimation of Intensity Duration Frequency Curves for Current and Future Climates By Nicolas Desramaut Department of Civil Engineering and Applied Mechanics McGill University Montreal, Quebec, Canada A
Preliminary intercomparison results for NARCCAP, other RCMs, and statistical downscaling over southern Quebec
 Preliminary intercomparison results for NARCCAP, other RCMs, and statistical downscaling over southern Quebec Philippe Gachon Research Scientist Adaptation & Impacts Research Division, Atmospheric Science
Generating projected rainfall time series at sub-hourly time scales using statistical and stochastic downscaling methodologies
 Generating projected rainfall time series at sub-hourly time scales using statistical and stochastic downscaling methodologies S. Molavi 1, H. D. Tran 1,2, N. Muttil 1 1 School of Engineering and Science,
Downscaling in Time. Andrew W. Robertson, IRI. Advanced Training Institute on Climate Variability and Food Security, 12 July 2002
 Downscaling in Time Andrew W. Robertson, IRI Advanced Training Institute on Climate Variability and Food Security, 12 July 2002 Preliminaries Crop yields are driven by daily weather variations! Current
Adaptation by Design: The Impact of the Changing Climate on Infrastructure
 Adaptation by Design: The Impact of the Changing Climate on Infrastructure Heather Auld, J Klaassen, S Fernandez, S Eng, S Cheng, D MacIver, N Comer Adaptation and Impacts Research Division Environment
Temporal neural networks for downscaling climate variability and extremes *
 Neural Networks 19 (26) 135 144 26 Special issue Temporal neural networks for downscaling climate variability and extremes * Yonas B. Dibike, Paulin Coulibaly * www.elsevier.com/locate/neunet Department
Seasonal forecasting of climate anomalies for agriculture in Italy: the TEMPIO Project
 Seasonal forecasting of climate anomalies for agriculture in Italy: the TEMPIO Project M. Baldi(*), S. Esposito(**), E. Di Giuseppe (**), M. Pasqui(*), G. Maracchi(*) and D. Vento (**) * CNR IBIMET **
Climate Change Impact on Intensity-Duration- Frequency Curves in Ho Chi Minh city
 Climate Change Impact on Intensity-Duration- Frequency Curves in Ho Chi Minh city Khiem Van Mai, Minh Truong Ha, Linh Nhat Luu Institute of Meteorology, Hydrology and Climate Change, Hanoi, Vietnam Hanoi,
Université du Québec à Montréal!
 Université du Québec à Montréal! PhD candidate: Alejandro Di Luca! Director: René Laprise! Co director: Ramon de Elia! May 28th 2009! !! Wide range of atmospheric phenomena...!! Important dependence between
FUTURE CARIBBEAN CLIMATES FROM STATISTICAL AND DYNAMICAL DOWNSCALING
 FUTURE CARIBBEAN CLIMATES FROM STATISTICAL AND DYNAMICAL DOWNSCALING Arnoldo Bezanilla Morlot Center For Atmospheric Physics Institute of Meteorology, Cuba The Caribbean Community Climate Change Centre
CLIMATE CHANGE IMPACTS ON HYDROMETEOROLOGICAL VARIABLES AT LAKE KARLA WATERSHED
 Proceedings of the 14 th International Conference on Environmental Science and Technology Rhodes, Greece, 3-5 September 2015 CLIMATE CHANGE IMPACTS ON HYDROMETEOROLOGICAL VARIABLES AT LAKE KARLA WATERSHED
Climate Change Impact on Intensity-Duration- Frequency Curves in Ho Chi Minh city
 Climate Change Impact on Intensity-Duration- Frequency Curves in Ho Chi Minh city Minh Truong Ha Institute of Meteorology, Hydrology and Climate Change, Hanoi, Vietnam Kuala Lumpur, 06-2018 Rationale Unpredictable
Generation of synthetic design storms for the Upper Thames River basin
 Generation of synthetic design storms for the Upper Thames River basin CFCAS project: Assessment of Water Resources Risk and Vulnerability to Changing Climatic Conditions Project Report V. November 2004
Statistical downscaling methods for climate change impact assessment on urban rainfall extremes for cities in tropical developing countries A review
 1 Statistical downscaling methods for climate change impact assessment on urban rainfall extremes for cities in tropical developing countries A review International Conference on Flood Resilience: Experiences
STATISTICAL DOWNSCALING OF DAILY PRECIPITATION IN THE ARGENTINE PAMPAS REGION
 STATISTICAL DOWNSCALING OF DAILY PRECIPITATION IN THE ARGENTINE PAMPAS REGION Bettolli ML- Penalba OC Department of Atmospheric and Ocean Sciences, University of Buenos Aires, Argentina National Council
Downscaling of future rainfall extreme events: a weather generator based approach
 18 th World IMACS / MODSIM Congress, Cairns, Australia 13-17 y 29 http://mssanz.org.au/modsim9 Downscaling of future rainfall extreme events: a weather generator based approach Hashmi, M.Z. 1, A.Y. Shamseldin
Application of statistical downscaling model (SDSM) for long term prediction of rainfall in Sarawak, Malaysia
 for long term prediction of rainfall in Sarawak, Malaysia") Water Resources Management VIII 269 Application of statistical downscaling model (SDSM) for long term prediction of rainfall in Sarawak, Malaysia 1,2 2 2 3 M. Hussain, K. W. Yusof, M. R. Mustafa & N. R.
Water Resources Management VIII 269 Application of statistical downscaling model (SDSM) for long term prediction of rainfall in Sarawak, Malaysia 1,2 2 2 3 M. Hussain, K. W. Yusof, M. R. Mustafa & N. R.
URBAN DRAINAGE MODELLING
 9th International Conference URBAN DRAINAGE MODELLING Evaluating the impact of climate change on urban scale extreme rainfall events: Coupling of multiple global circulation models with a stochastic rainfall
Extremes Events in Climate Change Projections Jana Sillmann
 Extremes Events in Climate Change Projections Jana Sillmann Max Planck Institute for Meteorology International Max Planck Research School on Earth System Modeling Temperature distribution IPCC (2001) Outline
BUILDING CLIMATE CHANGE SCENARIOS OF TEMPERATURE AND PRECIPITATION IN ATLANTIC CANADA USING THE STATISTICAL DOWNSCALING MODEL (SDSM)
") BUILDING CLIMATE CHANGE SCENARIOS OF TEMPERATURE AND PRECIPITATION IN ATLANTIC CANADA USING THE STATISTICAL DOWNSCALING MODEL () GARY S. LINES* MICHAEL PANCURA CHRIS LANDER Meteorological Service of Canada,
BUILDING CLIMATE CHANGE SCENARIOS OF TEMPERATURE AND PRECIPITATION IN ATLANTIC CANADA USING THE STATISTICAL DOWNSCALING MODEL () GARY S. LINES* MICHAEL PANCURA CHRIS LANDER Meteorological Service of Canada,
Climate Dataset: Aitik Closure Project. November 28 th & 29 th, 2018
 1 Climate Dataset: Aitik Closure Project November 28 th & 29 th, 2018 Climate Dataset: Aitik Closure Project 2 Early in the Closure Project, consensus was reached to assemble a long-term daily climate
Multi-model approach for projecting future climate change conditions in Central Vietnam
 2011/03/03 at the ICSS-Asia 2011 conference Multi-model approach for projecting future climate change conditions in Central Vietnam Thanh NGO-DUC, Van Tan PHAN, Trung NGUYEN QUANG Department of Meteorology
Climate Downscaling 201
 Climate Downscaling 201 (with applications to Florida Precipitation) Michael E. Mann Departments of Meteorology & Geosciences; Earth & Environmental Systems Institute Penn State University USGS-FAU Precipitation
Adaptation for global application of calibration and downscaling methods of medium range ensemble weather forecasts
 Adaptation for global application of calibration and downscaling methods of medium range ensemble weather forecasts Nathalie Voisin Hydrology Group Seminar UW 11/18/2009 Objective Develop a medium range
Utilization of seasonal climate predictions for application fields Yonghee Shin/APEC Climate Center Busan, South Korea
 The 20 th AIM International Workshop January 23-24, 2015 NIES, Japan Utilization of seasonal climate predictions for application fields Yonghee Shin/APEC Climate Center Busan, South Korea Background Natural
Buenos días. Perdón - Hablo un poco de español!
 Buenos días Perdón - Hablo un poco de español! Introduction to different downscaling tools Rob Wilby Climate Change Science Manager rob.wilby@environment-agency.gov.uk Source: http://culter.colorado.edu/nwt/site_info/site_info.html
Long-range Forecast of Climate Change: Sri Lanka Future Scenario. G. B. Samarasinghe Director General of Meteorology
 Long-range Forecast of Climate Change: Sri Lanka Future Scenario G. B. Samarasinghe Director General of Meteorology 1 Line-up Global and Regional Future Scenarios Observed and Potential Impacts Observed
Climate Change Impact Analysis
 Climate Change Impact Analysis Patrick Breach M.E.Sc Candidate pbreach@uwo.ca Outline July 2, 2014 Global Climate Models (GCMs) Selecting GCMs Downscaling GCM Data KNN-CAD Weather Generator KNN-CADV4 Example
Dirk Schlabing and András Bárdossy. Comparing Five Weather Generators in Terms of Entropy
 Dirk Schlabing and András Bárdossy Comparing Five Weather Generators in Terms of Entropy Motivation 1 Motivation What properties of weather should be reproduced [...]? Dirk Schlabing & András Bárdossy,
Estimating Design Rainfalls Using Dynamical Downscaling Data
 Estimating Design Rainfalls Using Dynamical Downscaling Data Ke-Sheng Cheng Department of Bioenvironmental Systems Engineering Mater Program in Statistics National Taiwan University Introduction Outline
Appendix E. OURANOS Climate Change Summary Report
 Appendix E OURANOS Climate Change Summary Report Production of Climate Scenarios for Pilot Project and Case Studies The protocol developed for assessing the vulnerability of infrastructure requires data
Storm rainfall. Lecture content. 1 Analysis of storm rainfall 2 Predictive model of storm rainfall for a given
 Storm rainfall Lecture content 1 Analysis of storm rainfall 2 Predictive model of storm rainfall for a given max rainfall depth 1 rainfall duration and return period à Depth-Duration-Frequency curves 2
National Cheng Kung University, Taiwan. downscaling. Speaker: Pao-Shan Yu Co-authors: Dr Shien-Tsung Chen & Mr. Chin-yYuan Lin
 Department of Hydraulic & Ocean Engineering, National Cheng Kung University, Taiwan Impact of stochastic weather generator characteristic on daily precipitation downscaling Speaker: Pao-Shan Yu Co-authors:
CGE TRAINING MATERIALS ON VULNERABILITY AND ADAPTATION ASSESSMENT. Climate change scenarios
 CGE TRAINING MATERIALS ON VULNERABILITY AND ADAPTATION ASSESSMENT Climate change scenarios Outline Climate change overview Observed climate data Why we use scenarios? Approach to scenario development Climate
Analyzing the Variations in Intensity-Duration-Frequency (IDF) Curves in the City of Saskatoon under Climate Change
 Curves in the City of Saskatoon under Climate Change") Analyzing the Variations in Intensity-Duration-Frequency (IDF) Curves in the City of Saskatoon under Climate Change By Amin Elshorbagy, Alireza Nazemi, Md. Shahabul Alam 1 Centre for Advanced Numerical
Analyzing the Variations in Intensity-Duration-Frequency (IDF) Curves in the City of Saskatoon under Climate Change By Amin Elshorbagy, Alireza Nazemi, Md. Shahabul Alam 1 Centre for Advanced Numerical
Analysis of Storm Pattern for Design Urban Drainage System in the Monsoon Areas of Vietnam
 Journal of Environmental Science and Engineering A 7 (218) 49-68 doi:1.17265/2162-5298/218.2.1 D DAVID PUBLISHING Analysis of Storm Pattern for Design Urban Drainage System in the Monsoon Areas of Vietnam
What makes it difficult to predict extreme climate events in the long time scales?
 What makes it difficult to predict extreme climate events in the long time scales? Monirul Mirza Department of Physical and Environmental Sciences University of Toronto at Scarborough Email: monirul.mirza@utoronto.ca
Global warming and Extremes of Weather. Prof. Richard Allan, Department of Meteorology University of Reading
 Global warming and Extremes of Weather Prof. Richard Allan, Department of Meteorology University of Reading Extreme weather climate change Recent extreme weather focusses debate on climate change Can we
Linking climate change modelling to impacts studies: recent advances in downscaling techniques for hydrological extremes
 Linking climate change modelling to impacts studies: recent advances in downscaling techniques for hydrological extremes Dr Hayley Fowler, Newcastle University, UK CMOS-AMS Congress 2012, Montreal, Canada
Extreme Rainfall Indices for Tropical Monsoon Countries in Southeast Asia #
 Civil Engineering Dimension, Vol. 16, No. 2, September 2014, 112-116 ISSN 1410-9530 print / ISSN 1979-570X online CED 2014, 16(2), DOI: 10.9744/CED.16.2.112-116 Extreme Rainfall Indices for Tropical Monsoon
Climate Modelling and Scenarios in Canada. Elaine Barrow Principal Investigator (Science) Canadian Climate Impacts Scenarios (CCIS) Project
 Canadian Climate Impacts Scenarios (CCIS) Project") Climate Modelling and Scenarios in Canada Elaine Barrow Principal Investigator (Science) Canadian Climate Impacts Scenarios (CCIS) Project Canadian Centre for Climate Modelling and Analysis (CCCma) http://www.cccma.bc.ec.gc.ca
Climate Modelling and Scenarios in Canada Elaine Barrow Principal Investigator (Science) Canadian Climate Impacts Scenarios (CCIS) Project Canadian Centre for Climate Modelling and Analysis (CCCma) http://www.cccma.bc.ec.gc.ca
Future Weather in Toronto and the GTA
 Future Weather in Toronto and the GTA Due to Climate Change Electrical Sector Meeting, Nov. 23 rd, 2011 Christopher Ll. Morgan, PhD Toronto Environment Office Contents 2 Introduction (Why We Did What We
Will a warmer world change Queensland s rainfall?
 Will a warmer world change Queensland s rainfall? Nicholas P. Klingaman National Centre for Atmospheric Science-Climate Walker Institute for Climate System Research University of Reading The Walker-QCCCE
Regional climate projections for NSW
 Regional climate projections for NSW Dr Jason Evans Jason.evans@unsw.edu.au Climate Change Projections Global Climate Models (GCMs) are the primary tools to project future climate change CSIROs Climate
Journal of Hydrology
 Journal of Hydrology 401 (2011) 190 202 Contents lists available at ScienceDirect Journal of Hydrology journal homepage: www.elsevier.com/locate/jhydrol Uncertainty of downscaling method in quantifying
Impacts of climate change on flooding in the river Meuse
 Impacts of climate change on flooding in the river Meuse Martijn Booij University of Twente,, The Netherlands m.j.booij booij@utwente.nlnl 2003 in the Meuse basin Model appropriateness Appropriate model
CLIMATE CHANGE IMPACTS ON RAINFALL INTENSITY- DURATION-FREQUENCY CURVES OF HYDERABAD, INDIA
 CLIMATE CHANGE IMPACTS ON RAINFALL INTENSITY- DURATION-FREQUENCY CURVES OF HYDERABAD, INDIA V. Agilan Department of Civil Engineering, National Institute of Technology, Warangal, Telangana, India-506004,
Strategy for Using CPC Precipitation and Temperature Forecasts to Create Ensemble Forcing for NWS Ensemble Streamflow Prediction (ESP)
") Strategy for Using CPC Precipitation and Temperature Forecasts to Create Ensemble Forcing for NWS Ensemble Streamflow Prediction (ESP) John Schaake (Acknowlements: D.J. Seo, Limin Wu, Julie Demargne, Rob
Strategy for Using CPC Precipitation and Temperature Forecasts to Create Ensemble Forcing for NWS Ensemble Streamflow Prediction (ESP) John Schaake (Acknowlements: D.J. Seo, Limin Wu, Julie Demargne, Rob
CLIMATE CHANGE AND REGIONAL HYDROLOGY ACROSS THE NORTHEAST US: Evidence of Changes, Model Projections, and Remote Sensing Approaches
 CLIMATE CHANGE AND REGIONAL HYDROLOGY ACROSS THE NORTHEAST US: Evidence of Changes, Model Projections, and Remote Sensing Approaches Michael A. Rawlins Dept of Geosciences University of Massachusetts OUTLINE
Climate Risk Profile for Samoa
 Climate Risk Profile for Samoa Report Prepared by Wairarapa J. Young Samoa Meteorology Division March, 27 Summary The likelihood (i.e. probability) components of climate-related risks in Samoa are evaluated
The PRECIS Regional Climate Model
 The PRECIS Regional Climate Model General overview (1) The regional climate model (RCM) within PRECIS is a model of the atmosphere and land surface, of limited area and high resolution and locatable over
Anticipated and Observed Trends in the Global Hydrological Cycle. Kevin E. Trenberth NCAR
 Anticipated and Observed Trends in the Global Hydrological Cycle Kevin E. Trenberth NCAR The presence of moisture affects the disposition of incoming solar radiation: Evaporation (drying) versus temperature
March Regional Climate Modeling in Seasonal Climate Prediction: Advances and Future Directions
 1934-2 Fourth ICTP Workshop on the Theory and Use of Regional Climate Models: Applying RCMs to Developing Nations in Support of Climate Change Assessment and Extended-Range Prediction 3-14 March 2008 Regional
Precipitation Extremes in the Hawaiian Islands and Taiwan under a changing climate
 Precipitation Extremes in the Hawaiian Islands and Taiwan under a changing climate Pao-Shin Chu Department of Atmospheric Sciences University of Hawaii-Manoa Y. Ruan, X. Zhao, D.J. Chen, and P.L. Lin December
Global Climate Change and the Implications for Oklahoma. Gary McManus Associate State Climatologist Oklahoma Climatological Survey
 Global Climate Change and the Implications for Oklahoma Gary McManus Associate State Climatologist Oklahoma Climatological Survey OCS LEGISLATIVE MANDATES Conduct and report on studies of climate and weather
Regional Climate Change Modeling: An Application Over The Caspian Sea Basin. N. Elguindi and F. Giorgi The Abdus Salam ICTP, Trieste Italy
 Regional Climate Change Modeling: An Application Over The Caspian Sea Basin N. Elguindi and F. Giorgi The Abdus Salam ICTP, Trieste Italy Outline I. Background and historical information on the Caspian
Climate variability and changes at the regional scale: what we can learn from various downscaling approaches
 Climate variability and changes at the regional scale: what we can learn from various downscaling approaches by Philippe Gachon 1,2,3 Milka Radojevic 1,2, Hyung Il Eum 3, René Laprise 3 & Van Thanh Van
Prediction of Climate Change Impacts in Tanzania using Mathematical Models: The Case of Dar es Salaam City
 Prediction of Climate Change Impacts in Tanzania using Mathematical Models: The Case of Dar es Salaam City By Guido Uhinga PhD Student (Climate Change) Ardhi University Local Climate Solutions for Africa
Intensity-Duration-Frequency (IDF) Curves Example
 Curves Example") Intensity-Duration-Frequency (IDF) Curves Example Intensity-Duration-Frequency (IDF) curves describe the relationship between rainfall intensity, rainfall duration, and return period (or its inverse, probability
Intensity-Duration-Frequency (IDF) Curves Example Intensity-Duration-Frequency (IDF) curves describe the relationship between rainfall intensity, rainfall duration, and return period (or its inverse, probability
Stochastic weather generators and modelling climate change. Mikhail A. Semenov Rothamsted Research, UK
 Stochastic weather generators and modelling climate change Mikhail A. Semenov Rothamsted Research, UK Stochastic weather modelling Weather is the main source of uncertainty Weather.15.12 Management Crop
Julie A. Winkler. Raymond W. Arritt. Sara C. Pryor. Michigan State University. Iowa State University. Indiana University
 Julie A. Winkler Michigan State University Raymond W. Arritt Iowa State University Sara C. Pryor Indiana University Summarize by climate variable potential future changes in the Midwest as synthesized
Modelling changes in the runoff regime in Slovakia using high resolution climate scenarios
 Modelling changes in the runoff regime in Slovakia using high resolution climate scenarios K. HLAVČOVÁ, R. VÝLETA, J. SZOLGAY, S. KOHNOVÁ, Z. MACUROVÁ & P. ŠÚREK Department of Land and Water Resources
Review of Statistical Downscaling
 Review of Statistical Downscaling Ashwini Kulkarni Indian Institute of Tropical Meteorology, Pune INDO-US workshop on development and applications of downscaling climate projections 7-9 March 2017 The
TRENDS AND CHANGE IN CLIMATE OVER THE VOLTA RIVER BASIN
 TRENDS AND CHANGE IN CLIMATE OVER THE VOLTA RIVER BASIN VOLTRES PROJECT WORK PACKAGE 1a: CLIMATE KEY RESULTS E. Obuobie, H.E. Andersen, C. Asante-Sasu, M. Osei-owusu 11/9/217 OBJECTIVES Analyse long term
Regionalization Techniques and Regional Climate Modelling
 Regionalization Techniques and Regional Climate Modelling Joseph D. Intsiful CGE Hands-on training Workshop on V & A, Asuncion, Paraguay, 14 th 18 th August 2006 Crown copyright Page 1 Objectives of this
Muhammad Noor* & Tarmizi Ismail
 Malaysian Journal of Civil Engineering 30(1):13-22 (2018) DOWNSCALING OF DAILY AVERAGE RAINFALL OF KOTA BHARU KELANTAN, MALAYSIA Muhammad Noor* & Tarmizi Ismail Department of Hydraulic and Hydrology, Faculty
Operational Hydrologic Ensemble Forecasting. Rob Hartman Hydrologist in Charge NWS / California-Nevada River Forecast Center
 Operational Hydrologic Ensemble Forecasting Rob Hartman Hydrologist in Charge NWS / California-Nevada River Forecast Center Mission of NWS Hydrologic Services Program Provide river and flood forecasts
THE ROLE OF OCEAN STATE INDICES IN SEASONAL AND INTER-ANNUAL CLIMATE VARIABILITY OF THAILAND
 THE ROLE OF OCEAN STATE INDICES IN SEASONAL AND INTER-ANNUAL CLIMATE VARIABILITY OF THAILAND Manfred Koch and Werapol Bejranonda Department of Geohydraulics and Engineering Hydrology, University of Kassel,
Appendix 1: UK climate projections
 Appendix 1: UK climate projections The UK Climate Projections 2009 provide the most up-to-date estimates of how the climate may change over the next 100 years. They are an invaluable source of information
(Regional) Climate Model Validation
 Climate Model Validation") (Regional) Climate Model Validation Francis W. Zwiers Canadian Centre for Climate Modelling and Analysis Atmospheric Environment Service Victoria, BC Outline - three questions What sophisticated validation
(Regional) Climate Model Validation Francis W. Zwiers Canadian Centre for Climate Modelling and Analysis Atmospheric Environment Service Victoria, BC Outline - three questions What sophisticated validation
Regional climate-change downscaling for hydrological applications using a nonhomogeneous hidden Markov model
 Regional climate-change downscaling for hydrological applications using a nonhomogeneous hidden Markov model Water for a Healthy Country Flagship Steve Charles IRI Seminar, September 3, 21 Talk outline
Confronting Climate Change in the Great Lakes Region. Technical Appendix Climate Change Projections CLIMATE MODELS
 Confronting Climate Change in the Great Lakes Region Technical Appendix Climate Change Projections CLIMATE MODELS Large, three-dimensional, coupled atmosphere-ocean General Circulation Models (GCMs) of
Climate Dynamics (PCC 587): Hydrologic Cycle and Global Warming
: Hydrologic Cycle and Global Warming") Climate Dynamics (PCC 587): Hydrologic Cycle and Global Warming D A R G A N M. W. F R I E R S O N U N I V E R S I T Y O F W A S H I N G T O N, D E P A R T M E N T O F A T M O S P H E R I C S C I E N C
Climate Dynamics (PCC 587): Hydrologic Cycle and Global Warming D A R G A N M. W. F R I E R S O N U N I V E R S I T Y O F W A S H I N G T O N, D E P A R T M E N T O F A T M O S P H E R I C S C I E N C
Training: Climate Change Scenarios for PEI. Training Session April Neil Comer Research Climatologist
 Training: Climate Change Scenarios for PEI Training Session April 16 2012 Neil Comer Research Climatologist Considerations: Which Models? Which Scenarios?? How do I get information for my location? Uncertainty
Introduction of Seasonal Forecast Guidance. TCC Training Seminar on Seasonal Prediction Products November 2013
 Introduction of Seasonal Forecast Guidance TCC Training Seminar on Seasonal Prediction Products 11-15 November 2013 1 Outline 1. Introduction 2. Regression method Single/Multi regression model Selection
High Rainfall Events and Their Changes in the Hawaiian Islands
 High Rainfall Events and Their Changes in the Hawaiian Islands Pao-Shin Chu, Xin Zhao, Melodie Grubbs, Cheri Loughran, and Peng Wu Hawaii State Climate Office Department of Meteorology School of Ocean
VARIABILITY AND EXTREMES IN STATISTICALLY DOWNSCALED CLIMATE CHANGE PROJECTIONS AT GREENWOOD NOVA SCOTIA
 VARIABILITY AND EXTREMES IN STATISTICALLY DOWNSCALED CLIMATE CHANGE PROJECTIONS AT GREENWOOD NOVA SCOTIA MICHAEL PANCURA* GARY S. LINES Meteorological Service of Canada, Atlantic Region Science Report
Chiang Rai Province CC Threat overview AAS1109 Mekong ARCC
 Chiang Rai Province CC Threat overview AAS1109 Mekong ARCC This threat overview relies on projections of future climate change in the Mekong Basin for the period 2045-2069 compared to a baseline of 1980-2005.
NRC Workshop - Probabilistic Flood Hazard Assessment Jan 2013
 Regional Precipitation-Frequency Analysis And Extreme Storms Including PMP Current State of Understanding/Practice Mel Schaefer Ph.D. P.E. MGS Engineering Consultants, Inc. Olympia, WA NRC Workshop - Probabilistic
Future climate change in the Antilles: Regional climate, tropical cyclones and sea states
 Future climate change in the Antilles: Regional climate, tropical cyclones and sea states Ali Belmadani Météo-France Antilles-Guiana (DIRAG), Martinique Acknowledgements: P. Palany, R. Pilon, F. Chauvin,
Global Climate Models and Extremes
 Global Climate Models and Extremes Francis Zwiers 1, Slava Kharin 1, Xuebin Zhang 1, Gabi Hegerl 2 1 Environment Canada, 2 Duke University Photo: F. Zwiers Outline AMIP2 simulations (subtopic 2) IPCC AR4
ICRC-CORDEX Sessions A: Benefits of Downscaling Session A1: Added value of downscaling Stockholm, Sweden, 18 May 2016
 ICRC-CORDEX Sessions A: Benefits of Downscaling Session A1: Added value of downscaling Stockholm, Sweden, 18 May 2016 Challenges in the quest for added value of climate dynamical downscaling: Evidence
Climate change projections for Ontario: an updated synthesis for policymakers and planners
 Ministry of Natural Resources and Forestry Climate change projections for Ontario: an updated synthesis for policymakers and planners Shannon Fera and Adam Hogg Ontario Ministry of Natural Resources and
2016 Irrigated Crop Production Update
 2016 Irrigated Crop Production Update Mapping Climate Trends and Weather Extremes Across Alberta for the Period 1950-2010 Stefan W. Kienzle Department of Geography University of Lethbridge, Alberta, Canada
IAP Dynamical Seasonal Prediction System and its applications
 WCRP Workshop on Seasonal Prediction 4-7 June 2007, Barcelona, Spain IAP Dynamical Seasonal Prediction System and its applications Zhaohui LIN Zhou Guangqing Chen Hong Qin Zhengkun Zeng Qingcun Institute
Artificial Neural Network Prediction of Future Rainfall Intensity
 Ryan Patrick McGehee Dr. Puneet Srivastava Artificial Neural Network Prediction of Future Rainfall Intensity A Precursor to Understanding Climate Change Outcomes for the Southeastern United States Why
HIGH-RESOLUTION CLIMATE PROJECTIONS everyone wants them, how do we get them? KATHARINE HAYHOE
 HIGH-RESOLUTION CLIMATE PROJECTIONS everyone wants them, how do we get them? KATHARINE HAYHOE TEXAS TECH UNIVERSITY ATMOS RESEARCH We produce heat-trapping gases THE CLIMATE PROBLEM INCREASING GHG EMISSIONS
Water Balance in the Murray-Darling Basin and the recent drought as modelled with WRF
 18 th World IMACS / MODSIM Congress, Cairns, Australia 13-17 July 2009 http://mssanz.org.au/modsim09 Water Balance in the Murray-Darling Basin and the recent drought as modelled with WRF Evans, J.P. Climate
Future extreme precipitation events in the Southwestern US: climate change and natural modes of variability
 Future extreme precipitation events in the Southwestern US: climate change and natural modes of variability Francina Dominguez Erick Rivera Fernandez Hsin-I Chang Christopher Castro AGU 2010 Fall Meeting
Susanna Glaze, Bobby Creel, and Christopher Brown New Mexico State University AWRA Spring Specialty Conference 4-6 May 2009 Anchorage, Alaska
 Susanna Glaze, Bobby Creel, and Christopher Brown New Mexico State University 2009 AWRA Spring Specialty Conference 4-6 May 2009 Anchorage, Alaska Outline Introduction to general water resources issues
Updated rainfall intensity duration frequency curves for the City of London under the changing climate
 Updated rainfall intensity duration frequency curves for the City of London under the changing climate By: Slobodan P. Simonovic and Angela Peck Department of Civil and Environmental Engineering The University
Changes to Extreme Precipitation Events: What the Historical Record Shows and What It Means for Engineers
 Changes to Extreme Precipitation Events: What the Historical Record Shows and What It Means for Engineers Geoffrey M Bonnin National Oceanic and Atmospheric Administration National Weather Service Office