SELECTION CRITERIA TO STATISTICAL MODELS
|
|
|
- Ethelbert Quinn
- 5 years ago
- Views:
Transcription


1 Dayalbagh Educational Institute From the SelectedWorks of D. K. Chaturvedi Dr. Spring February 15, 2010 SELECTION CRITERIA TO STATISTICAL MODELS D. K. Chaturvedi, Dayalbagh Educational Institute Available at:

 Dayalbagh, Agra Email: dkc.foe@gmail.")
2 SELECTION CRITERIA TO STATISTICAL MODELS AND THEIR COMPARISON D.K. Chaturvedi Professor Dayalbagh Educational Institute (Deemed University) Dayalbagh, Agra Web Page:


3 (DEISEL) Soft Computing Group Professor Incharge 4 Teaching Staff members 4 Non-Teaching Staff Members 5 Ph.D. Students 6 M. Tech. Students Aim To exploit the tolerance for imprecision uncertainty, approximate reasoning and partial truth to achieve tractability, robustness, low solution cost, and close resemblance with human like decision making to find an approximate solution to an imprecisely/precisely formulated problem. Challenge The challenge is to exploit the tolerance for imprecision by devising methods of computation which lead to an optimal solution at low cost.


4 Ph.D. Scholar Supporting staff Colloborations Christian- Albrechts- Universität zu Kiel ADRDE Lab Agra IIT, Kanpur IIT, Rajstan JMI, Delhi
5 Work Done in DEISEL Feed-forward back-propagation ANN Developed Product / Sum Type Neuron based ANN Study of Aggregation functions on ANN performance Generalized Neuron and its variations Benchmark Testing GN Applications in Machine & Power System Development of Fuzzy Systems and Evolutionary Algorithms Integration of ANN/GNN, FS and EA Quantum Neuron


6 Outcome from Lab M.Tech. Dissertations 42 Ph.D. - 8 Books Published 4 Int. and national research Papers 140 Reviewed Int. J. Papers 45 Funded projects Completed - 5
7 Modeling and Simulation of Parachute. M.Tech. Dissertations guided - B.R. Gupta (ADRDE), An innovative approach for modeling and simulation of parachute inflation and its performance, Bahadur, K. (ADRDE), Modelling and Simulation Performance Characteristics of Flexible Aerodynamic Deceleration Device, Dec., Work Published - Chaturvedi, D.K., and Gupta, B.R., Simulation of Temperature Variation in Parachute Inflation, J. of The Institution of Engineers (India), AS, Vol. 76, Sept. 1995, pp Chaturvedi, D.K., and Gupta, B.R., Heat Generation Modelling During Parachute Packing and Deployment, National Conference on System Design and Simulation (SYDSIM), Agra, April 30 May 2, Chaturvedi, D.K., Bahadur, K., and Gupta, B.R., An Innovative Approach for Predicting the Selected Performance Characteristics of Aerodynamics deceleration Device, Proc. Of National Systems Conference (NSC 92), pp , Madras, Chaturvedi, D.K., Gupta, B.R., and Bahadur Kunwer, Performance Evaluation of Parachute During Inflation, Proc. Of National Systems Conference (NSC 94), D.E.I., Dayalbagh, pp. 232, Agra, Jan , 1995.
8 Aircraft Landing Control System M.Tech. Dissertations Guided Mahadev B. Alloli, Intelligent Control System for Aircraft Landing, April 98. Ramawadh Chauhan, Automatic Aircraft Landing Control System Using Neural Networks, Dec. 1998, Published Chaturvedi, D.K., Ramawadh Chauhan & Kalra, P.K, Applications of Generalised Neural Network for Aircraft Landing Control System, Int. J. on Soft Computing, Springer- Verlag, Vol. 6, No. 6, Sept. 2002, pp
9 Aircraft Arrester Barrier System M.Tech. Dissertation Guided R.K. sharma (ADRDE), Performance characteristics of Aircraft Arrester Barrier System, 1994 Published Chaturvedi, D.K., and Sharma, R.K., An Experimental Study of Initial Tension of Suspension Strap of Aircraft Arrester Barrier System, National Systems Conference, PSG College of Technology, Coimbatore, pp , Coimbatore, Dec , Chaturvedi, D.K., and Sharma, R.K., Modelling and Simulation of Force Generated in Stanchion System of Aircraft Arrester Barrier System, Int. J. of Modelling, Measurements, and Control, France, B, Vol. 64, No. 2, 1996, pp
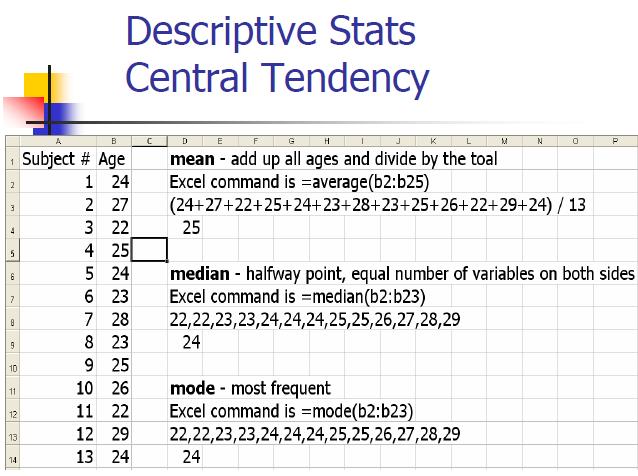
10 STATISTICS The systematic and scientific treatment of quantitative measurement is precisely known as statistics. Statistics is concerned with collection, classification ( or organization) and relationship in data.
11 Need of Statistical Tools Modern problems and needs are forcing statistical methods and statistical ideas more and more to the fore. There are many things we wish to know which cannot be discovered by a single observation or be single measurement.
12 Various statistical Tools The statistical tools are commonly used are Average or mean, Error, correlation coefficient, variance and to develop forecasting models etc.

13 Variables Qualitative or Color of ball (e.g., red, green, blue) or breed of a dog (e.g., collie, shepherd, terrier) Quantitative number of people in the city
14 Variable Discrete flip a coin and count the number of heads Continuous Velocity of vehicle.
15 Variable Univariate data. conducted a survey to estimate the average weight of high school students. Bivariate data. examines the relationship between two variables eg. relationship between the height and weight of high school students.
16
17
18
19
20
21
22
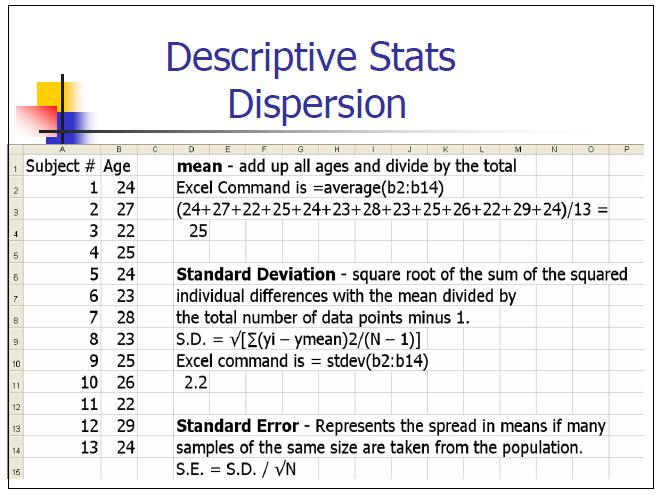
23 Standard Deviation A larger standard deviation (shown in light pink) indicates more scatter -- less precision -- in the results. A smaller standard deviation (shown in light blue) indicates less scatter. Both sets of results have the same mean (the green line). σ 2 = Σ ( X i - μ ) 2 / N
24 Measures of Variability Range is the difference between the largest and smallest values in a set of values. Variance is the average squared deviation from the population mean, as defined by the following formula: σ 2 = Σ ( X i - μ ) 2 / N Standard Deviation is the square root of the variance. Thus, the standard deviation of a population is: σ = sqrt * σ 2 ]
 Zero correlation (r = 0) Minimum negative correlation Moderate negative correlation Strong correlation & outlier (r = -1.0) (r = -0.")
25 Correlation Correlation coefficients measure the strength of association between two variables Maximum positive correlation (r = 1.0) Strong positive correlation (r = 0.80) Zero correlation (r = 0) Minimum negative correlation Moderate negative correlation Strong correlation & outlier (r = -1.0) (r = -0.43) The correlation r between two variables is: r = [ 1 / (n - 1) + * Σ, * (x i - x) / s x ] * [ (y i - y) / s y ] } (r = 0.71)
26 Regression Regression was first used by British biometrician Sir Francis galton( ). According to his law of universal regression each peculiarity in a man is shared by his kinsman but on the average in a less degree Tall fathers do tend to have tall sons yet the average height of tall fathers is more than a average height of tall sons. Short fathers do tend to have short sons yet the average height of short fathers is less than a average height of tall sons Dayalbagh Education Institute, Agra 25

27 Dayalbagh Education Institute, Agra 26
28 Regression Analysis Regression Analysis: Dictionary meaning of regression is stepping back Regression Analysis: Some sort of functional relation ship between two or more related variable Regression Analysis: in regression any of the variable may be consider as a independent or dependent Dayalbagh Education Institute, Agra 27
29 Regression Analysis Easy to use and applies to many situations Simple Regression: single explanatory variable Multiple Regression: includes any number of explanatory variables. Dayalbagh Education Institute, Agra 28
30 Regression Analysis Dependant variable: the single variable being explained/ predicted by the regression model (response variable) Independent variable: The explanatory variable(s) used to predict the dependant variable. (predictor variable) Dayalbagh Education Institute, Agra 29
31 Regression Analysis Linear Regression: straight-line relationship Form: y= mx+b Non-linear: implies curved relationships, for example logarithmic relationships Dayalbagh Education Institute, Agra 30
32 LEAST SQUARE ERROR TECHNIQUE Suppose y=mx+c reprents a straight line. Given a set of observed data (a1,b1).,(an,bn ). According to least square method the total error of the estimated points on a straight line with respect to observed points is minimal. Dayalbagh Education Institute, Agra 31
33
34

35 Statistical Forecasting Forecasting means Looking into the future
36 Load Forecasts Short term forecasts (one hour to a week) Medium forecasts (a month up to a year) Long term forecasts (over one year)
37 Time Line in Forecasting Observations Time Backcast Data used for model development Ante Forecasting Backcasting period Forecasting Forecasting period
38 Statistical Forecasting Models The selection criteria for statistical forecasting models have been well established for: Satisfaction of specific conditions (assumptions) under laying the statistical formulation of the model; Statistical significance of the model; Evaluation of forecast summary statistics over both the estimation and the ex post time periods.
39 FORECASTING TECHNIQUES Forecasting Qualitative Quantitative

40 QUALITATIVE TECHNIQUES Naïve Extrapolation Sales Force Composite Jury of Experts Opinion Scenario Methods Delphi Technique Historical Analogy
41 Quantitative methods Statistical methods Market Testing Market Survey Time Series methods ARX method ARMAX Association or causal method Correlation models Econometric model

42 Qualitative Approaches to Forecasting Delphi Approach A panel of experts, each of whom is physically separated from the others and is anonymous, is asked to respond to a sequential series of questionnaires. After each questionnaire, the responses are tabulated and the information and opinions of the entire group are made known to each of the other panel members so that they may revise their previous forecast response. The process continues until some degree of consensus is achieved. 41
43 Qualitative Approaches (continued) Scenario Writing Scenario writing consists of developing a conceptual scenario of the future based on a well defined set of assumptions. After several different scenarios have been developed, the decision maker determines which is most likely to occur in the future and makes decisions accordingly. 42
44 Qualitative Approaches (continued) Subjective or Interactive Approaches These techniques are often used by committees or panels seeking to develop new ideas or solve complex problems. They often involve "brainstorming sessions". It is important in such sessions that any ideas or opinions be permitted to be presented without regard to its relevancy and without fear of criticism. 43


45 Quantitative Approaches to Forecasting Quantitative methods are based on an analysis of historical data concerning one or more time series. A time series is a set of observations measured at successive points in time or over successive periods of time. If the historical data used are restricted to past values of the series that we are trying to forecast, the procedure is called a time series method. If the historical data used involve other time series that are believed to be related to the time series that we are trying to forecast, the procedure is called a causal method. Quantitative approaches are generally preferred. 44

46 Time Series Data Time Series Data is usually plotted on a graph to determine the various characteristics or components of the time series data. There are 4 Major Components: Trend, Cyclical, Seasonal, and Irregular Components. 45


47 Components of a Time Series The trend component accounts for the gradual shifting of the time series over a long period of time. Any regular pattern of sequences of values above and below the trend line is attributable to the cyclical component of the series. The seasonal component of the series accounts for regular patterns of variability within certain time periods, such as over a year. The irregular component of the series is caused by short-term, unanticipated and non-recurring factors that affect the values of the time series. One cannot attempt to predict its impact on the time series in advance. 46

48 Time Series Data Forecasting Approaches: Smoothing Trend Projections 47

49 Smoothing Methods In cases in which the time series is fairly stable and has no significant trend, seasonal, or cyclical effects, one can use smoothing methods to average out the irregular components of the time series. Three common smoothing methods are: Moving average Weighted moving average Exponential smoothing 48

50 Smoothing Methods: Moving Average Moving Average Method The moving average method consists of computing an average of the most recent n data values for the series and using this average for forecasting the value of the time series for the next period. 49
51 Smoothing Methods: Weighted Moving Average Weighted Moving Average Method The weighted moving average method consists of computing a weighted average of the most recent n data values for the series and using this weighted average for forecasting the value of the time series for the next period. The more recent observations are typically given more weight than older observations. For convenience, the weights usually sum to 1. The regular moving average gives equal weight to past data values when computing a forecast for the next period. The weighted moving average allows different weights to be allocated to past data values. 50
52 Smoothing Methods: Weighted Moving Average Use a 3 period weighted moving average to forecast the sales for week 11 giving a weight of 0.6 to the most recent period, 0.3 to the second most recent period, and 0.1 to the third most recent period. F 11 = (0.6)*130 + (0.3)*110 + (0.1)* 115= Sales for the most recent period Sales for 2 nd most recent period Sales for 3 rd most recent period Thus we would forecast the sales for week 11 to be
53 Smoothing Methods: Exponential Smoothing Exponential Smoothing Using exponential smoothing, the forecast for the next period is equal to the forecast for the current period plus a proportion ( ) of the forecast error in the current period. Using exponential smoothing, the forecast is calculated by: F t+1 = Y t + (1- )F t where: is the smoothing constant (a number between 0 and 1) F t is the forecast for period t This is the same as F t+1 = F t + α (Y t F t ) F t +1 is the forecast for period t+1 Y t is the actual data value for period t 52
54 Trend Projection If a time series exhibits a linear trend, the method of least squares may be used to determine a trend line (projection) for future forecasts. Least squares, also used in regression analysis, determines the unique trend line forecast which minimizes the mean square error between the trend line forecasts and the actual observed values for the time series. The independent variable is the time period and the dependent variable is the actual observed value in the time series. 53
 2 where: Y t = observed value of the time series")
55 Trend Projection Using the method of least squares, the formula for the trend projection is: Y t = b 0 + b 1 t. where: Y t = trend forecast for time period t b 1 = slope of the trend line b 0 = trend line projection for time 0 b 1 = n ty t - t Y t n t 2 - ( t ) 2 where: Y t = observed value of the time series at time period t t Y t b0 Y b1t = average of the observed values for Y t = average time period for the n observations 54
56 Causal Method: Regression Analysis Regression Analysis is similar to trend analysis, except the independent variable is not restricted to time. Refer to Robert s Drug example. Instead of letting time represent our independent variable, we could forecast sales based upon the price of the product. Since products often go on sale, we could collect data over several months collecting the weekly price and number of items sold for the week. For this model, we would find the regression equation in the same manner in which we found the trend line except we would call the independent variable x, instead of t. 55
57 Various stats tools Mean, Mode, Median Variance, SD Regression Discussed forecast methods Qualitative and Quantitative 56


58 57
A B C 1 Robert's Drugs 2 3 Week (t ) Sales t. Forec t
 Sales t. Forec t") Chapter 7 Forecasting Quantitative Approaches to Forecasting The Components of a Time Series Measures of Forecast Accuracy Using Smoothing Methods in Forecasting Using Seasonal Components in Forecasting
Chapter 7 Forecasting Quantitative Approaches to Forecasting The Components of a Time Series Measures of Forecast Accuracy Using Smoothing Methods in Forecasting Using Seasonal Components in Forecasting
Chapter 7 Forecasting Demand
 Chapter 7 Forecasting Demand Aims of the Chapter After reading this chapter you should be able to do the following: discuss the role of forecasting in inventory management; review different approaches
Glossary. The ISI glossary of statistical terms provides definitions in a number of different languages:
 Glossary The ISI glossary of statistical terms provides definitions in a number of different languages: http://isi.cbs.nl/glossary/index.htm Adjusted r 2 Adjusted R squared measures the proportion of the
Forecasting. Copyright 2015 Pearson Education, Inc.
 5 Forecasting To accompany Quantitative Analysis for Management, Twelfth Edition, by Render, Stair, Hanna and Hale Power Point slides created by Jeff Heyl Copyright 2015 Pearson Education, Inc. LEARNING
Lecture Prepared By: Mohammad Kamrul Arefin Lecturer, School of Business, North South University
 Lecture 15 20 Prepared By: Mohammad Kamrul Arefin Lecturer, School of Business, North South University Modeling for Time Series Forecasting Forecasting is a necessary input to planning, whether in business,
Operations Management
 3-1 Forecasting Operations Management William J. Stevenson 8 th edition 3-2 Forecasting CHAPTER 3 Forecasting McGraw-Hill/Irwin Operations Management, Eighth Edition, by William J. Stevenson Copyright
Chapter 13: Forecasting
 Chapter 13: Forecasting Assistant Prof. Abed Schokry Operations and Productions Management First Semester 2013-2014 Chapter 13: Learning Outcomes You should be able to: List the elements of a good forecast
Industrial Engineering Prof. Inderdeep Singh Department of Mechanical & Industrial Engineering Indian Institute of Technology, Roorkee
 Industrial Engineering Prof. Inderdeep Singh Department of Mechanical & Industrial Engineering Indian Institute of Technology, Roorkee Module - 04 Lecture - 05 Sales Forecasting - II A very warm welcome
Chapter 5: Forecasting
 1 Textbook: pp. 165-202 Chapter 5: Forecasting Every day, managers make decisions without knowing what will happen in the future 2 Learning Objectives After completing this chapter, students will be able
Assistant Prof. Abed Schokry. Operations and Productions Management. First Semester
 Chapter 3 Forecasting Assistant Prof. Abed Schokry Operations and Productions Management First Semester 2010 2011 Chapter 3: Learning Outcomes You should be able to: List the elements of a good forecast
FORECASTING STANDARDS CHECKLIST
 FORECASTING STANDARDS CHECKLIST An electronic version of this checklist is available on the Forecasting Principles Web site. PROBLEM 1. Setting Objectives 1.1. Describe decisions that might be affected
QMT 3001 BUSINESS FORECASTING. Exploring Data Patterns & An Introduction to Forecasting Techniques. Aysun KAPUCUGİL-İKİZ, PhD.
 1 QMT 3001 BUSINESS FORECASTING Exploring Data Patterns & An Introduction to Forecasting Techniques Aysun KAPUCUGİL-İKİZ, PhD. Forecasting 2 1 3 4 2 5 6 3 Time Series Data Patterns Horizontal (stationary)
Chapter 8 - Forecasting
 Chapter 8 - Forecasting Operations Management by R. Dan Reid & Nada R. Sanders 4th Edition Wiley 2010 Wiley 2010 1 Learning Objectives Identify Principles of Forecasting Explain the steps in the forecasting
Dennis Bricker Dept of Mechanical & Industrial Engineering The University of Iowa. Forecasting demand 02/06/03 page 1 of 34
 demand -5-4 -3-2 -1 0 1 2 3 Dennis Bricker Dept of Mechanical & Industrial Engineering The University of Iowa Forecasting demand 02/06/03 page 1 of 34 Forecasting is very difficult. especially about the
Introduction to Forecasting
 Introduction to Forecasting Introduction to Forecasting Predicting the future Not an exact science but instead consists of a set of statistical tools and techniques that are supported by human judgment
Forecasting. Dr. Richard Jerz rjerz.com
 Forecasting Dr. Richard Jerz 1 1 Learning Objectives Describe why forecasts are used and list the elements of a good forecast. Outline the steps in the forecasting process. Describe at least three qualitative
Exponential smoothing is, like the moving average forecast, a simple and often used forecasting technique
 EconS 450 Advanced Farm Management Forecasting Lecture 2 Simple Exponential Smoothing Exponential smoothing is, like the moving average forecast, a simple and often used forecasting technique Exponential
Forecasting Chapter 3
 Forecasting Chapter 3 Introduction Current factors and conditions Past experience in a similar situation 2 Accounting. New product/process cost estimates, profit projections, cash management. Finance.
3. If a forecast is too high when compared to an actual outcome, will that forecast error be positive or negative?
 1. Does a moving average forecast become more or less responsive to changes in a data series when more data points are included in the average? 2. Does an exponential smoothing forecast become more or
Simple Regression Model (Assumptions)
") Simple Regression Model (Assumptions) Lecture 18 Reading: Sections 18.1, 18., Logarithms in Regression Analysis with Asiaphoria, 19.6 19.8 (Optional: Normal probability plot pp. 607-8) 1 Height son, inches
Simple Regression Model (Assumptions) Lecture 18 Reading: Sections 18.1, 18., Logarithms in Regression Analysis with Asiaphoria, 19.6 19.8 (Optional: Normal probability plot pp. 607-8) 1 Height son, inches
Mathematics for Economics MA course
 Mathematics for Economics MA course Simple Linear Regression Dr. Seetha Bandara Simple Regression Simple linear regression is a statistical method that allows us to summarize and study relationships between
WEATHER NORMALIZATION METHODS AND ISSUES. Stuart McMenamin Mark Quan David Simons
 WEATHER NORMALIZATION METHODS AND ISSUES Stuart McMenamin Mark Quan David Simons Itron Forecasting Brown Bag September 17, 2013 Please Remember» Phones are Muted: In order to help this session run smoothly,
Lecture Prepared By: Mohammad Kamrul Arefin Lecturer, School of Business, North South University
 Lecture 15 20 Prepared By: Mohammad Kamrul Arefin Lecturer, School of Business, North South University Modeling for Time Series Forecasting Forecasting is a necessary input to planning, whether in business,
Components for Accurate Forecasting & Continuous Forecast Improvement
 Components for Accurate Forecasting & Continuous Forecast Improvement An ISIS Solutions White Paper November 2009 Page 1 Achieving forecast accuracy for business applications one year in advance requires
Short Term Load Forecasting Using Multi Layer Perceptron
 International OPEN ACCESS Journal Of Modern Engineering Research (IJMER) Short Term Load Forecasting Using Multi Layer Perceptron S.Hema Chandra 1, B.Tejaswini 2, B.suneetha 3, N.chandi Priya 4, P.Prathima
YEAR 10 GENERAL MATHEMATICS 2017 STRAND: BIVARIATE DATA PART II CHAPTER 12 RESIDUAL ANALYSIS, LINEARITY AND TIME SERIES
 YEAR 10 GENERAL MATHEMATICS 2017 STRAND: BIVARIATE DATA PART II CHAPTER 12 RESIDUAL ANALYSIS, LINEARITY AND TIME SERIES This topic includes: Transformation of data to linearity to establish relationships
CP:
 Adeng Pustikaningsih, M.Si. Dosen Jurusan Pendidikan Akuntansi Fakultas Ekonomi Universitas Negeri Yogyakarta CP: 08 222 180 1695 Email : adengpustikaningsih@uny.ac.id Operations Management Forecasting
Estadística I Exercises Chapter 4 Academic year 2015/16
 Estadística I Exercises Chapter 4 Academic year 2015/16 1. An urn contains 15 balls numbered from 2 to 16. One ball is drawn at random and its number is reported. (a) Define the following events by listing
MIDTERM EXAMINATION (Spring 2011) STA301- Statistics and Probability
 STA301- Statistics and Probability") STA301- Statistics and Probability Solved MCQS From Midterm Papers March 19,2012 MC100401285 Moaaz.pk@gmail.com Mc100401285@gmail.com PSMD01 MIDTERM EXAMINATION (Spring 2011) STA301- Statistics and Probability
STA301- Statistics and Probability Solved MCQS From Midterm Papers March 19,2012 MC100401285 Moaaz.pk@gmail.com Mc100401285@gmail.com PSMD01 MIDTERM EXAMINATION (Spring 2011) STA301- Statistics and Probability
Ch. 12: Workload Forecasting
 Ch. 12: Workload Forecasting Kenneth Mitchell School of Computing & Engineering, University of Missouri-Kansas City, Kansas City, MO 64110 Kenneth Mitchell, CS & EE dept., SCE, UMKC p. 1/2 Introduction
Forecasting Using Time Series Models
 Forecasting Using Time Series Models Dr. J Katyayani 1, M Jahnavi 2 Pothugunta Krishna Prasad 3 1 Professor, Department of MBA, SPMVV, Tirupati, India 2 Assistant Professor, Koshys Institute of Management
Operations Management
 Operations Management Chapter 4 Forecasting PowerPoint presentation to accompany Heizer/Render Principles of Operations Management, 7e Operations Management, 9e 2008 Prentice Hall, Inc. 4 1 Outline Global
Warwick Business School Forecasting System. Summary. Ana Galvao, Anthony Garratt and James Mitchell November, 2014
 Warwick Business School Forecasting System Summary Ana Galvao, Anthony Garratt and James Mitchell November, 21 The main objective of the Warwick Business School Forecasting System is to provide competitive
FORECASTING AND MODEL SELECTION
 FORECASTING AND MODEL SELECTION Anurag Prasad Department of Mathematics and Statistics Indian Institute of Technology Kanpur, India REACH Symposium, March 15-18, 2008 1 Forecasting and Model Selection
Antti Salonen PPU Le 2: Forecasting 1
 - 2017 1 Forecasting Forecasts are critical inputs to business plans, annual plans, and budgets Finance, human resources, marketing, operations, and supply chain managers need forecasts to plan: output
A Feature Based Neural Network Model for Weather Forecasting
 World Academy of Science, Engineering and Technology 4 2 A Feature Based Neural Network Model for Weather Forecasting Paras, Sanjay Mathur, Avinash Kumar, and Mahesh Chandra Abstract Weather forecasting
PPU411 Antti Salonen. Forecasting. Forecasting PPU Forecasts are critical inputs to business plans, annual plans, and budgets
 - 2017 1 Forecasting Forecasts are critical inputs to business plans, annual plans, and budgets Finance, human resources, marketing, operations, and supply chain managers need forecasts to plan: output
TIMES SERIES INTRODUCTION INTRODUCTION. Page 1. A time series is a set of observations made sequentially through time
 TIMES SERIES INTRODUCTION A time series is a set of observations made sequentially through time A time series is said to be continuous when observations are taken continuously through time, or discrete
EM375 STATISTICS AND MEASUREMENT UNCERTAINTY CORRELATION OF EXPERIMENTAL DATA
 EM375 STATISTICS AND MEASUREMENT UNCERTAINTY CORRELATION OF EXPERIMENTAL DATA In this unit of the course we use statistical methods to look for trends in data. Often experiments are conducted by having
UNIVERSITY OF CALICUT
 QUANTITATIVE TECHNIQUES FOR BUSINESS COMPLEMENTARY COURSE BBA (III Semester) B Com( (IV Semester) (2011 Admission) UNIVERSITY OF CALICUT SCHOOL OF DISTANCE EDUCATION Calicut University P.O. Malappuram,
Lecture 4 Forecasting
 King Saud University College of Computer & Information Sciences IS 466 Decision Support Systems Lecture 4 Forecasting Dr. Mourad YKHLEF The slides content is derived and adopted from many references Outline
Forecasting with Expert Opinions
 CS 229 Machine Learning Forecasting with Expert Opinions Khalid El-Awady Background In 2003 the Wall Street Journal (WSJ) introduced its Monthly Economic Forecasting Survey. Each month the WSJ polls between
Stat 101 L: Laboratory 5
 Stat 101 L: Laboratory 5 The first activity revisits the labeling of Fun Size bags of M&Ms by looking distributions of Total Weight of Fun Size bags and regular size bags (which have a label weight) of
Mini-Lecture 4.1 Scatter Diagrams and Correlation
 Mini-Lecture 4.1 Scatter Diagrams and Correlation Objectives 1. Draw and interpret scatter diagrams 2. Describe the properties of the linear correlation coefficient 3. Compute and interpret the linear
Time-Series Analysis. Dr. Seetha Bandara Dept. of Economics MA_ECON
 Time-Series Analysis Dr. Seetha Bandara Dept. of Economics MA_ECON Time Series Patterns A time series is a sequence of observations on a variable measured at successive points in time or over successive
WRF Webcast. Improving the Accuracy of Short-Term Water Demand Forecasts
 No part of this presentation may be copied, reproduced, or otherwise utilized without permission. WRF Webcast Improving the Accuracy of Short-Term Water Demand Forecasts August 29, 2017 Presenters Maureen
Harvard University. Rigorous Research in Engineering Education
 Statistical Inference Kari Lock Harvard University Department of Statistics Rigorous Research in Engineering Education 12/3/09 Statistical Inference You have a sample and want to use the data collected
CHAPTER 4: DATASETS AND CRITERIA FOR ALGORITHM EVALUATION
 CHAPTER 4: DATASETS AND CRITERIA FOR ALGORITHM EVALUATION 4.1 Overview This chapter contains the description about the data that is used in this research. In this research time series data is used. A time
Time Series and Forecasting
 Time Series and Forecasting Introduction to Forecasting n What is forecasting? n Primary Function is to Predict the Future using (time series related or other) data we have in hand n Why are we interested?
Analysis of Variance and Co-variance. By Manza Ramesh
 Analysis of Variance and Co-variance By Manza Ramesh Contents Analysis of Variance (ANOVA) What is ANOVA? The Basic Principle of ANOVA ANOVA Technique Setting up Analysis of Variance Table Short-cut Method
Antti Salonen KPP Le 3: Forecasting KPP227
 - 2015 1 Forecasting Forecasts are critical inputs to business plans, annual plans, and budgets Finance, human resources, marketing, operations, and supply chain managers need forecasts to plan: output
Fuzzy Systems. Introduction
 Fuzzy Systems Introduction Prof. Dr. Rudolf Kruse Christian Moewes {kruse,cmoewes}@iws.cs.uni-magdeburg.de Otto-von-Guericke University of Magdeburg Faculty of Computer Science Department of Knowledge
Every day, health care managers must make decisions about service delivery
 Y CHAPTER TWO FORECASTING Every day, health care managers must make decisions about service delivery without knowing what will happen in the future. Forecasts enable them to anticipate the future and plan
Marquette University Executive MBA Program Statistics Review Class Notes Summer 2018
 Marquette University Executive MBA Program Statistics Review Class Notes Summer 2018 Chapter One: Data and Statistics Statistics A collection of procedures and principles
Time Series and Forecasting
 Time Series and Forecasting Introduction to Forecasting n What is forecasting? n Primary Function is to Predict the Future using (time series related or other) data we have in hand n Why are we interested?
Diploma Part 2. Quantitative Methods. Examiner s Suggested Answers
 Diploma Part Quantitative Methods Examiner s Suggested Answers Question 1 (a) The standard normal distribution has a symmetrical and bell-shaped graph with a mean of zero and a standard deviation equal
Forecasting: Methods and Applications
 Neapolis University HEPHAESTUS Repository School of Economic Sciences and Business http://hephaestus.nup.ac.cy Books 1998 Forecasting: Methods and Applications Makridakis, Spyros John Wiley & Sons, Inc.
DEVELOPMENT OF CRASH PREDICTION MODEL USING MULTIPLE REGRESSION ANALYSIS Harshit Gupta 1, Dr. Siddhartha Rokade 2 1
 DEVELOPMENT OF CRASH PREDICTION MODEL USING MULTIPLE REGRESSION ANALYSIS Harshit Gupta 1, Dr. Siddhartha Rokade 2 1 PG Student, 2 Assistant Professor, Department of Civil Engineering, Maulana Azad National
SHORT TERM LOAD FORECASTING
 Indian Institute of Technology Kanpur (IITK) and Indian Energy Exchange (IEX) are delighted to announce Training Program on "Power Procurement Strategy and Power Exchanges" 28-30 July, 2014 SHORT TERM
Copyright 2010 Pearson Education, Inc. Publishing as Prentice Hall.
 13 Forecasting PowerPoint Slides by Jeff Heyl For Operations Management, 9e by Krajewski/Ritzman/Malhotra 2010 Pearson Education 13 1 Forecasting Forecasts are critical inputs to business plans, annual
Decision 411: Class 3
 Decision 411: Class 3 Discussion of HW#1 Introduction to seasonal models Seasonal decomposition Seasonal adjustment on a spreadsheet Forecasting with seasonal adjustment Forecasting inflation Poor man
BUSI 460 Suggested Answers to Selected Review and Discussion Questions Lesson 7
 BUSI 460 Suggested Answers to Selected Review and Discussion Questions Lesson 7 1. The definitions follow: (a) Time series: Time series data, also known as a data series, consists of observations on a
Year 10 Mathematics Semester 2 Bivariate Data Chapter 13
 Year 10 Mathematics Semester 2 Bivariate Data Chapter 13 Why learn this? Observations of two or more variables are often recorded, for example, the heights and weights of individuals. Studying the data
Real Time wave forecasting using artificial neural network with varying input parameter
 82 Indian Journal of Geo-Marine SciencesINDIAN J MAR SCI VOL. 43(1), JANUARY 2014 Vol. 43(1), January 2014, pp. 82-87 Real Time wave forecasting using artificial neural network with varying input parameter
Exploratory Data Analysis: Two Variables
 Exploratory Data Analysis: Two Variables FPP 7-9 Exploratory data analysis: two variables 2 qualitative/categorical variables Contingency tables (we will cover these later in the semester) 1 qualitative/categorical,
Decision 411: Class 3
 Decision 411: Class 3 Discussion of HW#1 Introduction to seasonal models Seasonal decomposition Seasonal adjustment on a spreadsheet Forecasting with seasonal adjustment Forecasting inflation Poor man
Regression of Inflation on Percent M3 Change
 ECON 497 Final Exam Page of ECON 497: Economic Research and Forecasting Name: Spring 2006 Bellas Final Exam Return this exam to me by midnight on Thursday, April 27. It may be e-mailed to me. It may be
Practical QSAR and Library Design: Advanced tools for research teams
 DS QSAR and Library Design Webinar Practical QSAR and Library Design: Advanced tools for research teams Reservationless-Plus Dial-In Number (US): (866) 519-8942 Reservationless-Plus International Dial-In
Decision 411: Class 3
 Decision 411: Class 3 Discussion of HW#1 Introduction to seasonal models Seasonal decomposition Seasonal adjustment on a spreadsheet Forecasting with seasonal adjustment Forecasting inflation Log transformation
Bus 216: Business Statistics II Introduction Business statistics II is purely inferential or applied statistics.
 Bus 216: Business Statistics II Introduction Business statistics II is purely inferential or applied statistics. Study Session 1 1. Random Variable A random variable is a variable that assumes numerical
Fuzzy Systems. Introduction
 Fuzzy Systems Introduction Prof. Dr. Rudolf Kruse Christoph Doell {kruse,doell}@iws.cs.uni-magdeburg.de Otto-von-Guericke University of Magdeburg Faculty of Computer Science Department of Knowledge Processing
FORECASTING. Methods and Applications. Third Edition. Spyros Makridakis. European Institute of Business Administration (INSEAD) Steven C Wheelwright
 Steven C Wheelwright") FORECASTING Methods and Applications Third Edition Spyros Makridakis European Institute of Business Administration (INSEAD) Steven C Wheelwright Harvard University, Graduate School of Business Administration
FORECASTING Methods and Applications Third Edition Spyros Makridakis European Institute of Business Administration (INSEAD) Steven C Wheelwright Harvard University, Graduate School of Business Administration
STA 6104 Financial Time Series. Moving Averages and Exponential Smoothing
 STA 6104 Financial Time Series Moving Averages and Exponential Smoothing Smoothing Our objective is to predict some future value Y n+k given a past history {Y 1, Y 2,..., Y n } of observations up to time
Probability Distributions
 CONDENSED LESSON 13.1 Probability Distributions In this lesson, you Sketch the graph of the probability distribution for a continuous random variable Find probabilities by finding or approximating areas
Examining Relationships. Chapter 3
 Examining Relationships Chapter 3 Scatterplots A scatterplot shows the relationship between two quantitative variables measured on the same individuals. The explanatory variable, if there is one, is graphed
AP STATISTICS Name: Period: Review Unit IV Scatterplots & Regressions
 AP STATISTICS Name: Period: Review Unit IV Scatterplots & Regressions Know the definitions of the following words: bivariate data, regression analysis, scatter diagram, correlation coefficient, independent
Exploratory Data Analysis: Two Variables
 9/1/9 Exploratory Data Analysis: Two Variables FPP 7-9 Exploratory data analysis: two variables 2 qualitative/categorical variables Contingency tables (we will cover these later in the semester) 1 qualitative/categorical,
AUTO SALES FORECASTING FOR PRODUCTION PLANNING AT FORD
 FCAS AUTO SALES FORECASTING FOR PRODUCTION PLANNING AT FORD Group - A10 Group Members: PGID Name of the Member 1. 61710956 Abhishek Gore 2. 61710521 Ajay Ballapale 3. 61710106 Bhushan Goyal 4. 61710397
STA441: Spring Multiple Regression. More than one explanatory variable at the same time
 STA441: Spring 2016 Multiple Regression More than one explanatory variable at the same time This slide show is a free open source document. See the last slide for copyright information. One Explanatory
Regression Analysis IV... More MLR and Model Building
 Regression Analysis IV... More MLR and Model Building This session finishes up presenting the formal methods of inference based on the MLR model and then begins discussion of "model building" (use of regression
Forecasting Methods And Applications 3rd Edition
 We have made it easy for you to find a PDF Ebooks without any digging. And by having access to our ebooks online or by storing it on your computer, you have convenient answers with forecasting methods
104 Business Research Methods - MCQs
 104 Business Research Methods - MCQs 1) Process of obtaining a numerical description of the extent to which a person or object possesses some characteristics a) Measurement b) Scaling c) Questionnaire
CHAPTER 5 LINEAR REGRESSION AND CORRELATION
 CHAPTER 5 LINEAR REGRESSION AND CORRELATION Expected Outcomes Able to use simple and multiple linear regression analysis, and correlation. Able to conduct hypothesis testing for simple and multiple linear
27. SIMPLE LINEAR REGRESSION II
 27. SIMPLE LINEAR REGRESSION II The Model In linear regression analysis, we assume that the relationship between X and Y is linear. This does not mean, however, that Y can be perfectly predicted from X.
Correlation and Regression
 Correlation and Regression. ITRDUCTI Till now, we have been working on one set of observations or measurements e.g. heights of students in a class, marks of students in an exam, weekly wages of workers
Time series and Forecasting
 Chapter 2 Time series and Forecasting 2.1 Introduction Data are frequently recorded at regular time intervals, for instance, daily stock market indices, the monthly rate of inflation or annual profit figures.
Quantitative Bivariate Data
 Statistics 211 (L02) - Linear Regression Quantitative Bivariate Data Consider two quantitative variables, defined in the following way: X i - the observed value of Variable X from subject i, i = 1, 2,,
Lecture 4 Scatterplots, Association, and Correlation
 Lecture 4 Scatterplots, Association, and Correlation Previously, we looked at Single variables on their own One or more categorical variable In this lecture: We shall look at two quantitative variables.
Lecture 4 Scatterplots, Association, and Correlation
 Lecture 4 Scatterplots, Association, and Correlation Previously, we looked at Single variables on their own One or more categorical variables In this lecture: We shall look at two quantitative variables.
STATISTICAL FORECASTING and SEASONALITY (M. E. Ippolito; )
") STATISTICAL FORECASTING and SEASONALITY (M. E. Ippolito; 10-6-13) PART I OVERVIEW The following discussion expands upon exponential smoothing and seasonality as presented in Chapter 11, Forecasting, in
STATISTICAL FORECASTING and SEASONALITY (M. E. Ippolito; 10-6-13) PART I OVERVIEW The following discussion expands upon exponential smoothing and seasonality as presented in Chapter 11, Forecasting, in
UNIT 1: NATURE OF SCIENCE
 Nature of Science UNIT 1: NATURE OF SCIENCE Chapter 1.1-1.3, pages 6-26 Honors Physical Science Pure science aims to come to a common understanding of the universe Scientists suspend judgment until they
Chapter 10 Correlation and Regression
 Chapter 10 Correlation and Regression 10-1 Review and Preview 10-2 Correlation 10-3 Regression 10-4 Variation and Prediction Intervals 10-5 Multiple Regression 10-6 Modeling Copyright 2010, 2007, 2004
Forecasting. Simon Shaw 2005/06 Semester II
 Forecasting Simon Shaw s.c.shaw@maths.bath.ac.uk 2005/06 Semester II 1 Introduction A critical aspect of managing any business is planning for the future. events is called forecasting. Predicting future
05 the development of a kinematics problem. February 07, Area under the curve
 Area under the curve Area under the curve refers from the region the line (curve) to the x axis 1 2 3 From Graphs to equations Case 1 scatter plot reveals no apparent relationship Types of equations Case
Biost 518 Applied Biostatistics II. Purpose of Statistics. First Stage of Scientific Investigation. Further Stages of Scientific Investigation
 Biost 58 Applied Biostatistics II Scott S. Emerson, M.D., Ph.D. Professor of Biostatistics University of Washington Lecture 5: Review Purpose of Statistics Statistics is about science (Science in the broadest
Introduction to probability
 Introduction to probability 4.1 The Basics of Probability Probability The chance that a particular event will occur The probability value will be in the range 0 to 1 Experiment A process that produces
Module 1 Linear Regression
 Regression Analysis Although many phenomena can be modeled with well-defined and simply stated mathematical functions, as illustrated by our study of linear, exponential and quadratic functions, the world
Comparing the Univariate Modeling Techniques, Box-Jenkins and Artificial Neural Network (ANN) for Measuring of Climate Index
 for Measuring of Climate Index") Applied Mathematical Sciences, Vol. 8, 2014, no. 32, 1557-1568 HIKARI Ltd, www.m-hikari.com http://dx.doi.org/10.12988/ams.2014.4150 Comparing the Univariate Modeling Techniques, Box-Jenkins and Artificial
Applied Mathematical Sciences, Vol. 8, 2014, no. 32, 1557-1568 HIKARI Ltd, www.m-hikari.com http://dx.doi.org/10.12988/ams.2014.4150 Comparing the Univariate Modeling Techniques, Box-Jenkins and Artificial
Forecasting: The First Step in Demand Planning
 Forecasting: The First Step in Demand Planning Jayant Rajgopal, Ph.D., P.E. University of Pittsburgh Pittsburgh, PA 15261 In a supply chain context, forecasting is the estimation of future demand General
ECON 497 Midterm Spring
 ECON 497 Midterm Spring 2009 1 ECON 497: Economic Research and Forecasting Name: Spring 2009 Bellas Midterm You have three hours and twenty minutes to complete this exam. Answer all questions and explain