WRF Webcast. Improving the Accuracy of Short-Term Water Demand Forecasts
|
|
|
- Evelyn Harmon
- 6 years ago
- Views:
Transcription

1 No part of this presentation may be copied, reproduced, or otherwise utilized without permission. WRF Webcast Improving the Accuracy of Short-Term Water Demand Forecasts August 29, 2017
2 Presenters Maureen Hodgins, Research Manager Water Research Foundation Thomas M. Fullerton, Jr., Ph.D. Professor & Trade in the Americas Chair University of Texas at El Paso (UTEP) David Torres, M.S. Economist El Paso Water Adam Walke, M.S. Economist UTEP Border Region Modeling Project
3 Webcast Agenda Introductions Maureen Hodgins 5 min Overview Tom Fullerton 5 min Key Research Findings Adam Walke 30 min El Paso Water Modeling Efforts David Torres 5 min Question & Answers 15 min
4 WRF Research Focus Area - Demand 2012 to 2018/19 10 projects 8 funded Forecasting

5 Demand Forecasting Summary
6 Water use estimates -Residential end uses, 4309 (2016) -Multi-family, 4554 (est 2018) -CII, 4375 (2015) & 4619 (est 2019) Forecasting methods -Customer data, 4527 (2016) -Short term, 4501, (2017) -Long term, 4667 (est 2020) Factors impacting demand -Recession, 4458 (2016) -United Kingdom - Behavioral changes, 4649 (2016) -Passive efficiency, 4495 (est 2018) Planning with uncertainty -Uncertainty & long term forecasts, 4558 (2016) Urban Landscapes -Irrigation controllers, 4227 (2016) -Urban landscape research needs (est 2017) Sizing Infrastructure -Demand patterns for sizing meters & service lines, 4689 (est 2018)

7 Finding the 4501 Products

8 4501 Products

9 Please Type Your Question Here! Slides and recording will be available to WRF subscribers WITHIN 24 hours after the webcast!
10 Agenda Overview of project 4501 Key findings: Survey of water utility planners & forecasters Short-term water demand forecasting manual Final Report: Accuracy of utility-generated forecasts Forecasting case study: El Paso Water Brief overview of add-on case studies El Paso Water modeling efforts Questions & answers
11 Acknowledgements Project Advisory Committee: Jack Kiefer (Hazen and Sawyer) Chris Meenan (Las Vegas Valley Water District) Paul Merchant (South West Water) Graduate Research Assistants: Juan P. Cardenas Alejandro Ceballos Omar Solis
12 Acknowledgements Water Research Foundation El Paso Water City of Phoenix Tampa Bay Water Three anonymous utilities Hunt Communities
13 Survey Targeted to utility staff involved in shortterm planning and forecasting 198 unique survey responses 42 states represented 70% of respondents use water demand forecasts - only those respondents answered the subsequent questions
 Improving the Accuracy of Short-Term Water Demand Forecasts. Denver, Colo.")
14 Approximately how often are forecasts generated or updated? Source: Fullerton, T.F., Jr. and Walke, A.G. (2017) Improving the Accuracy of Short-Term Water Demand Forecasts. Denver, Colo.: Water Research Foundation.
15 If forecasts are generated for different water demand scenarios, what types of scenarios are considered? Source: Fullerton, T.F., Jr. and Walke, A.G. (2017) Improving the Accuracy of Short-Term Water Demand Forecasts. Denver, Colo.: Water Research Foundation.
16 What types of forecasting methodologies are used to generate your utility's forecasts? Source: Fullerton, T.F., Jr. and Walke, A.G. (2017) Improving the Accuracy of Short-Term Water Demand Forecasts. Denver, Colo.: Water Research Foundation.
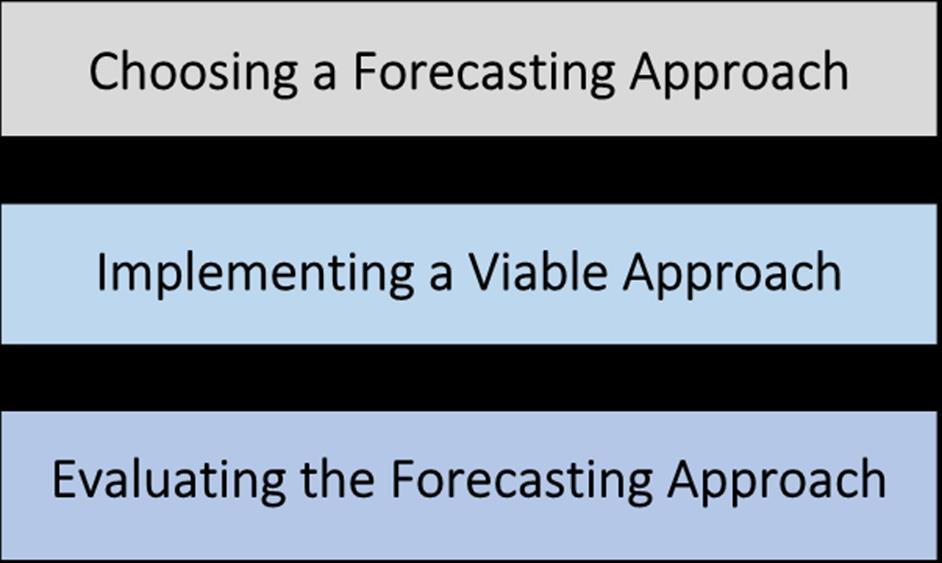

17 Forecasting Manual Organized around:
18 Factors to Consider in Choosing a Forecasting Methodology Accuracy track record of the methodology Cost of implementing the methodology Data and computational requirements Organizational goals in forecasting Prediction only versus analyzing scenarios & alternative policies Forecast horizon (short- medium- or longterm forecasts)
 Improving the Accuracy of Short-Term Water Demand Forecasts.")
19 Source: Fullerton, T.F., Jr. and Walke, A.G. (2017) Improving the Accuracy of Short-Term Water Demand Forecasts. Denver, Colo.: Water Research Foundation.
20 Factors to Consider in Developing a Forecast Sample size & handling of missing data Time between forecasts & vintage of data Which demand variable to forecast: Demand in each customer category? Demand in each part of the service area? Separate forecasts for the customer base and water demand per customer? Which (if any) predictor variables to use
21 Predictor variables used in 53 published studies for short-term water demand forecasting Source: Fullerton, T.F., Jr. and Walke, A.G. (2017) Improving the Accuracy of Short-Term Water Demand Forecasts. Denver, Colo.: Water Research Foundation.
22 Issues to Consider in Evaluating a Forecast Evaluation serves to: Assess whether previous methods are working Choose models with good chances of success Good compared to what? Use benchmarks Evaluation criteria Forecast error summary statistics Tests of forecast error differentials Tests of directional forecast accuracy
23 Final Report Analysis of utility-generated forecasts: Tampa Bay Water City of Phoenix Three anonymous utilities Analysis of forecasts developed by the research team with utility data: El Paso Water City of Phoenix One anonymous utility
24 Analysis of Utility-Generated Forecasts Accuracy analyses were conducted for 5 sets of utility-generated forecasts; in one case there were not enough observations for statistical tests of forecast accuracy. Utility forecasts were compared to random walk benchmark forecasts. Forecasts were grouped in different ways (e.g. by step-length, by geography, by customer class).
25 Utility Forecast Accuracy Summary: Root Mean Squared Error (RMSE) # Horizon (Frequency) Methodology Utility % Better 1 2 Weeks (Daily) 2 1 Week (Weekly) 3 1 Year (Monthly) 4 2 Years (Monthly) 5 4 Years (Annual) Regression with weather and demographic explanatory variables and lagged demand Regression with weather explanatory variables and lagged demand Econometric model including price, weather, employment, unemployment rate, and lagged demand Expert judgment taking into account climatic & economic conditions End-use model based on survey data, and data on demographic trends, prices, and conservation policies 71% 100% 75% Source: Fullerton, T.F., Jr. and Walke, A.G. (2017) Improving the Accuracy of Short-Term Water Demand Forecasts. Denver, Colo.: Water Research Foundation. 0% 0%
26 Utility Forecast Accuracy Summary: Error Differential Regression Test # Horizon (Frequency) Methodology Utility % Significant 1 2 Weeks (Daily) 2 1 Week (Weekly) 3 1 Year (Monthly) 4 2 Years (Monthly) 5 4 Years (Annual) Regression with weather and demographic explanatory variables and lagged demand Regression with weather explanatory variables and lagged demand Econometric model including price, weather, employment, unemployment rate, and lagged demand Expert judgment taking into account climatic & economic conditions End-use model based on survey data, and data on demographic trends, prices, and conservation policies 29% 83% 50% Source: Fullerton, T.F., Jr. and Walke, A.G. (2017) Improving the Accuracy of Short-Term Water Demand Forecasts. Denver, Colo.: Water Research Foundation. 0% NA
27 Utility Forecast Accuracy Summary: Chi-Square Test of Independence # Horizon (Frequency) Methodology Utility % Significant 1 2 Weeks (Daily) 2 1 Week (Weekly) 3 1 Year (Monthly) 4 2 Years (Monthly) 5 4 Years (Annual) Regression with weather and demographic explanatory variables and lagged demand Regression with weather explanatory variables and lagged demand Econometric model including price, weather, employment, unemployment rate, and lagged demand Expert judgment taking into account climatic & economic conditions End-use model based on survey data, and data on demographic trends, prices, and conservation policies 57% 78% 75% Source: Fullerton, T.F., Jr. and Walke, A.G. (2017) Improving the Accuracy of Short-Term Water Demand Forecasts. Denver, Colo.: Water Research Foundation. 0% NA
28 Characteristics of Successful Utility-Generated Forecasts Combine statistical methods like regression with expert judgment Use time series data on key predictor variables like weather, prices, and economic indicators In one case, forecasts are generated without forecasting predictor variables All successful models harness the predictive power of lagged demand
29 El Paso Case Study El Paso Water serves El Paso, Texas Located in the Chihuahuan Desert Historically faced water supply constraints Adopted a comprehensive water conservation strategy in 1991
30 Total Water Consumption in El Paso: Source: Fullerton, T.F., Jr. and Walke, A.G. (2017) Improving the Accuracy of Short-Term Water Demand Forecasts. Denver, Colo.: Water Research Foundation.
31 Methodology I: Linear Transfer Function ARIMA In a Linear Transfer Function (LTF) approach, demand is first modeled as a function of explanatory variable lags. Any remaining unexplained systematic variation in demand is then modeled using autoregressive (AR) and moving average (MA) parameters.
32 Methodology II: Vector Autoregression In the most basic version of the Vector Autoregression (VAR) approach, each variable is modeled as a function of lags of itself and lags of all of the other variables. Instead of choosing specific lags of each variable to include in the model, the analyst only has to select one lag order for all of the variables.
33 Methodology III: Random Walk A simple random walk (RW) forecast posits no change in demand (forecast equals actual demand one period earlier): F t = A t-1 A random walk with drift (RWD) simply adds the average annual change in demand to the random walk: F t = A t-1 + d In the case of highly seasonal variables measured at a monthly frequency, a random walk can be defined as: F t = A t-12
34 Data (January 1994 December 2013) From El Paso Water: Total Demand = Per-Customer Demand Customer Base Real Average Price = Total Revenues/(Total Demand CPI) From the Bureau of Labor Statistics: Nonfarm Employment in El Paso County From the National Oceanic and Atmospheric Administration: Days per Month with Temperatures above 90 F Total Monthly Precipitation in Inches The customer base is first-differenced; the other variables are first- and twelfth-differenced.
35 Estimation Results LTF and VAR methods can provide insights into the relationships between variables: Slope coefficients indicate how demand changes when explanatory variables change. In the case of the VAR model, there is a very large number of coefficients, so an alternative means of deciphering relationships is desirable. An impulse response function is a convenient way of depicting the reactions of endogenous variables to shocks in other endogenous variables.
36 LTF Estimation Results Per-Customer Usage Customers Constant ** Average Price t ** Days over 90 F t 0.089** Days over 90 F t ** Rainfall t ** Nonfarm Employment t 0.121** Nonfarm Employment t ** AR t ** 0.369** AR t ** MA t ** ** MA t * MA t ** R-Squared F-Statistic ** ** * Probability value <.05; ** Probability value <.01 Source: Fullerton, T.F., Jr. and Walke, A.G. (2017) Improving the Accuracy of Short-Term Water Demand Forecasts. Denver, Colo.: Water Research Foundation.
37 Elasticity Estimates The estimated elasticity of demand with respect to price is This suggests that a 10% price increase would result in a 3.2% decline in demand.
38 Change in Deseasonalized Per Capita Demand (Thousands of Gallons per Month) Per-Customer Demand: VAR Impulse Response Function The figure shows the response of demand to a one standard deviation shock in the residual of price Source: Fullerton, T.F., Jr. and Walke, A.G. (2017) Improving the Accuracy of Short-Term Water Demand Forecasts. Denver, Colo.: Water Research Foundation.
39 Forecast Evaluation Criteria Criteria based on the size of the forecast errors: Root Mean Squared Error Forecast error differential regression test H 0 : Both sets of forecasts are equally accurate Criteria for evaluating directional accuracy: Chi-square test H 0 : Forecasted and actual events are independent (i.e. forecasts don t provide useful information for predicting the direction of change)
40 Most Accurate Forecast for El Paso based on Root Mean Squared Error, Step-length Per-customer demand Customer base 1 month LTF VAR 2 months LTF LTF 3 months LTF LTF 4 months LTF RWD 5 months LTF RWD 6 months LTF RWD 7 months LTF RWD 8 months LTF RWD 9 months LTF VAR 10 months LTF VAR 11 months LTF VAR 12 months LTF VAR Source: Fullerton, T.F., Jr. and Walke, A.G. (2017) Improving the Accuracy of Short-Term Water Demand Forecasts. Denver, Colo.: Water Research Foundation.
41 Are the LTF forecasts significantly better than the VAR forecasts? Step-length Per-customer demand Customer base 1 month no no 2 months no no 3 months yes no 4 months yes no 5 months yes no 6 months yes no 7 months yes no 8 months yes no 9 months yes no 10 months yes no 11 months yes no 12 months yes no Source: Fullerton, T.F., Jr. and Walke, A.G. (2017) Improving the Accuracy of Short-Term Water Demand Forecasts. Denver, Colo.: Water Research Foundation.
42 Are the LTF forecasts significantly better than the Random Walk with Drift forecasts? Step-length Per-customer demand Customer base 1 month yes no 2 months yes no 3 months yes no 4 months yes no 5 months yes no 6 months yes no 7 months yes no 8 months yes no 9 months yes no 10 months yes yes 11 months yes yes 12 months yes yes Source: Fullerton, T.F., Jr. and Walke, A.G. (2017) Improving the Accuracy of Short-Term Water Demand Forecasts. Denver, Colo.: Water Research Foundation.
43 Do the forecasts provide useful information on directional changes in per-customer demand? Step-length LTF VAR 1 month yes yes 2 months yes yes 3 months yes yes 4 months yes no 5 months yes yes 6 months yes yes 7 months yes yes 8 months yes yes 9 months yes yes 10 months yes no 11 months yes no 12 months yes no Source: Fullerton, T.F., Jr. and Walke, A.G. (2017) Improving the Accuracy of Short-Term Water Demand Forecasts. Denver, Colo.: Water Research Foundation.
44 Combining Forecasts If separate forecasts each contribute complementary information that is useful for prediction, it may make sense to combine the forecasts as a strategy for improving accuracy. Forecasts can be combined by assigning a separate weight to each one based on it s relative accuracy. Demand = b 0 + b 1 LTF + b 2 VAR + b 3 RWD + e
45 Per-Customer Demand: Combined Results Variable Coefficient t-statistic Probability Constant LTF VAR RWD AR t MA t R-squared Durbin-Watson F-statistic Probability (F-stat)
46 Customer Base: Combined Results Variable Coefficient t-statistic Probability Constant 1, LTF VAR RWD MA t R-squared Durbin-Watson F-statistic 11, Probability (F-stat)
47 Conclusions of El Paso Case Study The LTF approach offers an improvement over the alternatives considered in forecasting percustomer water demand for El Paso. Random walks are competitive in forecasting the number of customers. Experimentation with alternative forecasting methods and comparisons of forecast accuracy can help inform decisions about what is the best forecasting approach to use in a given context.
48 Results of Add-On Case Study I Are there benefits to separately modeling and forecasting each sub-component of total water demand? Data from the City of Phoenix were analyzed. Disaggregation by customer category is the best alternative for a majority of the steplengths considered, but it is not significantly better than directly modeling aggregate demand for this sample.
49 Results of Add-On Case Study II Can proxies serve as predictor variables in place of price data when the latter are unavailable? Data from an anonymous utility were analyzed to address this question. During a period when water rates were changing significantly, proxy variables were poor substitutes for actual price data in forecasting water demand.
50 Overarching Conclusion Forecast evaluation is not the final word in the forecasting process but a tool for continual reassessment and improvement of prediction strategies.
51 Questions?
52 Thank You Comments or questions, please contact: For more information visit:
SHORT TERM LOAD FORECASTING
 Indian Institute of Technology Kanpur (IITK) and Indian Energy Exchange (IEX) are delighted to announce Training Program on "Power Procurement Strategy and Power Exchanges" 28-30 July, 2014 SHORT TERM
NSP Electric - Minnesota Annual Report Peak Demand and Annual Electric Consumption Forecast
 Page 1 of 5 7610.0320 - Forecast Methodology NSP Electric - Minnesota Annual Report Peak Demand and Annual Electric Consumption Forecast OVERALL METHODOLOGICAL FRAMEWORK Xcel Energy prepared its forecast
Multivariate Regression Model Results
 Updated: August, 0 Page of Multivariate Regression Model Results 4 5 6 7 8 This exhibit provides the results of the load model forecast discussed in Schedule. Included is the forecast of short term system
RD1 - Page 469 of 578
 DOCKET NO. 45524 APPLICATION OF SOUTHWESTERN PUBLIC SERVICE COMPANY FOR AUTHORITY TO CHANGE RATES PUBLIC UTILITY COMMISSION OF TEXAS DIRECT TESTIMONY of JANNELL E. MARKS on behalf of SOUTHWESTERN PUBLIC
Population Research Center (PRC) Oregon Population Forecast Program
 Oregon Population Forecast Program") Population Research Center (PRC) Oregon Population Forecast Program 2013 Oregon League of Cities Conference Risa S. Proehl Jason R. Jurjevich, Ph.D. Population Research Center (PRC) Population Research
Population Research Center (PRC) Oregon Population Forecast Program 2013 Oregon League of Cities Conference Risa S. Proehl Jason R. Jurjevich, Ph.D. Population Research Center (PRC) Population Research
Development of Short-term Demand Forecasting Model And its Application in Analysis of Resource Adequacy. For discussion purposes only Draft
 Development of Short-term Demand Forecasting Model And its Application in Analysis of Resource Adequacy For discussion purposes only Draft January 31, 2007 INTRODUCTION In this paper we will present the
Demand Forecasting Models
 E 2017 PSE Integrated Resource Plan Demand Forecasting Models This appendix describes the econometric models used in creating the demand forecasts for PSE s 2017 IRP analysis. Contents 1. ELECTRIC BILLED
Design of a Weather-Normalization Forecasting Model
 Design of a Weather-Normalization Forecasting Model Final Briefing 09 May 2014 Sponsor: Northern Virginia Electric Cooperative Abram Gross Jedidiah Shirey Yafeng Peng OR-699 Agenda Background Problem Statement
STAT 212 Business Statistics II 1
 STAT 1 Business Statistics II 1 KING FAHD UNIVERSITY OF PETROLEUM & MINERALS DEPARTMENT OF MATHEMATICAL SCIENCES DHAHRAN, SAUDI ARABIA STAT 1: BUSINESS STATISTICS II Semester 091 Final Exam Thursday Feb
NOWCASTING THE NEW TURKISH GDP
 CEFIS WORKING PAPER SERIES First Version: August 2017 NOWCASTING THE NEW TURKISH GDP Barış Soybilgen, İstanbul Bilgi University Ege Yazgan, İstanbul Bilgi University Nowcasting the New Turkish GDP Barış
peak half-hourly New South Wales
 Forecasting long-term peak half-hourly electricity demand for New South Wales Dr Shu Fan B.S., M.S., Ph.D. Professor Rob J Hyndman B.Sc. (Hons), Ph.D., A.Stat. Business & Economic Forecasting Unit Report
peak half-hourly Tasmania
 Forecasting long-term peak half-hourly electricity demand for Tasmania Dr Shu Fan B.S., M.S., Ph.D. Professor Rob J Hyndman B.Sc. (Hons), Ph.D., A.Stat. Business & Economic Forecasting Unit Report for
Introduction to Forecasting
 Introduction to Forecasting Introduction to Forecasting Predicting the future Not an exact science but instead consists of a set of statistical tools and techniques that are supported by human judgment
Empirical Project, part 1, ECO 672
 Empirical Project, part 1, ECO 672 Due Date: see schedule in syllabus Instruction: The empirical project has two parts. This is part 1, which is worth 15 points. You need to work independently on this
Proposed Changes to the PJM Load Forecast Model
 Proposed Changes to the PJM Load Forecast Model Load Analysis Subcommittee April 30, 2015 www.pjm.com Agenda Overview Specific Model Improvements Usage & Efficiency Variables Weather Re-Specification Autoregressive
Chapter 7 Forecasting Demand
 Chapter 7 Forecasting Demand Aims of the Chapter After reading this chapter you should be able to do the following: discuss the role of forecasting in inventory management; review different approaches
FINAL REPORT EVALUATION REVIEW OF TVA'S LOAD FORECAST RISK
 Memorandum from the Office of the Inspector General Robert Irvin, WT 9C-K FINAL REPORT EVALUATION 2012-14507 REVIEW OF TVA'S LOAD FORECAST RISK As part of a series of reviews to evaluate the Tennessee
Page No. (and line no. if applicable):
:") COALITION/IEC (DAYMARK LOAD) - 1 COALITION/IEC (DAYMARK LOAD) 1 Tab and Daymark Load Forecast Page No. Page 3 Appendix: Review (and line no. if applicable): Topic: Price elasticity Sub Topic: Issue: Accuracy
COALITION/IEC (DAYMARK LOAD) - 1 COALITION/IEC (DAYMARK LOAD) 1 Tab and Daymark Load Forecast Page No. Page 3 Appendix: Review (and line no. if applicable): Topic: Price elasticity Sub Topic: Issue: Accuracy
LOADS, CUSTOMERS AND REVENUE
 EB-00-0 Exhibit K Tab Schedule Page of 0 0 LOADS, CUSTOMERS AND REVENUE The purpose of this evidence is to present the Company s load, customer and distribution revenue forecast for the test year. The
Presentation for the Institute of International & European Affairs
 Presentation for the Institute of International & European Affairs Kathryn D. Sullivan, Ph.D. Under Secretary of Commerce for Oceans and Atmosphere & NOAA Administrator June 3, 2016 Overview NOAA 101 Closing
BEFORE THE PUBLIC UTILITIES COMMISSION OF THE STATE OF COLORADO * * * * *
 BEFORE THE PUBLIC UTILITIES COMMISSION OF THE STATE OF COLORADO * * * * * IN THE MATTER OF THE APPLICATION OF PUBLIC SERVICE COMPANY OF COLORADO FOR APPROVAL OF ITS 01 RENEWABLE ENERGY STANDARD COMPLIANCE
Identifying Causal Effects in Time Series Models
 Identifying Causal Effects in Time Series Models Aaron Smith UC Davis October 20, 2015 Slides available at http://asmith.ucdavis.edu 1 Identifying Causal Effects in Time Series Models If all the Metrics
The Dayton Power and Light Company Load Profiling Methodology Revised 7/1/2017
 The Dayton Power and Light Company Load Profiling Methodology Revised 7/1/2017 Overview of Methodology Dayton Power and Light (DP&L) load profiles will be used to estimate hourly loads for customers without
Beginning to Enjoy the Outside View A Glance at Transit Forecasting Uncertainty & Accuracy Using the Transit Forecasting Accuracy Database
 Beginning to Enjoy the Outside View A Glance at Transit Forecasting Uncertainty & Accuracy Using the Transit Forecasting Accuracy Database presented by David Schmitt, AICP with very special thanks to Hongbo
WEATHER NORMALIZATION METHODS AND ISSUES. Stuart McMenamin Mark Quan David Simons
 WEATHER NORMALIZATION METHODS AND ISSUES Stuart McMenamin Mark Quan David Simons Itron Forecasting Brown Bag September 17, 2013 Please Remember» Phones are Muted: In order to help this session run smoothly,
Copyright 2010 Pearson Education, Inc. Publishing as Prentice Hall.
 13 Forecasting PowerPoint Slides by Jeff Heyl For Operations Management, 9e by Krajewski/Ritzman/Malhotra 2010 Pearson Education 13 1 Forecasting Forecasts are critical inputs to business plans, annual
Population and Employment Forecast
 Population and Employment Forecast How Do We Get the Numbers? Thurston Regional Planning Council Technical Brief Updated July 2012 We plan for forecast growth in Population and Employment, but where do
2013 WEATHER NORMALIZATION SURVEY. Industry Practices
 2013 WEATHER NORMALIZATION SURVEY Industry Practices FORECASTING SPECIALIZATION Weather Operational Forecasting Short-term Forecasting to support: System Operations and Energy Trading Hourly Load Financial/Budget
Volume 38, Issue 2. Nowcasting the New Turkish GDP
 Volume 38, Issue 2 Nowcasting the New Turkish GDP Barış Soybilgen İstanbul Bilgi University Ege Yazgan İstanbul Bilgi University Abstract In this study, we predict year-on-year and quarter-on-quarter Turkish
Time Series and Forecasting
 Time Series and Forecasting Introduction to Forecasting n What is forecasting? n Primary Function is to Predict the Future using (time series related or other) data we have in hand n Why are we interested?
Time Series and Forecasting
 Time Series and Forecasting Introduction to Forecasting n What is forecasting? n Primary Function is to Predict the Future using (time series related or other) data we have in hand n Why are we interested?
Forecasting Using Time Series Models
 Forecasting Using Time Series Models Dr. J Katyayani 1, M Jahnavi 2 Pothugunta Krishna Prasad 3 1 Professor, Department of MBA, SPMVV, Tirupati, India 2 Assistant Professor, Koshys Institute of Management
SAN DIEGO GAS AND ELECTRIC COMPANY SOUTHERN CALIFORNIA GAS COMPANY 2013 TRIENNIAL COST ALLOCATION PROCEEDING (A ) (DATA REQUEST DRA-MPS-2)
 (DATA REQUEST DRA-MPS-2)") QUESTION 1: Please provide the following in excel format for SCG and SDG&E: a) Provide historical quarterly data for all variables for the customer/meter forecast model (1988Ql to 2011Q4) workpapers page
QUESTION 1: Please provide the following in excel format for SCG and SDG&E: a) Provide historical quarterly data for all variables for the customer/meter forecast model (1988Ql to 2011Q4) workpapers page
Analysis. Components of a Time Series
 Module 8: Time Series Analysis 8.2 Components of a Time Series, Detection of Change Points and Trends, Time Series Models Components of a Time Series There can be several things happening simultaneously
NOWCASTING REPORT. Updated: August 17, 2018
 NOWCASTING REPORT Updated: August 17, 2018 The New York Fed Staff Nowcast for 2018:Q3 stands at 2.4%. News from this week s data releases decreased the nowcast for 2018:Q3 by 0.2 percentage point. Negative
Introduction to Regression Analysis. Dr. Devlina Chatterjee 11 th August, 2017
 Introduction to Regression Analysis Dr. Devlina Chatterjee 11 th August, 2017 What is regression analysis? Regression analysis is a statistical technique for studying linear relationships. One dependent
Design of a Weather- Normalization Forecasting Model
 Design of a Weather- Normalization Forecasting Model Progress Report Abram Gross Yafeng Peng Jedidiah Shirey 3/4/2014 TABLE OF CONTENTS 1.0 Introduction... 3 2.0 Problem Statement... 3 3.0 Scope... 3 4.0
TRANSMISSION BUSINESS LOAD FORECAST AND METHODOLOGY
 Filed: September, 00 EB-00-00 Tab Schedule Page of 0 TRANSMISSION BUSINESS LOAD FORECAST AND METHODOLOGY.0 INTRODUCTION 0 This exhibit discusses Hydro One Networks transmission system load forecast and
2013 Weather Normalization Survey. Itron, Inc El Camino Real San Diego, CA
 Itron, Inc. 11236 El Camino Real San Diego, CA 92130 2650 858 724 2620 March 2014 Weather normalization is the process of reconstructing historical energy consumption assuming that normal weather occurred
Warwick Business School Forecasting System. Summary. Ana Galvao, Anthony Garratt and James Mitchell November, 2014
 Warwick Business School Forecasting System Summary Ana Galvao, Anthony Garratt and James Mitchell November, 21 The main objective of the Warwick Business School Forecasting System is to provide competitive
PREPARED DIRECT TESTIMONY OF GREGORY TEPLOW SOUTHERN CALIFORNIA GAS COMPANY AND SAN DIEGO GAS & ELECTRIC COMPANY
 Application No: A.1-0- Exhibit No.: Witness: Gregory Teplow Application of Southern California Gas Company (U 0 G) and San Diego Gas & Electric Company (U 0 G) for Authority to Revise their Natural Gas
Comment on: Automated Short-Run Economic Forecast (ASEF) By Nicolas Stoffels. Bank of Canada Workshop October 25-26, 2007
 By Nicolas Stoffels. Bank of Canada Workshop October 25-26, 2007") Background material Comment on: Automated Short-Run Economic Forecast (ASEF) By Nicolas Stoffels Bank of Canada Workshop October 25-26, 2007 André Binette (Bank of Canada) 1 Summary of ASEF 1. Automated
Background material Comment on: Automated Short-Run Economic Forecast (ASEF) By Nicolas Stoffels Bank of Canada Workshop October 25-26, 2007 André Binette (Bank of Canada) 1 Summary of ASEF 1. Automated
Econ 300/QAC 201: Quantitative Methods in Economics/Applied Data Analysis. 17th Class 7/1/10
 Econ 300/QAC 201: Quantitative Methods in Economics/Applied Data Analysis 17th Class 7/1/10 The only function of economic forecasting is to make astrology look respectable. --John Kenneth Galbraith show
Seasonal Hazard Outlook
 Winter 2016-2017 Current as of: October 21 Scheduled Update: December 614-799-6500 emawatch@dps.ohio.gov Overview Executive Summary Seasonal Forecast Heating Fuel Supply Winter Driving Preparedness Scheduled
NOWCASTING REPORT. Updated: July 20, 2018
 NOWCASTING REPORT Updated: July 20, 2018 The New York Fed Staff Nowcast stands at 2.7% for 2018:Q2 and 2.4% for 2018:Q3. News from this week s data releases decreased the nowcast for 2018:Q2 by 0.1 percentage
NOWCASTING REPORT. Updated: May 5, 2017
 NOWCASTING REPORT Updated: May 5, 217 The FRBNY Staff Nowcast stands at 1.8% for 217:Q2. News from this week s data releases reduced the nowcast for Q2 by percentage point. Negative surprises from the
Applied Time Series Topics
 Applied Time Series Topics Ivan Medovikov Brock University April 16, 2013 Ivan Medovikov, Brock University Applied Time Series Topics 1/34 Overview 1. Non-stationary data and consequences 2. Trends and
Econometric Forecasting Overview
 Econometric Forecasting Overview April 30, 2014 Econometric Forecasting Econometric models attempt to quantify the relationship between the parameter of interest (dependent variable) and a number of factors
Display and analysis of weather data from NCDC using ArcGIS
 Display and analysis of weather data from NCDC using ArcGIS Helen M. Cox Associate Professor Geography Department California State University, Northridge and Stephen Krug Graduate Student Geography Department
Great Lakes Update. Volume 188: 2012 Annual Summary
 Great Lakes Update Volume 188: 2012 Annual Summary Background The U.S. Army Corps of Engineers (USACE) tracks the water levels of each of the Great Lakes. This report highlights hydrologic conditions of
2006 IRP Technical Workshop Load Forecasting Tuesday, January 24, :00 am 3:30 pm (Pacific) Meeting Summary
 Meeting Summary") 2006 IRP Technical Workshop Load Forecasting Tuesday, January 24, 2006 9:00 am 3:30 pm (Pacific) Meeting Summary Idaho Oregon Utah Teri Carlock (IPUC) Ming Peng (OPUC), Bill Wordley (OPUC) Abdinasir Abdulle
2006 IRP Technical Workshop Load Forecasting Tuesday, January 24, 2006 9:00 am 3:30 pm (Pacific) Meeting Summary Idaho Oregon Utah Teri Carlock (IPUC) Ming Peng (OPUC), Bill Wordley (OPUC) Abdinasir Abdulle
STATISTICAL LOAD MODELING
 STATISTICAL LOAD MODELING Eugene A. Feinberg, Dora Genethliou Department of Applied Mathematics and Statistics State University of New York at Stony Brook Stony Brook, NY 11794-3600, USA Janos T. Hajagos
Decision 411: Class 3
 Decision 411: Class 3 Discussion of HW#1 Introduction to seasonal models Seasonal decomposition Seasonal adjustment on a spreadsheet Forecasting with seasonal adjustment Forecasting inflation Log transformation
FORECASTING. Methods and Applications. Third Edition. Spyros Makridakis. European Institute of Business Administration (INSEAD) Steven C Wheelwright
 Steven C Wheelwright") FORECASTING Methods and Applications Third Edition Spyros Makridakis European Institute of Business Administration (INSEAD) Steven C Wheelwright Harvard University, Graduate School of Business Administration
FORECASTING Methods and Applications Third Edition Spyros Makridakis European Institute of Business Administration (INSEAD) Steven C Wheelwright Harvard University, Graduate School of Business Administration
2006 & 2007 Pre-Hurricane Scenario Analyses
 2006 & 2007 Pre-Hurricane Scenario Analyses Executive Summary May 2007 Page 1 OF X FOR OFFICIAL USE ONLY 4 Public Availability to be Determined Under 5 U.S.C. 552 NOTE: Limited Distribution. Release of
The Kentucky Mesonet: Entering a New Phase
 The Kentucky Mesonet: Entering a New Phase Stuart A. Foster State Climatologist Kentucky Climate Center Western Kentucky University KCJEA Winter Conference Lexington, Kentucky February 9, 2017 Kentucky
Introduction to Econometrics
 Introduction to Econometrics STAT-S-301 Introduction to Time Series Regression and Forecasting (2016/2017) Lecturer: Yves Dominicy Teaching Assistant: Elise Petit 1 Introduction to Time Series Regression
Decision 411: Class 3
 Decision 411: Class 3 Discussion of HW#1 Introduction to seasonal models Seasonal decomposition Seasonal adjustment on a spreadsheet Forecasting with seasonal adjustment Forecasting inflation Poor man
Forecasting: Methods and Applications
 Neapolis University HEPHAESTUS Repository School of Economic Sciences and Business http://hephaestus.nup.ac.cy Books 1998 Forecasting: Methods and Applications Makridakis, Spyros John Wiley & Sons, Inc.
Asitha Kodippili. Deepthika Senaratne. Department of Mathematics and Computer Science,Fayetteville State University, USA.
 Forecasting Tourist Arrivals to Sri Lanka Using Seasonal ARIMA Asitha Kodippili Department of Mathematics and Computer Science,Fayetteville State University, USA. akodippili@uncfsu.edu Deepthika Senaratne
NOWCASTING REPORT. Updated: April 15, 2016
 NOWCASTING REPORT Updated: April 15, 2016 GDP growth prospects remain moderate for the rst half of the year: the nowcasts stand at 0.8% for 2016:Q1 and 1.2% for 2016:Q2. News from this week's data releases
Drew Behnke Food and Agriculture Organization of the United Nations UC Berkeley and UC Santa Barbara
 Lecture 3: Using Regression Analysis to Model Climate Risk Training Course on Economic Assessment Methods for Policy Support of Climate Change Adaptation in the Agricultural Sector in Lao PDR Drew Behnke
Challenges to Improving the Skill of Weekly to Seasonal Climate Predictions. David DeWitt with contributions from CPC staff
 Challenges to Improving the Skill of Weekly to Seasonal Climate Predictions David DeWitt with contributions from CPC staff 1 Outline CPC Background Prediction, monitoring, diagnostics, and climate services
Forecasting Bangladesh's Inflation through Econometric Models
 American Journal of Economics and Business Administration Original Research Paper Forecasting Bangladesh's Inflation through Econometric Models 1,2 Nazmul Islam 1 Department of Humanities, Bangladesh University
Decision 411: Class 3
 Decision 411: Class 3 Discussion of HW#1 Introduction to seasonal models Seasonal decomposition Seasonal adjustment on a spreadsheet Forecasting with seasonal adjustment Forecasting inflation Poor man
Forecasting. Copyright 2015 Pearson Education, Inc.
 5 Forecasting To accompany Quantitative Analysis for Management, Twelfth Edition, by Render, Stair, Hanna and Hale Power Point slides created by Jeff Heyl Copyright 2015 Pearson Education, Inc. LEARNING
Defining Normal Weather for Energy and Peak Normalization
 Itron White Paper Energy Forecasting Defining Normal Weather for Energy and Peak Normalization J. Stuart McMenamin, Ph.D Managing Director, Itron Forecasting 2008, Itron Inc. All rights reserved. 1 Introduction
Empirical Approach to Modelling and Forecasting Inflation in Ghana
 Current Research Journal of Economic Theory 4(3): 83-87, 2012 ISSN: 2042-485X Maxwell Scientific Organization, 2012 Submitted: April 13, 2012 Accepted: May 06, 2012 Published: June 30, 2012 Empirical Approach
Forecasting: principles and practice. Rob J Hyndman 1.1 Introduction to Forecasting
 Forecasting: principles and practice Rob J Hyndman 1.1 Introduction to Forecasting 1 Outline 1 Background 2 Case studies 3 The statistical forecasting perspective 4 What can we forecast? 2 Resources Slides
UPPSALA UNIVERSITY - DEPARTMENT OF STATISTICS MIDAS. Forecasting quarterly GDP using higherfrequency
 UPPSALA UNIVERSITY - DEPARTMENT OF STATISTICS MIDAS Forecasting quarterly GDP using higherfrequency data Authors: Hanna Lindgren and Victor Nilsson Supervisor: Lars Forsberg January 12, 2015 We forecast
NOWCASTING REPORT. Updated: May 20, 2016
 NOWCASTING REPORT Updated: May 20, 2016 The FRBNY Staff Nowcast for GDP growth in 2016:Q2 is 1.7%, half a percentage point higher than last week. Positive news came from manufacturing and housing data
OREGON POPULATION FORECAST PROGRAM
 OREGON POPULATION FORECAST PROGRAM PROGRAM OVERVIEW BACKGROUND Beginning in 1973 with the passage of Senate Bill (SB) 100, Oregon s growth management system has relied on population forecasts as the primary
NRC Workshop - Probabilistic Flood Hazard Assessment Jan 2013
 Regional Precipitation-Frequency Analysis And Extreme Storms Including PMP Current State of Understanding/Practice Mel Schaefer Ph.D. P.E. MGS Engineering Consultants, Inc. Olympia, WA NRC Workshop - Probabilistic
Forecasting Regional Employment in Germany: A Review of Neural Network Approaches. Objectives:
 Forecasting Regional Employment in Germany: A Review of Neural Network Approaches Peter Nijkamp, Aura Reggiani, Roberto Patuelli Objectives: To develop and apply Neural Network (NN) models in order to
NOWCASTING REPORT. Updated: October 21, 2016
 NOWCASTING REPORT Updated: October 21, 216 The FRBNY Staff Nowcast stands at 2.2% for 216:Q3 and 1.4% for 216:Q4. Overall this week s news had a negative effect on the nowcast. The most notable developments
Changes in the Spatial Distribution of Mobile Source Emissions due to the Interactions between Land-use and Regional Transportation Systems
 Changes in the Spatial Distribution of Mobile Source Emissions due to the Interactions between Land-use and Regional Transportation Systems A Framework for Analysis Urban Transportation Center University
3 Time Series Regression
 3 Time Series Regression 3.1 Modelling Trend Using Regression Random Walk 2 0 2 4 6 8 Random Walk 0 2 4 6 8 0 10 20 30 40 50 60 (a) Time 0 10 20 30 40 50 60 (b) Time Random Walk 8 6 4 2 0 Random Walk 0
VALIDATING THE RELATIONSHIP BETWEEN URBAN FORM AND TRAVEL BEHAVIOR WITH VEHICLE MILES TRAVELLED. A Thesis RAJANESH KAKUMANI
 VALIDATING THE RELATIONSHIP BETWEEN URBAN FORM AND TRAVEL BEHAVIOR WITH VEHICLE MILES TRAVELLED A Thesis by RAJANESH KAKUMANI Submitted to the Office of Graduate Studies of Texas A&M University in partial
Facts and Findings. Exhibit A-1
 Exhibit A-1 Facts and Findings The county periodically prepares coordinated countywide forecasts for all the cities in the county and the unincorporated area. These forecasts can be used by cities as a
TIME SERIES ANALYSIS AND FORECASTING USING THE STATISTICAL MODEL ARIMA
 CHAPTER 6 TIME SERIES ANALYSIS AND FORECASTING USING THE STATISTICAL MODEL ARIMA 6.1. Introduction A time series is a sequence of observations ordered in time. A basic assumption in the time series analysis
Short-Term Job Growth Impacts of Hurricane Harvey on the Gulf Coast and Texas
 Short-Term Job Growth Impacts of Hurricane Harvey on the Gulf Coast and Texas Keith Phillips & Christopher Slijk Federal Reserve Bank of Dallas San Antonio Branch The views expressed in this presentation
Forecasting Chapter 3
 Forecasting Chapter 3 Introduction Current factors and conditions Past experience in a similar situation 2 Accounting. New product/process cost estimates, profit projections, cash management. Finance.
TOOLS AND DATA NEEDS FOR FORECASTING AND EARLY WARNING
 TOOLS AND DATA NEEDS FOR FORECASTING AND EARLY WARNING Professor Richard Samson Odingo Department of Geography and Environmental Studies University of Nairobi, Kenya THE NEED FOR ADEQUATE DATA AND APPROPRIATE
BEFORE THE PUBLIC UTILITIES COMMISSION OF THE STATE OF COLORADO * * * *
 Exhibit No. 1 BEFORE THE PUBLIC UTILITIES COMMISSION OF THE STATE OF COLORADO * * * * IN THE MATTER OF THE APPLICATION OF PUBLIC SERVICE COMPANY OF COLORADO FOR APPROVAL OF ITS 0 ELECTRIC RESOURCE PLAN
Abram Gross Yafeng Peng Jedidiah Shirey
 Abram Gross Yafeng Peng Jedidiah Shirey Contents Context Problem Statement Method of Analysis Forecasting Model Way Forward Earned Value NOVEC Background (1 of 2) Northern Virginia Electric Cooperative
Enhancing Weather Information with Probability Forecasts. An Information Statement of the American Meteorological Society
 Enhancing Weather Information with Probability Forecasts An Information Statement of the American Meteorological Society (Adopted by AMS Council on 12 May 2008) Bull. Amer. Meteor. Soc., 89 Summary This
NOWCASTING REPORT. Updated: September 23, 2016
 NOWCASTING REPORT Updated: September 23, 216 The FRBNY Staff Nowcast stands at 2.3% and 1.2% for 216:Q3 and 216:Q4, respectively. Negative news since the report was last published two weeks ago pushed
The Role of Weather in Risk Management For the Market Technician s Association October 15, 2013
 The Role of Weather in Risk Management For the Market Technician s Association October 15, 2013 RIA PERSAD President StatWeather rpersad@statweather.com Predictive Analytics Consumer Behavior Astronomy
Oregon Population Forecast Program Rulemaking Advisory Committee (RAC) Population Research Center (PRC)
 Population Research Center (PRC)") Oregon Population Forecast Program Rulemaking Advisory Committee (RAC) Population Research Center (PRC) RAC Meeting Agenda 1. Committee member introductions 2. Review charge of the Oregon Population Forecast
Oregon Population Forecast Program Rulemaking Advisory Committee (RAC) Population Research Center (PRC) RAC Meeting Agenda 1. Committee member introductions 2. Review charge of the Oregon Population Forecast
BEFORE THE PUBLIC UTILITY COMMISSION OF THE STATE OF OREGON UE 294. Load Forecast PORTLAND GENERAL ELECTRIC COMPANY. Direct Testimony and Exhibits of
 UE 294 / PGE / 1200 Dammen - Riter BEFORE THE PUBLIC UTILITY COMMISSION OF THE STATE OF OREGON UE 294 Load Forecast PORTLAND GENERAL ELECTRIC COMPANY Direct Testimony and Exhibits of Sarah Dammen Amber
An online data and consulting resource of THE UNIVERSITY OF TOLEDO THE JACK FORD URBAN AFFAIRS CENTER
 An online data and consulting resource of THE JACK FORD URBAN AFFAIRS CENTER THE CENTER FOR GEOGRAPHIC INFORMATION SCIENCE AND APPLIED GEOGRAPHICS DEPARTMENT OF GEOGRAPHY AND PLANNING THE UNIVERSITY OF
Forecasting demand in the National Electricity Market. October 2017
 Forecasting demand in the National Electricity Market October 2017 Agenda Trends in the National Electricity Market A review of AEMO s forecasting methods Long short-term memory (LSTM) neural networks
DEPARTMENT OF QUANTITATIVE METHODS & INFORMATION SYSTEMS
 DEPARTMENT OF QUANTITATIVE METHODS & INFORMATION SYSTEMS Moving Averages and Smoothing Methods ECON 504 Chapter 7 Fall 2013 Dr. Mohammad Zainal 2 This chapter will describe three simple approaches to forecasting
Analyzing the effect of Weather on Uber Ridership
 ABSTRACT MWSUG 2016 Paper AA22 Analyzing the effect of Weather on Uber Ridership Snigdha Gutha, Oklahoma State University Anusha Mamillapalli, Oklahoma State University Uber has changed the face of taxi
Measuring the Economic Impact of Tourism on Cities. Professor Bruce Prideaux James Cook University Australia
 Measuring the Economic Impact of Tourism on Cities Professor Bruce Prideaux James Cook University Australia Outline of Presentation Aim and scope Methodology Current range of indicators The way forward
As included in Load Forecast Review Report (Page 1):
:") As included in Load Forecast Review Report (Page 1): A key shortcoming of the approach taken by MH is the reliance on a forecast that has a probability of being accurate 50% of the time for a business
As included in Load Forecast Review Report (Page 1): A key shortcoming of the approach taken by MH is the reliance on a forecast that has a probability of being accurate 50% of the time for a business
Ameren Missouri Peak Load Forecast Energy Forecasting Meeting, Las Vegas. April 17-18, 2013
 Ameren Missouri Peak Load Forecast Energy Forecasting Meeting, Las Vegas April 17-18, 2013 Motivation for End Use Peak Forecasting Missouri IRP rules have extremely detailed load analysis and forecasting
at least 50 and preferably 100 observations should be available to build a proper model
 III Box-Jenkins Methods 1. Pros and Cons of ARIMA Forecasting a) need for data at least 50 and preferably 100 observations should be available to build a proper model used most frequently for hourly or
Decision 411: Class 7
 Decision 411: Class 7 Confidence limits for sums of coefficients Use of the time index as a regressor The difficulty of predicting the future Confidence intervals for sums of coefficients Sometimes the
From Sales to Peak, Getting It Right Long-Term Demand Forecasting
 From Sales to Peak, Getting It Right Long-Term Demand Forecasting 12 th Annual Energy Forecasters Meeting Las Vegas, NV April 2 April 3, 2014 Terry Baxter, NV Energy Manager, Forecasting Getting the Peak