Generation of Three-Dimensional Meteorological Field based on Sounding Data
|
|
|
- Jayson Ford
- 5 years ago
- Views:
Transcription
1 Send Orders for Reprints to 186 The Open Cybernetics & Systemics Journal, 2015, 9, Open Access Generation of Three-Dimensional Meteorological Field based on Sounding Data Xuetao Yu 1,2, Xiaoping Rui 3,*, Zhen Ding 4, Heming Sun 5 and Yi Shu 6 1 Transportation Institute, Shijiazhuang Tiedao University, Shijiazhuang, Hebei, , P.R. China; 2 Traffic Safety and Control Lab in Hebei Province, Shijiazhuang, Hebei, , P.R. China; 3 College of Resources and Environment, University of Chinese Academy of Sciences, Beijing, , P.R. China; 4 The First Surveying and Mapping Institute of Anhui Province, Hefei, Anhui, , P.R. China; 5 School of Remote Sensing, Nanjing University of Information Science and Technology, Nanjing, Jiangsu, , P.R. China; 6 Quanzhou Meteorological Bureau, Quanzhou, Fujian, , P.R. China Abstract: Given the uneven distribution of sounding and automatic weather stations throughout the Fujian province of China, a method for the extension of meteorological elements from point data to a three dimensional field is proposed, which can be used for hail detection and other weather forecasts. Considering the temperature and air pressure as the classic meteorological elements, these are extended to two and three dimensions and the error is analyzed according to the spatial distribution law of temperature and air pressure in the horizontal and vertical directions. The conclusions are that (1) the extension method of the meteorological elements to two and three dimensions proposed in this paper is characterized by high precision and reliability and (2) the generated height map for the same temperature level and vertical cross section of temperature can be very helpful for hail and other weather forecasts. Keywords: Meteorological elements, OpenGL, sounding data, three dimensional extension. 1. INTRODUCTION Since the distribution of sounding and automatic weather stations is uneven, the time and place of hail shooting is uncertain and so is the formation height of hail stones above the 0 C level height. Therefore, the extension of point data from meteorological elements to a three-dimensional meteorological element field can provide precious data for hail detection and forecast. Fujian is a large province of complex terrain and varied climate, with an uneven distribution of weather stations. The establishment of a three-dimensional meteorological element field allows the full use of the meteorological data available for the study area. Spatial interpolation methods for meteorological elements have been studied extensively and widely. Studies include the interpolation of temperature, precipitation volume, and sunshine duration using inverse distance weighting, interpolating polynomials, spline, and kriging methods, among others. In addition, the differences between these methods have also been compared [1-9]. To estimate a 30-year period of 10-day mean air temperatures and monthly photosynthetic active radiation (PAR) fluxes at specific sites in China, Lin et al. applied the ordinary kriging (OK) and squares (IDS) and the gradient plus inverse-distance-squared (GIDS) [2]. The annual average and accumulated temperature and rainfall data from 2114 meteorological stations located in China and surrounding countries obtained in were interpolated using inverse distance weighing (IDW), OK, and spline techniques with ArcMap by Ma et al. [6]. The three interpolation methods were evaluated by cross-validation and their results indicated that the precision of the interpolation varied significantly with the number of meteorological stations selected. Many researchers studied the two-dimensional extension of the distribution of meteorological elements, but did not consider a three-dimensional extension, in agreement with the three-dimensional spatial distribution of their characteristics. A meteorological element field in three dimensions can then more accurately describe the meteorological environment characteristics during hail or rainfall. Assuming the Fujian province as a study area and considering the distribution characteristics of the meteorological elements in the horizontal and vertical directions, we proposed a method of establishing a meteorological element field in three dimensions and applied it using real sounding and automatic weather station data. 2. METEOROLOGICAL DATA The selected meteorological data includes the meteorological element data generated every 10 minutes by automatic weather stations and the sounding data recorded daily at 8 a.m. and 8 p.m. The data from automatic weather stations can describe the surface meteorology while the sounding data can describe the meteorology at different heights. Given the limited number of sounding stations in China, to obtain the three-dimensional meteorological field for a large area, we selected six sounding stations (IDs 57933, 58633, 58725, 58847, 59134, and 59316) located in or near the Fu X/ Bentham Open
")
2 Generation of Three-Dimensional Meteorological Field based on Sounding Data The Open Cybernetics & Systemics Journal, 2015, Volume Fig. (1). Region coverage by the sounding stations. jian province that could cover the entire province, as shown in Fig. (1) Meteorological Element Data from Automatic Weather Stations The data recorded at regular intervals by automatic weather stations includes the observation time (China Standard Time-CST), 2- and 10-minute average wind direction, 2- and 10-minute average wind speed, direction, occurrence time, and speed of the maximum wind, current wind speed and direction, current, minimum, and maximum temperature and their occurrence times, relative and minimum relative humidity and its occurrence time, vapor pressure, dew-point temperature, current, minimum, and maximum air pressure and their occurrence times, current, minimum, and maximum grass temperature and their occurrence times, current, minimum, and maximum surface temperature and their occurrence times, ground temperature below 5, 10, 15, 20, 40, 80, 160, and 320 cm, evaporation capacity, sea-level pressure, and current and minimum visibility and its occurrence time. The wind speed and direction, temperature, dew-point temperature, and air pressure are particularly useful for the understanding of the meteorological environment at a specific time Sounding Data from Sounding Stations The sounding data includes aerial mapping and temperature log pressure (TlogP). The aerial mapping describes the meteorological element information for different surfaces of equal pressure (1000, 925, 850, 700, 500, 400, 300, 250, 200, 150, and 100 hpa). The meteorological element information include the height above sea level, daily temperature, dew-point deficit, and wind speed and direction at 8 a.m. and 8 p.m. (CST). The TlogP sounding data includes the air pressure, height above sea level, temperature, dew-point temperature, and wind speed and direction, which is mainly used for generating the TlogP diagram in the MICAPS (Meteorological Information Comprehensive Analysis and Process System) software. The MICAPS software, developed by the China Meteorological Administration, is the main forecast operation system for processing satellite and radar weather data and numerical forecast products, being widely used in regional and provincial meteorological bureaus in China. Three versions have been developed, with the newest version MICAPS 4.0 officially launched in GENERATION METHODS As meteorological elements like temperature, moisture, and air pressure are usually presented as single-point data provided by automatic weather stations and their distribution is continuous, we could generate two-dimensional meteorological element fields using an efficient interpolation algorithm. In addition, given the clear changes in height for the air pressure and temperature and the possibility of acquiring meteorological values at different heights by the sounding stations, we could generate three-dimensional meteorological element fields combining multi-point sounding data and the two-dimensional meteorological element field. The principle of spatial interpolation is to extend the value of the variables to the non-sampled grid points. Frequently used and widely known interpolation methods include the IDW, spline, kriging, and arithmetic mean. As these methods are mature algorithms in spatial interpolation, no more introduction and comments are made herein. Figs. (2) and (3)
 for the Fujian province at 8 a.m. on May 30, 2005, using an ordinary kriging interpolation.")
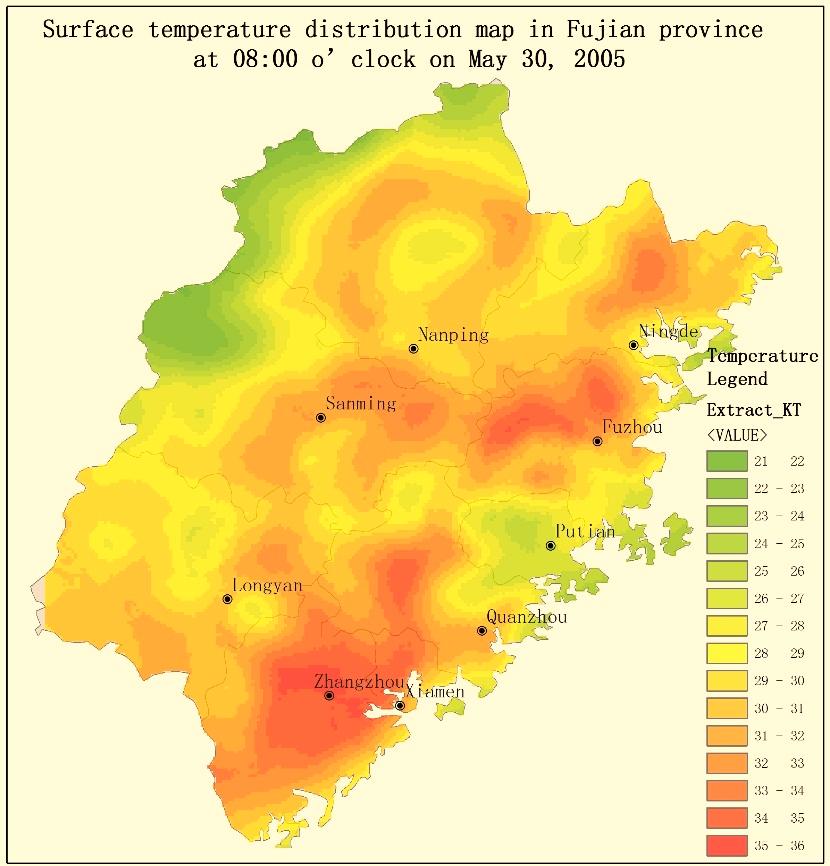
3 188 The Open Cybernetics & Systemics Journal, 2015, Volume 9 Yu et al. Fig. (2). Distribution map of surface air pressure (in hpa) for the Fujian province at 8 a.m. on May 30, 2005, using an ordinary kriging interpolation. Fig. (3). Surface temperature distribution map (in C) for the Fujian province at 8 a.m. on May 30, 2005, using an ordinary kriging interpolation.

4 Generation of Three-Dimensional Meteorological Field based on Sounding Data The Open Cybernetics & Systemics Journal, 2015, Volume Fig. (4). temperature lines and curves according to the height. Table 1. Parameters of the fitted temperature curves according to the height. Sounding Station c x x2 x * * * * * * * * * * * * * * * * * *10-12 show the surface air pressure and the temperature distribution, respectively, for the Fujian province at 8 a.m. in May 30, 2005, generated by ordinary kriging interpolation in ArcGIS Desktop software Three-Dimensional Interpolation The surface distribution maps of temperature and surface air pressure only reflect the distribution of the meteorological elements on the surface. Since real meteorological elements are distributed in three dimensions, the improvement of hail detection and other forecasts requires the establishment of three-dimensional meteorological element fields combining surface meteorological element and sounding data. For example, for the application of the WSR-88D Hail Detection Algorithm (HDA) it is vital to calculate the 0 and the -20 C level height. Using traditional two-dimensional interpolation methods, we cannot acquire the threedimensional distribution features of the meteorological elements. As presented in the following sections, these are extended three-dimensionally according to the spatial distribution law of temperature and air pressure in the vertical direction. In the troposphere, temperature decreases with height at a rate of about 6 C/1000 m. This rate varies with the season but can be calculated using the temperature change at different heights from the sounding data. According to the position of the sounding stations in or around the Fujian province, we divided the region into six parts using the Thiessen polygon method (Fig. 1). Then, the temperature data from the different sounding stations was fitted by cubic curves and lines, according to the parameters shown in Tables 1 and 2. From Fig. (4), we can see that the temperature lapse rate above the
5 190 The Open Cybernetics & Systemics Journal, 2015, Volume 9 Yu et al. Table 2. Average temperature lapse rates for all sounding stations. Sounding Station Lapse Rate Fujian province is roughly compatible with the rule, and that the fitted cubic curves are projected along the fitted lines. From Table 2 we can conclude a temperature decrease with height at a rate of about 6.4 C/1000 m for that specific location and day. According to the above temperature lapse rate at different locations, we extended the surface temperature distribution map to three dimensions. By adopting the fitted cubic curves, the three-dimensional temperature distribution map built with the OpenGL graphics program interface is shown in Fig. (5). The temperature sections can be acquired by moving the sliders in different heights and directions, and can be saved in a figure (.bmp) or text (.txt) format, to be used in the analysis of the temperature distribution characteristics at the height of hail formation. The above method was used to extend the temperature field to three dimensions. To extend the air pressure threedimensionally, we fitted the air pressure data from the different sounding stations to cubic curves and lines. From Fig. (6), we see that the air pressure lapse rate above the Fujian province was perfectly compatible with the cubic curve, whose parameters are shown in Table 3. Similarly, by adopting the fitted cubic curves, the three-dimensional air pressure distribution map was generated with the OpenGL graphics program interface (Fig. 7). The air pressure sections can be acquired by moving the sliders in different heights and directions, and can be saved in a figure (.bmp) or text (.txt) format, to be used in the analysis of the air pressure distribution characteristics at the height of hail formation. To verify the fitted pressure-altitude curve, we calculated the fitted heights using the following pressure-altitude equation: T v p z 2 z 1 = R d 2 d ln p (1) p 1 g where p1 and p2 are the air pressure at two points, z1 is the known height, and z2 the unknown height. R d expresses the dry air gas constant ( J K -1 kg -1 ) and g is the gravity acceleration. Tv is the virtual temperature (in K ). Both g and Tv vary with height, so it is very difficult to calculate an integral value. However, g changes are very slow so 2 that, for simplicity, a constant value of m/s is assumed according to the geographical position of the study area. The thermodynamic temperature (Tv ) is given by the following equation: Fig. (5). distribution map (in C) in three dimensions.

.")
6 Generation of Three-Dimensional Meteorological Field based on Sounding Data The Open Cybernetics & Systemics Journal, 2015, Volume Fig. (6). air pressure lines and curves according to the height. Fig. (7). Air pressure distribution map (in hpa) in three dimensions.
7 192 The Open Cybernetics & Systemics Journal, 2015, Volume 9 Yu et al. Table 3. Parameters of the fitted air pressure curves according to the height. Sounding Station c x x2 x * * * * * * * * * * * *10-11 T v = ( q) T (2) where q expresses the specific humidity, calculated by the following equation: e q = (3) p 0.378e where e expresses the vapor pressure, calculated by the following equation: (T ) exp[ ](T > ) T e = 17.67(T ) exp[ ] (T < ) T (4) with f representing the relative humidity, calculated by the following equation: f = e e s q q s (5) Based on the above formulas, the calculations were performed using MATLAB software. Considering the sounding data from station as an example, there were 18 valid layers at 8 a.m. May 11, 2011 CST. The space between two neighboring valid layers was divided into 500 sections of equal distance, and the temperature and dew-point temperature were fixed between the sub-layers (i.e., isothermal atmosphere between the sub-layers). The barometric height for the isothermal atmosphere was given by the Laplace barometric height equation: Table 4. The fitted and calculated heights and their errors at station (including 18 layers). Altitude (m) Dew-point
8 Generation of Three-Dimensional Meteorological Field based on Sounding Data The Open Cybernetics & Systemics Journal, 2015, Volume Table 5. The fitted and calculated heights and their errors at station (including 17 layers). Altitude (m) z 2 z 1 = R T d v g ln p 1 (6) p 2 According to the above method and formulas, we calculated the fitted and calculated height for different air pressures from the six sounding stations at 8 a.m. May CST, together with their associated error. The results are shown in Tables 4-9. If the cell value in these tables is 9999, the current observed value is missing Error Analysis The errors of the fitted and calculated heights for the different sounding stations are shown in Tables 4-9. Their average errors were also calculated (Table 10). From Table 10, we conclude that (1) the error of the fitted height decreased at high altitude and increased at low altitude and (2) the error of the calculated height was always very low, and the calculated heights always fitted the observed values very well Application of the Generation Methods The three-dimensional meteorological element maps generated by the above methods present the distribution characteristics of the meteorological elements at different heights. The two- and three-dimensional height maps for the 0 and -20 C level at 8 a.m. May 11, 2011 CST generated by us are shown in Figs. (8) and (9). As the height of hailstone formation and development, is above the 0 C level height, these maps are very helpful for hail warning and forecasting. The extracted section of the temperature field shown in Fig. (10) plays a particularly important role in analyzing the atmosphere and accurately forecasting the weather. CONCLUSION The methods to interpolate the meteorological elements to two and three dimensions using sounding data from sounding stations and meteorological element data from automatic weather stations are discussed in this paper. The format and content of sounding and meteorological element data were introduced first, and then, using temperature and air pressure as examples, we extended the data to two and three dimensions and analyzed the error. The meteorological element distribution maps in two and three dimensions show high precision and reliability, playing an important role in hail warning and forecasting, by analyzing the atmosphere and accurately forecasting the weather. The addition of more types of meteorological data (like from national weather stations) in the future and the increase in the time resolution will further improve the quality of three-dimensional meteorological element fields.
9 194 The Open Cybernetics & Systemics Journal, 2015, Volume 9 Yu et al. Table 6. The fitted and calculated heights and their errors at station (including 21 layers). Altitude (m) Table 7. The fitted and calculated heights and their errors at station (including 20 layers). Altitud e(m)
10 Generation of Three-Dimensional Meteorological Field based on Sounding Data The Open Cybernetics & Systemics Journal, 2015, Volume Table 7. Contd.. Altitud e(m) Table 8. The fitted and calculated heights and their errors at station (including 20 layers). Altitude (m)
11 196 The Open Cybernetics & Systemics Journal, 2015, Volume 9 Yu et al. Table 8. Contd Altitude (m) Table 9. The fitted and calculated heights and their errors at station (including 19 layers). Altitude (m) Table 10. Average errors of the fitted and calculated heights. Sounding Station A B A: Average Height (%, Height > 700m) B: Average
. Height map (in m) of 0 C level at 8 a.m. May 11, 2011. Fig. (10).")
.")
12 Generation of Three-Dimensional Meteorological Field based on Sounding Data Fig. (8). Height map (in m) of 0 C level at 8 a.m. May 11, Fig. (10). section (in C) at 8 a.m. May 11, The Open Cybernetics & Systemics Journal, 2015, Volume Fig. (9). Height map (in m) of -20 C level at 8 a.m. May 11, 2011.
13 198 The Open Cybernetics & Systemics Journal, 2015, Volume 9 Yu et al. CONFLICT OF INTEREST The authors confirm that this article content has no conflict of interest. ACKNOWLEDGEMENTS The research reported herein was sponsored by the National Science and Technology Major Project of China (Grant No. 2011ZX ), the National Science and Technology Support Program of China (Grant No. 2012BAC25B01) and the Scientific Research Foundation for Doctor of Shijiazhuang Tiedao University. REFERENCES [1] S. J. Jeffrey, J. O. Carter, K. B. Moodie, and A. R. Beswick, "Using spatial interpolation to construct a comprehensive archive of Australian climate data," Environmental Modelling and Software, vol. 16, no. 4, pp , [2] Z. H. Lin, X. G. Mo, H. X. Li, and H. B. Li, "Comparison of three spatial interpolation methods for climate variables in China", Acta Geographica Sinica, (In Chinese) vol. 57, no. 1, pp , [3] Z. M. Feng, Y. Z. Yang, X. Q. Ding and Z. H. Lin, "Optimization of the spatial interpolation methods for climate resources", Geographical Research, vol. 23, no. 3, pp , (In Chinese). [4] F. Cai, G. R. Yu, Q. L. Zhu, H. L. He, X. A. Liu, Z. Q. Li and X. B. Guo, "Comparison of precisions between spatial methods of climatic factors: a case study on mean air temperature", Resources Science, vol. 27, no. 5, pp , (In Chinese). [5] J. L. Li, J. Zhang, C. Zhang and Q. G. Chen, "Analyze and compare the spatial interpolation methods for climate factor", Pratacultural Science, vol. 23, no. 8, pp. 6-11, (In Chinese). [6] X. L. Ma, C. E. Li, and Q. G. Chen, "Study on the method of GIS based spatial interpolation of climate factors in China", Pratacultural Science, vol. 25, no. 11, pp , (In Chinese). [7] X. J. Jiang, X. J. Liu, F. Huang, H. Y. Jiang, W. X. Cao, and Y. Zhu, "Comparison of spatial interpolation methods for daily meteorological elements", Chinese Journal of Applied Ecology, vol. 21, no. 3, pp , (In Chinese). [8] C. Tobin, L. Nicotina, M. B. Parlange, A. Berne, and A. Rinaldo "Improved interpolation of meteorological forcings for hydrologic applications in a Swiss Alpine region", Journal of Hydrology, vol. 401no. 1-2, pp , [9] T. Wu, and Y. Li "Spatial interpolation of temperature in the United States using residual kriging", Applied Geography, vol. 44, pp , Received: September 16, 2014 Revised: December 23, 2014 Accepted: December 31, 2014 Yu et al.; Licensee Bentham Open. This is an open access article licensed under the terms of the Creative Commons Attribution Non-Commercial License ( licenses/by-nc/3.0/) which permits unrestricted, non-commercial use, distribution and reproduction in any medium, provided the work is properly cited.
Application of Time Sequence Model Based on Excluded Seasonality in Daily Runoff Prediction
 Send Orders for Reprints to reprints@benthamscience.ae 546 The Open Cybernetics & Systemics Journal, 2014, 8, 546-552 Open Access Application of Time Sequence Model Based on Excluded Seasonality in Daily
Open Access Permanent Magnet Synchronous Motor Vector Control Based on Weighted Integral Gain of Sliding Mode Variable Structure
 Send Orders for Reprints to reprints@benthamscienceae The Open Automation and Control Systems Journal, 5, 7, 33-33 33 Open Access Permanent Magnet Synchronous Motor Vector Control Based on Weighted Integral
Decrease of light rain events in summer associated with a warming environment in China during
 GEOPHYSICAL RESEARCH LETTERS, VOL. 34, L11705, doi:10.1029/2007gl029631, 2007 Decrease of light rain events in summer associated with a warming environment in China during 1961 2005 Weihong Qian, 1 Jiaolan
A Study on Quantitative Analysis Method for Project Bidding Decision
 Send Orders for Reprints to reprints@benthamscience.ae The Open Cybernetics & Systemics Journal, 2015, 9, 345-349 345 Open Access A Study on Quantitative Analysis Method for Project Bidding Decision Zuhua
Model Output Statistics (MOS)
") Model Output Statistics (MOS) Numerical Weather Prediction (NWP) models calculate the future state of the atmosphere at certain points of time (forecasts). The calculation of these forecasts is based on
Model Output Statistics (MOS) Numerical Weather Prediction (NWP) models calculate the future state of the atmosphere at certain points of time (forecasts). The calculation of these forecasts is based on
Application of Atmosphere Precipitation Resources Distribution Remote Sensed by Ground-based GPS in the West of Taiwan Strait.
 4th International Conference on Mechatronics, Materials, Chemistry and Computer Engineering (ICMMCCE 2015) Application of Atmosphere Precipitation Resources Distribution Remote Sensed by Ground-based GPS
Optimization of a Multi-pendulum Wave Energy Converter
 Send Orders for Reprints to reprints@benthamscience.ae The Open Electrical & Electronic Engineering Journal, 2015, 9, 67-73 67 Optimization of a Multi-pendulum Wave Energy Converter Open Access Jun Zhang
Research on Lightning Warning with SAFIR Lightning Observation and Meteorological detection Data in Beijing-Hebei Areas
 Research on Lightning Warning with SAFIR Lightning Observation and Meteorological detection Data in Beijing-Hebei Areas Meng Qing 1 Zhang Yijun 1 Yao Wen 1 Zhu Xiaoyan 1 He Ping 1 Lv Weitao 1 Ding Haifang
The Modeling and Equalization Technique of Nonlinear Wireless Channel
 Send Orders for Reprints to reprints@benthamscience.ae The Open Cybernetics & Systemics Journal, 4, 8, 97-3 97 Open Access The Modeling and Equalization Technique of Nonlinear Wireless Channel Qiu Min
Reprint 850. Within the Eye of Typhoon Nuri in Hong Kong in C.P. Wong & P.W. Chan
 Reprint 850 Remote Sensing Observations of the Subsidence Zone Within the Eye of Typhoon Nuri in Hong Kong in 2008 C.P. Wong & P.W. Chan 8 th International Symposium on Tropospheric Profiling: Integration
Open Access Study on Reservoir-caprock Assemblage by Dual Logging Parameter Method
 Send Orders for Reprints to reprints@benthamscience.ae 282 The Open Petroleum Engineering Journal, 2015, 8, (Suppl 1: M4) 282-287 Open Access Study on Reservoir-caprock Assemblage by Dual Logging Parameter
The Research of Urban Rail Transit Sectional Passenger Flow Prediction Method
 Journal of Intelligent Learning Systems and Applications, 2013, 5, 227-231 Published Online November 2013 (http://www.scirp.org/journal/jilsa) http://dx.doi.org/10.4236/jilsa.2013.54026 227 The Research
A GIS-based Subcatchments Division Approach for SWMM
 Send Orders for Reprints to reprints@benthamscience.ae The Open Civil Engineering Journal, 2015, 9, 515-521 515 A GIS-based Subcatchments Division Approach for SWMM Open Access Shen Ji and Zhang Qiuwen
Mapping the Baseline of Terrestrial Gamma Radiation in China
 Radiation Environment and Medicine 2017 Vol.6, No.1 29 33 Note Mapping the Baseline of Terrestrial Gamma Radiation in China Zhen Yang, Weihai Zhuo* and Bo Chen Institute of Radiation Medicine, Fudan University,
DISTRIBUTION AND DIURNAL VARIATION OF WARM-SEASON SHORT-DURATION HEAVY RAINFALL IN RELATION TO THE MCSS IN CHINA
 3 DISTRIBUTION AND DIURNAL VARIATION OF WARM-SEASON SHORT-DURATION HEAVY RAINFALL IN RELATION TO THE MCSS IN CHINA Jiong Chen 1, Yongguang Zheng 1*, Xiaoling Zhang 1, Peijun Zhu 2 1 National Meteorological
Gridding of precipitation and air temperature observations in Belgium. Michel Journée Royal Meteorological Institute of Belgium (RMI)
") Gridding of precipitation and air temperature observations in Belgium Michel Journée Royal Meteorological Institute of Belgium (RMI) Gridding of meteorological data A variety of hydrologic, ecological,
Gridding of precipitation and air temperature observations in Belgium Michel Journée Royal Meteorological Institute of Belgium (RMI) Gridding of meteorological data A variety of hydrologic, ecological,
Experiment Study on Rheological Model of Soft Clay
 Send Orders for Reprints to reprints@benthamscience.ae 344 The Open Civil Engineering Journal, 2014, 8, 344-350 Experiment Study on Rheological Model of Soft Clay Open Access Donglin Wang*, Qiuling Lv
SOME STEP OF QUALITY CONTROL OF UPPER-AIR NETWORK DATA IN CHINA. Zhiqiang Zhao
 SOME STEP OF QUALITY CONTROL OF UPPER-AIR NETWORK DATA IN CHINA Zhiqiang Zhao China Meteorological Administration (CMA) 46, Zhongguancun Nandajie, Beijing, 100081,China Tel: 8610-68407362, Fax: 8610-62179786,
Measurement and Analysis of the Vertical Distribution Characteristic of the Atmospheric Particle Concentration in Beijing District
 International Journal of Environmental Science and Development, Vol. 5, No. 2, April 214 Measurement and Analysis of the Vertical Distribution Characteristic of the Atmospheric Particle Concentration in
Open Access Research on Data Processing Method of High Altitude Meteorological Parameters Based on Neural Network
 Send Orders for Reprints to reprints@benthamscience.ae The Open Automation and Control Systems Journal, 2015, 7, 1597-1604 1597 Open Access Research on Data Processing Method of High Altitude Meteorological
Using Geographic Information Systems and Remote Sensing Technology to Analyze Land Use Change in Harbin, China from 2005 to 2015
 Using Geographic Information Systems and Remote Sensing Technology to Analyze Land Use Change in Harbin, China from 2005 to 2015 Yi Zhu Department of Resource Analysis, Saint Mary s University of Minnesota,
THE STRUCTURE OF THE ATMOSPHERIC BOUNDARYLAYER DURING FOGGY DAYS IN WINTER AND SPRING SEASONS AT SOUTHERT OF BEIJING
 THE STRUCTURE OF THE ATMOSPHERIC BOUNDARYLAYER DURING FOGGY DAYS IN WINTER AND SPRING SEASONS AT SOUTHERT OF BEIJING HONGSHENG ZHANG, KAI WANG, FUYU LI, XINJIAN LIU, JIAYI CHEN Department of Atmospheric
Preliminary Research on Grassland Fineclassification
 IOP Conference Series: Earth and Environmental Science OPEN ACCESS Preliminary Research on Grassland Fineclassification Based on MODIS To cite this article: Z W Hu et al 2014 IOP Conf. Ser.: Earth Environ.
The Wind-Induced Vibration Response for Tower Crane Based on Virtual Excitation Method
 Send Orders for Reprints to reprints@benthamscience.ae The Open Mechanical Engineering Journal, 2014, 8, 201-205 201 Open Access The Wind-Induced Vibration Response for Tower Crane Based on Virtual Excitation
Dust Storm: An Extreme Climate Event in China
 Dust Storm: An Extreme Climate Event in China ZHENG Guoguang China Meteorological Administration Beijing, China, 100081 zgg@cma.gov.cn CONTENTS 1. Climatology of dust storms in China 2. Long-term variation
Open Access Measuring Method for Diameter of Bearings Based on the Edge Detection Using Zernike Moment
 Send Orders for Reprints to reprints@benthamscience.ae 114 The Open Automation and Control Systems Journal, 2015, 7, 114-119 Open Access Measuring Method for Diameter of Bearings Based on the Edge Detection
Water cycle changes during the past 50 years over the Tibetan Plateau: review and synthesis
 130 Cold Region Hydrology in a Changing Climate (Proceedings of symposium H02 held during IUGG2011 in Melbourne, Australia, July 2011) (IAHS Publ. 346, 2011). Water cycle changes during the past 50 years
Acoustic Emission Location Experiment Research on Stope Roof Breakage Boundaries Time-Varying Process
 Send Orders for Reprints to reprints@benthamscience.ae The Open Mechanical Engineering Journal, 2015, 9, 797-805 797 Open Access Acoustic Emission Location Experiment Research on Stope Roof Breakage Boundaries
GIS-BASED DISASTER WARNING SYSTEM OF LOW TEMPERATURE AND SPARE SUNLIGHT IN GREENHOUSE
 GIS-BASED DISASTER WARNING SYSTEM OF LOW TEMPERATURE AND SPARE SUNLIGHT IN GREENHOUSE 1,2,* 1,2 Ruijiang Wei, Chunqiang Li, Xin Wang 1, 2 1 Hebei Provincial Institute of Meteorology, Shijiazhuang, Hebei
Comparison of rainfall distribution method
 Team 6 Comparison of rainfall distribution method In this section different methods of rainfall distribution are compared. METEO-France is the French meteorological agency, a public administrative institution
A Preliminary Analysis of the Relationship between Precipitation Variation Trends and Altitude in China
 ATMOSPHERIC AND OCEANIC SCIENCE LETTERS, 2011, VOL. 4, NO. 1, 41 46 A Preliminary Analysis of the Relationship between Precipitation Variation Trends and Altitude in China YANG Qing 1, 2, MA Zhu-Guo 1,
Application of a statistical method for medium-term rainfall prediction
 Climate Variability and Change Hydrological Impacts (Proceedings of the Fifth FRIEND World Conference held at Havana, Cuba, November 2006), IAHS Publ. 308, 2006. 275 Application of a statistical method
PSD Analysis and Optimization of 2500hp Shale Gas Fracturing Truck Chassis Frame
 Send Orders for Reprints to reprints@benthamscience.ae The Open Mechanical Engineering Journal, 2014, 8, 533-538 533 Open Access PSD Analysis and Optimization of 2500hp Shale Gas Fracturing Truck Chassis
5. General Circulation Models
 5. General Circulation Models I. 3-D Climate Models (General Circulation Models) To include the full three-dimensional aspect of climate, including the calculation of the dynamical transports, requires
PACS: Wc, Bh
 Acta Phys. Sin. Vol. 61, No. 19 (2012) 199203 * 1) 1) 2) 2) 1) (, 100081 ) 2) (, 730000 ) ( 2012 1 12 ; 2012 3 14 ).,, (PBEP).,, ;,.,,,,. :,,, PACS: 92.60.Wc, 92.60.Bh 1,,, [1 3]. [4 6].,., [7] [8] [9],,,
Study on Precipitation Forecast and Testing Methods of Numerical Forecast in Fuxin Area
 Journal of Geoscience and Environment Protection, 2017, 5, 32-38 http://www.scirp.org/journal/gep ISSN Online: 2327-4344 ISSN Print: 2327-4336 Study on Precipitation Forecast and Testing Methods of Numerical
SCIENCE CHINA Earth Sciences. Climatic change features of fog and haze in winter over North China and Huang-Huai Area
 SCIENCE CHINA Earth Sciences RESEARCH PAPER August 2015 Vol.58 No.8: 1370 1376 doi: 10.1007/s11430-015-5089-3 Climatic change features of fog and haze in winter over North China and Huang-Huai Area YIN
Study on the Pressure and Temperature Distribution of Solid-Plug Conveying Element on Centrifugal Extruder
 Send Orders for Reprints toreprints@benthamscience.net 76 The Open Mechanical Engineering Journal, 2013, 7, 76-82 Open Access Study on the Pressure and Temperature Distribution of Solid-Plug Conveying
Add NOAA nowcoast Layers to Maps
 WebEOC Maps Add-on Quick Reference Guide Add NOAA nowcoast Layers to Maps Overview With Maps Add-on, you can configure an unlimited number of map layers. These layers allow you to control the data you
Study Guide. Earth Systems 1109 Weather Dynamics. Adult Basic Education Science. Prerequisites: Credit Value: 1
 Adult Basic Education Science Weather Dynamics Study Guide Prerequisites: None Credit Value: 1 Text: Science 10 ; Ritter, Plumb, et al; Nelson, 2001. Earth Systems Concentration Earth Systems 3109A Earth
Spati-temporal Changes of NDVI and Their Relations with Precipitation and Temperature in Yangtze River Catchment from 1992 to 2001
 Spati-temporal Changes of NDVI and Their Relations with Precipitation and Temperature in Yangtze River Catchment from 1992 to 2001 ZHANG Li 1, CHEN Xiao-Ling 1, 2 1State Key Laboratory of Information Engineering
MxVision WeatherSentry Web Services Content Guide
 MxVision WeatherSentry Web Services Content Guide July 2014 DTN 11400 Rupp Drive Minneapolis, MN 55337 00.1.952.890.0609 This document and the software it describes are copyrighted with all rights reserved.
High-Resolution Mesoscale Analysis Data from the South China Heavy Rainfall Experiment (SCHeREX): Data Generation and Quality Evaluation
: Data Generation and Quality Evaluation") 478 ACTA METEOROLOGICA SINICA VOL.25 High-Resolution Mesoscale Analysis Data from the South China Heavy Rainfall Experiment (SCHeREX): Data Generation and Quality Evaluation NI Yunqi 1 ( ), CUI Chunguang
478 ACTA METEOROLOGICA SINICA VOL.25 High-Resolution Mesoscale Analysis Data from the South China Heavy Rainfall Experiment (SCHeREX): Data Generation and Quality Evaluation NI Yunqi 1 ( ), CUI Chunguang
Analysis of China s Haze Days in the Winter Half-Year and the Climatic Background during
 ADVANCES IN CLIMATE CHANGE RESEARCH 5(1): 1-6, 2014 www.climatechange.cn DOI: 10.3724/SP.J.1248.2014.001 CHANGES IN CLIMATE SYSTEM Analysis of China s Haze Days in the Winter Half-Year and the Climatic
Test Study on Strength and Permeability Properties of Lime-Fly Ash Loess under Freeze-Thaw Cycles
 Send Orders for Reprints to reprints@benthamscience.net 172 The Open Civil Engineering Journal, 214, 8, 172-176 Open Access Test Study on Strength and Permeability Properties of Lime-Fly Ash Loess under
Study on Failure Plane of Bulk Solid in Squat Silos
 The Open Civil Engineering Journal, 12, 6, 33-37 33 Study on Failure Plane of Bulk Solid in Squat Silos Open Access Changbing Chen * Department of Civil Engineering, Hefei University, Hefei 22, China Abstract:
2008, hm 2. ( Commodity Bundle) [ 6], 25 4 Vol. 25 No JOURNAL OF NATURAL RESOURCES Apr., , 2, 3, 1, 2 3*,
![2008, hm 2. ( Commodity Bundle) [ 6], 25 4 Vol. 25 No JOURNAL OF NATURAL RESOURCES Apr., , 2, 3, 1, 2 3*,](/thumbs/93/112700429.jpg "2008, hm 2. ( Commodity Bundle) [ 6], 25 4 Vol. 25 No JOURNAL OF NATURAL RESOURCES Apr., , 2, 3, 1, 2 3*,") 25 4 Vol. 25 No. 4 2010 4 JOURNAL OF NATURAL RESOURCES Apr., 2010 1, 2, 3, 3*, 3, 3, 1, 2 ( 1., 100101; 2., 100049; 3., 100193) :,,,,, ;, 2005, 12 7 5, 2005 :,,, : ; ; ; ; : F301. 21 : A : 1000-3037( 2010)
25 4 Vol. 25 No. 4 2010 4 JOURNAL OF NATURAL RESOURCES Apr., 2010 1, 2, 3, 3*, 3, 3, 1, 2 ( 1., 100101; 2., 100049; 3., 100193) :,,,,, ;, 2005, 12 7 5, 2005 :,,, : ; ; ; ; : F301. 21 : A : 1000-3037( 2010)
CLIMATE CHANGE ADAPTATION BY MEANS OF PUBLIC PRIVATE PARTNERSHIP TO ESTABLISH EARLY WARNING SYSTEM
 CLIMATE CHANGE ADAPTATION BY MEANS OF PUBLIC PRIVATE PARTNERSHIP TO ESTABLISH EARLY WARNING SYSTEM By: Dr Mamadou Lamine BAH, National Director Direction Nationale de la Meteorologie (DNM), Guinea President,
Research Article Direct Evidence of Reduction of Cloud Water after Spreading Diatomite Particles in Stratus Clouds in Beijing, China
 Meteorology Volume 2010, Article ID 412024, 4 pages doi:10.1155/2010/412024 Research Article Direct Evidence of Reduction of Cloud Water after Spreading Diatomite Particles in Stratus Clouds in Beijing,
Using Satellite Data to Analyze the Initiation and Evolution of Deep Convective Clouds
 Atmospheric and Oceanic Science Letters ISSN: 674-2834 (Print) 2376-623 (Online) Journal homepage: https://www.tandfonline.com/loi/taos20 Using Satellite Data to Analyze the Initiation and Evolution of
Chapter Introduction. Weather. Patterns. Forecasts Chapter Wrap-Up
 Chapter Introduction Lesson 1 Lesson 2 Lesson 3 Describing Weather Weather Patterns Weather Forecasts Chapter Wrap-Up How do scientists describe and predict weather? What do you think? Before you begin,
VALIDATION OF SPATIAL INTERPOLATION TECHNIQUES IN GIS
 VALIDATION OF SPATIAL INTERPOLATION TECHNIQUES IN GIS V.P.I.S. Wijeratne and L.Manawadu University of Colombo (UOC), Kumarathunga Munidasa Mawatha, Colombo 03, wijeratnesandamali@yahoo.com and lasan@geo.cmb.ac.lk
A 3DVAR Land Data Assimilation Scheme: Part 2, Test with ECMWF ERA-40
 A 3DVAR Land Data Assimilation Scheme: Part 2, Test with ECMWF ERA-40 Lanjun Zou 1 * a,b,c Wei Gao a,d Tongwen Wu b Xiaofeng Xu b Bingyu Du a,and James Slusser d a Sino-US Cooperative Center for Remote
Road & Railway Network Density Dataset at 1 km over the Belt and Road and Surround Region
 Journal of Global Change Data & Discovery. 2017, 1(4): 402-407 DOI:10.3974/geodp.2017.04.03 www.geodoi.ac.cn 2017 GCdataPR Global Change Research Data Publishing & Repository Road & Railway Network Density
Tornado Frequency and its Large-Scale Environments Over Ontario, Canada
 256 The Open Atmospheric Science Journal, 2008, 2, 256-260 Open Access Tornado Frequency and its Large-Scale Environments Over Ontario, Canada Zuohao Cao *,1 and Huaqing Cai 2 1 Meteorological Service
Open Access Experimental Research and Analysis of Vortex Excited Vibration Suppression of Spiral Stripe Strake
 Send Orders for Reprints to reprints@benthamscience.ae The Open Mechanical Engineering Journal, 2014, 8, 941-947 941 Open Access Experimental Research and Analysis of Vortex Excited Vibration Suppression
CREATE MAPS FOR TEMPERATURE DISTRIBUTION IN IRAQ USING ARC GIS TECHNIQUES
 IJABR, VOL.7 (4) 2017: 761-766 ISSN 2250 3579 CREATE MAPS FOR TEMPERATURE DISTRIBUTION IN IRAQ USING ARC GIS TECHNIQUES Ebtesam F. Khanjer & Nidaa ch. jaheed Department of Astronomy and Space, College
European Drought Observatory Progress on Drought Monitoring
 European Drought Observatory Progress on Drought Monitoring Alfred de Jager Diego Magni European Commission Joint Research Centre (JRC) Disaster Risk Management Unit Outline 1. Introduction Philosophy
Local Prediction of Precipitation Based on Neural Network
 Environmental Engineering 10th International Conference eissn 2029-7092 / eisbn 978-609-476-044-0 Vilnius Gediminas Technical University Lithuania, 27 28 April 2017 Article ID: enviro.2017.079 http://enviro.vgtu.lt
Standardized Precipitation Evapotranspiration Index (SPEI) Dataset in Yunnan Province, China
 Dataset in Yunnan Province, China") Journal of Global Change Data & Discovery. 2017, 1(4): 447-451 DOI:10.3974/geodp.2017.04.11 www.geodoi.ac.cn 2017 GCdataPR Global Change Research Data Publishing & Repository Standardized Precipitation
Journal of Global Change Data & Discovery. 2017, 1(4): 447-451 DOI:10.3974/geodp.2017.04.11 www.geodoi.ac.cn 2017 GCdataPR Global Change Research Data Publishing & Repository Standardized Precipitation
Remote sensing of haze aerosol over eastern China
 ISALSaRS'17, USTC, 21-June-2017 China University of Mining and Technology Remote sensing of haze aerosol over eastern China Qin Kai( 秦凯 ), CUMT ( 中国矿业大学 ) Wu Lixin, CSU( 中南大学 ) Wong Mansing, Hong Kong
multibeam bathymetric data is often based on the local depth datum, which is the local lowest normal low sea level, see the Figure 1. Multibeam Bathym
 3D DYNAMIC TERRAIN VISUALIZATION OF ISLAND AREAS AI Bo a, *, TANG Xinming b, SHI Shaoyu c, WANG Hongyan d, YANG Fanlin e a Geomatics College, Shandong University of Science and Technology, Qingdao, China
A WRF-based rapid updating cycling forecast system of. BMB and its performance during the summer and Olympic. Games 2008
 A WRF-based rapid updating cycling forecast system of BMB and its performance during the summer and Olympic Games 2008 Min Chen 1, Shui-yong Fan 1, Jiqin Zhong 1, Xiang-yu Huang 2, Yong-Run Guo 2, Wei
Analysis on Characteristics of Precipitation Change from 1957 to 2015 in Weishan County
 Journal of Geoscience and Environment Protection, 2017, 5, 125-133 http://www.scirp.org/journal/gep ISSN Online: 2327-4344 ISSN Print: 2327-4336 Analysis on Characteristics of Precipitation Change from
The Study of Soil Fertility Spatial Variation Feature Based on GIS and Data Mining *
 The Study of Soil Fertility Spatial Variation Feature Based on GIS and Data Mining * Chunan Li, Guifen Chen **, Guangwei Zeng, and Jiao Ye College of Information and Technology, Jilin Agricultural University,
Combining Deterministic and Probabilistic Methods to Produce Gridded Climatologies
 Combining Deterministic and Probabilistic Methods to Produce Gridded Climatologies Michael Squires Alan McNab National Climatic Data Center (NCDC - NOAA) Asheville, NC Abstract There are nearly 8,000 sites
The Effects of Terrain Slope and Orientation on Different Weather Processes in China under Different Model Resolutions
 NO.5 HUANG Danqing and QIAN Yongfu 617 The Effects of Terrain Slope and Orientation on Different Weather Processes in China under Different Model Resolutions HUANG Danqing ( ) and QIAN Yongfu ( ) School
INTERPOLATION AND SPATIAL MATCHING METHOD OF VARIOUS PUBLIC DATA FOR BUILDING AN INTEGRATED DATABASE
 Urban Transport XXIII 307 INTERPOLATION AND SPATIAL MATCHING METHOD OF VARIOUS PUBLIC DATA FOR BUILDING AN INTEGRATED DATABASE INTAEK JUNG & KYUSOO CHONG ICT Convergence and Integration Research Institute,
Emerging Needs, Challenges and Response Strategy
 Emerging Needs, Challenges and Response Strategy Development of Integrated Observing Systems in China JIAO Meiyan Deputy Administrator China Meteorological Administration September 2011 Geneva Outline
Nonlinear atmospheric response to Arctic sea-ice loss under different sea ice scenarios
 Nonlinear atmospheric response to Arctic sea-ice loss under different sea ice scenarios Hans Chen, Fuqing Zhang and Richard Alley Advanced Data Assimilation and Predictability Techniques The Pennsylvania
Numerical Experiment Research of a Marine Fog Event in the Pearl River Estuary Region
 NO.2 FAN Qi, Wang Anyu, FAN Shaojia, LI Jiangnan, WU Dui and LEONG Ka Cheng 231 Numerical Experiment Research of a Marine Fog Event in the Pearl River Estuary Region FAN Qi 1 ( ), WANG Anyu 1 ( ), FAN
URBAN HEAT ISLAND IN SEOUL
 URBAN HEAT ISLAND IN SEOUL Jong-Jin Baik *, Yeon-Hee Kim ** *Seoul National University; ** Meteorological Research Institute/KMA, Korea Abstract The spatial and temporal structure of the urban heat island
DOWNLOAD PDF READING CLIMATE MAPS
 Chapter 1 : Template:Climate chart/how to read a climate chart - Wikipedia Maps don't just tell you which way to go they can tell you practically everything about an area of land, even the weather. Learn
Uncertainties in Quantitatively Estimating the Atmospheric Heat Source over the Tibetan Plateau
 ATMOSPHERIC AND OCEANIC SCIENCE LETTERS, 2014, VOL. 7, NO. 1, 28 33 Uncertainties in Quantitatively Estimating the Atmospheric Heat Source over the Tibetan Plateau DUAN An-Min 1, 3, WANG Mei-Rong 1, 2,
HY-2A Satellite User s Guide
 National Satellite Ocean Application Service 2013-5-16 Document Change Record Revision Date Changed Pages/Paragraphs Edit Description i Contents 1 Introduction to HY-2 Satellite... 1 2 HY-2 satellite data
The lesson essential questions that will guide our investigations are:
 Properties of the Atmosphere: Understanding Patterns Through Observation and Data Collection that Lead to Prediction of Local and Global Weather and Climate. Up until this point in class you have learned
Stress and Wear Analysis of the Disc Cutter of Rock Tunnel Boring Machine
 Send Orders for Reprints to reprints@benthamscience.ae The Open Mechanical Engineering Journal, 2015, 9, 721-725 721 Open Access Stress and Wear Analysis of the Disc Cutter of Rock Tunnel Boring Machine
The Interdecadal Variation of the Western Pacific Subtropical High as Measured by 500 hpa Eddy Geopotential Height
 ATMOSPHERIC AND OCEANIC SCIENCE LETTERS, 2015, VOL. 8, NO. 6, 371 375 The Interdecadal Variation of the Western Pacific Subtropical High as Measured by 500 hpa Eddy Geopotential Height HUANG Yan-Yan and
Simulation on the Temperature Drop Rule of Hot Oil Pipeline
 Send Orders for Reprints to reprints@benthamscience.net The Open Fuels & Energy Science Journal, 2013, 6, 55-60 55 Simulation on the Temperature Drop Rule of Hot Oil Pipeline Enbin Liu *,1, Liuting Yang
Temperature (T) degrees Celsius ( o C) arbitrary scale from 0 o C at melting point of ice to 100 o C at boiling point of water Also (Kelvin, K) = o C
 degrees Celsius ( o C) arbitrary scale from 0 o C at melting point of ice to 100 o C at boiling point of water Also (Kelvin, K) = o C") 1 2 3 4 Temperature (T) degrees Celsius ( o C) arbitrary scale from 0 o C at melting point of ice to 100 o C at boiling point of water Also (Kelvin, K) = o C plus 273.15 0 K is absolute zero, the minimum
1 2 3 4 Temperature (T) degrees Celsius ( o C) arbitrary scale from 0 o C at melting point of ice to 100 o C at boiling point of water Also (Kelvin, K) = o C plus 273.15 0 K is absolute zero, the minimum
Variations of snow cover in the source regions of the Yangtze and Yellow Rivers in China between 1960 and 1999
 420 Journal of Glaciology, Vol. 53, No. 182, 2007 Variations of snow cover in the source regions of the Yangtze and Yellow Rivers in China between 1960 and 1999 YANG Jianping, DING Yongjian, LIU Shiyin,
Table 1-2. TMY3 data header (line 2) 1-68 Data field name and units (abbreviation or mnemonic)
 1-68 Data field name and units (abbreviation or mnemonic)") 1.4 TMY3 Data Format The format for the TMY3 data is radically different from the TMY and TMY2 data.. The older TMY data sets used columnar or positional formats, presumably as a method of optimizing data
1.4 TMY3 Data Format The format for the TMY3 data is radically different from the TMY and TMY2 data.. The older TMY data sets used columnar or positional formats, presumably as a method of optimizing data
Impact of aerosol on air temperature in Baghdad
 Journal of Applied and Advanced Research 2017, 2(6): 317 323 http://dx.doi.org/10.21839/jaar.2017.v2i6.112 http://www.phoenixpub.org/journals/index.php/jaar ISSN 2519-9412 / 2017 Phoenix Research Publishers
Uncertain Network Public Sentiment Emergency Decision Model Based on Grey Relational Degree
 Send Orders for Reprints to reprints@benthamscienceae 37 The Open Cybernetics Systemics Journal, 2014,, 37-34 Open Access Uncertain Network Public Sentiment Emergency Decision Model Based on Grey Relational
Role of Arc GIS in developing Real Time and Forecasting Water Resource System ANMOL BHARDWAJ 1, ANIL VYAS 2 1
 Role of Arc GIS in developing Real Time and Forecasting Water Resource System ANMOL BHARDWAJ 1, ANIL VYAS 2 1 Project Associate, Indian Institute of Technology Roorkee 2 ADE National Hydrology Project,
Open Access Cuttings Transport Behavior and Simulation Analysis Affected by Hole Cleaning Tool
 Send Orders for Reprints to reprints@benthamscience.net 64 The Open Petroleum Engineering Journal, 3, 6, 64-68 Open Access Cuttings Transport Behavior and Simulation Analysis Affected by Hole Cleaning
Analysis of Spatial-Temporal Characteristics and Pattern Evolution of Fishery Geographic Agglomeration in China
 2016 International Conference on Education, Management Science and Economics (ICEMSE-16) Analysis of Spatial-Temporal Characteristics and Pattern Evolution of Fishery Geographic Agglomeration in China
Solutions to Comprehensive Final Examination Given on Thursday, 13 December 2001
 Name & Signature Dr. Droegemeier Student ID Meteorology 1004 Introduction to Meteorology Fall, 2001 Solutions to Comprehensive Final Examination Given on Thursday, 13 December 2001 BEFORE YOU BEGIN!! Please
ABSTRACT 3 RADIAL VELOCITY ASSIMILATION IN BJRUC 3.1 ASSIMILATION STRATEGY OF RADIAL
 REAL-TIME RADAR RADIAL VELOCITY ASSIMILATION EXPERIMENTS IN A PRE-OPERATIONAL FRAMEWORK IN NORTH CHINA Min Chen 1 Ming-xuan Chen 1 Shui-yong Fan 1 Hong-li Wang 2 Jenny Sun 2 1 Institute of Urban Meteorology,
1 Introduction. Station Type No. Synoptic/GTS 17 Principal 172 Ordinary 546 Precipitation
 Use of Automatic Weather Stations in Ethiopia Dula Shanko National Meteorological Agency(NMA), Addis Ababa, Ethiopia Phone: +251116639662, Mob +251911208024 Fax +251116625292, Email: Du_shanko@yahoo.com
Accuracy of Meteonorm ( )
") Accuracy of Meteonorm (7.1.6.14035) A detailed look at the model steps and uncertainties 22.10.2015 Jan Remund Contents The atmosphere is a choatic system, not as exactly describable as many technical
Accuracy of Meteonorm (7.1.6.14035) A detailed look at the model steps and uncertainties 22.10.2015 Jan Remund Contents The atmosphere is a choatic system, not as exactly describable as many technical
Analysis of Local Vibration for High-Speed Railway Bridge Based on Finite Element Method
 Send Orders for Reprints to reprints@benthamscience.ae 91 The Open Mechanical Engineering Journal, 214, 8, 91-915 Open Access Analysis of Local Vibration for High-Speed Railway Bridge Based on Finite Element
Implementation of CLIMAP and GIS for Mapping the Climatic Dataset of Northern Iraq
 Implementation of CLIMAP and GIS for Mapping the Climatic Dataset of Northern Iraq Sabah Hussein Ali University of Mosul/Remote sensing Center KEYWORDS: CLIMAP, GIS, DEM, Climatic, IRAQ ABSTRACT The main
Chapter-1 Introduction
 Modeling of rainfall variability and drought assessment in Sabarmati basin, Gujarat, India Chapter-1 Introduction 1.1 General Many researchers had studied variability of rainfall at spatial as well as
Chapter 5: Weather. Only Section 1: What is Weather?
 Chapter 5: Weather Only Section 1: What is Weather? Find the definitions of: Meteorology, meteorologist, weather, climate Not in book? Use the dictionaries **Meteorology - Meteorology is the study of the
Guided Notes: Atmosphere Layers of the Atmosphere
 Guided Notes: Atmosphere Layers of the Atmosphere Atmosphere: Absorbs solar radiation, Burns up meteors, transports and recycles water, and other chemicals, and moderates climate Main Components: o Meteorology
NOTES AND CORRESPONDENCE. Seasonal Variation of the Diurnal Cycle of Rainfall in Southern Contiguous China
 6036 J O U R N A L O F C L I M A T E VOLUME 21 NOTES AND CORRESPONDENCE Seasonal Variation of the Diurnal Cycle of Rainfall in Southern Contiguous China JIAN LI LaSW, Chinese Academy of Meteorological
The WegenerNet observing weather and climate at 1 km-scale resolution: a new look at convective precipitation and other local-scale processes
 The WegenerNet observing weather and climate at 1 km-scale resolution: a new look at convective precipitation and other local-scale processes G. Kirchengast, T. Kabas, A. Leuprecht, C. Stieb, and C. Bichler
A Hybrid ARIMA and Neural Network Model to Forecast Particulate. Matter Concentration in Changsha, China
 A Hybrid ARIMA and Neural Network Model to Forecast Particulate Matter Concentration in Changsha, China Guangxing He 1, Qihong Deng 2* 1 School of Energy Science and Engineering, Central South University,
GIS-based Meteorological Data Processing Technology for Forest Fire Danger Rating Forecast System of China
 Jour. Korean For. Soc. Vol. 99, No. 2, pp. 197~203 (2010) JOURNAL OF KOREAN FOREST SOCIETY GIS-based Meteorological Data Processing Technology for Forest Fire Danger Rating Forecast System of China Yinghui