A Fresh Spin on Tornado Occurrence and Intensity in Ontario
|
|
|
- Mervyn Jones
- 5 years ago
- Views:
Transcription


1 A Fresh Spin on Tornado Occurrence and Intensity in Ontario David Sills Cloud Physics and Severe Weather Research Section Environment Canada, Toronto, Canada Neil Taylor 2012 GLOM Workshop March, Chicago, IL
2 Outline Some fresh definitions Updated Ontario database Updated Canadian database and synthesized tornado data Future work VORTEX-2

3 Fresh Tornado- Related Definitions How fresh? Lemony fresh!
4 What is a tornado? From the AMS Glossary of Meteorology (circa 2010): Tornado A violently rotating column of air, in contact with the ground, either pendant from a cumuliform cloud or underneath a cumuliform cloud, and often (but not always) visible as a funnel cloud.
5 What is a tornado? From the AMS Glossary of Meteorology (circa 2011): Tornado A violently rotating column of air, in contact with the ground surface, either pendant from a cumuliform cloud or underneath a cumuliform cloud, and often (but not always) visible as a funnel cloud.
6 What is a tornado? From the AMS Glossary of Meteorology (circa 2011): Tornado A violently rotating column of air, in contact with the surface, pendant from a cumuliform cloud, and often (but not always) visible as a funnel cloud. Includes waterspouts Excludes dust devils and gustnadoes
7 What is a funnel cloud? From the AMS Glossary of Meteorology (circa 2005): Funnel cloud A funnel-shaped cloud of condensation, usually extending from a deep convective cloud, and associated with a violently rotating column of air that is not in contact with the ground (hence not a tornado).
8 What is a funnel cloud? From the AMS Glossary of Meteorology (circa 2005): Funnel cloud A funnel-shaped cloud of condensation, usually extending from a deep convective cloud, and associated with a violently rotating column of air that is not in contact with the ground (hence not a tornado).
9 What is a funnel cloud? From the AMS Glossary of Meteorology (circa 2006): Funnel cloud A condensation cloud, typically funnel-shaped and extending outward from a cumuliform cloud, associated with a rotating column of air (a vortex) that may or may not be in contact with the ground. If the rotation is violent and in contact with the ground, the vortex is a tornado.
10 What is a funnel cloud? From the AMS Glossary of Meteorology (circa 2011): Funnel cloud A condensation cloud, typically funnel-shaped and extending outward from a cumuliform cloud, associated with a rotating column of air (a vortex) that may or may not be in contact with the ground surface. If the rotation is violent and in contact with the ground surface, the vortex is a tornado.
11 What is a funnel cloud? From the AMS Glossary of Meteorology (circa 2011): Funnel cloud A condensation cloud, typically funnel-shaped and extending outward from a cumuliform cloud, associated with a rotating column of air (a vortex) that may or may not be in contact with the surface. If the rotation is violent and in contact with the surface, the vortex is a tornado. - Now fully consistent with new tornado definition
12 Updated Ontario Tornado Database
 Extended to 1992 by variety of others")
13 First Cdn Tornado Database Mike Newark of EC began assembling Ontario tornado database in 1970s Expanded to all of Canada Published Canadian tornado climatology (Newark, 1984) Extended to 1992 by variety of others
 Developed Tornado Classification decision tree to enhance consistency when classifying: confirmed, probable, or")
14 Tornadoes in Ontario Project TOP project started in 2003 with goal to improve quality of tornado database (Sills et al. 2004) Developed Tornado Classification decision tree to enhance consistency when classifying: confirmed, probable, or possible
15 Tornadoes in Ontario Project Developed Wind Damage Rating Table using work of Fujita, Newark, Grazulis, and EC experiences More consistency when rating tornadoes on Fujita scale
16 Tornadoes in Ontario Project Re-invigorated damage survey program to ensure high-quality data coming in to database (annual training, large network) Created new tornado data from 1993 to 2011 Revisited all significant events before 1993 (F2+, long tracks, out of season, etc.) Added hundreds of historic events before 1918, going back to 1792!
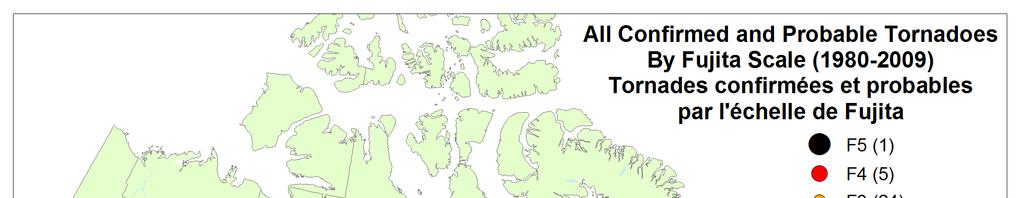
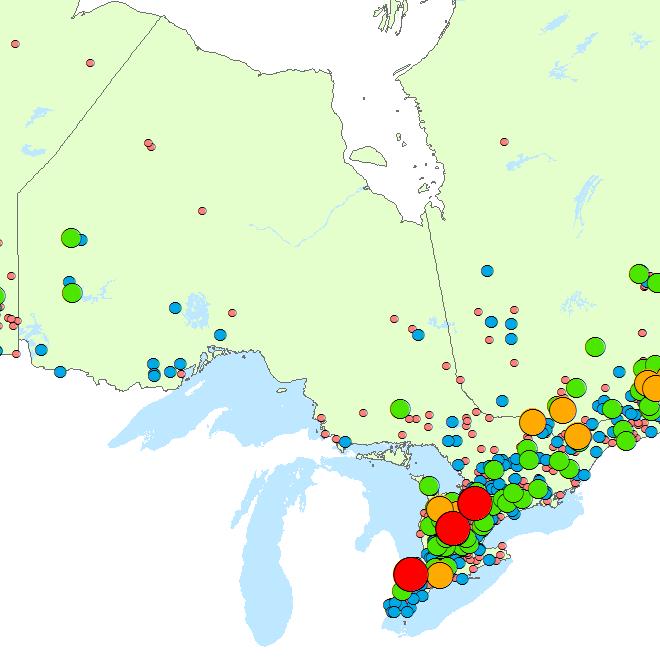
17 Total 1695 Confirmed 532 Probable 394 Possible 670 Unclassified 99 TOP Results
18 2011 Goderich F3 Tornadoes rare in lake shadow regions Lake-breeze fronts in SW gradient flow
19 By Month Tornadoes by Month Confirmed and Probable Number Jan Feb Mar Apr May Jun Jul Aug Sep Oct Nov Dec Month July is peak month
20 By Local Hour Tornadoes by Local Hour Confirmed and Probable Number Time Period Late afternoon is peak period
21 By Fujita Rating F-scale Frequency Confirmed and Probable 1% 3% 18% F4 46% F3 F2 F1 32% F0 * An F5 tornado has never been officially recorded in Ontario Strong and violent tornadoes only 22%
 F0 F1 F2 F3 F4")
22 TOP Data Quality Log-linear plot of US and Ontario tornado data normalized to 100 F2s with F2-F4 slope shown (after Brooks and Doswell, 2001) F0 F1 F2 F3 F4 F5
23 Ontario tornado stats Number of tornadoes Tornado Occurrence in Ontario Confirmed Probable Possible Year Ontario has an average of 9 confirmed, 4 probable and 10 possible tornadoes per year using the dataset. Using just confirmed and probable, that is 13 tornadoes per year average. There is an average of 7 tornado days per year using just confirmed and probable tornadoes. Last F4 31 May 1985
24 Updated Canadian Database and Synthesized Tornado Data
25 Background Tornado resilience measures written into National Building Code of Canada in 1995 based on forensic studies of Barrie / Grand Valley F4 tornadoes of 1985 Measures include anchors in manufactured and permanent structures, masonry ties in permanent structures (schools, hospitals, auditoriums) Relatively inexpensive for new buildings BUT implementation required clear definition of tornado-prone regions of Canada Definition could not be developed until recently
26 Objective Needed to build an updated 30-year national database Last database by Newark , so this one Five regions all with their own databases, needed to be merged Needed a methodology to fill known gaps in data Under-reporting in rural / remote areas Any inconsistencies between regions

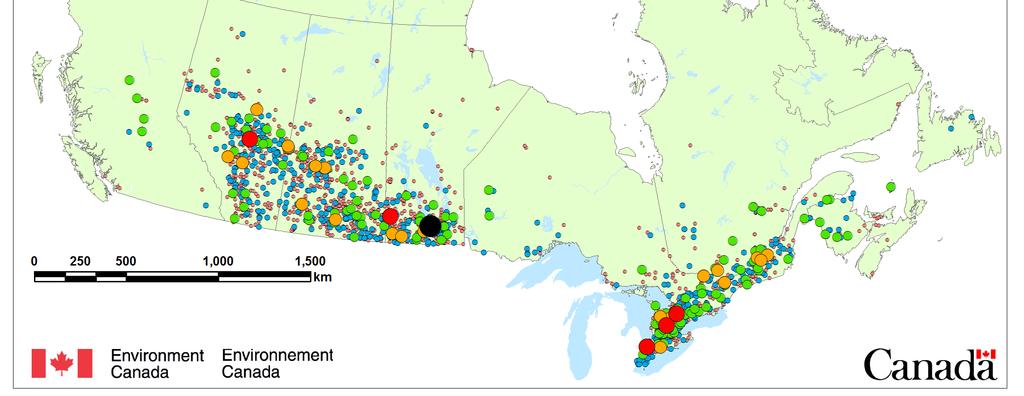
27 ~70 tornadoes/yr reported across Canada Canadian Tornadoes
28 Statistical Approach Use new lightning flash density climatology to model tornado incidence, but use a population density mask to adjust for population bias In high population areas, use observed tornado count Otherwise, true tornado count is modeled as a Poisson regression with lightning flash density as predictor, and weighted by population density

29 Canada & U.S. F0-F5 tornado occurrence ( ) on 50-km grid
30 Probability of detection weighting mask based on population density (2001 census) on 50 km grid POD=1 for 6 persons / km 2
 on 50 km grid")
31 Lightning flash density (flashes/km2/year) on 50 km grid CLDN

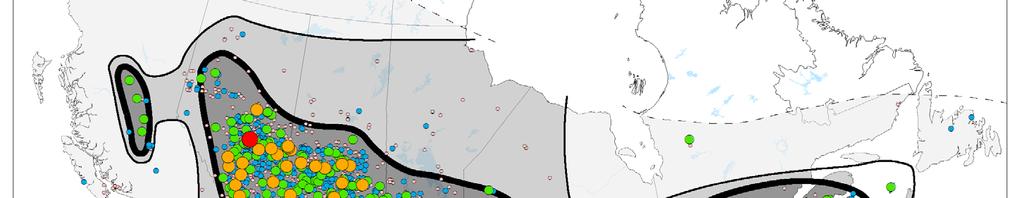
32 ~250 tornadoes/yr modelled across Canada! Resulting tornado density on 50 km grid
33 Partitioning by F-scale Use F2-F4 slope relationship (Brooks and Doswell, 2001) for Ontario and modelled tornado counts to partition by F-scale rating Canadian Tornadoes for Number of Tornadoes (Per 100 F2's) National Atlantic Prairie BC+YK ON QB 1.00 F0 F1 F2 F3 F4 F5 Fujita Scale Ranking Assumption: all areas of Canada have similar F2-F4 slope
34 Tornado-Prone Definitions 1. Prone to Significant Tornadoes Probability of an F2-F5 tornado is estimated to exceed 10-5 / km 2 / year. F0-F1 tornadoes will be more frequent. 2. Prone to Tornadoes Probability of an F0-F1 tornado is estimated to exceed 10-5 / km 2 / year. 3. Tornadoes Observed - Rare Tornadoes observed, but probability of a tornado is between 10-5 /km 2 /year and 10-6 /km 2 /year. (threshold of 10-5 / km 2 / year consistent with engineering literature)


35 F1
36 Future Work
37 Future Work Continue with analysis of both databases and get work written up in journal papers Extend modelling to all of North America Adopt EF-scale in Canada have already done parallel evaluation and have recommended implementation 2013? working on improving damage indicators with wind engineers at Western University
38 Acknowledgements Heather Auld, Joan Klaassen, Vincent Cheng, Brad Rousseau, Patrick McCarthy, Lesley Elliott, James Waller, Simon Eng, Mark Shephard, Sharon Stone
39 References Brooks, H. E., and C. A. Doswell III, 2001: Some aspects of the international climatology of tornadoes by damage classification. Atmos. Res., 56, Fujita, T.T., 1981: Tornadoes and downbursts in the context of generalized planetary scales. J. Atmos. Sci., 38, Newark, M. J., 1984: Canadian Tornadoes, Atmos.- Ocean, 22, Sills, D. M. L, S. J. Scriver and P. W. S. King, 2004: The Tornadoes in Ontario Project (TOP). Preprints, 22nd AMS Conference on Severe Local Storms, Hyannis, MA, Amer. Meteorol. Soc., CD-ROM Paper 7B.5.
40 VORTEX-2


41 VORTEX2 in Fully mobile experiment with ~50 mobile measurements platforms roaming US Great Plains Measurement platforms: 10 mobile radars, mobile mesonet of instrumented vehicles, mobile balloon launchers, StickNet rapid-deploy surface instruments, tornado pods to measure inside tornado, photogrammetry teams


42 VORTEX 2 18 May 2010 Dumas, TX, tornadic supercell
43 Thanks!
USING TORNADO, LIGHTNING AND POPULATION DATA TO IDENTIFY TORNADO PRONE AREAS IN CANADA. Environment Canada, Toronto, Ontario, Canada
 P59 USING TORNADO, LIGHTNING AND POPULATION DATA TO IDENTIFY TORNADO PRONE AREAS IN CANADA David Sills 1a, Vincent Cheng 2*, Patrick McCarthy 3, Brad Rousseau 2*, James Waller 2*, Lesley Elliott 2*, Joan
60 THE NORTHERN TORNADOES PROJECT OVERVIEW AND INITIAL RESULTS
 60 THE NORTHERN TORNADOES PROJECT OVERVIEW AND INITIAL RESULTS David Sills 1*, Gregory A. Kopp 2, Emilio Hong 2, Joanne Kennell 2, Aaron Jaffe 2, and Lesley Elliott 2 1 Meteorological Research Division,
16B.6 IMPLEMENTATION AND APPLICATION OF THE EF-SCALE IN CANADA. Meteorological Service of Canada, EC, Winnipeg, MB 3
 16B.6 IMPLEMENTATION AND APPLICATION OF THE EF-SCALE IN CANADA David M. L. Sills 1*, Patrick J. McCarthy 2 and Gregory A. Kopp 3 1 Cloud Physics and Severe Weather Research Section, Environment Canada,
Tornado Frequency and its Large-Scale Environments Over Ontario, Canada
 256 The Open Atmospheric Science Journal, 2008, 2, 256-260 Open Access Tornado Frequency and its Large-Scale Environments Over Ontario, Canada Zuohao Cao *,1 and Huaqing Cai 2 1 Meteorological Service
7B.5 THE TORNADOES IN ONTARIO PROJECT (TOP)
") 7B.5 THE TORADOES I OTARIO PROJECT (TOP) David M. L. Sills*, Sarah J. Scriver and Patrick W. S. King Cloud Physics and Severe Weather Research Division, Meteorological Service of Canada, Toronto, Ontario,
7B.5 THE TORADOES I OTARIO PROJECT (TOP) David M. L. Sills*, Sarah J. Scriver and Patrick W. S. King Cloud Physics and Severe Weather Research Division, Meteorological Service of Canada, Toronto, Ontario,
5.0 WHAT IS THE FUTURE ( ) WEATHER EXPECTED TO BE?
 WEATHER EXPECTED TO BE?") 5.0 WHAT IS THE FUTURE (2040-2049) WEATHER EXPECTED TO BE? This chapter presents some illustrative results for one station, Pearson Airport, extracted from the hour-by-hour simulations of the future period
5.0 WHAT IS THE FUTURE (2040-2049) WEATHER EXPECTED TO BE? This chapter presents some illustrative results for one station, Pearson Airport, extracted from the hour-by-hour simulations of the future period
Tornado Hazard Risk Analysis: A Report for Rutherford County Emergency Management Agency
 Tornado Hazard Risk Analysis: A Report for Rutherford County Emergency Management Agency by Middle Tennessee State University Faculty Lisa Bloomer, Curtis Church, James Henry, Ahmad Khansari, Tom Nolan,
GAMINGRE 8/1/ of 7
 FYE 09/30/92 JULY 92 0.00 254,550.00 0.00 0 0 0 0 0 0 0 0 0 254,550.00 0.00 0.00 0.00 0.00 254,550.00 AUG 10,616,710.31 5,299.95 845,656.83 84,565.68 61,084.86 23,480.82 339,734.73 135,893.89 67,946.95
Severe Thunderstorm Forecasting and Climatology in Arizona. Ken Drozd Warning Coordination Meteorologist NOAA/NWS Tucson, AZ
 Severe Thunderstorm Forecasting and Climatology in Arizona Ken Drozd Warning Coordination Meteorologist NOAA/NWS Tucson, AZ THUNDERSTORM FORMATION All thunderstorms result from the same necessary conditions
Life Cycle of Convective Systems over Western Colombia
 Life Cycle of Convective Systems over Western Colombia Meiry Sakamoto Uiversidade de São Paulo, São Paulo, Brazil Colombia Life Cycle of Convective Systems over Western Colombia Convective System (CS)
icast: A Severe Thunderstorm Forecasting, Nowcasting and Alerting Prototype Focused on Optimization of the Human-Machine Mix
 icast: A Severe Thunderstorm Forecasting, Nowcasting and Alerting Prototype Focused on Optimization of the Human-Machine Mix 1Cloud Physics and Severe Weather Research Section, Toronto, ON 2Meteorological
A COMPREHENSIVE 5-YEAR SEVERE STORM ENVIRONMENT CLIMATOLOGY FOR THE CONTINENTAL UNITED STATES 3. RESULTS
 16A.4 A COMPREHENSIVE 5-YEAR SEVERE STORM ENVIRONMENT CLIMATOLOGY FOR THE CONTINENTAL UNITED STATES Russell S. Schneider 1 and Andrew R. Dean 1,2 1 DOC/NOAA/NWS/NCEP Storm Prediction Center 2 OU-NOAA Cooperative
Severe Ice Storm Risks in Ontario
 Severe Ice Storm Risks in Ontario Heather Auld Joan Klaassen M Geast, S Cheng, E Ros, R Lee Meteorological Service of Canada Environment Canada-Ontario Region Ice Storm 98 Canada s most costly ($) weather
Extremes Seminar: Tornadoes
 Dec. 01, 2014 Outline Introduction 1 Introduction 2 3 4 Introduction 101: What is a tornado? According to the Glossary of Meteorology (AMS 2000), a tornado is a violently rotating column of air, pendant
Adaptation by Design: The Impact of the Changing Climate on Infrastructure
 Adaptation by Design: The Impact of the Changing Climate on Infrastructure Heather Auld, J Klaassen, S Fernandez, S Eng, S Cheng, D MacIver, N Comer Adaptation and Impacts Research Division Environment
Thunderstorms. Ordinary Cell Thunderstorms. Ordinary Cell Thunderstorms. Ordinary Cell Thunderstorms 5/2/11
 A storm containing lightning and thunder; convective storms Chapter 14 Severe thunderstorms: At least one: large hail wind gusts greater than or equal to 50 kt Tornado 1 2 Ordinary Cell Ordinary Cell AKA
Hail and the Climate System: Large Scale Environment Relationships for the Continental United States
 Hail and the Climate System: Large Scale Environment Relationships for the Continental United States 1979-2012 John T. Allen jallen@iri.columbia.edu Co-author: Michael K. Tippett WWOSC 2014, Thursday August
Tornadoes. tornado: a violently rotating column of air
 Tornadoes tornado: a violently rotating column of air Tornadoes What is the typical size of a tornado? What are typical wind speeds for a tornado? Five-stage life cycle of a tornado Dust Swirl Stage Tornado
ENGINE SERIAL NUMBERS
 ENGINE SERIAL NUMBERS The engine number was also the serial number of the car. Engines were numbered when they were completed, and for the most part went into a chassis within a day or so. However, some
Your Task: Read each slide then use the underlined red or underlined information to fill in your organizer.
 Severe Weather: Tornadoes and Hurricanes Thunderstorms and Lightning S6E4 d. Construct an explanation of the relationship between air pressure, weather fronts, and air masses and meteorological events
YACT (Yet Another Climate Tool)? The SPI Explorer
? The SPI Explorer") YACT (Yet Another Climate Tool)? The SPI Explorer Mike Crimmins Assoc. Professor/Extension Specialist Dept. of Soil, Water, & Environmental Science The University of Arizona Yes, another climate tool for
YACT (Yet Another Climate Tool)? The SPI Explorer Mike Crimmins Assoc. Professor/Extension Specialist Dept. of Soil, Water, & Environmental Science The University of Arizona Yes, another climate tool for
Synoptic and mesoscale analysis of waterspouts in the Adriatic ( preliminary climatology)
") Synoptic and mesoscale analysis of waterspouts in the Adriatic (2001-2011 preliminary climatology) Josipa Kuzmić 1, Tanja Renko 1, Nataša Strelec Mahović 1 1 Meteorological and Hydrological Service of
Synoptic and mesoscale analysis of waterspouts in the Adriatic (2001-2011 preliminary climatology) Josipa Kuzmić 1, Tanja Renko 1, Nataša Strelec Mahović 1 1 Meteorological and Hydrological Service of
Temporal Trends in Forest Fire Season Length
 Temporal Trends in Forest Fire Season Length Alisha Albert-Green aalbertg@sfu.ca Department of Statistics and Actuarial Science Simon Fraser University Stochastic Modelling of Forest Dynamics Webinar March
Early Period Reanalysis of Ocean Winds and Waves
 Early Period Reanalysis of Ocean Winds and Waves Andrew T. Cox and Vincent J. Cardone Oceanweather Inc. Cos Cob, CT Val R. Swail Climate Research Branch, Meteorological Service of Canada Downsview, Ontario,
Foundations of Earth Science, 6e Lutgens, Tarbuck, & Tasa
 Foundations of Earth Science, 6e Lutgens, Tarbuck, & Tasa Weather Patterns and Severe Weather Foundations, 6e - Chapter 14 Stan Hatfield Southwestern Illinois College Air masses Characteristics Large body
Convective downbursts are known to produce potentially hazardous weather
 Investigation of Convective Downburst Hazards to Marine Transportation Mason, Derek Thomas Jefferson High School for Science and Technology Alexandria, VA Abstract Convective downbursts are known to produce
Colorado s 2003 Moisture Outlook
 Colorado s 2003 Moisture Outlook Nolan Doesken and Roger Pielke, Sr. Colorado Climate Center Prepared by Tara Green and Odie Bliss http://climate.atmos.colostate.edu How we got into this drought! Fort
Section 10: Tornadoes
 Contents Section 10: Tornadoes Why Tornadoes Are a Threat...10-1 Hazard Profile...10-4 History of Tornadoes...10-5 People and Property at Risk... 10-13 Potential Damages and Losses... 10-14 Why Tornadoes
Section 13-1: Thunderstorms
 Section 13-1: Thunderstorms Chapter 13 Main Idea: The intensity and duration of thunderstorms depend on the local conditions that create them. Air-mass thunderstorm Mountain thunderstorm Sea-breeze thunderstorm
COMPARISON OF HINDCAST RESULTS AND EXTREME VALUE ESTIMATES FOR WAVE CONDITIONS IN THE HIBERNIA AREA GRAND BANKS OF NEWFOUNDLAND
 COMPARISON OF HINDCAST RESULTS AND EXTREME VALUE ESTIMATES FOR WAVE CONDITIONS IN THE HIBERNIA AREA GRAND BANKS OF NEWFOUNDLAND E. P. Berek 1, V. J. Cardone 2, and V. R. Swail 3 1 Metocean, Coastal, and
Quantification of energy losses caused by blade icing and the development of an Icing Loss Climatology
 Quantification of energy losses caused by blade icing and the development of an Icing Loss Climatology Using SCADA data from Scandinavian wind farms Staffan Lindahl Winterwind 201 1 SAFER, SMARTER, GREENER
Climatography of the United States No
 Month (1) Min (2) Month(1) Extremes Lowest (2) Temperature ( F) Lowest Month(1) Degree s (1) Base Temp 65 Heating Cooling 100 Number of s (3) Jan 63.9 39.3 51.6 86 1976 16 56.6 1986 20 1976 2 47.5 1973
Climatography of the United States No
 Temperature ( F) Month (1) Min (2) Month(1) Extremes Lowest (2) Lowest Month(1) Degree s (1) Base Temp 65 Heating Cooling 100 Number of s (3) Jan 32.8 21.7 27.3 62 1918 1 35.8 1983-24 1950 29 10.5 1979
Climate Update. Wendy Ryan and Nolan Doesken Colorado Climate Center. Atmospheric Science Department Colorado State University
 Climate Update Wendy Ryan and Nolan Doesken Colorado Climate Center Atmospheric Science Department Colorado State University Presented to Water Availability Task Force June 26, 2008 Denver, CO Prepared
Tornadoes. Be able to define what a tornado is. Be able to list several facts about tornadoes.
 Tornadoes Be able to define what a tornado is. Be able to list several facts about tornadoes. 1. Where do tornadoes most U.S. is # 1 occur in the world? Tornadoes are most common in Tornado Alley. Tornado
Changing Hydrology under a Changing Climate for a Coastal Plain Watershed
 Changing Hydrology under a Changing Climate for a Coastal Plain Watershed David Bosch USDA-ARS, Tifton, GA Jeff Arnold ARS Temple, TX and Peter Allen Baylor University, TX SEWRU Objectives 1. Project changes
Associa'on of U.S. tornado counts with the large- scale environment on monthly 'me- scales
 Associa'on of U.S. tornado counts with the large- scale environment on monthly 'me- scales Michael K. Tippe? 1, Adam H. Sobel 2,3 and Suzana J. Camargo 3 1 Interna)onal Research Ins)tute for Climate and
Climatography of the United States No
 Climate Division: AK 5 NWS Call Sign: ANC Month (1) Min (2) Month(1) Extremes Lowest (2) Temperature ( F) Lowest Month(1) Degree s (1) Base Temp 65 Heating Cooling 90 Number of s (3) Jan 22.2 9.3 15.8
Climatography of the United States No
 Climate Division: CA 4 NWS Call Sign: Month (1) Min (2) Month(1) Extremes Lowest (2) Temperature ( F) Lowest Month(1) Degree s (1) Base Temp 65 Heating Cooling 100 Number of s (3) Jan 55.6 39.3 47.5 77
Climatography of the United States No
 Climate Division: CA 5 NWS Call Sign: Month (1) Min (2) Month(1) Extremes Lowest (2) Temperature ( F) Lowest Month(1) Degree s (1) Base Temp 65 Heating Cooling 100 Number of s (3) Jan 56.6 36.5 46.6 81
Climatography of the United States No
 Climate Division: CA 1 NWS Call Sign: Month (1) Min (2) Month(1) Extremes Lowest (2) Temperature ( F) Lowest Month(1) Degree s (1) Base Temp 65 Heating Cooling 100 Number of s (3) Jan 57.9 38.9 48.4 85
Climatography of the United States No
 Climate Division: CA 5 NWS Call Sign: Month (1) Min (2) Month(1) Extremes Lowest (2) Temperature ( F) Lowest Month(1) Degree s (1) Base Temp 65 Heating Cooling 100 Number of s (3) Jan 44.8 25.4 35.1 72
Climatography of the United States No
 Climate Division: CA 4 NWS Call Sign: Month (1) Min (2) Month(1) Extremes Lowest (2) Temperature ( F) Lowest Month(1) Degree s (1) Base Temp 65 Heating Cooling 100 Number of s (3) Jan 49.4 37.5 43.5 73
Climatography of the United States No
 Climate Division: CA 6 NWS Call Sign: Month (1) Min (2) Month(1) Extremes Lowest (2) Temperature ( F) Lowest Month(1) Degree s (1) Base Temp 65 Heating Cooling 100 Number of s (3) Jan 69.4 46.6 58.0 92
Climatography of the United States No
 Climate Division: CA 4 NWS Call Sign: Month (1) Min (2) Month(1) Extremes Lowest (2) Temperature ( F) Lowest Month(1) Degree s (1) Base Temp 65 Heating Cooling 1 Number of s (3) Jan 58.5 38.8 48.7 79 1962
Climatography of the United States No
 Climate Division: CA 6 NWS Call Sign: Month (1) Min (2) Month(1) Extremes Lowest (2) Temperature ( F) Lowest Month(1) Degree s (1) Base Temp 65 Heating Cooling 1 Number of s (3) Jan 67.5 42. 54.8 92 1971
Climatography of the United States No
 Climate Division: CA 1 NWS Call Sign: Month (1) Min (2) Month(1) Extremes Lowest (2) Temperature ( F) Lowest Month(1) Degree s (1) Base Temp 65 Heating Cooling 1 Number of s (3) Jan 57.8 39.5 48.7 85 1962
Sierra Weather and Climate Update
 Sierra Weather and Climate Update 2014-15 Kelly Redmond Western Regional Climate Center Desert Research Institute Reno Nevada Yosemite Hydroclimate Workshop Yosemite Valley, 2015 October 8-9 Percent of
Climatography of the United States No
 Climate Division: ND 8 NWS Call Sign: BIS Month (1) Min (2) Month(1) Extremes Lowest (2) Temperature ( F) Lowest Month(1) Degree s (1) Base Temp 65 Heating Cooling 100 Number of s (3) Jan 21.1 -.6 10.2
Climatography of the United States No
 Climate Division: TN 1 NWS Call Sign: Month (1) Min (2) Month(1) Extremes Lowest (2) Temperature ( F) Lowest Month(1) Degree s (1) Base Temp 65 Heating Cooling 100 Number of s (3) Jan 47.6 24.9 36.3 81
Climatography of the United States No
 Climate Division: CA 5 NWS Call Sign: FAT Month (1) Min (2) Month(1) Extremes Lowest (2) Temperature ( F) Lowest Month(1) Degree s (1) Base Temp 65 Heating Cooling 1 Number of s (3) Jan 53.6 38.4 46. 78
Climatography of the United States No
 Climate Division: CA 6 NWS Call Sign: 1L2 N Lon: 118 3W Month (1) Min (2) Month(1) Extremes Lowest (2) Temperature ( F) Lowest Month(1) Degree s (1) Base Temp 65 Heating Cooling 1 Number of s (3) Jan 63.7
Drought Characterization. Examination of Extreme Precipitation Events
 Drought Characterization Examination of Extreme Precipitation Events Extreme Precipitation Events During the Drought For the drought years (1999-2005) daily precipitation data was analyzed to find extreme
Tornado Occurrences. Tornadoes. Tornado Life Cycle 4/12/17
 Chapter 19 Tornadoes Tornado Violently rotating column of air that extends from the base of a thunderstorm to the ground Tornado Statistics Over (100, 1000, 10000) tornadoes reported in the U.S. every
Climatography of the United States No
 Climate Division: CA 5 NWS Call Sign: BFL Month (1) Min (2) Month(1) Extremes Lowest (2) Temperature ( F) Lowest Month(1) Degree s (1) Base Temp 65 Heating Cooling 1 Number of s (3) Jan 56.3 39.3 47.8
The Climate of Oregon Climate Zone 4 Northern Cascades
 /05 E55 Unbound issue No. 9/ is Does not circulate Special Report 916 May 1993 The Climate of Oregon Climate Zone 4 Property of OREGON STATE UNIVERSITY Library Serials Corvallis, OR 97331-4503 Agricultural
Champaign-Urbana 2000 Annual Weather Summary
 Champaign-Urbana 2000 Annual Weather Summary ILLINOIS STATE WATER SURVEY 2204 Griffith Dr. Champaign, IL 61820 wxobsrvr@sws.uiuc.edu Maria Peters, Weather Observer January: January started on a mild note,
The Climate of Marshall County
 The Climate of Marshall County Marshall County is part of the Crosstimbers. This region is a transition region from the Central Great Plains to the more irregular terrain of southeastern Oklahoma. Average
Weather Products for Decision Support Tools Joe Sherry April 10, 2001
 Weather Products for Decision Support Tools Joe Sherry National Convective Weather Forecast (NCWF) Computer generated graphical forecast extending 0-1 hours, updated every 5 minutes Conservative forecast
Champaign-Urbana 2001 Annual Weather Summary
 Champaign-Urbana 2001 Annual Weather Summary ILLINOIS STATE WATER SURVEY 2204 Griffith Dr. Champaign, IL 61820 wxobsrvr@sws.uiuc.edu Maria Peters, Weather Observer January: After a cold and snowy December,
Thunderstorm. Thunderstorms result from the rapid upward movement of warm, moist air.
 Severe Weather Thunderstorm A thunderstorm (aka an electrical storm, a lightning storm, or a thundershower) is a type of storm characterized by the presence of lightning and its acoustic effect, thunder.
Announcements. No office hours tomorrow (Wed. March 30) Homework 5 extra credit:
 Homework 5 extra credit:") Announcements No office hours tomorrow (Wed. March 30) Homework 5 extra credit: Find and plot additional tracks of Hurricane Ivan (after reaching its northeastmost point in U.S) North Dakota Lightning
Announcements No office hours tomorrow (Wed. March 30) Homework 5 extra credit: Find and plot additional tracks of Hurricane Ivan (after reaching its northeastmost point in U.S) North Dakota Lightning
Three main areas of work:
 Task 2: Climate Information 1 Task 2: Climate Information Three main areas of work: Collect historical and projected weather and climate data Conduct storm surge and wave modeling, sea-level rise (SLR)
P7.7 A CLIMATOLOGICAL STUDY OF CLOUD TO GROUND LIGHTNING STRIKES IN THE VICINITY OF KENNEDY SPACE CENTER, FLORIDA
 P7.7 A CLIMATOLOGICAL STUDY OF CLOUD TO GROUND LIGHTNING STRIKES IN THE VICINITY OF KENNEDY SPACE CENTER, FLORIDA K. Lee Burns* Raytheon, Huntsville, Alabama Ryan K. Decker NASA, Marshall Space Flight
Funding provided by NOAA Sectoral Applications Research Project CLIMATE. Basic Climatology Colorado Climate Center
 Funding provided by NOAA Sectoral Applications Research Project CLIMATE Basic Climatology Colorado Climate Center Remember These? Factor 1: Our Energy Source Factor 2: Revolution & Tilt Factor 3: Rotation!
Climatography of the United States No
 Climate Division: TN 3 NWS Call Sign: BNA Month (1) Min (2) Month(1) Extremes Lowest (2) Temperature ( F) Lowest Month(1) Degree s (1) Base Temp 65 Heating Cooling 100 Number of s (3) Jan 45.6 27.9 36.8
Drought in Southeast Colorado
 Drought in Southeast Colorado Nolan Doesken and Roger Pielke, Sr. Colorado Climate Center Prepared by Tara Green and Odie Bliss http://climate.atmos.colostate.edu 1 Historical Perspective on Drought Tourism
Climatography of the United States No
 Climate Division: CA 5 NWS Call Sign: Elevation: 6 Feet Lat: 37 Month (1) Min (2) Month(1) Extremes Lowest (2) Temperature ( F) Lowest Month(1) Degree s (1) Base Temp 65 Heating Cooling 1 Number of s (3)
Climatography of the United States No
 Climate Division: CA 4 NWS Call Sign: Elevation: 2 Feet Lat: 37 Month (1) Min (2) Month(1) Extremes Lowest (2) Temperature ( F) Lowest Month(1) Degree s (1) Base Temp 65 Heating Cooling 1 Number of s (3)
Climatography of the United States No
 Climate Division: CA 4 NWS Call Sign: Elevation: 13 Feet Lat: 36 Month (1) Min (2) Month(1) Extremes Lowest (2) Temperature ( F) Lowest Month(1) Degree s (1) Base Temp 65 Heating Cooling 1 Number of s
Climatography of the United States No
 Climate Division: CA 5 NWS Call Sign: Elevation: 1,14 Feet Lat: 36 Month (1) Min (2) Month(1) Extremes Lowest (2) Temperature ( F) Lowest Month(1) Degree s (1) Base Temp 65 Heating Cooling 1 Number of
A Comparison of Tornado Warning Lead Times with and without NEXRAD Doppler Radar
 MARCH 1996 B I E R I N G E R A N D R A Y 47 A Comparison of Tornado Warning Lead Times with and without NEXRAD Doppler Radar PAUL BIERINGER AND PETER S. RAY Department of Meteorology, The Florida State
US/Global Natural Catastrophe Update
 US/Global Natural Catastrophe Update NAIC's CIPR Symposium on Implications of Increasing Catastrophe Volatility on Insurers Carl Hedde, SVP, Head of Risk Accumulation Munich Reinsurance America, Inc. Source:
MET Lecture 26 Tornadoes I
 MET 4300 Lecture 26 Tornadoes I A Large Tornado approaches Lyndon, Kansas, on May 8, 2003 Outline Definition, life cycle Tornado formation within supercells Tornado formation within nonsupercell thunderstorms
Smoothed Prediction of the Onset of Tree Stem Radius Increase Based on Temperature Patterns
 Smoothed Prediction of the Onset of Tree Stem Radius Increase Based on Temperature Patterns Mikko Korpela 1 Harri Mäkinen 2 Mika Sulkava 1 Pekka Nöjd 2 Jaakko Hollmén 1 1 Helsinki
2003 Moisture Outlook
 2003 Moisture Outlook Nolan Doesken and Roger Pielke, Sr. Colorado Climate Center Prepared by Tara Green and Odie Bliss http://climate.atmos.colostate.edu Through 1999 Through 1999 Fort Collins Total Water
2/27/2015. Big questions. What can we say about causes? Bottom line. Severe Thunderstorms, Tornadoes, and Climate Change: What We Do and Don t Know
 Severe Thunderstorms, Tornadoes, and Climate Change: What We Do and Don t Know Big questions How and why are weather hazards distributed? Are things changing in time and will they? HAROLD BROOKS NOAA/NSSL
Tornadoes. Tornadoes. When do tornadoes occur? Tornado Alley
 Tornadoes Tornadoes Dr. Christopher M. Godfrey University of North Carolina at Asheville Photo: D. Zaras, NOAA A tornado is a violently rotating column of air in contact with the ground Tornadogenesis
Chiang Rai Province CC Threat overview AAS1109 Mekong ARCC
 Chiang Rai Province CC Threat overview AAS1109 Mekong ARCC This threat overview relies on projections of future climate change in the Mekong Basin for the period 2045-2069 compared to a baseline of 1980-2005.
Climatography of the United States No
 Climate Division: CA 6 NWS Call Sign: LAX Elevation: 1 Feet Lat: 33 Month (1) Min (2) Month(1) Extremes Lowest (2) Temperature ( F) Lowest Month(1) Degree s (1) Base Temp 65 Heating Cooling 1 Number of
Climatography of the United States No
 Climate Division: CA 6 NWS Call Sign: TOA Elevation: 11 Feet Lat: 33 2W Temperature ( F) Month (1) Min (2) Month(1) Extremes Lowest (2) Lowest Month(1) Degree s (1) Base Temp 65 Heating Cooling 1 Number
Flooding Performance Indicator Summary. Performance indicator: Flooding impacts on riparian property for Lake Ontario and the Upper St.
 Flooding Performance Indicator Summary Performance indicator: Flooding impacts on riparian property for Lake Ontario and the Upper St. Lawrence River Technical Workgroup: Coastal TWG Research by: Baird
Climate also has a large influence on how local ecosystems have evolved and how we interact with them.
 The Mississippi River in a Changing Climate By Paul Lehman, P.Eng., General Manager Mississippi Valley Conservation (This article originally appeared in the Mississippi Lakes Association s 212 Mississippi
Climatography of the United States No
 No. 2 1971-2 Asheville, North Carolina 2881 COOP ID: 46646 Climate Division: CA 4 NWS Call Sign: 8W Month (1) Min (2) Month(1) Extremes Lowest (2) Temperature ( F) Lowest Month(1) Degree s (1) Base Temp
Climatography of the United States No
 No. 2 1971-2 Asheville, North Carolina 2881 COOP ID: 4792 Climate Division: CA 6 NWS Call Sign: Month (1) Min (2) Month(1) Extremes Lowest (2) Temperature ( F) Lowest Month(1) Degree s (1) Base Temp 65
8.1 Attachment 1: Ambient Weather Conditions at Jervoise Bay, Cockburn Sound
 8.1 Attachment 1: Ambient Weather Conditions at Jervoise Bay, Cockburn Sound Cockburn Sound is 20km south of the Perth-Fremantle area and has two features that are unique along Perth s metropolitan coast
Climatography of the United States No
 Month (1) Min (2) Month(1) Extremes Lowest (2) Temperature ( F) Lowest Month(1) Degree s (1) Base Temp 65 Heating Cooling 100 Number of s (3) 42.6 24.2 33.4 79 1950 25 44.2 1974-16 1994 19 18.8 1977 977
Chapter 21. Weather Patterns and Severe Storms
 Chapter 21 Weather Patterns and Severe Storms 20.1 Air Masses Air Masses and Weather Air Masses An air mass is an immense body of air that is characterized by similar temperatures and amounts of moisture
Are Tornadoes Becoming More Frequent and Severe? By: Matthew Westburg
 Westburg 1 Are Tornadoes Becoming More Frequent and Severe? By: Matthew Westburg 2011 marked the second deadliest tornado season for the U. S., with [about] 1,700 tornadoes and 553 deaths according to
P3.6 THE INFLUENCE OF PNA AND NAO PATTERNS ON TEMPERATURE ANOMALIES IN THE MIDWEST DURING FOUR RECENT El NINO EVENTS: A STATISTICAL STUDY
 P3.6 THE INFLUENCE OF PNA AND NAO PATTERNS ON TEMPERATURE ANOMALIES IN THE MIDWEST DURING FOUR RECENT El NINO EVENTS: A STATISTICAL STUDY Dayton Vincent 2, Sam Lashley 1, Sam O Connor 2, Michael Skipper
Toward the Development of Severe Weather Outlooks. Scott Weaver NOAA Climate Prediction Center
 Toward the Development of Severe Weather Outlooks Scott Weaver NOAA Climate Prediction Center 2011 Tornadoes 6 Events $27.7 Billion 539 Fatalities Community White Paper & NOAA Fact Sheet Advancing the
Supplementary appendix
 Supplementary appendix This appendix formed part of the original submission and has been peer reviewed. We post it as supplied by the authors. Supplement to: Lowe R, Stewart-Ibarra AM, Petrova D, et al.
Climatography of the United States No
 No. 2 1971-2 Asheville, North Carolina 2881 COOP ID: 43417 Climate Division: CA 4 NWS Call Sign: N Lon: 121 Month (1) Min (2) Month(1) Extremes Lowest (2) Temperature ( F) Lowest Month(1) Degree s (1)
Climatography of the United States No
 Month (1) Min (2) Month(1) Extremes Lowest (2) Temperature ( F) Lowest Month(1) Degree s (1) Base Temp 65 Heating Cooling 100 Number of s (3) Jan 54.3 40.1 47.2 75 1998 17 53.0 1995 18 1949 11 41.7 1972
ASSESMENT OF THE SEVERE WEATHER ENVIROMENT IN NORTH AMERICA SIMULATED BY A GLOBAL CLIMATE MODEL
 JP2.9 ASSESMENT OF THE SEVERE WEATHER ENVIROMENT IN NORTH AMERICA SIMULATED BY A GLOBAL CLIMATE MODEL Patrick T. Marsh* and David J. Karoly School of Meteorology, University of Oklahoma, Norman OK and
(Severe) Thunderstorms and Climate HAROLD BROOKS NOAA/NSSL
 Thunderstorms and Climate HAROLD BROOKS NOAA/NSSL") (Severe) Thunderstorms and Climate HAROLD BROOKS NOAA/NSSL HAROLD.BROOKS@NOAA.GOV Big questions How and why are weather hazards distributed? Are things changing in time and will they? Begin with thunderstorm
(Severe) Thunderstorms and Climate HAROLD BROOKS NOAA/NSSL HAROLD.BROOKS@NOAA.GOV Big questions How and why are weather hazards distributed? Are things changing in time and will they? Begin with thunderstorm
Climatography of the United States No
 No. 2 1971-2 Asheville, North Carolina 2881 COOP ID: 4795 Climate Division: CA 6 NWS Call Sign: SBA Month (1) Min (2) Month(1) Extremes Lowest (2) Temperature ( F) Lowest Month(1) Degree s (1) Base Temp
11/19/14. Chapter 11: Hurricanes. The Atmosphere: An Introduction to Meteorology, 12 th. Lutgens Tarbuck
 Chapter 11: Hurricanes The Atmosphere: An Introduction to Meteorology, 12 th Lutgens Tarbuck Lectures by: Heather Gallacher, Cleveland State University! Hurricanes: " Hurricanes are intense centers of
Multivariate Regression Model Results
 Updated: August, 0 Page of Multivariate Regression Model Results 4 5 6 7 8 This exhibit provides the results of the load model forecast discussed in Schedule. Included is the forecast of short term system
Description of Precipitation Retrieval Algorithm For ADEOS II AMSR
 Description of Precipitation Retrieval Algorithm For ADEOS II Guosheng Liu Florida State University 1. Basic Concepts of the Algorithm This algorithm is based on Liu and Curry (1992, 1996), in which the