Canterbury Earthquake Analysis
|
|
|
- Octavia Glenn
- 6 years ago
- Views:
Transcription
1 Canterbury Earthquake Analysis to midnight on Friday October by John Holdaway Contact: Recent Changes: This update includes multiple new graphs and details on atmospheric forces (pages 28-29) and tidal forces (pages 24-28), as well as several new plots for the daily energy release (pages 11-19), amongst other things. Please note I am not a geologist, and that forecasting potential future quakes isn t more than statistical guesswork. Common questions from recent s include: Can we pinpoint quake epicentres to street and house numbers? [Answer on page 20] Do more quakes occur at night or at certain times of the month? [Answer on page 23] Aside: The Recent Quakes list on the GeoNet site is incomplete because it only registers larger and more widely felt quakes. For those interested in obtaining a copy of the same more complete data set that I ve been using to create these graphs, go to the GeoNet Quake Database then use the following limiting parameters: Southern Latitude: Northern Latitude: Western Longitude: Eastern Longitude: This defines a fairly tight fit around the area of the main quake activity, roughly 110 km north-south by 160 km eastwest. You can increase the range if you want to look at quakes further away, or tighten the range further to look at data just from specific areas. Note that you need to set a start date of September 3 to see all the quakes, as the data set is recorded in universal time. Note also that some data for previous days will change as it is updated by GeoNet. Canterbury Quake Magnitudes: We ve had over 2000 quakes! The 1000 th quake occurred in the morning of September 9, and the 2000 th occurred on the morning of October 18. On October 19 we had a magnitude 5.03 aftershock, the largest to hit Canterbury since the first 5 days after the main quake. There have been 2050 quakes and aftershocks of magnitude 2.0+ in the region surrounding Christchurch in the past 48 days, with an average magnitude of 3.06 per quake. Below you can see the general trend of aftershocks decreasing in both amplitude and frequency over time. Over the past 48 days, on average there has been one quake of magnitude 2.0+ every 33 minutes and 43 seconds. While quite frequent, this is definitely down from the 6 minute and 45 second average we had between quakes in the first 3 days. The longest period we went without a quake of magnitude 2.0+ in the past 48 days was 21 hours and 1 minute, which occurred overnight from October 8-9. The shortest period we have experienced between quakes is less than a minute, which occurred on multiple occasions especially in the first few days after the big quake.
2 Equivalent Energy Released from the Quakes: In the graph below you can see the equivalent energy released per quake, as worked out by converting from the magnitude scale into Joules. Note that there is a log scale in the graph below, so a difference of one vertical division corresponds to a tenfold difference in energy, and two divisions means a factor of 100 difference in energy. The initial 7.1 magnitude earthquake released an amazing energy of about 2.8 quadrillion Joules (a quadrillion is a one followed by 15 zeroes) within the first minute or so of shaking. To put that huge number into perspective, that s enough energy to power the entire city of Christchurch for a fortnight; or alternatively, enough to power the town of Darfield for ten years. Unfortunately, of course, there s no way for us to harness this energy for useful purposes although it s a nice thought to be able to funnel all that tectonic energy away from destructive shaking and into two weeks (or ten years) of free power! So where did the energy go? Well apart from shaking us around like crazy, producing a bit of heat via friction, cracking several kilometres of ground, and lifting up sections of ground by a few metres in places, that energy also went into shifting the whole of South Canterbury four metres to the west relative to North Canterbury. Quite an impressive effort! Comparing to other large earthquakes in New Zealand history, the energy released by the Canterbury quake was 40% more than the Inangahua quake of 1968 (magnitude 7.0), 3 times more than the Gisborne quake of 2007 (magnitude 6.8), and 16 times more than the Edgecumbe quake of 1987 (magnitude 6.3). On the other hand, the energy released by the Canterbury quake was 11 times less than the Fiordland quake of 2009 (magnitude 7.8), 16 times less than the Hawkes Bay quake of 1931 (magnitude 7.9), and 45 times less than the largest quake in New Zealand s recorded history the Wairarapa quake of 1855 (magnitude 8.2). We should count ourselves lucky that the Canterbury quake wasn t any more powerful than it was, or else a lot more damage would have been done to the city. In particular, at the university several of the large concrete buildings may have been damaged to the point of requiring demolition if the shaking were much more severe. Aside: Those of you with a scientific or mathematical bent may be interested to know that a simple formula which can be used to calculate the approximate energy of a magnitude 5+ quake (developed by Båth in 1966) is where M is the magnitude of the quake (for example, M = 7.1 for the Canterbury quake). Meanwhile, the formula used to find the relative energy of an aftershock compared to the main quake is where m is the magnitude of the aftershock, and M is as before the magnitude of the main quake.
3 Total Energy in Perspective: The logarithmic scale in the Equivalent Energy Released graph doesn t quite do justice as to just how much more powerful the 7.1 magnitude quake was compared to all the other aftershocks we ve felt over the past few days, even the big ones. So to get this in perspective, I created the simple pie chart above which shows the energy released in the initial 7.1 magnitude quake compared to the energy released in all the other 2049 aftershocks combined, including all the big ones. As you can see, the main quake completely dwarfs all the other aftershocks in terms of energy released all the combined aftershocks represent only a tiny fraction of the total tectonic energy released in the past 48 days. Cumulative Energy Released to Date: This graph displays the same information as the pie chart above, but in terms of a cumulative average over time since the main quake. Steep slopes and steps in this graph correspond to periods of strong and frequent aftershocks, while more shallow slopes correspond to periods of more gentle and less frequent aftershocks. It s clear that since day 4 or 5 the aftershocks have quietened down a lot, which is obviously good news. Aftershock Energy Comparison by Magnitude: Let s now take that tiny sliver for all the combined aftershocks in the pie graph above, and expand it out to see how much each of the different magnitude quakes have been contributing to the total aftershock energy. All in all the 2049 aftershocks so far have released the combined equivalent of about 98 trillion Joules of energy; a large amount, certainly, but still about 30 times less than the energy released by the original magnitude 7.1 quake.

, and the 1914 aftershocks below magnitude 4.")
4 The breakdown of the 98 trillion Joules of aftershock energy released to the present date is shown below. As you might expect, you can see that the larger magnitude aftershocks impart the most energy. The three magnitude 5.0 shocks on October 4, 13 and 19 contributed about 2 trillion Joules of energy each. The 11 aftershocks of magnitude contribute well over half of the total energy released by aftershocks. The 124 magnitude quakes contribute almost all the rest of the energy (more than 30%), and the 1914 aftershocks below magnitude 4.00 hardly contribute anything at all relative to the energy released by the larger aftershocks (barely 9%). Aftershock Energy Comparison by Day: The chart below plots the exact same data as in the above chart (that is, all quakes and aftershocks excluding the main 7.1 magnitude one), but on a daily basis.
5 Aside from the anomalous large aftershocks of October 4 and 13, you can see that in general there is definitely a trend of the energy released in aftershocks dropping off day by day. This is good as it means that the shocks we do get are gradually getting less and less forceful. Almost 45% of the total aftershock energy to date was released on September 4, over 20% was released over September 5-6, and more than 10% was released over September 7-8. The energy released in all aftershocks excluding the three 5.0 ones from September 9 to October 21 combined is less than 15% of the total aftershock energy released since the big quake (that s an average of less than 0.5% per day). So aside from the magnitude 5.0 aftershocks on October 4, 13 and 19, the little jiggles we re getting a couple of times a day really aren t releasing significant amounts of energy compared to the aftershocks in the first 5 days after the main quake. Breakdown of Quakes per Day: In this interesting chart you can see the breakdown of how many earthquakes with which magnitude struck when over the past 48 days. The largest number of quakes of magnitude 2.0+ in a day occurred on September 6 with 310, while the smallest number occurred on October 21 with only 3 quakes of magnitude The spike on September 6 can possibly be traced to more instruments being deployed in the Canterbury area to measure smaller quakes a day or two after the main 7.1 quake in other words, some of the smaller quakes in the first two days may not have been recorded so the numbers are lower than they should be there. October 3 had an unexpected spike in the number of quakes compared to the number expected from the trend, with the largest number of quakes of magnitude 2.0+ being recorded in several weeks. This may have something to do with a build-up to the 5.0 quake of October 4, or it could just be that GeoNet has examined that particular day in much more detail than surrounding days at present. As you can see in the earlier pie chart, the actual energy released in all those extra quakes on October 3 was about the same as (or less than) the energy released in previous days. This is because the majority of the quake numbers on that day were made up of small magnitude quakes (not big jolts). Lately we have been seeing greatly decreased numbers of quakes per day since the first week, although it s possible another small spike in numbers like on October 3 will occur at some point in the near future, especially now that we have had some more reasonably strong aftershocks on October 13 and 19.
6 Because of the scale in the above graph it s hard to see some of the features, so below I have reproduced the same graph split into portions of 1-2 weeks each.
7 Note that the sharp dip towards the end of the last graph may not be real quake numbers tend to be artificially small for recent days while GeoNet works on updating its database. Fascinatingly, there seem to be very different patterns for the different magnitude groups in the charts, especially during the first week. For instance, while the red group seems to have a roughly linearly decreasing trend, the orange group has a sharply decreasing exponential trend, and both blue groups have fairly distinctive bell-shaped curves during the first week. Also interesting is that there is a distinct gap in the yellow data group on day 4, as well as some other large dips and gaps there may be a physical reason for these, or they could just be statistical anomalies. The data for previous days is still being updated with some of the smaller quakes on GeoNet, so the above graph may not include quite all of the quakes (though the great majority of the ones above magnitude 3.0 should be there). We can probably still expect around 10 quakes per day for at least a few more weeks, with an average of 1-2 per day that are large enough to feel as significant jitters. The data over the past few days has been a bit unstable, and as such it is presently difficult to forecast daily quakes. However, the overall trend suggests that: For October 22, there should be about quakes in total, with around 6-9 of magnitude , 4-10 of magnitude , and a >50% chance of a magnitude 4.0+ quake. For October 23, assuming the data sticks to the general trend, there should be approximately 8-18 quakes in total, with around 5-8 of magnitude , 3-9 of magnitude , and a >50% chance of a magnitude 4.0+ quake. Let s see how that forecast turns out. Predictions for previous days based on data from this chart have proved moderately accurate. Note that very large aftershocks (magnitude 5+) are very random in occurrence at present and thus cannot be predicted well although it can be said with a reasonable degree of certainty that we should expect a few more of these larger aftershocks over the next few weeks. (We had three on October 4, 13 and 19, but there are very likely still at least a couple more to come.)

8 Breakdown of Daily Quake Energy Released: In the following chart you can see the estimated energy released per day for the different magnitude quakes displayed. You can see quite clearly that the largest magnitude aftershocks for a particular day give out almost all of the total energy for that day, almost regardless of the number of smaller shocks. This is what is expected for a logarithmic magnitude scale. Comparing this chart with the Quakes Per Day chart before, you can see that days with high total numbers of quakes don t necessarily have higher than average releases of tectonic energy. For instance, the energy released in the 121 aftershocks of September 9 was less than the amount of energy released three days later on September 12 (a day which had only 56 aftershocks), and less than the amount released a week later on September 16 (a day which had only 44 aftershocks). Clearly, it is the magnitude of the larger quakes on a particular day that count for released energy, and not so much the number of smaller quakes. As expected there is a clear step pattern between the different magnitude groups. From the formula which converts magnitudes into energies (mentioned in the aside on page 2), there is about 5.5 times more energy for every 0.5 increase in magnitude and 1000 times more energy for a 2.0 increase in magnitude. Thus, we expect that there should be about three vertical lines of difference on the logarithmic scale between the purple and yellow groups, and indeed this is what we generally observe. Of course, this varies depending on the number of quakes per day in each group. For instance, quite frequently in recent days the light blue group has outdone the green group in terms of energy released. The reason is simply because there are a lot more light blue quakes compared to green quakes on some of these days (e.g. 7 light blue quakes vs 1 green quake on October 8), so the combined energies from the multiple light blue quakes outdo the energies from the fewer green quakes. In general the rule is that you need 6 times more quakes in a lower magnitude group to beat the energy released in a higher magnitude group, since in the average case 6 x 1 > 1 x ~5.5. The scale in the above graph means it s hard to see some of the features, so below I have reproduced the same graph split into several portions of 1-2 weeks each for ease of viewing.


9

10 You can see that during weeks 3-4, we fairly reliably stayed in the 100 billion to 1 trillion Joule range for energy released per day. During weeks 5-7 the values have fluctuated a lot more, with a few peaks (most prominently the magnitude 5.0 aftershocks on October 4, 13 and 19 all over 2 trillion Joules), and a few prolonged dips into the billion Joule range of daily energy release. It seems like the trend for the next week or two is that we ll see more of these prolonged dips as the quakes slowly continue to drop off in intensity and frequency. Energy Released in the Last 43 Days: The following pie chart simply displays part of the same data in the above energy graphs in an easier-to-read format. It shows the breakdown of when the most aftershock energy was released during the past 43 days, as a useful way to compare each new day with the past few days. Note that I excluded September 4-8 from this chart deliberately, because the energies released in those first 5 days dwarf the rest of the data (as you can see in the Aftershock Energy Comparison by Day chart on page 4). The total amount of tectonic energy released in aftershocks over the last 43 days (totalling 100% in the chart) is about 21 trillion Joules, as compared to the 76 trillion Joules released in the first 5 days after the main quake. Of the 21 trillion Joules released in the past 43 days, over 6 trillion Joules was made up by the three aftershocks of magnitude 5.0 on October 4, 13 and 19. These quakes together released a comparable amount of energy to the entire previous 3-4 weeks of aftershocks combined. Aside from that anomaly, although we ve had a few magnitude quakes over the past few weeks, those days overall have still had a fairly average amount of tectonic energy released compared to other days. October 21 holds the current record for the lowest amount of energy released in quakes per day since September 4, with only 5.5 billion Joules released on that day. This was likely just a statistical anomaly, but it s still a good trend to be seeing a lot more of these days with very low energy release. The largest amount of daily energy released in the past six weeks was on October 19, with over 2.4 trillion Joules in total.

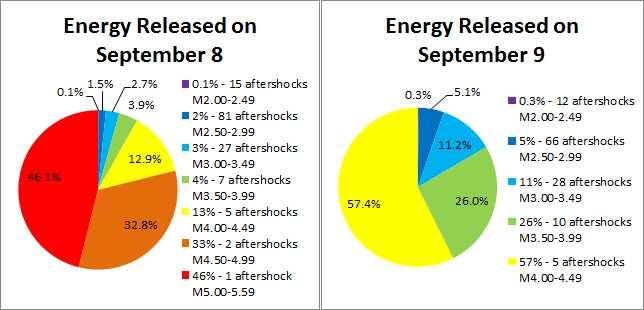
11 Daily Breakdown of Aftershock Energy Released: Let s now take the quakes for every individual day since September 4 blow them up into their own graphs to see how much energy the different magnitude quakes have been imparting. All the graphs in the next few pages show a fairly typical distribution of daily energy released over the different magnitude groups. On September 18 the two strongest aftershocks contributed over 80% of the total energy release for the day by themselves, on September 23 the single strongest aftershock accounted for over 85% of the daily energy release by itself, and on both October 4 and 13 the 5.0 magnitude aftershocks accounted for 95% of the daily energy release. This is a fairly normal trend, as usually the strongest 1-2 aftershocks on any given day will account for 60-90% of the total tectonic energy released that day due to the logarithmic magnitude scale. All graphs list the number of aftershocks in each magnitude range per day for reference purposes. If a certain magnitude range is missing on a graph, it means that there was a lack of quakes in that particular range of magnitudes on that particular day. All graphs have been updated to data available from the GeoNet database at midnight on October 22. A table with the energy released on each day (totalling 100% in each chart) is displayed below. Each of the following graphs can be compared with a number on the table to calculate the exact values for the energy released in aftershocks of a certain magnitude range.
12 Day (2010) Aftershock Energy Released (billions of Joules) Day (2010) Aftershock Energy Released (billions of Joules) September 4 42,200 September 5 8,600 September 6 13,200 September 7 7,700 September 8 4,700 September 9 1,000 September September September 12 1,200 September September September September 16 1,300 September September September September September September September September September September September September September September October October October 3 76 October 4 2,200 October October October October October 9 15 October October October October 13 2,000 October October October October October October 19 2,400 October October


13


14


15


16

17

18


19 Aside from a few odd exceptions, we have generally been seeing a lot less orange and red in the charts compared to the early days after the main quake, which means that we re now getting far fewer quakes of magnitude Instead for the most part we ve been seeing more green/blue in the pie charts lately, which is a good trend and shows that the relative magnitudes of quakes each day are gradually dying down at present, even if there are still a few odd stronger aftershocks. Canterbury Quake Positions: Here you can see the positions of quakes of magnitude 2.0+ relative to the city of Christchurch since the main magnitude 7.1 quake on September 4. For the first few days after the main quake most of the aftershocks were confined to the west of the city, but after a few more days they started spreading to the east, and we had a couple with epicentres located very near to or even within the city, as well as towards the coastline. Luckily none of the particularly big quakes have been located directly under the city or out under the sea (yet!), so there have been no issues with tsunamis.
20 Epicentres lately seem to have a general trend of spreading back to the southwest again, although the positions are all still very widely distributed. The average epicentre for quakes in Canterbury since the magnitude 7.1 shock of September 4 can be worked out to be 27.5 km west and 4.7 km south of the central city of Christchurch. This average epicentre is not moving significantly on a daily basis: in other words, there is no apparent drift in average quake positions over time, either towards or away from the city of Christchurch. I have received a number of enquiries as to how accurately quake epicentre positions can be determined, and whether they can be pinpointed to occurring under specific streets and house numbers (as seems to be the case in some sites using Google Maps). It s important to remember that because there are only a limited number of instruments measuring the quakes, any reported measurement of a quake s position is going to be an estimated average calculated from several different instruments in the area, thus there is always a certain inherent uncertainty. The average uncertainty in an epicentre position measurement, as calculated from the data, is about kilometres. Even the best case estimates have an inherent uncertainty of at least a few hundred metres (usually quakes in areas with a higher density of measuring instruments), while the worst case estimates have uncertainties of tens of kilometres (usually quakes in areas not as well covered by instruments). Thus, any quake position markers on any websites especially those going down to the street and house level should be taken as approximate estimates, not as exact values. Incidentally, this is also why some sites might record slightly different positions for the same quakes. Canterbury Quake Depths: The vast majority of the epicentres for quakes of magnitude 2.0+ have been located less than 20 km from the surface, with the current average depth of quakes well under 10 km (7.07 km to be precise) below the surface. Bear in mind that measurements of quake depths are usually uncertain to at least a couple of hundred metres, and sometimes tens of kilometres. The deepest measured quake of magnitude 2.0+ has been 33.0 km below the surface (which was recently downgraded from a previous estimate of 50 km), and the shallowest has been less than a few hundred metres below the surface. A large part of the reason that the main quake and many of the aftershocks did the amount of damage that they did was because of the relative shallowness of the quakes. There presently does not seem to be any overall pattern in the depths of the quakes over time; most are still remaining in the 1-20 km range daily. Null Time Between Quakes: Plotting the time interval between consecutive quakes of magnitude 2.0+ originally revealed a rather interesting pattern, which may or may not have had any physical
21 significance. The pattern vaguely resembled a series of rope bridges in the lengths of time between the main peaks in the graph. The data used to create the original graph was however incomplete; with the incorporation of the more complete data set, the pattern has changed a bit. While there still seems to be a vague hint of some sort of pattern in the more complete data set, it s unfortunately nowhere near as clear as it was with the previous data set. One thing that is definitely clear, though, is that overall the average amount of time between consecutive quakes is generally decreasing with time (that is, quakes are getting less frequent) which is obviously good news. Another thing that you can see from this chart is that after the first few days of data, there is a general trend of (a) long time interval, (b) shorter time interval, (c) shortest time interval, (d) long time interval again. This can probably be linked directly to the geological forces going on, i.e. (a) first release of stress built up after several hours, (b) and (c) several quick subsequent releases of stress over a few minutes triggered by (a), (d) build-up of stress for another few hours until the next release, and the circle continues. Or at least that s my guess as a non-geologist. In any event, it seems that in almost all cases after a particularly long wait between quakes, it is much more likely that once one eventually strikes there will be several more occurring in succession over the course of the following 2-3 hours. Short and Long Term Forecasts: I ve had a bit of fun fitting various different trend lines to the data to see what they forecast for the future. Some seem reasonable, and others less so. Interestingly, linear and exponential fits originally predicted we should be back to normal background levels of quakes within a few weeks, while power and logarithmic fits predicted that it would be at least two months before we were back to normal background levels. With the incorporation of the new data set, both the linear and exponential fits have now converged towards the longer end of the scale. The last few weeks of data in particular has suggested that the power and logarithmic fits are more accurate, which would agree with data from recent similar magnitude quakes around the world (such as Baja and Haiti earlier in 2010). Other countries recently experiencing quakes of similar magnitude have typically reported at least 2-3 months rather than a couple of weeks for significant aftershocks to die down so we are probably still be in for a bit of a rough ride for a while to come in Canterbury, unfortunately.
.")

22 Predicting Large Aftershocks: There s obviously an interest in being able to predict when the next large aftershock might occur, and what follows is my attempt at a guess. In the graph below, the red line plots the time difference between consecutive large aftershocks, while the blue line shows the corresponding magnitude of each large aftershock (all magnitude 4.3+). There is a vaguely exponential trend, although the data is extremely random and hard to fit. Note that I varied the definition of a large aftershock with time to reflect the gradually decreasing overall magnitudes of all quakes: specifically, quakes of magnitude 4.9+ were counted on September 4-5, aftershocks with magnitudes 4.5+ were counted on September 6-8, and shocks with magnitudes 4.3+ have been counted from September 9 onwards. I found this graph actually worked quite well for predicting large aftershocks during the first 3 or so days, as there was a more predictable pattern in the first 67 hours after the main quake. During these first few days it was usually possible to predict the next large aftershock (of magnitude 5+ at the time) to within an hour or two. However, as you can see, after day 3 (point number 11 in the
 without an aftershock of magnitude 4.3 or above.")
23 graph) the pattern becomes far more chaotic and random, meaning that it becomes extremely difficult to predict large aftershocks with much accuracy at all. In the chart you can see that since the initial 7.1 quake over two weeks ago, we have never gone more than five and a half days (132 hours) without an aftershock of magnitude 4.3 or above. So it can still be predicted with a reasonable degree of confidence that we should continue to get at least one large (magnitude 4.3+) aftershock every 2-5 days for the next few weeks. It s not unlikely that a few of those large aftershocks may be as large as magnitude (that s in addition to the magnitude 5.0 shocks we had on October 4, 13 and 19). Magnitude 6+ quakes are far less likely to occur, and are becoming progressively less likely as time goes on. The last large (M4.3+) aftershock occurred at 7.30pm on Wednesday evening (October 20). The graph above suggests that the next large aftershock may be due to occur sometime on Friday or Saturday this week. However, this in no way guarantees we ll see another large quake in that period, as the statistical issues with making guesses from such a small data set mean it s incredibly difficult to make any kind of predictions with any degree of certainty. The current randomness in the data is simply too great to make accurate forecasts of large quakes at present. Time of Day for Large Aftershocks: A number of people have expressed interest in whether we ve been experiencing a lot more large aftershocks during the evening or nighttime than during the day. The following graph proves that there is no significant statistical difference between the number of aftershocks between night and day, which is expected. The total number of aftershocks of magnitude 4.3 or above occurring from 6.00am-5.59pm during the day is 36, while the total number occurring from 6.00pm-5.59am during the night is 33 almost exactly the same. The total number occurring in the noon-11.59pm period (25) is a bit less than the number occurring in the midnight-11.59am period (44), but this is influenced quite a lot by the time of day that the main 7.1 shock occurred. Specifically, 15 of the large aftershocks in the graph above occurred from midnight-11.59am on September 4, while only 8 occurred from noon-11.59pm on September 4 because the frequency of large aftershocks was already dying down by that point. This next graph omits the more frequent aftershocks in the first 5 days after the main quake, and only looks at the more random and chaotic aftershocks since that time. As you can see, the numbers of large aftershocks occurring during the different parts of the day are still not particularly skewed
24 towards any interval. If anything, we are having more large quakes in the morning than in the evening. However, the numbers we are looking at here are so small that they are not really of much statistical significance. So in general, the specific time of day should not have any particular correlation to when large aftershocks occur (with the exception of swarms after a very large quake). It is worth noting that there is probably a bias towards feeling larger aftershocks more at night, because people are generally more relaxed and consequently more sensitive to disruption during this time. On the other hand, during the day while you are busy doing other things, large aftershocks can sometimes occur without you noticing. This is especially notable when you are in a car, as sometimes you will not even notice that a fairly large aftershock is occurring unless you re listening to someone on the radio at the time (as I personally experienced recently). Time of the Month for Aftershocks: It s also worth pointing out that the time of the month should not have any significant correlation to when large aftershocks occur either, despite the misconception that s out there. I m aware that there has been at least one person in the news claiming that the position of the Moon may have affected the quakes in Canterbury, but that seems to be a fairly tenuous assumption, unsupported by much of the scientific evidence at present. While it s true that the Moon (and Sun) exert small forces on the surface of the Earth depending on their relative orientation, these forces do not seem to be strong enough to significantly influence the exact hour or day that any particular quake will occur on. The fact is that large earthquakes are fairly unpredictable and as far as can be told at present pretty much equally likely to occur at any time of any month. There will always be some phase and some position of the Moon at the time of any given earthquake (just like for any other natural disaster), but there s certainly no statistically significant scientific evidence to suggest that matching this data up has much use in predicting future events. That said, a few plots of variations in the Earth tidal forces at Christchurch due to the Sun/Moon system against aftershock numbers and energies do show some interesting trends. These plots are displayed over the next few pages. Credit for the acceleration data used to create the following intriguing plots goes to Geoff Hitchcox.
.")
. The graph below displays the tidal forces on the Earth near Christchurch since September 4 2010 due to the Sun/Moon system.")
25 Firstly, a quick note about what the numbers here mean: the unit used in all the the graphs below is a microgal. One gal is approximately equal to 0.1% the strength of gravity on Earth, so 100 microgals is approximately equal to % the force of gravity. This is obviously a fairly small number, but it is what you might expect (i.e. you don t notice gravity on Earth getting significantly stronger or weaker during different times of the month or year due to the Moon or Sun). In the graphs, positive numbers in microgal correspond to a slight downward force on the Earth near Christchurch (i.e. a compression), while negative numbers in microgal correspond to a slight upward force on the Earth near Christchurch (i.e. an expansion). The graph below displays the tidal forces on the Earth near Christchurch since September due to the Sun/Moon system. There is quite a clear pattern of interfering sinusoids, with the most prominent ~24 hour cycle caused by the Earth s rotation, the 2-4 week cycle due to the Moon s orbit, and smaller effects due to the combined Sun/Moon positioning. There does not seem to be an obvious correlation between quake numbers and tidal forces on the daily averaging scale, as you can see below. There also does not seem to be an apparent relationship between the daily energy released in quakes and the tidal forces from the Sun and Moon, as you can see in the next graph.
.")

26 Plotting the aftershock energies for individual quakes against the tidal forces from the Sun/Moon system also shows no apparent trend, apart from a slightly denser region of quakes in the microgal range, and a few scattered higher energy quakes (not in large enough numbers to reach any conclusions statistically). Plotting the same data, but instead binning the number of quakes which occur in each 10 microgal interval reveals something which initially appears more interesting. More quakes seem to occur when the Earth near Christchurch is being compressed from the combined Sun-Moon tidal force, specifically in the microgal range. Oddly though, no similar spike in quake numbers is seen in the negative microgal range, when the Earth is being stretched (expanded) in the opposite direction.

27 There reason for this discrepancy is that the above graph simply does not take into account the time interval that each bin actually corresponds to. In the plots of the tidal forces over time earlier, you can see quite clearly that the tidal force spends more time in the positive microgal range than the negative microgal range. Thus, what we re really seeing here is just a consequence of more quakes occurring when we allow a larger time interval for them to occur in, as you can see below. This pattern mirrors the earlier pattern, showing that the apparent greater number of quakes in the microgal range is just an artefact of the number of minutes contained in each bin. However, we can fairly easily correct our earlier graph by normalising the quake numbers relative to the time interval that each bin corresponds to. The following graph effectively shows what the quake numbers might be if all the bins were of equal length (approximately 29 hours per bin in this case). There seems to be a bit of distortion towards the edges due to dividing by low numbers there in the normalisation process, but generally the graph seems a lot smoother than the previous one. From this graph, excluding the potentially distorted edges, we can see that there is no apparent trend in normalised quake numbers across pretty much the entire range of tidal forces. In other words, we have discovered what was originally expected: that there seems to be no significant effect on quake numbers due to relative positions of the Sun and the Moon. Some scientific papers suggest that there might be a small (~0.5%) increase in quake numbers for small quakes due to tidal forces from the Sun and Moon. However, even if this is the case, it only suggests 5 out of every 1000 quakes might be triggered by tidal forces not really a significant number. Additionally, this minor

28 trend does not apply to large quakes and aftershocks (magnitude 4-5 or above), which are much more random and do not seem to be influenced much (or at all) by tidal forces. Effects from the Atmosphere on Aftershocks: This has been requested by a few people. Below you can see plots comparing the atmospheric pressure to the daily quake numbers since September Note that the pressure readings are taken from Christchurch airport; obviously the pressure at ground level varies over 10s of kilometres, but these values still serve as a good rough estimate. Daily average atmospheric pressure is represented by the solid blue line, while daily maximum and minimum atmospheric pressure values are shown by the dotted blue lines. Quake numbers per day are displayed in black. As you can see, there is no obvious trend whatsoever between atmospheric pressure and quake numbers. It s also worth noting that the main quake of September 4 occurred when there was a very normal atmospheric pressure (1011 hpa) at neither the high nor low extremes of pressure variation. It seems fairly probable that atmospheric pressure has no significant link to quake numbers. We can also test whether there is any significant effect on quake energies (i.e. large magnitude quakes) due to atmospheric pressure. A comparison can be seen in the graph below. While there are some very vague sections of overlap between higher pressure and higher quake energies, it is not at all a consistent trend. Thus, there does not appear to be any useful link between atmospheric

29 pressure and expected quake magnitudes. The larger quakes seem to be more a function of randomness than atmospheric pressure. Aside: For those interested, data for tidal forces can be obtained here. Data for atmospheric pressure is located here. Shortfall in Energy Released to Date: It appears that there is a discrepancy in the amount of energy released since the main Canterbury quake in comparison to other recent quakes of similar magnitude around the world, which suggests the possibility that several strong aftershocks may still be yet to come. For instance, a comparison of our recent quake with the 7.0 magnitude Haiti earthquake of 12 January 2010 and the following aftershocks reveals a startling apparent shortfall of energy release to date in the Canterbury quake. While the Haiti quake followed the reasonably standard geological rule of thumb of its strongest aftershock being about 1 order of magnitude lower than the main quake, no equivalently large aftershocks have occurred in Canterbury yet. The pattern of magnitude 4.0+ aftershocks in the first 18 days after the Haiti quake can be seen in the graph below (data is courtesy of the United States Geological Survey (USGS) website). Comparing instead to the 7.2 magnitude Baja California earthquake of 4 April 2010 results in less of an apparent energy shortfall, but still suggests that a stronger aftershock may be yet to come. The strongest aftershock for the Baja quake was magnitude 5.7 which occurred 2.5 months after the main quake. The pattern of magnitude 4.0+ aftershocks for the Baja quake is shown below (again
30 the data is courtesy of the USGS website). Not shown on this graph are (to the end of September) 1598 quakes of magnitude , 9344 quakes of magnitude , 5785 quakes of magnitude , and 1059 quakes of magnitude There were 3704 quakes of magnitude 2.0+ in the first 25 days alone after the Baja quake, and there have been at least quakes of magnitude 0.0+ in the 6 months since the Baja quake. (Geologists in California are able to measure down to much lower magnitudes because of much greater instrument numbers.) So the comparitively small number of magnitude 2.0+ aftershocks we ve had here in Canterbury to date certainly isn t any kind of record. Aside: For those of you interested in checking the data for these quakes out for yourselves, raw data for the Baja earthquake as used in this analysis can be obtained from this link using the following parameters (all others defaults): Start Date: Minimum Magnitude: 4.0 Southern Latitude: 31.2 Northern Latitude: 33.5 Western Longitude: Eastern Longitude: Raw data as used in this analysis for the Haiti earthquake can be obtained from this link. Comparisons to the Canterbury Quake: In the first 12 days after the Haiti quake, the United States Geological Survey (USGS) reported that there had been 52 aftershocks of magnitude 4.5 or greater. In comparison, over the longer period of 48 days since the Canterbury quake we have had barely half that number only 36 aftershocks of magnitude 4.5 or greater. Also, there were 12 magnitude 5+ aftershocks recorded in the first 9 hours after the main quake in Haiti (and 15 in the first 18 days), while the number of magnitude 5+ aftershocks in Canterbury over a month after the main quake is only 11. In addition, three of the Haiti aftershocks were at or close to magnitude 6 (exact magnitudes 5.8, 5.9 and 6.0 respectively), while the highest magnitude aftershocks in Canterbury to date have only been magnitudes 5.6, 5.4 and 5.3 (that s about 8-12 times less energy for each aftershock comparitively). As a result, comparing the relative energy releases from aftershocks for the two quakes reveals about a factor of 3 discrepancy (10.9% for Haiti vs 3.2% for Canterbury). On the other hand though, the Baja quakes followed a different pattern. In that particular case, a much greater proportion of the energy was contained in the main quake, with only 2.7% of the total energy being released in all magnitude 4.0+ aftershocks combined to the end of September (3.1% including magnitude quakes). Baja recorded 25 magnitude 4.5+ quakes in the first month
 aftershocks many months after the")

31 after its main quake, similar to Canterbury s 30 of magnitude 4.5+ in the same period. However, the Baja quake did have a few strong (magnitude 5+) aftershocks many months after the main quake. A graphical comparison of these three quakes is shown above. The left side of the graphs display pie charts showing the total energy released by each of the main quakes compared to the combined
32 aftershocks of magnitude 4.0+ that followed. The right side displays exactly the same data, except in terms of a cumulative sum over time; steep slopes in these graphs correspond to frequent and strong aftershocks containing a lot of energy, while shallow slopes correspond to periods of more gentle and spread out aftershocks. The total energy released in magnitude 4.0+ aftershocks over the first 18 days in the Haiti quake was about 245 trillion Joules, while the amount released in magnitude 4.0+ aftershocks to date from the Canterbury quake has only been 88 trillion Joules about a third of the Haiti amount. The total energy released in the first 18 days of aftershocks from the Baja quake was about 67 trillion Joules, with a further 58 trillion Joules released over the rest of the 6 months to date. If we are to assume that the Canterbury aftershocks will release even half as much energy relative to the main quake as the Haiti aftershocks, then we still have a worrying ~100 trillion Joule shortfall of energy yet to be released. This amount of missing energy would roughly correspond to either four magnitude 5.6 quakes, two magnitude 5.8 quakes, or one magnitude 6.0 quake. However, on the other hand, if we are to assume that the Canterbury aftershocks will release a similar amount of relative energy that the Baja aftershocks did, then we might expect that a lot of the energy has been released already, leaving us with perhaps a couple more low 5 magnitude quakes in the near future and nothing more. Estimated Minimum Energy Shortfall: Of course, every pattern of aftershocks is different, especially in entirely separate geographic regions, so it s possible we ll fare more luckily here than they did in Haiti and won t get such large aftershocks or more luckily than Baja and not get large aftershocks several months after the event. However, even with a fairly conservative estimate, there still seems to be a small but significant shortfall of energy yet to be released by larger quakes, as you can see in the graph below. To create this graph, I assumed that rather than the equivalent energy of a magnitude 6.0 aftershock being released all at once in a single 6.0 aftershock, the energy is instead being released in smaller chunks in larger numbers of the magnitude 5+ aftershocks we ve had so far here in Canterbury. Even in the best of circumstances, calculations seem to show that we should still have a few of those magnitude 5+ aftershocks to go before things finally settle down. The reason is because under this particular assumption, the magnitude 5+ quakes to date haven t quite released enough energy to make up for the lack of a magnitude 6.0 quake yet.


33 The 11 magnitude 5+ quakes so far in Canterbury have released a total of 55 trillion Joules of energy, while the energy of a single 6.0 quake would be 63 trillion Joules. So according to this conservative estimate, there should still be at least 8 trillion Joules of energy still to be released, which would correspond roughly to four magnitude 5.0 quakes, two magnitude 5.2 quakes, or one magnitude 5.4 quake. It s also possible a larger number of magnitude 4-5 quakes could potentially make up the shortfall, although there would have to be quite a few of them. Either way, that s my guess as to the minimum energy likely to be released over the coming weeks and months. Estimated Maximum Energy Shortfall: Assuming that we are still set to get a fairly large quake of around magnitude 6.0 in the next few weeks (perhaps a in combination with a few more magnitude quakes), the energy shortfall could be a dozen times larger, closer to 65 trillion Joules. In this scenario, we would be experiencing several more powerful aftershocks of magnitude 5-6 in the coming weeks and months. Using this assumption, the graph above predicts that the energy released in the aftershocks to date here in Canterbury (98 trillion Joules) will end up being a bit over half the value of the total energy that ends up being released over the next few months. As a point of interest, the above maximum energy shortfall predicted would correspond closely to the situation that has been seen with the Baja earthquake, where the amount of energy released by aftershocks in the first month after the main quake ended up being roughly two thirds of the total amount of energy released to date. For comparison, the total breakdown of energy released in all aftershocks in Baja to the end of September 2010 (totalling 125 trillion Joules) can be seen below.
34 It seems fairly likely that the actual missing energy yet to be released in Canterbury will turn out to be somewhere in-between the minimum and maximum estimates made above. That is, we might expect between ~4 and ~15-20 quakes of magnitude 5.0+ to come, depending on the magnitude of each quake. It s not really possible to define an exact upper limit on potential aftershock magnitudes for certain, but it can be said with a reasonable degree of confidence that anything larger than a seems very unlikely to occur at present. However, of course, nothing s completely certain when it comes to quake prediction in the present day, so there s also a possibility that the aftershocks could become steady at a very low level over the next few weeks and months without giving us any more really big jolts of magnitude 5+. That would certainly be the optimum situation for all of us, but it wouldn t necessarily be the norm for the aftermath of a quake of this magnitude. In the end, it simply comes down to the fact that we ll have to wait and see what happens before we can be absolutely sure of anything. Disclaimer: The GeoNet project is core funded by the Earthquake Commission (EQC) to facilitate improved detection and understanding of geological hazards. The GeoNet website is designed, installed and operated by GNS Science under the GeoNet project. All reasonable endeavours are made to ensure the accuracy of the information on the GeoNet website. However, as there is uncertainty inherent in information concerning geohazards, especially as regards any prediction of future events, the information on the GeoNet website is provided without warranties of any kind including accuracy, completeness, timeliness or fitness for any particular purpose. GNS Science and EQC exclude to the full extent permitted by law liability for any loss, damage or expense, direct or indirect, and however caused, whether through negligence or otherwise, resulting from any person or organisation's use of, or reliance on, the information provided on the GeoNet website. Under the GeoNet project the information on the GeoNet website is made freely available to the public and may be used subject to these terms. Look for more recent updates to this document on the University of Canterbury Physics homepage. Have questions or comments, or want access to data or high-res graphs? Feel free to contact me. john.holdaway@pg.canterbury.ac.nz
Magnitude 6.3 SOUTH ISLAND OF NEW ZEALAND
 A magnitude 6.3 earthquake shook the southern New Zealand city of Christchurch. At least 100 people are reported dead, and there are reports of collapsed buildings, cracked streets and flooding due to
Earthquakes. Copyright 2006 InstructorWeb
 Earthquakes Earthquakes cause the earth to shake! Earthquakes are caused by a fault line under the earth's crust. You do not have to be right under a fault line to feel an earthquake. You could be miles
PHYSICS 15a, Fall 2006 SPEED OF SOUND LAB Due: Tuesday, November 14
 PHYSICS 15a, Fall 2006 SPEED OF SOUND LAB Due: Tuesday, November 14 GENERAL INFO The goal of this lab is to determine the speed of sound in air, by making measurements and taking into consideration the
DIFFERENTIAL EQUATIONS
 DIFFERENTIAL EQUATIONS Basic Concepts Paul Dawkins Table of Contents Preface... Basic Concepts... 1 Introduction... 1 Definitions... Direction Fields... 8 Final Thoughts...19 007 Paul Dawkins i http://tutorial.math.lamar.edu/terms.aspx
Q25: Record the wavelength of each colored line according to the scale given.
 C. Measurement Errors and Uncertainties The term "error" signifies a deviation of the result from some "true" value. Often in science, we cannot know what the true value is, and we can only determine estimates
Analysis of the 500 mb height fields and waves: testing Rossby wave theory
 Analysis of the 500 mb height fields and waves: testing Rossby wave theory Jeffrey D. Duda, Suzanne Morris, Michelle Werness, and Benjamin H. McNeill Department of Geologic and Atmospheric Sciences, Iowa
Slide 1: Earthquake sequence (with colour coding around big events and subsequent period). Illustrates migration to the east initially into
. Illustrates migration to the east initially into") Slide 1: Earthquake sequence (with colour coding around big events and subsequent period). Illustrates migration to the east initially into Christchurch, but now moving away (23 December in particular).
Slide 1: Earthquake sequence (with colour coding around big events and subsequent period). Illustrates migration to the east initially into Christchurch, but now moving away (23 December in particular).
An Analysis of 500 hpa Height Fields and Zonal Wind: Examination of the Rossby Wave Theory
 An Analysis of 500 hpa Height Fields and Zonal Wind: Examination of the Rossby Wave Theory Justin Hayward, Chris MacIntosh, Katherine Meinig Department of Geologic and Atmospheric Sciences, Iowa State
Earth & Beyond Teacher Newsletter
 Paul Floyd s Astronomy & Space Website Earth & Beyond Teacher Newsletter www.nightskyonline.info Earth & Beyond Teaching opportunities for 2012 This special edition has been prepared to assist you with
ADDITIONAL RESOURCES. Duration of resource: 30 Minutes. Year of Production: Stock code: VEA Resource written by: Andrew Clarke BA Dip Tchg
 ADDITIONAL RESOURCES The destructive and unexpected nature of earthquakes has remained a constant threat since civilisation began. Suitable for all secondary audiences, this two-part program firstly examines
Earthquakes in Ohio? Teacher Directions and Lesson
 Earthquakes in Ohio? Teacher Directions and Lesson If I say, earthquake what state do you think of? Answers will vary, but California is a likely answer. What if I asked you, Where could you live in the
Please bring the task to your first physics lesson and hand it to the teacher.
 Pre-enrolment task for 2014 entry Physics Why do I need to complete a pre-enrolment task? This bridging pack serves a number of purposes. It gives you practice in some of the important skills you will
Here s what a weak El Nino usually brings to the nation with temperatures:
 Time again for my annual Winter Weather Outlook. Here's just a small part of the items I considered this year and how I think they will play out with our winter of 2018-2019. El Nino / La Nina: When looking
Quadratic Equations Part I
 Quadratic Equations Part I Before proceeding with this section we should note that the topic of solving quadratic equations will be covered in two sections. This is done for the benefit of those viewing
Winter. Here s what a weak La Nina usually brings to the nation with tempseraures:
 2017-2018 Winter Time again for my annual Winter Weather Outlook. Here's just a small part of the items I considered this year and how I think they will play out with our winter of 2017-2018. El Nino /
Deep Algebra Projects: Algebra 1 / Algebra 2 Go with the Flow
 Deep Algebra Projects: Algebra 1 / Algebra 2 Go with the Flow Topics Solving systems of linear equations (numerically and algebraically) Dependent and independent systems of equations; free variables Mathematical
What causes the tides in the ocean?
 What causes the tides in the ocean? By NASA and NOAA, adapted by Newsela staff on 02.09.17 Word Count 686 Level 830L Flying gulls on Morro Strand State Beach, California, at low tide. Morro Rock is seen
Descriptive Statistics (And a little bit on rounding and significant digits)
") Descriptive Statistics (And a little bit on rounding and significant digits) Now that we know what our data look like, we d like to be able to describe it numerically. In other words, how can we represent
Descriptive Statistics (And a little bit on rounding and significant digits) Now that we know what our data look like, we d like to be able to describe it numerically. In other words, how can we represent
1 Measurement Uncertainties
 1 Measurement Uncertainties (Adapted stolen, really from work by Amin Jaziri) 1.1 Introduction No measurement can be perfectly certain. No measuring device is infinitely sensitive or infinitely precise.
Period Analysis on a Spreadsheet
 Aliases in Depth An alias for a period is another period where the data seemingly fits as well, or nearly so, as the correct period. The most common encounter with aliasing is when you observe a target
Magnitude 6.9 GULF OF CALIFORNIA
 A pair of strong earthquakes struck off the coast of Mexico early Thursday only minutes apart. The magnitude 6.9 and 6.2 were centered about 85 miles northeast of Guerrero Negro in the Mexican state of
The beginnings of physics
 The beginnings of physics Astronomy 101 Syracuse University, Fall 2018 Walter Freeman October 9, 2018 Astronomy 101 The beginnings of physics October 9, 2018 1 / 28 Announcements No office hours this week
Learning Critical Thinking Through Astronomy: Observing A Stick s Shadow 1
 ity n tiv io s Ac r e Ve pl t m en Sa ud St Learning Critical Thinking Through Astronomy: Observing A Stick s Shadow 1 Joe Heafner heafnerj@gmail.com 2017-09-13 STUDENT NOTE PLEASE DO NOT DISTRIBUTE THIS
Mondo Quake in Pacific Northwest? By Leander Kahney
 Introduction to College Reading D Natural Disasters: Earthquake NAME I. Pre-reading. Discuss the following topics with other students at your table. What countries or regions of the world have earthquakes?
Examples and Explanations for a Flat Earth 16/10/2006 Andy Roff
 Why do we believe the Earth is a sphere? You ve been told this by your teachers and parents since you were small, but have you really got any proof? Can you prove by sound reasoning and factual evidence
Full Moon. Phases of the Moon
 Phases of the Moon The Moon takes 29.5 days to orbit Earth. This is a lunar month. The gravity of the Earth keeps the Moon in orbit. The Moon does not produce light. We see the Moon because it reflects
Hurricane Dennis menaces U.S. coast
 www.breaking News English.com Ready-to-use ESL / EFL Lessons Hurricane Dennis menaces U.S. coast URL: http://www.breakingnewsenglish.com/0507/050711-dennis-e.html Today s contents The Article 2 Warm-ups
June If you want, you may scan your assignment and convert it to a.pdf file and it to me.
 Summer Assignment Pre-Calculus Honors June 2016 Dear Student: This assignment is a mandatory part of the Pre-Calculus Honors course. Students who do not complete the assignment will be placed in the regular
Tsunami waves swept away houses and cars in northern Japan and pushed ships aground.
 Japan was struck by a magnitude 8.9 earthquake off its northeastern coast Friday. This is one of the largest earthquakes that Japan has ever experienced. In downtown Tokyo, large buildings shook violently
MA554 Assessment 1 Cosets and Lagrange s theorem
 MA554 Assessment 1 Cosets and Lagrange s theorem These are notes on cosets and Lagrange s theorem; they go over some material from the lectures again, and they have some new material it is all examinable,
MITOCW ocw-18_02-f07-lec02_220k
 MITOCW ocw-18_02-f07-lec02_220k The following content is provided under a Creative Commons license. Your support will help MIT OpenCourseWare continue to offer high quality educational resources for free.
Solutions to Lab Exercise #2: Solar Radiation & Temperature Part II: Exploring & Interpreting Data
 METR 104: Our Dynamic Weather (w/lab) Solutions to Lab Exercise #2: Solar Radiation & Temperature Part II: Exploring & Interpreting Data (10 points) Dr. Dave Dempsey Dept. of Geosciences SFSU, Spring 2013
How to Use This Presentation
 How to Use This Presentation To View the presentation as a slideshow with effects select View on the menu bar and click on Slide Show. To advance through the presentation, click the right-arrow key or
Systematic Uncertainty Max Bean John Jay College of Criminal Justice, Physics Program
 Systematic Uncertainty Max Bean John Jay College of Criminal Justice, Physics Program When we perform an experiment, there are several reasons why the data we collect will tend to differ from the actual
Author: Seth Stein, William Deering Professor of Earth & Planetary Sciences, Northwestern University. Background for Calais & Stein paper
 Background for Calais & Stein paper The GPS data reported here are important for understanding earthquakes in the central U.S. Large (magnitude 7) earthquakes on the New Madrid Fault system shook the Midwest
Physics 8 Wednesday, September 30, 2015
 Physics 8 Wednesday, September 30, 2015 You ve recently read Chapter 8 ( force ), Chapter 9 ( work ), and Chapter 10 ( motion in a plane ). In the coming weeks, class/hw will fall a bit behind the reading.
TheFourierTransformAndItsApplications-Lecture28
 TheFourierTransformAndItsApplications-Lecture28 Instructor (Brad Osgood):All right. Let me remind you of the exam information as I said last time. I also sent out an announcement to the class this morning
Astronomy 1143: Assignment 2, Solutions
 Astronomy 1143: Assignment 2, Solutions Part I: Some Short Questions (a) Shorter wavelength photons have higher energy. From highest energy to lowest, the order is: X-ray, ultraviolet, blue visible, orange
Part I Electrostatics. 1: Charge and Coulomb s Law July 6, 2008
 Part I Electrostatics 1: Charge and Coulomb s Law July 6, 2008 1.1 What is Electric Charge? 1.1.1 History Before 1600CE, very little was known about electric properties of materials, or anything to do
Exemplar for Internal Achievement Standard. Mathematics and Statistics Level 3
 Exemplar for internal assessment resource Mathematics and Statistics for Achievement Standard 91580 Exemplar for Internal Achievement Standard Mathematics and Statistics Level 3 This exemplar supports
Bell s spaceship paradox
 Bell s spaceship paradox If the two ships start accelerating at the same time, I always see them travelling at the same velocity, and keeping a constant distance... But I said the objects get shorter when
Predicting AGI: What can we say when we know so little?
 Predicting AGI: What can we say when we know so little? Fallenstein, Benja Mennen, Alex December 2, 2013 (Working Paper) 1 Time to taxi Our situation now looks fairly similar to our situation 20 years
[Disclaimer: This is not a complete list of everything you need to know, just some of the topics that gave people difficulty.]
![[Disclaimer: This is not a complete list of everything you need to know, just some of the topics that gave people difficulty.]](/thumbs/82/86615903.jpg "[Disclaimer: This is not a complete list of everything you need to know, just some of the topics that gave people difficulty.]") Math 43 Review Notes [Disclaimer: This is not a complete list of everything you need to know, just some of the topics that gave people difficulty Dot Product If v (v, v, v 3 and w (w, w, w 3, then the
Math 43 Review Notes [Disclaimer: This is not a complete list of everything you need to know, just some of the topics that gave people difficulty Dot Product If v (v, v, v 3 and w (w, w, w 3, then the
PHAS 1511: Foundations of Astronomy
 PHAS 1511: Foundations of Astronomy Dr Roger Wesson Research interests: deaths of stars. Planetary nebulae, novae and supernovae. Astronomy: some maths You can see that distances in astronomy are huge.
As the light approached Rogne, it gradually became weaker and disappeared within a few seconds - as when a lamp is dimming down.
 We are home after spending the Easter holidays in Hessdalen. We feel like writing down some of our experiences. My wife and I arrived in Hessdalen at noon, Wednesday, March 28th. We d rented a cabin on
The Reasons for the Seasons. By Allegra Dickson
 The Reasons for the Seasons By Allegra Dickson Vocabulary of the Seasons: 1. Axis- a line from the North Pole to the South Pole which is the fxed point around which the Earth rotates. The axis of the Earth
Slope Fields: Graphing Solutions Without the Solutions
 8 Slope Fields: Graphing Solutions Without the Solutions Up to now, our efforts have been directed mainly towards finding formulas or equations describing solutions to given differential equations. Then,
Regression, part II. I. What does it all mean? A) Notice that so far all we ve done is math.
 Notice that so far all we ve done is math.") Regression, part II I. What does it all mean? A) Notice that so far all we ve done is math. 1) One can calculate the Least Squares Regression Line for anything, regardless of any assumptions. 2) But, if
Regression, part II I. What does it all mean? A) Notice that so far all we ve done is math. 1) One can calculate the Least Squares Regression Line for anything, regardless of any assumptions. 2) But, if
Math101, Sections 2 and 3, Spring 2008 Review Sheet for Exam #2:
 Math101, Sections 2 and 3, Spring 2008 Review Sheet for Exam #2: 03 17 08 3 All about lines 3.1 The Rectangular Coordinate System Know how to plot points in the rectangular coordinate system. Know the
ASTRO 114 Lecture Okay. We re now gonna continue discussing and conclude discussing the entire
 ASTRO 114 Lecture 55 1 Okay. We re now gonna continue discussing and conclude discussing the entire universe. So today we re gonna learn about everything, everything that we know of. There s still a lot
AST101: Our Corner of the Universe Take Home Lab: Observing the Moon and the Sun
 AST101: Our Corner of the Universe Take Home Lab: Observing the Moon and the Sun Name: NetID: Lab section number: 1 Introduction Objectives This lab is designed to help you understand the motion of the
#29: Logarithm review May 16, 2009
 #29: Logarithm review May 16, 2009 This week we re going to spend some time reviewing. I say re- view since you ve probably seen them before in theory, but if my experience is any guide, it s quite likely
Questions Sometimes Asked About the Theory of Evolution
 Chapter 9: Evidence for Plant and Animal Evolution Questions Sometimes Asked About the Theory of Evolution Many questions about evolution arise in Christian circles. We ll discuss just a few that we frequently
Tutoring information, as announced in class
 Announcements Register for Connect, register your iclickers - Register iclickers at https://www1.iclicker.com/ or REEF account profile - Purchase the REEF polling app, create an account, register and get
New Zealand Climate Update No 223, January 2018 Current climate December 2017
 New Zealand Climate Update No 223, January 2018 Current climate December 2017 December 2017 was characterised by higher than normal sea level pressure over New Zealand and the surrounding seas. This pressure
Algebra. Here are a couple of warnings to my students who may be here to get a copy of what happened on a day that you missed.
 This document was written and copyrighted by Paul Dawkins. Use of this document and its online version is governed by the Terms and Conditions of Use located at. The online version of this document is
Lab 7: Earthquakes. Figure 7-1. Diagram of earth movements produced by (a) P-waves and (b) S-waves.
 P-waves and (b) S-waves.") Geology 101 Name(s): Lab 7: Earthquakes When the stresses in a rock (which may or may not already be faulted) exceed the tensile strength of the rock, the rock ruptures at a point called the focus or hypocenter.
Geology 101 Name(s): Lab 7: Earthquakes When the stresses in a rock (which may or may not already be faulted) exceed the tensile strength of the rock, the rock ruptures at a point called the focus or hypocenter.
Geography Class 6 Chapters 3 and
 CHAPTER 3 MOTIONS OF THE EARTH The Earth is always travelling in Space. That makes each person on Earth, a Space Traveller. No one feels the movement of the Earth because humans are too tiny when compared
Introduction to Logarithms
 Introduction to Logarithms How Your Brain Compares Numbers Try the following exercises to reveal how your brains tends to deal with comparative size. Try not to over-think these; just go with whichever
Mounts and Coordinate Systems
 Mounts and Coordinate Systems Part 3: Some Advanced Techniques For Mounts Last month we looked at the basic mount types and methods for aligning them. This month s article, and the last for this series
Figure 1: Doing work on a block by pushing it across the floor.
 Work Let s imagine I have a block which I m pushing across the floor, shown in Figure 1. If I m moving the block at constant velocity, then I know that I have to apply a force to compensate the effects
GOOGLE EARTH TRACKING EARTHQUAKES & VOLCANOES
 GOOGLE EARTH TRACKING EARTHQUAKES & VOLCANOES Earlier it was only possible for someone to track any geographical event through radio or TV news or so. Thanks to Google, the avenues for tracking such events
20.1 Earthquakes. Chapter 20 EARTHQUAKES AND VOLCANOES. Earthquakes and plate boundaries 500 UNIT 6 EARTH S STRUCTURE
 Chapter 20 EARTHQUAKES AND VOLCANOES 20.1 Earthquakes In Chapter 19, you read about the San Andreas Fault, which lies along the California coast (Figure 20.1). This fault passes right through San Francisco
Measurements and Data Analysis
 Measurements and Data Analysis 1 Introduction The central point in experimental physical science is the measurement of physical quantities. Experience has shown that all measurements, no matter how carefully
Earthquakes down under: a rare but real hazard
 University of Wollongong Research Online Faculty of Science, Medicine and Health - Papers Faculty of Science, Medicine and Health 2015 Earthquakes down under: a rare but real hazard Solomon Buckman University
Thank you for your interest in the Support Resistance Strength Analyzer!
 This user manual refer to FXCM s Trading Station version of the indicator Support Resistance Strength Analyzer Thank you for your interest in the Support Resistance Strength Analyzer! This unique indicator
AN ALGEBRA PRIMER WITH A VIEW TOWARD CURVES OVER FINITE FIELDS
 AN ALGEBRA PRIMER WITH A VIEW TOWARD CURVES OVER FINITE FIELDS The integers are the set 1. Groups, Rings, and Fields: Basic Examples Z := {..., 3, 2, 1, 0, 1, 2, 3,...}, and we can add, subtract, and multiply
Deterministic vs. Ensemble Forecasts: The Case from Sandy
 Deterministic vs. Ensemble Forecasts: The Case from Sandy Robert Gall, David McCarren and Fred Toepfer Hurricane Forecast Improvement Program (HFIP); National Weather Service (NWS); National Oceanic and
The Moon Project: Descriptions of Topics
 The Moon Project: Descriptions of Topics 2003 Ann Bykerk-Kauffman, Dept. of Geological and Environmental Sciences, California State University, Chico * Questions to Answer: Topic #1: Moon Rise and Set
Hypothesis testing I. - In particular, we are talking about statistical hypotheses. [get everyone s finger length!] n =
![Hypothesis testing I. - In particular, we are talking about statistical hypotheses. [get everyone s finger length!] n =](/thumbs/86/94764601.jpg "Hypothesis testing I. - In particular, we are talking about statistical hypotheses. [get everyone s finger length!] n =") Hypothesis testing I I. What is hypothesis testing? [Note we re temporarily bouncing around in the book a lot! Things will settle down again in a week or so] - Exactly what it says. We develop a hypothesis,
Hypothesis testing I I. What is hypothesis testing? [Note we re temporarily bouncing around in the book a lot! Things will settle down again in a week or so] - Exactly what it says. We develop a hypothesis,
Mars Opposition Friday 27 th July 2018
 Mars Opposition Friday 27 th July 2018 Mars is about 6,780 kilometres in diameter or roughly half the size of the Earth whose diameter is 12,742km. As they orbit the Sun, the minimum distance between the
Figure 2-1. Diagram of earth movements produced by (a) P-waves and (b) S-waves.
 P-waves and (b) S-waves.") Geology 102, Winter 2006 Name(s): Lab 2: Earthquakes When the stresses in a rock (which may or may not already be faulted) exceed the tensile strength of the rock, the rock ruptures at a point called the
Geology 102, Winter 2006 Name(s): Lab 2: Earthquakes When the stresses in a rock (which may or may not already be faulted) exceed the tensile strength of the rock, the rock ruptures at a point called the
Lesson 1: Forces. Fascinating Education Script Fascinating Intro to Chemistry Lessons. Slide 1: Introduction. Slide 2: Forces
 Fascinating Education Script Fascinating Intro to Chemistry Lessons Lesson 1: Forces Slide 1: Introduction Slide 2: Forces Hi. My name is Sheldon Margulies, and we re about to learn what things are made
Chapter 2. Mathematical Reasoning. 2.1 Mathematical Models
 Contents Mathematical Reasoning 3.1 Mathematical Models........................... 3. Mathematical Proof............................ 4..1 Structure of Proofs........................ 4.. Direct Method..........................
This seminar is jointly presented by the Body Corporate Chairs Group, the Wellington Inner City Associa>on and the Wellington City Council.
 This seminar is jointly presented by the Body Corporate Chairs Group, the Wellington Inner City Associa>on and the Wellington City Council. Please note that these slides do not represent legal advice but
Magnitude 7.7 QUEEN CHARLOTTE ISLANDS REGION
 A major 7.7 magnitude earthquake struck at 8:04 PM local time in western British Columbia, Canada. The epicenter is located on Moresby Island, the southern large island in the Queen Charlotte Islands region.
IDS 102: Electromagnetic Radiation and the Nature of Light
 IDS 102: Electromagnetic Radiation and the Nature of Light Major concepts we will cover in this module are: electromagnetic spectrum; wave intensity vs. wavelength, and the difference between light reflection,
PHYSICS 107. Lecture 4 Ancient Astronomy
 PHYSICS 107 Lecture 4 Ancient Astronomy Introduction Astronomy is the oldest science. There are astronomical artifacts going back 8000 years. Many ancient cultures on every continent seem to have had examples
28 th March 2005 magnitude 8.7 earthquake Northern Sumatra, Indonesia
 29 th March 2005 GAPResponse 28 th March 2005 magnitude 8.7 earthquake Northern Sumatra, Indonesia Russell Blong T: +61 2 8209 4288 F: +61 2 9241 2441 E: russell.blong@benfieldgroup.com Ben Miliauskas
The SI unit for Energy is the joule, usually abbreviated J. One joule is equal to one kilogram meter squared per second squared:
 Chapter 2 Energy Energy is an extremely loaded term. It is used in everyday parlance to mean a number of different things, many of which bear at most a passing resemblance to the term as used in physical
CALCULUS III. Paul Dawkins
 CALCULUS III Paul Dawkins Table of Contents Preface... iii Outline... iv Three Dimensional Space... Introduction... The -D Coordinate System... Equations of Lines... 9 Equations of Planes... 5 Quadric
Pacific Decadal Oscillation ( PDO ):
:") Time again for my annual Winter Weather Outlook. Here's just a small part of the items I considered this year and how I think they will play out with our winter of 2015-2016. El Nino / La Nina: When looking
Time again for my annual Winter Weather Outlook. Here's just a small part of the items I considered this year and how I think they will play out with our winter of 2015-2016. El Nino / La Nina: When looking
Area-wide geotechnical information summary for CERA zoning review panel
 Area-wide geotechnical information summary for CERA zoning review panel This document contains all the area-wide geotechnical information which was considered by CERA as part of the process for making
Talk Science Professional Development
 Talk Science Professional Development Transcript for Grade 4 Scientist Case: The Heavy for Size Investigations 1. The Heavy for Size Investigations, Through the Eyes of a Scientist We met Associate Professor
What is proof? Lesson 1
 What is proof? Lesson The topic for this Math Explorer Club is mathematical proof. In this post we will go over what was covered in the first session. The word proof is a normal English word that you might
Achilles: Now I know how powerful computers are going to become!
 A Sigmoid Dialogue By Anders Sandberg Achilles: Now I know how powerful computers are going to become! Tortoise: How? Achilles: I did curve fitting to Moore s law. I know you are going to object that technological
Communication Engineering Prof. Surendra Prasad Department of Electrical Engineering Indian Institute of Technology, Delhi
 Communication Engineering Prof. Surendra Prasad Department of Electrical Engineering Indian Institute of Technology, Delhi Lecture - 41 Pulse Code Modulation (PCM) So, if you remember we have been talking
Using Solar Active Region Latitude Analysis to Monitor Solar Cycle Progress
 Using Solar Active Region Latitude Analysis to Monitor Solar Cycle Progress A Study Commissioned by RyeBrook Space Science Services RyeBrook Space 2017 Abstract: This paper seeks to answer the question
Latitude and Longitude, Plus Map Scale
 Name Lab 4 More Date: Latitude and Longitude, Plus Map Scale In the first few labs of the semester, you found that you needed to look at a variety of maps to answer all the questions. One reason you needed
Winter General Outlook Covering December to February
 UK & Ireland Winter 2017/18 Weather Forecast Winter General Outlook Covering December to February Our overall for the upcoming winter 2017/18 period favours some frequent blocking patterns with some twists
CHAPTER 6 - THINKING ABOUT AND PRACTICING PROPOSITIONAL LOGIC
 1 CHAPTER 6 - THINKING ABOUT AND PRACTICING PROPOSITIONAL LOGIC Here, you ll learn: what it means for a logic system to be finished some strategies for constructing proofs Congratulations! Our system of
Hawke s Bay Liquefaction Hazard Report - Frequently Asked Questions
 Hawke s Bay Liquefaction Hazard Report - Frequently Asked Questions What is liquefaction? Liquefaction occurs when an earthquake shakes up water-logged sediments. As a result, the soil behaves like a liquid
Figure 1 Different gravity force of the moon on different places on earth
 TIDES How the Sun and Moon cause tides. Spring tides, neap tides, and the three patterns of tides on earth caused by the rotation of Earth and local topographical features: Diurnal, Semi-Diurnal and Mixed
Getting Started with Communications Engineering
 1 Linear algebra is the algebra of linear equations: the term linear being used in the same sense as in linear functions, such as: which is the equation of a straight line. y ax c (0.1) Of course, if we
What Patterns Can Be Observed in a Year?
 LESSON 3 What Patterns Can Be Observed in a Year? From this vantage point, you can see the moon, sun, stars, and Earth. From Earth s surface, there are patterns to how the sun, moon, and stars appear in
Vocabulary: New Context
 9. The Tunguska is an isolated area in central Siberia. 10. Others that it was an exploding spaceship. 11., some of the trees at the center of the explosion weren t burned. b Vocabulary: New Context Put
EARTH SCIENCE KEY UNIT 2-H
 EARTH SCIENCE KEY UNIT 2-H UNIT 2 MODELS & DIMENSIONS OF EARTH I. Model = ANYTHING THAT REPRESENTS THE PROPERTIES OF AN OBJECT OR SYSTEM A. Types and examples of models: 1. PHYSICAL Provides us with information
This page answers some of the questions people have been asking about the earthquakes in Christchurch and Canterbury since September 2010.
 1 of 5 04/12/2012 11:05 a.m. This page answers some of the questions people have been asking about the earthquakes in Christchurch and Canterbury since September 2010. Why are we getting so many earthquakes?
Chapter 4 Earth, Moon, and Sky 107
 Chapter 4 Earth, Moon, and Sky 107 planetariums around the world. Figure 4.4 Foucault s Pendulum. As Earth turns, the plane of oscillation of the Foucault pendulum shifts gradually so that over the course
The. Astronomy is full of cycles. Like the day, the month, & the year In this section we will try to understand these cycles.
 Understanding The Sky Astronomy is full of cycles Like the day, the month, & the year In this section we will try to understand these cycles. For Example Why do we think of stars as nighttime objects?