ANNUAL BULLETIN OF CLIMATE CHANGE MONITORING IN KAZAKHSTAN:
|
|
|
- Sharon Curtis
- 5 years ago
- Views:
Transcription
1 Ministry of Energy of the Republic of Kazakhstan Republican State Enterprise Kazhydromet ANNUAL BULLETIN OF CLIMATE CHANGE MONITORING IN KAZAKHSTAN: 213 ºС Астана, 214
2 CONTENTS INTRODUCTION 3 1 OVERVIEW OF GLOBAL CLIMATE CHANGE AND ITS STATUS IN ТЕМПЕРАТУРА ВОЗДУХА Observed changes in air temperature in Kazakhstan Temperature anomalies in Kazakhstan in Trends in surface air temperature extremes PRECIPITATION Observed changes in precipitation in Kazakhstan Precipitation anomalies in Kazakhstan in Trends in precipitation extremes 41 CONCLUSION 43 ANNEX 1 46 ANNEX
3 INTRODUCTION Climate is a natural resource and is very important for our well-being, health and prosperity. National Hydrometeorological services collect and analyze information that helps decision-makers and users to plan and adapt their activities and projects within the expected conditions. Thus, decisions can be made in the planning process, reduce risks and optimize socio-economic benefits. Climate system monitoring is carried out by national, regional and international organizations, coordinated by the World Meteorological Organization and in cooperation with other environment programs. The study of regional climate and continuous monitoring of its change is one of the priority tasks of the National Hydrometeorological service "Kazhydromet." Since 21 the National Hydrometeorological Service annually prepares and publishes the bulletin on the climate state in Kazakhstan to provide reliable scientific information on climate, its variability and change. Taking into account the geographic location of Kazakhstan and its vast territory, the observed changes in climatic conditions in different regions can have both negative and positive impacts on the biophysical system, economic activities and social services. A better understanding of climate formation and climate change are critical to assess the potential impact and to take timely and appropriate adaptation measures for sustainable development of Kazakhstan. The given bulletin describes the climatic conditions of 213 including the meteorological extremes assessment. It also includes historical information about climate variability and trends since the 194's. Also in this bulletin added distribution maps of air temperature and precipitation averaged over the seasons for the period (the norm for the period , see. Annex 1 and 2). Initial data. Bulletin is based on data of the National Hydrometeorological Fund of "Kazhydromet": 1) The series of average monthly air temperature and monthly precipitation from 1941 to 213. Data of more than 19 weather stations were used to assess climate normal for Also experts used more than 11 weather stations data to assess trends; 2) The series of daily maximum and minimum air temperatures and daily precipitation from 1941 to 213 (more than 9 meteorological stations). Basic approaches and methods. Climate "normal" in the bulletin means average value of the considered climatic variable for the Temperature anomalies are calculated as the deviation of the observed values from the norm. Precipitation anomalies are usually considered both as deviation from the norm (like temperature) and as percentage of the norm, i.e. ratio of observed precipitation and the norm. Probability of non-exceedance shows the percentage frequency of particular anomaly in the observation record. Linear trend factors defined by the least-squares method were used as climate change indicators for a certain period. Trend significance was assessed with the determination factor (R 2 ), representing a percentage share of variance. 3


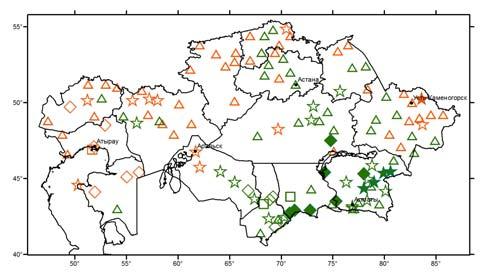
4 The surface air temperature and precipitation trends were assessed both for individual stations and on average for the 14 administrative areas in Kazakhstan. Experts fitted observation time series to the linear function using the least-squares method. The mean anomalies for the area were calculated by averaging the station data anomalies. The map below shows the administrative areas in Kazakhstan. Experts used the WMO climate change indices to assess extreme temperatures and precipitation in 213. Some indexes are based on a fixed threshold values for all stations, the other - on the threshold values, which can vary from station to station. In the latter case, the threshold values are defined as the corresponding percentile of the data series. Indices allow estimating many aspects of climate change, such, for example, the change in intensity, frequency and duration of extreme temperature in air and precipitation. 1 Kyzylorda oblast 2 Southern Kazakhstan oblast 3 Zhambyl oblast 4 Almaty oblast 5 Eastern Kazakhstan oblast 6 Pavlodar oblast 7 Northern Kazakhstan oblast Administrative areas in Kazakhstan 8 Akmola oblast 9 Kostanay oblast 1 Karaganda oblast 11 Aktobe oblast 12 Western Kazakhstan oblast 13 Atyrau oblast 14 Mangistau oblast Bulletin was prepared by Petrova E.E., Responsible editor, senior researcher, Climate Study Direction Dolgikh S.A., Ph.D., Head of the Climate Study Direction, Smirnova E.Y. leading researcher, Climate Study Direction Ilyakova R.M. leading engineer, Climate Study Direction Monkaeva G.E. research assistant, Climate Study Direction 4

5 1 OVERVIEW OF GLOBAL CLIMATE CHANGE AND ITS STATUS IN 213 The observations of the climate system currently base on the Global Observing System of the atmosphere, land and ocean surfaces, which is a coordinated system of different subsystems observations. Observations of temperature and other variables on a global scale began in the middle of 19th century to the beginning of the instrumental era, but a more comprehensive and diverse set of observed parameters they became since the 195s. Estimates of change globally as averaging of land surface temperature and ocean, calculated on the basis of a linear trend, show a warming of,85 (, ,6) C for the period The increase of global temperature over the period is on average,78 (,72...,85) C, compared with the period of The increase surface air temperature observed in most regions of the globe (Figure 1.1). Trend ( С for the period ) Figure Map of the observed changes in surface temperature from 191 to 212, compiled on the basis of temperature trends determined by linear regression based on a single data set (red line in figure 1.2). Trends were identified for those places where the availability of data allows you to make a reliable estimate (i.e., only for grid cells in which there are more than 7% of the possible amount of data, more than 2% of the possible amount of data for the first and last 1% of the period observations). Other areas are painted white. Grid cells, for which statistically significant trend reaches 1%, marked with the symbol "+". Source: IPCC, 213: Summary for Policymakers. Contained in the publication "Climate Change 213: The Physical Science Basis. Contribution of Working Group I to the Fifth Assessment Report of the Intergovernmental Panel on Climate Change» 5

6 Figure 1.2 shows the variation of the global surface air temperature for the period of instrumental observations, calculated according to the three arrays. Data beginning from 185 for the UK and from 188 for the US. Warming was not constant in the 21st century. From the early 2th century and up to 4 s warming continued, then there was a slight cooling, and after that from the mid 7 s to present the intensive warming is observed. Some pause occurred from 2 in the process of global warming: a global temperature fluctuates at the level reached high values. The warmest period in the observational records was from 21 to 21 but in this period the monotonic warming was not observed. Figure Annual global average temperature anomalies (relative to the ) from 185 to 213 from the Hadley Centre/CRU (HadCRUT4) (black line and grey area, representing average and 95 per cent uncertainty range), the NOAA National Climatic Data Center (red), and the NASA Goddard Institute for Space Studies (blue) (Source: Met Office Hadley Centre, United Kingdom, and Climatic Research Unit, University of East Anglia, United Kingdom) Each of the last three decades was characterized by higher surface temperature than any other decade since 185. In the northern hemisphere from 1983 to 212 was probably the warmest in the last 14 years (mean confidence level). In relation to changes in average precipitation over land there is a low degree of reliability from 191 to 1951 and the average - from 191 to 213 Precipitation in the middle latitudes of the Northern Hemisphere has increased since 191 (medium confidence until 1951 and high - after). For other latitudes there is low confidence of positive or negative trends. Around 195 there are changes in extreme weather and climate events. It is very likely that the global number of cold days and nights has decreased, while the number of warm days and nights has increased. It is likely that the frequency of heat waves has increased in large areas of Europe, Asia and Australia. The frequency and intensity of heavy rainfall is probably increased in North America and Europe. (Source: IPCC, 213.: Summary for Policymakers. Contained in the publication of Climate Change, 213. The Physical Science 6
 on the status of the global climate» (WMO- 113) 213 became one of the warmest ten years since 185.")
7 Basis. Contribution of Working Group I to the Fifth Assessment Report of the Intergovernmental Panel on Climate Change). According to the «Statement of the World Meteorological Organization (WMO) on the status of the global climate» (WMO- 113) 213 became one of the warmest ten years since 185. Land-ocean global average air temperature in 213 was,5 ºС ±,1 C higher the 1961, 199 annual average of 14 C. This makes 213 nominally the sixth warmest year on record since 185 (Figure 1.3). Figure 1.3 Global ranked surface temperatures for the warmest 5 years. Inset shows global ranked surface temperatures from 185. The size of the bars indicates the 95 per cent confidence limits associated with each year. Values are simple area-weighted averages for the whole year. (Source: WMO statement on the status of the global climate in 213) The past year was also warmer than both 211 and 212, which, though marked by cooling La Niña conditions, were,43 C and,46 C above average, respectively (Figure 1.3, 1.4). Warming El Niño and cooling La Niña events are major drivers of natural variability in the climate system. Neither condition was present during 213, which was among the four warmest ENSO-neutral years on record (Figure 1.4). Thirteen of the fourteen warmest years on record, including 213, have all occurred in the twenty-first century. The warmest on record are 21 and 25, followed by El Niño conditions dominated the early months of 21 and 1998, and weak El Niño-type conditions extended from 24 to the first half of 25. Because the capacity for heat absorption differs over land and over sea, the air over the land tends to warm up faster. Across the world s land surfaces, the 213 global air temperature was,85 C ±,17 C above the average and,6 C above the average, the fourth highest on record. A very warm November December period that ranked second behind 26 contributed to this high temperature anomaly. Over the global ocean, the surface 7

8 temperature for 213 tied with 24 and 26 as the sixth warmest on record, at,35 C±,7 C above the average. Figure January December global land and ocean surface temperature anomalies (relative to ) for the period ; years that started with a moderate or strong La Niña already in place are shown in blue; years that started with a moderate or strong El Niño already in place are shown in red; other years are shown in grey. The northern hemisphere s weather patterns during early 213 were largely influenced by the Arctic Oscillation. This brought cooler-than-average spring temperatures to much of Europe, the south-eastern United States, north-western Russian Federation and parts of Japan (Figure 1.5). The Arctic region, meanwhile, was considerably warmer than average, along with much of central and northern Africa, the eastern Mediterranean, southern Russian Federation and much of China. This so-called warm Arctic, cold continents pattern is characteristic of the Arctic Oscillation s negative phase. The year 213 saw the most negative Arctic Oscillation on record for the month of March. A similar pattern with high pressure over Greenland and low pressure to the south re-emerged in late spring, once again causing cold Arctic air to surge into western and central Europe. In the southern hemisphere, summer was extremely warm, with monthly January temperature anomalies reaching plus 5 C in parts of Australia. Exceptional warm conditions were also present during the winter, with New Zealand experiencing its warmest winter on record. The beginning of austral summer 213/214 was very hot in parts of South America, with the December temperature reaching new record highs. As a result of the continued warmth throughout the year across parts of the southern hemisphere, 213 was the warmest year on record in Australia, second warmest in Argentina and third warmest in New Zealand. Modeling experiments have indicated that the odds of the record Australian hot summer occurring were increased fivefold by human-induced climate change. 8
 for 213, relative to 1961 199 (Source: Met Office Hadley Centre, United Kingdom, and Climatic Research Unit, University of East")
9 Figure Global land air surface and sea surface temperature anomalies ( C) for 213, relative to (Source: Met Office Hadley Centre, United Kingdom, and Climatic Research Unit, University of East Anglia, United Kingdom) Global precipitation during 213 equaled the average of 133 mm, according to the National Oceanic and Atmospheric Administration (United States). Precipitation at the regional level, however, varied significantly. For example, wetter-than-average conditions were seen across most of Greenland, the southern Arabian Peninsula, central India and western China. Drier-than-average conditions were present over the western United States, much of northern Canada, northern Siberia and the eastern inland of Australia (Figure 1.6). 9
 (Source: Global Precipitation Climatology Centre, Deutscher")
10 Figure 1.6- Annual precipitation anomalies for global land areas for 213; gridded 1,-degree raingauge-based in mm/month (relative to ) (Source: Global Precipitation Climatology Centre, Deutscher Wetterdienst, Germany) Winter snow cover in North America has varied widely over the past few years. During the winter, snow cover extent was 5 km 2 above the average, resulting in the fourteenth largest winter extent for the continent since records began in During the spring, North American snow cover was 83 km 2 above average, making it the tenth largest spring extent for the continent and the largest since During the same period, snow cover extent across the Eurasian continent was 1.71 million km 2 above the average, the third largest winter extent on record for this region and the largest since 23. In the spring, the continent s snow cover contracted significantly to 43 km 2 below average, resulting in the fourteenth smallest extent on record for the season. In May, Eurasian snow cover dipped to 7,3 million km 2, setting a new record low for that month. As further evidence of the rapid response of the Arctic cry sphere to increasing air temperatures, the northern hemisphere June snow cover is currently decreasing at a faster rate than Arctic summer minimum sea-ice extent, and at rates that exceed the projection of climate models. June 213 snow cover across the hemisphere was the second lowest, greater only than the record low of 212. Soil moisture is a key variable for monitoring the climate system because it strongly influences the exchange of water and energy between the land surface and the atmosphere. Very wet soil conditions resulting from hydro meteorological events were noticeable and had an impact on floods in a number of regions including eastern parts of the Russian Federation, north- 1
11 eastern China, India, the Philippines and central Europe. On the other hand, annual soil moisture anomalies indicated dryness in the southern hemisphere, where Australia, South America and southern Africa experienced severe drought conditions during the first part of the year. Arctic sea-ice extent reached its annual maximum on 15 March at 15,13 million km 2. This was approximately,5 million km 2 below the average annual maximum, making it the sixth smallest maximum sea-ice extent since satellite records began in During the 212/213 growth season, Arctic sea-ice extent grew by million km 2, the largest seasonal increase on record; this growth can be explained by the record small sea-ice extent of September 212. Arctic maximum sea-ice extent in March has decreased at an average rate of 2,6 per cent per decade. Another way to assess the state of the Arctic sea ice is to estimate the age of the ice, given that first-year ice is the thinnest and most susceptible to melting. Ice that was four years of age and older decreased from 18 per cent of the ice cover in March 1984 to 2 per cent in March 212. It increased slightly to 3 per cent in 213. In March 1984, 56 per cent of the ice pack was composed of first-year ice, while in March 213 first-year ice comprised 78 per cent of total ice cover at its peak. The Arctic reached its annual minimum sea-ice cover on 13 September, at 5,1 million km 2 or 18 per cent below the average minimum, making it the sixth smallest annual minimum on record. All seven of the lowest Arctic sea-ice extents in the satellite record have occurred in the last seven years, beginning with 27. September Arctic sea-ice extent has decreased at an average rate of 13,7 per cent per decade. The total minimum sea-ice volume, which combines measures of ice extent and model simulations of ice thickness, was higher in 213 than in 21, 211 and 212, but lower than in 27 and well below the average. February marked the end of the Antarctic sea-ice melt season in 213.The annual minimum extent of sea ice was reached on 2 February at 3,68 million km 2. This was the second largest annual minimum sea-ice extent for Antarctica. In addition, Antarctic sea-ice extent reached a record maximum for the second year in a row. On 1 October, it was 19,57 million km 2, 2,7 per cent higher than the average. September Antarctic sea-ice extent has increased at an average rate of 1,1 per cent per decade. Scientists believe that changes in atmospheric circulation over the past three decades, which have weakened the prevailing winds that circle Antarctica, may be a factor. The increasing extent of the ice may also be linked to changing ocean circulation and a build-up of cold freshwater on the surface of the Southern Ocean due to increasing precipitation and melting land-based ice shelves. Melting at the surface of the Greenland ice sheet was much less dramatic in 213 than in the record year of 212. It peaked in late July, when satellites detected melting over 44 per cent of the surface. This coincided with record warmth in south-western Greenland (3 July saw a temperature of 25,9 C in Maniitsoq, the highest temperature ever recorded in Greenland).The last decade has experienced accelerated melting of the sea-ice cover and mass loss of the Greenland ice sheet. 11
12 2 AIR TEMPERATURE 2.1 Observed changes in air temperature in Kazakhstan Climatic changes observed on the globe in the twenty and twenty-first century also have occurred in Kazakhstan. The territory of Kazakhstan is located in the center of the Eurasian continent, and it is removed from the ocean by a considerable distance ( km). The territory is warming more dramatically than the northern hemisphere and the globe on average. There is a difference in the list of the warmest years in the whole of the globe and in Kazakhstan. Only five of the warmest years in Kazakhstan entered the list of the ten warmest years of the globe (Table 2.1). Figure 2.1 presents the ranked annual average temperature anomalies estimated relative to the and averaged over 118 weather stations in Kazakhstan for the All of extremely warm years on average for the globe come from the last 2 years. In Kazakhstan, this feature is also clearly seen, with the exception of The first place in the ranked annual average temperature anomalies was 213 year; it was the warmest year in the last 73 years. The annual average temperature anomalies in 213 equal to 1,69 C, which is,13 C above the previous peak, observed in 1983 (Table 2.1). Synoptic conditions over the territory of Kazakhstan in 213 contributed to the formation of very high air temperature anomalies in separate months. So, in March, November and December 213 air temperature anomalies in average over the country were above normal (1971 2) at 5,53, 4.43 and 2,57 C, respectively (the fourth, the second, the eighth largest positive anomaly from 1941). For these months, the probability of non-exceedance of the anomalies amounted to 95, 98 and 9 %, respectively. The extreme hottest were: January - anomaly was plus 1,9 C (probability of non-exceedance is 83%), April - anomaly was plus 2, C (probability of non-exceedance is 88%), October - anomaly was plus 1,38 C (probability of non-exceedance is 86 %). A more detailed analysis of the temperature distribution on the territory of Kazakhstan in 213 is presented in subsection 2.2. Table 2.1 The ranked 1 warmest years for the globe ( ) and for Kazakhstan ( ) and corresponding annual average temperature anomalies for Kazakhstan Rank Globe Kazakhstan Annual average temperature anomaly for Kazakhstan, С , , , , , , , ,5 12

13 , ,88 аномалия температуры воздуха, О С Figure 2.1 Ranked average annual air temperature anomalies for Kazakhstan for (data of 118 weather stations). Anomalies estimated relative to baseline Figures and table 2.2 present the air temperature change for for Kazakhstan and by administrative areas. All trends in the ranks of the average annual and seasonal values are positive, and showed that the highest warming was observed everywhere in Kazakhstan from 1941 to 213. Country average annual temperature has been rising by,28 ºC every 1 years. The highest warming was in autumn by,33 ºC every 1 years. Winter and spring temperatures have been increasing a little slower by,28 ºC and,3 ºC every 1 years respectively. The slowest warming was in summer,19 ºC every 1 years (Table 2.2). In most cases the trends are statistically significant for the 95 % confidence interval. The contribution of trend to the total average annual temperature dispersion is 39 %, for seasons contribution varies from 2 to 37 % (Table 1.2). It should be noted that in this century temperature anomalies of spring, summer and autumn were mostly positive, while in winter temperature anomalies are mostly negative (Figure 2.2). The reason of the negative winter temperatures anomalies from 28 to 213 are the coldest winters in the central, northern, eastern regions of the country (in most cases due to the prolonged stationing Asian anticyclone). 13
14 year ºС ºС winter 3. ºС spring summer autumn ºС ºС Figure 2.2 Time series and linear trends of the annual and seasonal air temperatures anomalies (relative to ) for for Kazakhstan. The smooth curve represents the 11-year moving average The fastest increase in the average annual temperature was in West Kazakhstan oblast equal to,39 C every 1 years. The lowest warming rates were in South-Kazakhstan Oblast, East Kazakhstan Oblast, Almaty Oblast and Mangistau Oblast amounting to,22...,26 ºC every 1 years. In other oblasts the temperature increase rates were within,27...,32 ºC every 1 years (Table 2.2, Figure 2.3). 14
15 15 Kyzylorda oblast South Kazakhstan oblast ºС ºС Zhambyl oblast Almaty oblast ºС ºС East Kazakhstan oblast Pavlodar oblast ºС ºС North Kazakhstan oblast Akmola oblast ºС ºС Kostanay oblast Karaganda oblast ºС ºС
16 ºС Aktobe oblast ºС Atyrau oblast ºС 2. ºС West Kazakhstan oblast Mangistau oblast Figure 2.3 Time series and linear trends of the annual average air temperatures anomalies (relative to ) for for Kazakhstan ( C). The smooth curve represents the 11-year moving average The biggest temperature increase was observed in southern and eastern oblasts in autumn (,3,4 ºС every 1 years), in northern, Aktobe, Karaganda oblasts in spring (,36,37 ºС every 1 years) and in western oblasts in winter (,39,47 ºС/1 лет). In summer almost everywhere in Kazakhstan the temperature increase linear trend factor was within,13 and,27 C per 1 years. However determination factor is rather high, especially in southern oblasts equal to %. This means that air temperature increasing trend is stable. The warming rate in autumn and spring is also stable with determination factor of % (Table 2.2). Table 2.2 Parameters of the air temperature anomaly linear trend for Kazakhstan and its administrative oblasts for Oblast Year Winter Spring Summer Autumn *a **R 2 a R 2 a R 2 a R 2 a R 2 Kazakhstan,28 39,28 6,3 16,19 24,33 27 Kyzylorda,3 35,25 3,33 16,26 32,33 26 South Kazakhstan,22 28,18 2,21 11,16 17,34 3 Zhambyl,31 41,29 5,24 12,27 36,4 37 Almaty,24 33,28 7,22 12,13 12,3 26 East Kazakhstan,26 25,26 5,27 11,14 1,32 18 Pavlodar,27 25,26 3,36 16,14 8,3 15 North Kazakhstan,31 32,3 5,36 15,21 13,
17 Oblast Year Winter Spring Summer Autumn *a **R 2 a R 2 a R 2 a R 2 a R 2 Akmola,3 32,27 4,37 15,18 11,35 19 Kostanay,32 33,31 5,36 13,24 15,35 19 Karaganda,29 32,25 4,36 16,2 17,35 22 Aktobe,3 31,32 6,33 11,21 13,32 18 West Kazakhstan,39 4,47 11,43 19,26 16,37 24 Atyrau,29 34,39 9,31 15,19 18,3 21 Mangistau,24 31,27 8,21 9,21 18,28 17 * a linear trend factor. ºС per 1 years ** R 2 determination factor. % Mangistau oblast - parameters calculations were performed only on stations Fort Shevchenko Figure 2.4 provides more detailed information about changes in seasonal and monthly air temperatures (ºC/1 years) for in Kazakhstan. Positive trend of average monthly air temperatures is observed almost everywhere in Kazakhstan. Several weather stations recorded negative trends which are statistically insignificant. In February-March, and November- December the air temperature increase was most significant from,41 to,8 ºC/1 years. In April, June and October the warming rate was slower,21...,4 ºC/1 years. In all other months temperature increased from,1 to,2 ºC every 1 years. Thus, temperature increase was higher in cold season (November-March) than in warm (April-October). Basing on the spatial distribution of the linear trend factor it is evident that characteristics of circulation processes have changed. year 17


18 winter spring summer autumn January February March April May June 18
 in Kazakhstan for 1941...212.")
 were 1-2 C higher than the norm in the west, south and")
19 July August September October November December Figure 2.4 The spatial distribution of the surface air temperature linear trend factors (ºC/1 years) in Kazakhstan for Legend keys shaded for statistically significant trend 2.2 Temperature anomalies in Kazakhstan in 213 Annual average temperature anomalies (December 212-November 213) were 1-2 C higher than the norm in the west, south and the central of Kazakhstan. In this regions 213 appeared within 1 % of the extremely warm years. In all other regions temperature anomalies were within ±1 С (Figure 2.5а). Figure 2.5 shows geographical distribution of heat and cold areas in Kazakhstan by seasons. 19

20 Winter The winter of 213 (December February 213) was cold in North and East Kazakhstan as well as Pavlodar, Karaganda and Almaty regions. Temperature anomalies in these regions varied from minus 1, ºС to minus 3, ºС. Temperature anomalies were 1, 2, С above the norm in West Kazakhstan and in Kyzylorda oblast and were within ±1, С in the rest part of Kazakhstan (Figure 2.5b). Figure 2.5b shows the distribution of the average annual temperature anomalies for three winter months. Winter temperature conditions was very contrasting, however seasonal average temperature anomalies was smoother. Thus, in December was cold and extremely cold. Air temperature anomaly in the West reached from minus 2, to minus 4, ºС and in north-east from minus 8, to minus 1, ºС. In January and February air temperature in the most part of territory of Kazakhstan was 1, 5, ºС above the norm and another part within norm. Spring Spring was warm or extremely warm everywhere in Kazakhstan. Air temperatures were 1, 4, C above the norm. The highest anomalies of 3, to 4, C were recorded on the vast area of the western, central and partly southern regions of Kazakhstan. In these regions the 213 spring added to the 1 % of the extremely warm seasons. In the rest of the territory temperature anomalies were 1, 3, C within the norm, only the last northern anomalies were within norm (±1 С, Figure 2.5 c). The hottest month was March and its anomaly was 1, 9, ºС. The centre of heat was in region of Balkhash Lake. Summer Summer of 213 was not warm and in the east, north-east of Kazakhstan it was even cool. In the most part of territory of Kazakhstan air temperature was within means average value (Appendix 1), but in east of republic occurred negative anomalies 1, 1,5 ºC (Figure 2.5d). Autumn Autumn was warm or extremely warm everywhere in Kazakhstan. The greatest temperature anomalies 2,5 3, ºС occurred in the North Kazakhstan and in Kostanay oblast, in the rest of republic within 1, 2,5 ºС. Most weather stations of Kazakhstan reported that the 213 autumn was within 1 % of the warmest autumns (Figure 2.5e). In November air temperature anomalies were positive and increased from 2, to 8, on the vast area of Kazakhstan. year 2

21 winter spring summer 21
 and nonexceedance probabilities for 213 air temperatures calculated over 1941 213 In order to assess")
22 autumn a) year (Dec 212 Nov 213) b) winter c) spring d) summer e) autumn ( 9 %) extremely cold; (1 29 %) cold; (3 69 %) about normal; (7 89 %) warm; (9 1 %) extremely warm Figure 2.5 Spatial distribution of air temperature anomalies in 213 relative to the baseline ( C) and nonexceedance probabilities for 213 air temperatures calculated over In order to assess the extreme temperature conditions in particular year experts used the climate change indices recommended by the World Meteorological Organization. The analysis of the most representative indices and their distribution in Kazakhstan in 213 is considered below. Daily maximum of air temperatures in 213. Figure 2.6 presents in red the absolute maximum of air temperature recorded since the opening of weather station until 212. The maximum of daily air temperature observed in 213 is in blue. Absolute maximum temperature since the beginning of records has not been exceeded in 213 at any considered weather stations The absolute maximum in the north republic reached С, in the south republic was С. The highest values of air temperature (absolute maximum) in Kazakhstan were recorded in July C (Turkestan, Chayan, Aris, Tasty) and in July 1995, when air temperature rose to 51 C (Kizilkum). 22
. In 213, the lowest temperature (-37.")
 in Kazakhstan were recorded in January 1893 (-52 C, Astana ) and in January 1931 (-54 С, Orlovsky Poselok). Figure 2.")
23 Рисунок 2.6 Absolute maximum temperature ( С) since the beginning of records until 212 (red) and the 213 daily maximum temperature ( С) (blue) Daily minimum of air temperature in 213. Absolute minimum temperature since the beginning of records has not been exceeded in 213 at any considered weather stations (Figure 2.7). In 213, the lowest temperature ( C) were observed at some weather stations in the east and in far west of the country. The lowest values of air temperature (absolute minimum) in Kazakhstan were recorded in January 1893 (-52 C, Astana ) and in January 1931 (-54 С, Orlovsky Poselok). Figure 2.7 Absolute maximum temperature ( С) since the beginning of records until 212 (red) and the 213 daily maximum temperature ( С) (blue) 23

 and the probability of nonexceedance of the number of days with temperatures above 35 ºC in 213 (b) for 1941.")

24 Number of days with temperatures above 35 C in 213. Figure 2.8a presents spatial distribution of the number of days with temperatures above 35 C in 213. Maximum number of days with high temperatures in the south region of Kazakhstan was equal to days with 1 2 % probability of non-exceedance. In the eastern and the north-eastern Kazakhstan daily temperature seldom exceeded 35 С (Figure 2.8b). a) b) -9 %; 1-29 %; 3-69 %; 7-89 %; 9-1 % Figure 2.8 Number of days (a) and the probability of nonexceedance of the number of days with temperatures above 35 ºC in 213 (b) for Percentage of days with the daily maximum temperatures above the 9th percentile amounted to 12 2 % in Kazakhstan in 213 (Figure 2.9a). The most frequently maximum temperatures exceeded 9th percentile in the central region, western and south-eastern Kazakhstan. Percentage of days with the daily minimum temperatures below the 1th percentile characterizes the frequency of extremely low temperatures. In 213 the maximum number of such days (> 1 %) was observed in the southern part of the Balkhash Lake (Figure 2.9b). a) b) Figure 2.9 Percentage of days with the daily maximum temperatures above the 9th percentile (a) and with the daily minimum temperatures below the 1th percentile (b) in 213 Figure 2.1a shows the total duration of heat waves in Kazakhstan in 213 (sum of days when at least six consecutive days the daily maximum temperature was above 9th percentile). The total duration of heat waves was high in western Kazakhstan with maximum in Aktobe oblast (3 42 days) and in the central part of republic (24 3 days). Heat waves only lasted for 6 18 days in other regions. 24
.")
; and at least of 6 consecutive days the daily minimum temperature below the 1th")
 in 212 2.")
25 Sum of days during the year when at least 6 consecutive days the daily minimum temperature was below the 1th percentile characterizes the total duration of cold waves. In 213 cold waves not observed in most part of Kazakhstan (Figure 2.1b). The exception was a small area in the far north and the area northern of Balkhash Lake, where the maximum duration of a cold wave was more than 18 days (Figure 2.1b). a) b) Figure 2.1 Total sum of days with at least of 6 consecutive days the daily maximum temperature above the 9th percentile (a); and at least of 6 consecutive days the daily minimum temperature below the 1th percentile (b) in 212 Figure 2.11 presents duration of vegetation period in 213 (the period between the first 5-day average daily temperature 5 C, and the last 5- day average daily temperature 5 C). The vegetation period was about 2 days in the north and more than 3 days in the south of Kazakhstan. Figure The duration of vegetation period (days) in Trends in surface air temperature extremes Trend analysis of the surface air temperature extremes was performed for The daily maximum surface air temperatures tend to increase at most meteorological stations of Kazakhstan. However statistically significant trends can be observed mainly in East Kazakhstan, Pavlodar, Kyzylorda Mangistau and Atyrau oblasts (Figure 2.12). Daily maximum 25
26 temperatures increase by,1...,4 ºC every 1 years. In some regions the increase amounts to,41...,6 C every 1 years Figure 2.12 Spatial distribution of the linear trend factors of daily maximum air temperatures (ºC/1 years) for Shaded keys are for statistically significant trend Statistically significant increase (1 to 5 days every 1 years) in the number of days with temperatures above 35 ºC appeared in western and southern regions of Kazakhstan (Figure 2.13). In the northern and eastern regions the frequency of hot days has not changed during Figure 2.13 Spatial distribution of the linear trend factors for the number of days with temperatures above 35 ºC (days/1 years) for Shaded keys are for statistically significant trend The total duration of heat waves increased throughout the country by 1 to 3 days/1 years (Figure 1.19). Heat wave is recorded when the daily maximum temperature was above 9th percentile at least six consecutive days. Statistically significant trends were observed at over 7 % of meteorological stations. 26
27 Figure 2.14 Spatial distribution of the linear trend factors of the total duration of heat waves (day/1 years) during Shaded keys stand for statistically significant trend It should be noted that all temperature extremes listed above (figures ) have adverse (negative) trend at one weather station Chardara in far south of Kazakhstan. Chardara station is surrounded by Chardara reservoir by three sides causing a cooling effect and forming local climatic conditions. Almost everywhere in Kazakhstan the frequency of frost days when the daily minimum temperature is below C tends to decrease (Figure 2.15). The fastest rates of the frost day frequency decrease are in the mountain regions of the southern Kazakhstan (5...6 days every 1 years). In other regions the number of frost days reduces by days every 1 years <-6 >6 Figure 2.15 Spatial distribution of the linear trend factors of the number of days with daily minimum temperature below C (day/1 years) for Shaded keys stand for statistically significant trend 27
28 A significant decreasing trend in the daily temperature amplitude was observed in Kazakhstan amounting to ºC (Figure 2.16). This trend means mitigation of the climate continentality Figure 2.16 Spatial distribution of the linear trend factors of the daily air temperature amplitude ( C/1 years) for Shaded keys stand for statistically significant trend 28


. A slight increase in annual precipitation (by,4.")

29 3 PRECIPITATION 3.1 Observed changes in precipitation in Kazakhstan for In contrast to the air temperature, changes in precipitation in Kazakhstan are more diverse. Experts estimated linear trends of the monthly, seasonal and annual precipitation time series for 121 weather stations. In some regions of Kazakhstan precipitation increased slightly, whereas in other regions they decreased. Figure 3.1 shows the time series of annual precipitation anomalies for , calculated relative to the baseline and spatially averaged for Kazakhstan and oblasts. On average annual precipitation has been decreasing slightly by,6 mm every 1 years, or about by,4 % of normal per 1 years (table 3.1). A slight increase in annual precipitation (by,4...4, mm/1 years) was observed in Karaganda, Aktobe, Mangistau, Pavlodar, Akmola, North Kazakhstan and Almaty oblasts. In other oblasts Zhambyl, Kyzylorda, Kostanay, South- Kazakhstan, West-Kazakhstan, Atyray and East-Kazakhstan precipitation has been decreasing by 1,6 4,2 mm per 1 years. All annual trends are statistically insignificant. Kazakhstan Kyzylorda oblast South Kazakhstan oblast Zhambyl oblast Almaty oblast East Kazakhstan oblast Pavlodar oblast


")


 for Kazakhstan and")

30 North Kazakhstan oblast Akmola oblast Kostanay oblast Karaganda oblast Aktobe oblast West Kazakhstan oblast Atyrau oblast Mangistau oblast Figure 3.1 Time series and linear trends of annual and seasonal precipitation anomalies (%) for calculated relative to the baseline. The smooth curve shows the 11-year moving average Table 3.1 Linear trend parameters of the seasonal and annual precipitation anomalies (mm/1 years, %/ 1 years) for Kazakhstan and oblasts for Region/oblast Kazakhstan Kyzylorda Unit Year Winter Spring Summer Autumn *a **R 2 a R 2 a R 2 a R 2 a R 2 mm -,6 1,4 -,6 -,6 -, % -,4 1,8 -,2 -,8-1,4 mm -1,8 -,6 -,6 -,2 -,7 1 1 % -1,4-1,4-1,1-1 -2,1 1 3


31 Region/oblast South Kazakhstan Zhambyl Almaty East Kazakhstan Pavlodar North Kazakhstan Akmola Kostanay Karaganda Aktobe West Kazakhstan Atyrau Mangistau Unit Year Winter Spring Summer Autumn *a **R 2 a R 2 a R 2 a R 2 a R 2 mm -3,3,5-4,3,6 -,2 1 2 % -,8-2,7,3,6 * a linear trend factor, %/1years, mm/1 years; ** R 2 determination factor,% mm -2,6,9-3,3,2 -, % -1,4,4-3,4 -,1 -,8 mm 3,6 3,2-2,3 2,1, %,9 4,1-1,6 1,9,6 mm -4,2,8-1,2-2,5-1, % -1,2 1,2-2, -2, -1,4 mm,9 1,3 1,2,4-2,4 6 2 %,3 2,5 2,2,4-3,6 mm 3,2 3,2 2,1-2,4, %,9 5,8 3,5-1,6,4 mm 1,7 1,8 1,2,1-1,9 6 2 %,5 3,3 1,5,1-2,7 mm -1,6,3 1,2-1,2-2, % -,8,7 1,7-1,5-3,4 mm,6 1,8 -,7 -,7 5 % -,2 1,7 -,2-1,3-1,9 mm,8 1,7 2,2-1,3-2, % 1,9 3,3-1,9-3,5 mm -2,9 1,3 -,2-2,1-1, % -1,1 2, -,9-2,9-2,5 mm -3,7-2,3 -,1-1,1 -, % -2,4-7,7 -,4-2,4-1,1 mm,9,5 1,9-1, %,7 2,3 3,9-5,5 -,1 Figure 3.2 shows the inter-annual course of seasonal precipitation anomalies (%) averaged for Kazakhstan. On average in Kazakhstan precipitation tends to slightly decrease by,7 mm every 1 years in all seasons except winter when precipitation tends to increase by 1,4 mm every 1 years (statistically significant trend) (table 3.1) Winter Spring 31
 for 1941.")

32 Summer Autumn Figure 3.2 Time series and linear trends of seasonal precipitation anomalies (%) for relative to the baseline. The smooth curve represents the 11-year moving average Figure 3.3 and 3.4 provide more detailed information about changes in seasonal and monthly air temperatures (ºC/1 years) for in Kazakhstan. Changes in the seasonal precipitation are diverse. Figure 3.3 shows the change in annual and seasonal precipitation in Kazakhstan for (% of norm/1 years). Changes in the seasonal precipitation are diverse. In summer and autumn in most parts of Kazakhstan except mountain south-eastern regions precipitation decreased by 1...7% of norm every 1 years. In winter precipitation mostly increased. Continuous positive trends were observed in the northern and central regions, mountains and foothills north-western, eastern, south-eastern regions by % of normal every 1 years. In spring, a positive trend was observed in the north-western part of Kazakhstan, whereas in other regions precipitation decreased. It should be noted that almost all seasonal trends are statistically insignificant, except winter precipitation. In January and February precipitation increased everywhere in Kazakhstan by % per 1 years. In Almaty, Pavlodar, North Kazakhstan, and Akmola oblasts the increase was statistically significant whereas in Atyrau oblast precipitation decreased by about 13 % every 1 years. In spring and summer change in precipitation both negative and positive was negligible all over Kazakhstan, except North Kazakhstan oblast where precipitation increased by 9.2 % every 1 years in March. In September and October precipitation decreased in most of Kazakhstan. In September precipitation reduction was statistically significant in northern half of Kazakhstan and in Karaganda and Kyzylorda oblasts (by %/1 years). In November and December, change in precipitation was mostly positive. In North-Kazakhstan and Karaganda oblasts precipitation increase was statistically significant and amounted to % every 1 years. 32
33 year winter spring summer autumn Figure 3.3 Spatial distribution of the linear trend factor of seasonal and annual precipitation anomalies (%/1 years), over , relative to the baseline. Shaded keys stand for statistically significant trend 33


34 January February March April May June July August 34


35 September Oktober November December Figure 3.4 Spatial distribution of the precipitation linear trend factor (% of normal/1 years), over , relative to the baseline. Shaded keys stand for statistically significant trend 3.2 Precipitation anomalies in Kazakhstan in 213 Figure 3.5 shows the spatial distribution of annual and seasonal precipitation in 212, expressed as percentage of normal over and nonexceedance probability of annual and seasonal precipitation in 213. The nonexceedance probability means the frequency of the corresponding anomaly in the observational records. In 213 (December 212 through November 213) the annual precipitation were observed within norm (8 12 %, Figure 3.5a) almost everywhere in Kazakhstan. In North Kazakhstan, and in Far East Kazakhstan annual precipitation (2 6 %) were higher than normal. These regions in 213 were within 1 % of extremely wet years since Deficit of annual precipitation (2 4 %) occurred in Mangistau, Kyzylorda, Zhambyl and Karaganda oblasts. Winter (December 212 through November 213). In winter, the positive rainfall anomalies % above normal were in southern, eastern and north-eastern regions of Kazakhstan, as well as locally in some western and north- 35
.")

36 western regions of Kazakhstan. In central and south-western parts of Kazakhstan precipitation was 2 6 % below the norm (Figure 3.5b). In other regions precipitation was within norm. Spring. In spring, precipitation exceeded the norm by % in northern and north-eastern of the country, as well as places in the central and southern Kazakhstan (Figure 3.5c). Precipitation exceeded the norm by 1 % (Appendix 2) in far north of Kazakhstan. According to results of twenty meteorological stations of these regions spring of 213 was within 1 % of the extremely wet seasons. Precipitation deficit of % was observed in most part of western and in some parts of southern and central Kazakhstan. In other regions precipitation was within norm (8 12 %). Summer. Summer 213 was wet and extremely wet in the most part of the territory of Kazakhstan. Extreme precipitation exceeds the norm in ,5 times, was recorded in Kostanay, North Kazakhstan, Akmola, Pavlodar, East Kazakhstan and Almaty regions. The rest of the territory precipitation exceeded the norm by 2 8 %. In western and locally of Kazakhstan precipitation was within the norm. Small hearths of precipitation deficit (<2 %) was observed in southern and western Kazakhstan. (Figure 3.5d). Autumn. In autumn precipitation deficit of 2 8 % was observed in almost everywhere in Kazakhstan. Extremely dry (non-exceedance probability 9 1 %) was in southern and southeastern Kazakhstan and same regions of Akmobe, Kostanay, Karaganda and Pavlodar regions. Only in western Kazakhstan precipitation was by 2 1 % above the norm. According to results of five meteorological stations of these regions autumn of 213 was within 1 % of the extremely wet seasons (Figure 3.5e). year winter spring 36
37 summer autumn a) year (Dec 212 Nov 213) b) winter c) spring d) summer e) autumn extremely dry (non-exceedance probability -9 %); dry (non-exceedance probability 1-29 %); about norm (non-exceedance probability 3-69 %); wet (non-exceedance probability 7-89 %); extremely wet (non-exceedance probability 9-1 %). Figure 3.5 Precipitation in 213 as % of the norm (over ) and non - exceedance probabilities in 213 calculated according to the period To assess precipitation extremes in 213 experts used Indexes of climate change proposed by the World Meteorological Organization. The analysis of the most representative indexes and their distribution throughout Kazakhstan in 213 are presented below. Maximum of daily precipitation in 213. Figure 3.6 shows absolute maximum daily precipitation, since the beginning of records to 212 in red. Daily maximum observed in 213 are in blue. In 213 the absolute maximum of daily precipitation was exceeded at Ganjushkino (Atyrau region) weather station where precipitation amounted to 5 mm. 37
38 Figure 3.6 Absolute maximum of daily precipitation, since the beginning of records until 212 (in red) and the daily maximum in 213 (in blue), mm Figure 3.7 shows the share of extreme precipitation (above 95 th percentile) in the total precipitation of 213. Two indexes R95 and PRPTOT were used for calculation. R95 Index represents precipitation exceeding the 95 th percentile, whereas PRPTOT Index shows annual precipitation. The largest share of extreme precipitation was observed at Ganjushkino station (56 %) and Karabalik (53 %). At Zhaltir, Mihaylovka, Blagoveschenka, Aral sea, Kushmurun, Karabay, Balkashino, Zhetigora stations also recorded rather high share of extreme precipitation %. 38
39 Figure 3.7 Percentage share of extreme precipitation in the annual total in 213. Extreme precipitation is the sum of daily precipitation exceeding 95 th percentile The CDD index which represents the maximum length of time when precipitation was less than 1 mm (duration of dry period, figure 3.8), is very important in the arid climate of Kazakhstan. In 213 the dry period lasted for about a month at almost all weather stations. The longest dry periods from 61 to 89 days were in Mangistau, Kyzylorda oblasts and in the southern Kazakhstan. The longest dry periods from 9 to 142 days were in Zhambyl oblast (Uyuk), South Kazakhstan oblast (Shardara, Arys). 39
40 Figure 3.8 Maximum duration (in days) of dry period in 213 Figure 3.9 shows the maximum duration of the period in 213 when precipitation was equal or greater than 1 mm (CWD). The CWD index shows that the maximum duration of wet period varied from 2 to 1 days. The longest wet periods of 8 1 days were observed in Katon- Karagay (VKO), Martuk (Aktobe oblast), Kokshetay (Akmola oblast), Ruzaevka (NKO) appropriately. At some stations of North Kazakhstan, Akmola, Kostanai regions, as well as in the south of Kazakhstan. Precipitation is within consecutive days. На некоторых станциях Северо-Казахстанской. Акмолинской. Костанайской областях. а также на юге Казахстана. осадки выпадали в течение 6 7 дней подряд. 4
 in Kazakhstan remained almost unchanged (figure 3.1). Both increasing and decreasing trends were weak around,1 1, mm per 1 years in all oblasts Kazakhstan.")
41 Figure 3.9 Maximum duration (in days) of wet period in Trends in precipitation extremes Trend analysis of precipitation extremes was prepared over The maximum daily precipitation (Rx1day) in Kazakhstan remained almost unchanged (figure 3.1). Both increasing and decreasing trends were weak around,1 1, mm per 1 years in all oblasts Kazakhstan. Almost all trends are statistically insignificant except few stations. For instance, maximum daily precipitation decreased by 3,2 mm per 1 years at Bayanaul station, whereas at Bektauata and Turar Ryskulov stations maximum daily precipitation increased by 1,5 1,6 mm per 1 years, respectively. Figure 3.1 Spatial distribution of the linear trend factor of maximum daily precipitation (mm/1 years), for Shaded keys stand for statistically significant trend 41

.")
42 Analysis of the percentage share of extreme precipitation in annual total (R95pTOT) showed that weak trends both decreasing and increasing by %/1 years was observed everywhere in Kazakhstan except few stations. For example, at Karaganda and Zheskazgan stations the share of extreme precipitation increased by 1,6 and 1,7 % every 1 years, respectively. At Ayagoz, Amangeldy and Turar Ryskulov stations extreme precipitation share decreased by 1,3 2,7% every 1 years (figure 3.11). The increase in extreme precipitation during summer cause the higher risk of erosion, and rain-fed mudflow in mountain regions. Figure 3.11 Spatial distribution of the linear trend factor of extreme precipitation share in annual total (%/1 years) over Extreme precipitation is the sum of daily precipitation above the 95 th percentile. Shaded keys stand for statistically significant trend. The maximum duration of dry period tend to decrease almost everywhere in Kazakhstan. Statistically significant decrease occurred in the northern and northeastern regions of Kazakhstan by days every 1 years. At Zhusaly station dry period reduced by 6 days per 1 years. However, at Kokpekty, Ekidyn, Kyzan and Beyneu stations duration od dry period increased by 1 4 days (figure 3.12). Figure 3.12 Spatial distribution of the linear trend factor of the maximum dry period duration (day/1 years) over Shaded keys stand for statistically significant trend. 42
43 CONCLUSION Features of 213 year. Globally, in 213 became the sixth warmest year on record since 185. In 213, the average air temperature over land and ocean areas, on average around the globe was,5ºs ±,1 C above the baseline period ( , 14 C). In Kazakhstan 213 year by the value of the average annual air temperature (January- December) was the warmest year since Country average annual temperature anomaly in 213 amounted to 1,69 C which is,13 C above the previous high observed in The Six months of January, March, April, October, November and December were very warm, and that affected the value of the mean annual air temperature and brought this year for 1 st place among themselves warm years. The largest average annual air temperature anomalies (1,...2, C) were observed in western, central and southern regions of Kazakhstan. In these regions 213 year appeared to be within 1% of extremely warm years since In all other regions temperature anomalies were within ±1 С of the norm. The annual precipitation was 8 12 % of normal on the vast area of Kazakhstan. In the northern regions and in the far east of Kazakhstan, precipitation was above normal at %. These regions appeared within 1 % of extremely wet years since Winter 213 (December 212 February 213). Temperature conditions of this winter have been very contrasting: December 212 was very cold; January and February 213 were warm. In December 212, the air temperature anomalies were from C in the west of the country to 8,... 1, C in the northeast. In January and February temperatures in most part of Kazakhstan were above normal by 1,...3, C, in some areas by 4,... 5, C. In south-eastern, eastern, north-eastern and locally in western, north-western Kazakhstan winter precipitation was by 2 1 % above the norm. In central, south-western Kazakhstan precipitation was by 2 6 % below the norm. In the rest of Kazakhstan amount of precipitation was within the norm. Spring 213 was very warm everywhere in Kazakhstan. Except for the northern areas and the far south, air temperature anomalies were more than 2, C, in some areas even higher than 4, C. In these regions spring 213 appeared within 1% extremely warm season. On the vast area the high positive anomalies of precipitation was near normal or % less than normal. In the northern and north-eastern regions of the spring season precipitation greatly exceeded the norm - in some places up to %. Temperature conditions in summer 213 were within the norm in the most parts of Kazakhstan, only in some areas in the north-east of the country, temperatures were below the norm by 1,...1,5 C. Herewith, the amount of precipitation was above normal everywhere in the Republic. Extreme annual precipitation exceeded the norm in times was recorded in Kostanay, North Kazakhstan, Akmola, Pavlodar, East Kazakhstan and Almaty regions. Autumn was extremely warm and dry almost the entire territory of Kazakhstan. In NKO and Kostanay regions seasonal temperature anomalies were 2,5...3,. Temperature anomalies in North Kazakhstan amounted about 8, ºС (November, 213). Precipitation deficit appeared on the vast area of territory of Kazakhstan, in some regions it was 8 %. Extremely dry autumn 43
44 season was observed in south-eastern Kazakhstan. Just in West Kazakhstan precipitation was above normal at %. In 213 absolute maximum and minimum of air temperature in Kazakhstan has not been exceeded at any considered weather stations. The percentage of days with daily maximum temperatures above the 9th percentile was % (1/5 year). The number of days with high temperatures above 35 C exceeded days in far south of Kazakhstan. In 213, there was irregularity of precipitation in time. In some regions percentage share of extreme precipitation in the annual total in 213 exceeded 2 4 % and locally 5 %. Absolute maximum was exceeded in weather station Ganjushkino (5 mm). The previous maximum (47 mm) was recorded here in May 196. The maximum length of time when precipitation was less than 1 mm the was observed in the southern regions and amounted about months, sometimes about 4 months. In most parts of the territory of republic the duration of these periods was 3 7 weeks. The maximum duration of the wet period (6...1 days) were observed in the northern, eastern, western and southern places of Kazakhstan. Climate Change in Kazakhstan. Average monthly, seasonal, and annual air temperature were increased practically everywhere in Kazakhstan, for the period (73 year). Country average annual temperature has been rising by,28 ºC every 1 years. The highest warming was in autumn by,33 ºC every 1 years. Spring and winter temperatures have been increasing a little slower by,3 ºC and,28 ºC every 1 years respectively. The slowest warming was in summer,19 ºC every 1 years. In most cases the trends are statistically significant for the 95 % confidence interval. The contribution of trend to the total average annual temperature dispersion is 39 %, for seasons contribution varies from 2 to 37 %. The fastest increase in the average annual temperature was in West Kazakhstan oblast equal to,39 C every 1 years. The lowest warming rates were in South-Kazakhstan Oblast, East Kazakhstan Oblast, Almaty Oblast and Mangistau Oblast amounting to,22...,26 ºC every 1 years. In other oblasts the temperature increase rates were within,27...,32 ºC over 1 years ( ). The biggest temperature increase was observed in spring in northern and central oblasts (,33,37 ºС every 1 years) and in autumn in southern and eastern oblasts (,3,4 ºС every 1 years). In western oblasts the biggest temperature rise still occurred in winter (,27,38 ºС every 1 years). In February-March, and November-December the air temperature increase was most significant from,41 to,8º C/1 years. In April, June and October the warming rate was slower,21...,4 ºC/1 years. In all other months temperature increased from,1 to,2 ºC every 1 years. Thus, temperature increase was higher in cold season (November-March) than in warm (April-October). Daily maximum temperatures increase by,1...,4 ºC every 1 years. In some regions the increase amounts about,6 C every 1 years. The number of days with temperatures above 35 ºC increased in western and southern regions of Kazakhstan by 1 to 5 days every 1 years. The total duration of heat waves increased throughout the country by 1 to 3 days/1 years. The annual precipitation has been decreasing slightly by,6 mm every 1 years, or about by,4 % of normal per 1 years during On average in Kazakhstan precipitation 44
45 tends to slightly decrease in all seasons except winter when precipitation tends several increased. All tends were statistically insignificant. Changes in the seasonal precipitation were diverse. In summer and autumn in most parts of Kazakhstan except mountain south-eastern regions precipitation decreased by 1...7% of norm every 1 years. In winter precipitation mostly increased. Continuous positive trends were observed in the northern and central regions, mountains and foothills north-western, eastern, south-eastern regions by % of norm every 1 years. In spring, a positive trend was observed in the north-western part of Kazakhstan, whereas in other regions precipitation decreased. It should be noted that almost all seasonal trends were statistically insignificant, except winter precipitation. Some tends in precipitation extremes were observed. The extreme precipitation share in annual total were increased by 1 2 of norm every 1 years in the most weather stations of the south-eastern part of country. The duration (statistically significant) of dry period occurred in the northern region of Kazakhstan and amounted days every 1 years. 45


46 ANNEX 1 SPATIAL DISTRIBUTION OF ANNUAL AND SEASONAL MEAN AIR TEMPERATURE IN KAZAKHSTAN, CALCULATED OVER THE PERIOD


47 47
48 48

49 ANNEX 2 SPATIAL DISTRIBUTION OF ANNUAL AND SEASONAL PRECIPITATION IN KAZAKHSTAN, CALCULATED OVER THE PERIOD
50 5

51 51
ANNUAL BULLETIN OF CLIMATE CHANGE MONITORING IN KAZAKHSTAN:
 Ministry of Energy of the Republic of Kazakhstan Republican State Enterprise Kazhydromet ANNUAL BULLETIN OF CLIMATE CHANGE MONITORING IN KAZAKHSTAN: 214 ºС 2. 1.. -1. -2. -3. 1945 1949 1957 1961 1969 1973
What is the IPCC? Intergovernmental Panel on Climate Change
 IPCC WG1 FAQ What is the IPCC? Intergovernmental Panel on Climate Change The IPCC is a scientific intergovernmental body set up by the World Meteorological Organization (WMO) and by the United Nations
Current and future climate of the Cook Islands. Pacific-Australia Climate Change Science and Adaptation Planning Program
 Pacific-Australia Climate Change Science and Adaptation Planning Program Penrhyn Pukapuka Nassau Suwarrow Rakahanga Manihiki N o r t h e r n C o o k I s l a nds S o u t h e Palmerston r n C o o k I s l
Chapter outline. Reference 12/13/2016
 Chapter 2. observation CC EST 5103 Climate Change Science Rezaul Karim Environmental Science & Technology Jessore University of science & Technology Chapter outline Temperature in the instrumental record
Appendix 1: UK climate projections
 Appendix 1: UK climate projections The UK Climate Projections 2009 provide the most up-to-date estimates of how the climate may change over the next 100 years. They are an invaluable source of information
Mozambique. General Climate. UNDP Climate Change Country Profiles. C. McSweeney 1, M. New 1,2 and G. Lizcano 1
 UNDP Climate Change Country Profiles Mozambique C. McSweeney 1, M. New 1,2 and G. Lizcano 1 1. School of Geography and Environment, University of Oxford. 2.Tyndall Centre for Climate Change Research http://country-profiles.geog.ox.ac.uk
Will a warmer world change Queensland s rainfall?
 Will a warmer world change Queensland s rainfall? Nicholas P. Klingaman National Centre for Atmospheric Science-Climate Walker Institute for Climate System Research University of Reading The Walker-QCCCE
Deke Arndt, Chief, Climate Monitoring Branch, NOAA s National Climatic Data Center
 Thomas R. Karl, L.H.D., Director, NOAA s National Climatic Data Center, and Chair of the Subcommittee on Global Change Research Peter Thorne, PhD, Senior Scientist, Cooperative Institute for Climate and
Climate Outlook for March August 2018
 The APEC CLIMATE CENTER Climate Outlook for March August 2018 BUSAN, 26 February 2018 The synthesis of the latest model forecasts for March to August 2018 (MAMJJA) from the APEC Climate Center (APCC),
2015 Record breaking temperature anomalies
 2015 Record breaking temperature anomalies June 2015 global temperature was the highest in 136 (since 1880) years reaching an average of 0.88 C above the 20 th century average. This is an increase of 0.12
Seasonal Climate Outlook for South Asia (June to September) Issued in May 2014
 Issued in May 2014") Ministry of Earth Sciences Earth System Science Organization India Meteorological Department WMO Regional Climate Centre (Demonstration Phase) Pune, India Seasonal Climate Outlook for South Asia (June
Ministry of Earth Sciences Earth System Science Organization India Meteorological Department WMO Regional Climate Centre (Demonstration Phase) Pune, India Seasonal Climate Outlook for South Asia (June
South & South East Asian Region:
 Issued: 15 th December 2017 Valid Period: January June 2018 South & South East Asian Region: Indonesia Tobacco Regions 1 A] Current conditions: 1] El Niño-Southern Oscillation (ENSO) ENSO Alert System
J8.4 TRENDS OF U.S. SNOWFALL AND SNOW COVER IN A WARMING WORLD,
 J8.4 TRENDS OF U.S. SNOWFALL AND SNOW COVER IN A WARMING WORLD, 1948-2008 Richard R. Heim Jr. * NOAA National Climatic Data Center, Asheville, North Carolina 1. Introduction The Intergovernmental Panel
South & South East Asian Region:
 Issued: 10 th November 2017 Valid Period: December 2017 May 2018 South & South East Asian Region: Indonesia Tobacco Regions 1 A] Current conditions: 1] El Niño-Southern Oscillation (ENSO) ENSO Alert System
South Asian Climate Outlook Forum (SASCOF-6)
") Sixth Session of South Asian Climate Outlook Forum (SASCOF-6) Dhaka, Bangladesh, 19-22 April 2015 Consensus Statement Summary Below normal rainfall is most likely during the 2015 southwest monsoon season
Sixth Session of South Asian Climate Outlook Forum (SASCOF-6) Dhaka, Bangladesh, 19-22 April 2015 Consensus Statement Summary Below normal rainfall is most likely during the 2015 southwest monsoon season
2015: A YEAR IN REVIEW F.S. ANSLOW
 2015: A YEAR IN REVIEW F.S. ANSLOW 1 INTRODUCTION Recently, three of the major centres for global climate monitoring determined with high confidence that 2015 was the warmest year on record, globally.
Lecture 28: Observed Climate Variability and Change
 Lecture 28: Observed Climate Variability and Change 1. Introduction This chapter focuses on 6 questions - Has the climate warmed? Has the climate become wetter? Are the atmosphere/ocean circulations changing?
Zambia. General Climate. Recent Climate Trends. UNDP Climate Change Country Profiles. Temperature. C. McSweeney 1, M. New 1,2 and G.
 UNDP Climate Change Country Profiles Zambia C. McSweeney 1, M. New 1,2 and G. Lizcano 1 1. School of Geography and Environment, University of Oxford. 2. Tyndall Centre for Climate Change Research http://country-profiles.geog.ox.ac.uk
Chapter 1 Climate in 2016
 Chapter 1 Climate in 2016 1.1 Global climate summary Extremely high temperatures were frequently observed in many regions of the world, and in particular continued for most of the year in various places
Seasonal Climate Watch January to May 2016
 Seasonal Climate Watch January to May 2016 Date: Dec 17, 2015 1. Advisory Most models are showing the continuation of a strong El-Niño episode towards the latesummer season with the expectation to start
Weather and Climate Summary and Forecast March 2019 Report
 Weather and Climate Summary and Forecast March 2019 Report Gregory V. Jones Linfield College March 2, 2019 Summary: Dramatic flip from a mild winter to a top five coldest February on record in many locations
Climate Change 2007: The Physical Science Basis
 Climate Change 2007: The Physical Science Basis Working Group I Contribution to the IPCC Fourth Assessment Report Presented by R.K. Pachauri, IPCC Chair and Bubu Jallow, WG 1 Vice Chair Nairobi, 6 February
Weather and Climate Summary and Forecast February 2018 Report
 Weather and Climate Summary and Forecast February 2018 Report Gregory V. Jones Linfield College February 5, 2018 Summary: For the majority of the month of January the persistent ridge of high pressure
Climate Outlook for October 2017 March 2018
 The APEC CLIMATE CENTER Climate Outlook for October 2017 March 2018 BUSAN, 25 September 2017 The synthesis of the latest model forecasts for October 2017 to March 2018 (ONDJFM) from the APEC Climate Center
Malawi. General Climate. UNDP Climate Change Country Profiles. C. McSweeney 1, M. New 1,2 and G. Lizcano 1
 UNDP Climate Change Country Profiles Malawi C. McSweeney 1, M. New 1,2 and G. Lizcano 1 1. School of Geography and Environment, University of Oxford. 2. Tyndall Centre for Climate Change Research http://country-profiles.geog.ox.ac.uk
Climate Outlook through 2100 South Florida Ecological Services Office Vero Beach, FL January 13, 2015
 Climate Outlook through 2100 South Florida Ecological Services Office Vero Beach, FL January 13, 2015 Short Term Drought Map: Short-term (
MDA WEATHER SERVICES AG WEATHER OUTLOOK. Kyle Tapley-Senior Agricultural Meteorologist May 22, 2014 Chicago, IL
 MDA WEATHER SERVICES AG WEATHER OUTLOOK Kyle Tapley-Senior Agricultural Meteorologist May 22, 2014 Chicago, IL GLOBAL GRAIN NORTH AMERICA 2014 Agenda Spring Recap North America Forecast El Niño Discussion
The Failed Science of Global warming: Time to Re-consider Climate Change
 The Failed Science of Global warming: Time to Re-consider Climate Change Madhav Khandekar Expert Reviewer IPCC 2007 Climate Change IPCC vs NIPCC IPCC: Intergovernmental Panel on Climate Change; A UN Body
Weather and Climate Summary and Forecast Winter
 Weather and Climate Summary and Forecast Winter 2016-17 Gregory V. Jones Southern Oregon University December 5, 2016 Well after an October that felt more like November, we just finished a November that
Historical and Projected Future Climatic Trends in the Great Lakes Region
 Historical and Projected Future Climatic Trends in the Great Lakes Region Jeffrey A. Andresen Dept. of Geography, Environment, and Spatial Sciences Michigan State University Flooding along I-696 Warren,
Weather and Climate Summary and Forecast December 2017 Report
 Weather and Climate Summary and Forecast December 2017 Report Gregory V. Jones Linfield College December 5, 2017 Summary: November was relatively cool and wet from central California throughout most of
Suriname. General Climate. Recent Climate Trends. UNDP Climate Change Country Profiles. Temperature. C. McSweeney 1, M. New 1,2 and G.
 UNDP Climate Change Country Profiles Suriname C. McSweeney 1, M. New 1,2 and G. Lizcano 1 1. School of Geography and Environment, University of Oxford. 2. Tyndall Centre for Climate Change Research http://country-profiles.geog.ox.ac.uk
ENSO Cycle: Recent Evolution, Current Status and Predictions. Update prepared by Climate Prediction Center / NCEP 23 April 2012
 ENSO Cycle: Recent Evolution, Current Status and Predictions Update prepared by Climate Prediction Center / NCEP 23 April 2012 Outline Overview Recent Evolution and Current Conditions Oceanic Niño Index
South Asian Climate Outlook Forum (SASCOF-12)
") Twelfth Session of South Asian Climate Outlook Forum (SASCOF-12) Pune, India, 19-20 April 2018 Consensus Statement Summary Normal rainfall is most likely during the 2018 southwest monsoon season (June
Twelfth Session of South Asian Climate Outlook Forum (SASCOF-12) Pune, India, 19-20 April 2018 Consensus Statement Summary Normal rainfall is most likely during the 2018 southwest monsoon season (June
NIWA Outlook: October - December 2015
 October December 2015 Issued: 1 October 2015 Hold mouse over links and press ctrl + left click to jump to the information you require: Overview Regional predictions for the next three months: Northland,
Weather and Climate Summary and Forecast November 2017 Report
 Weather and Climate Summary and Forecast November 2017 Report Gregory V. Jones Linfield College November 7, 2017 Summary: October was relatively cool and wet north, while warm and very dry south. Dry conditions
1990 Intergovernmental Panel on Climate Change Impacts Assessment
 1990 Intergovernmental Panel on Climate Change Impacts Assessment Although the variability of weather and associated shifts in the frequency and magnitude of climate events were not available from the
Current and future climate of Vanuatu. Pacific-Australia Climate Change Science and Adaptation Planning Program
 Pacific-Australia Climate Change Science and Adaptation Planning Program Hiu Torres Islands Vanua Lava Gaua Banks Islands Espiritu Santo Malekula Ambae Épi Maéwo Pentecost Ambrym Shepherd Islands Éfate
Weather and Climate Summary and Forecast Winter
 Weather and Climate Summary and Forecast Winter 2016-17 Gregory V. Jones Southern Oregon University February 7, 2017 What a difference from last year at this time. Temperatures in January and February
Cuba. General Climate. Recent Climate Trends. UNDP Climate Change Country Profiles. Temperature. C. McSweeney 1, M. New 1,2 and G.
 UNDP Climate Change Country Profiles Cuba C. McSweeney 1, M. New 1,2 and G. Lizcano 1 1. School of Geography and Environment, University of Oxford. 2. Tyndall Centre for Climate Change Research http://country-profiles.geog.ox.ac.uk
MPACT OF EL-NINO ON SUMMER MONSOON RAINFALL OF PAKISTAN
 MPACT OF EL-NINO ON SUMMER MONSOON RAINFALL OF PAKISTAN Abdul Rashid 1 Abstract: El-Nino is the dominant mod of inter- annual climate variability on a planetary scale. Its impact is associated worldwide
St Lucia. General Climate. Recent Climate Trends. UNDP Climate Change Country Profiles. Temperature. Precipitation
 UNDP Climate Change Country Profiles St Lucia C. McSweeney 1, M. New 1,2 and G. Lizcano 1 1. School of Geography and Environment, University of Oxford. 2. Tyndall Centre for Climate Change Research http://country-profiles.geog.ox.ac.uk
Our climate system is based on the location of hot and cold air mass regions and the atmospheric circulation created by trade winds and westerlies.
 CLIMATE REGIONS Have you ever wondered why one area of the world is a desert, another a grassland, and another a rainforest? Or have you wondered why are there different types of forests and deserts with
Climate briefing. Wellington region, May Alex Pezza and Mike Thompson Environmental Science Department
 Climate briefing Wellington region, May 2016 Alex Pezza and Mike Thompson Environmental Science Department For more information, contact the Greater Wellington Regional Council: Wellington PO Box 11646
3. Climate Change. 3.1 Observations 3.2 Theory of Climate Change 3.3 Climate Change Prediction 3.4 The IPCC Process
 3. Climate Change 3.1 Observations 3.2 Theory of Climate Change 3.3 Climate Change Prediction 3.4 The IPCC Process 3.1 Observations Need to consider: Instrumental climate record of the last century or
ENSO Cycle: Recent Evolution, Current Status and Predictions. Update prepared by Climate Prediction Center / NCEP 11 November 2013
 ENSO Cycle: Recent Evolution, Current Status and Predictions Update prepared by Climate Prediction Center / NCEP 11 November 2013 Outline Overview Recent Evolution and Current Conditions Oceanic Niño Index
South Asian Climate Outlook Forum (SASCOF-8)
") Eighth Session of South Asian Climate Outlook Forum (SASCOF-8) Colombo, Sri Lanka, 25-26 April 2016 Consensus Statement Summary Above-normal rainfall is most likely during the 2016 southwest monsoon season
Eighth Session of South Asian Climate Outlook Forum (SASCOF-8) Colombo, Sri Lanka, 25-26 April 2016 Consensus Statement Summary Above-normal rainfall is most likely during the 2016 southwest monsoon season
Climate Outlook for December 2015 May 2016
 The APEC CLIMATE CENTER Climate Outlook for December 2015 May 2016 BUSAN, 25 November 2015 Synthesis of the latest model forecasts for December 2015 to May 2016 (DJFMAM) at the APEC Climate Center (APCC),
An ENSO-Neutral Winter
 An ENSO-Neutral Winter This issue of the Blue Water Outlook newsletter is devoted towards my thoughts on the long range outlook for winter. You will see that I take a comprehensive approach to this outlook
Climate Outlook for March August 2017
 The APEC CLIMATE CENTER Climate Outlook for March August 2017 BUSAN, 24 February 2017 Synthesis of the latest model forecasts for March to August 2017 (MAMJJA) at the APEC Climate Center (APCC), located
Weather and Climate Summary and Forecast Summer 2017
 Weather and Climate Summary and Forecast Summer 2017 Gregory V. Jones Southern Oregon University August 4, 2017 July largely held true to forecast, although it ended with the start of one of the most extreme
Antigua and Barbuda. General Climate. Recent Climate Trends. UNDP Climate Change Country Profiles. Temperature
 UNDP Climate Change Country Profiles Antigua and Barbuda C. McSweeney 1, M. New 1,2 and G. Lizcano 1 1. School of Geography and Environment, University of Oxford. 2. Tyndall Centre for Climate Change Research
UPDATE OF REGIONAL WEATHER AND SMOKE HAZE (December 2017)
") UPDATE OF REGIONAL WEATHER AND SMOKE HAZE (December 2017) 1. Review of Regional Weather Conditions for November 2017 1.1 In November 2017, Southeast Asia experienced inter-monsoon conditions in the first
UPDATE OF REGIONAL WEATHER AND SMOKE HAZE (December 2017) 1. Review of Regional Weather Conditions for November 2017 1.1 In November 2017, Southeast Asia experienced inter-monsoon conditions in the first
2011 National Seasonal Assessment Workshop for the Eastern, Southern, & Southwest Geographic Areas
 2011 National Seasonal Assessment Workshop for the Eastern, Southern, & Southwest Geographic Areas On January 11-13, 2011, wildland fire, weather, and climate met virtually for the ninth annual National
UPDATE OF REGIONAL WEATHER AND SMOKE HAZE (February 2018)
") UPDATE OF REGIONAL WEATHER AND SMOKE HAZE (February 2018) 1. Review of Regional Weather Conditions for January 2018 1.1 The prevailing Northeast monsoon conditions over Southeast Asia strengthened in January
UPDATE OF REGIONAL WEATHER AND SMOKE HAZE (February 2018) 1. Review of Regional Weather Conditions for January 2018 1.1 The prevailing Northeast monsoon conditions over Southeast Asia strengthened in January
Weather and Climate Summary and Forecast March 2018 Report
 Weather and Climate Summary and Forecast March 2018 Report Gregory V. Jones Linfield College March 7, 2018 Summary: The ridge pattern that brought drier and warmer conditions from December through most
Observed Climate Variability and Change: Evidence and Issues Related to Uncertainty
 Observed Climate Variability and Change: Evidence and Issues Related to Uncertainty David R. Easterling National Climatic Data Center Asheville, North Carolina Overview Some examples of observed climate
World Geography Chapter 3
 World Geography Chapter 3 Section 1 A. Introduction a. Weather b. Climate c. Both weather and climate are influenced by i. direct sunlight. ii. iii. iv. the features of the earth s surface. B. The Greenhouse
Climate Outlook through 2100 South Florida Ecological Services Office Vero Beach, FL September 9, 2014
 Climate Outlook through 2100 South Florida Ecological Services Office Vero Beach, FL September 9, 2014 Short Term Drought Map: Short-term (
Seasonal Climate Watch July to November 2018
 Seasonal Climate Watch July to November 2018 Date issued: Jun 25, 2018 1. Overview The El Niño-Southern Oscillation (ENSO) is now in a neutral phase and is expected to rise towards an El Niño phase through
Grenada. General Climate. Recent Climate Trends. UNDP Climate Change Country Profiles. Temperature. Precipitation
 UNDP Climate Change Country Profiles C. McSweeney 1, M. New 1,2 and G. Lizcano 1 1. School of Geography and Environment, University of Oxford. 2. Tyndall Centre for Climate Change Research http://country-profiles.geog.ox.ac.uk
NIWA Outlook: March-May 2015
 March May 2015 Issued: 27 February 2015 Hold mouse over links and press ctrl + left click to jump to the information you require: Overview Regional predictions for the next three months: Northland, Auckland,
Percentage of normal rainfall for April 2018 Departure from average air temperature for April 2018
 New Zealand Climate Update No 227, May 2018 Current climate April 2018 Overall, April 2018 was characterised by lower pressure than normal over and to the southeast of New Zealand. Unlike the first three
ENSO Cycle: Recent Evolution, Current Status and Predictions. Update prepared by Climate Prediction Center / NCEP 5 August 2013
 ENSO Cycle: Recent Evolution, Current Status and Predictions Update prepared by Climate Prediction Center / NCEP 5 August 2013 Outline Overview Recent Evolution and Current Conditions Oceanic Niño Index
PRMS WHITE PAPER 2014 NORTH ATLANTIC HURRICANE SEASON OUTLOOK. June RMS Event Response
 PRMS WHITE PAPER 2014 NORTH ATLANTIC HURRICANE SEASON OUTLOOK June 2014 - RMS Event Response 2014 SEASON OUTLOOK The 2013 North Atlantic hurricane season saw the fewest hurricanes in the Atlantic Basin
Weather and Climate Summary and Forecast Fall/Winter 2016
 Weather and Climate Summary and Forecast Fall/Winter 2016 Gregory V. Jones Southern Oregon University November 5, 2016 After a year where we were seemingly off by a month in terms of temperatures (March
ENSO Cycle: Recent Evolution, Current Status and Predictions. Update prepared by Climate Prediction Center / NCEP 25 February 2013
 ENSO Cycle: Recent Evolution, Current Status and Predictions Update prepared by Climate Prediction Center / NCEP 25 February 2013 Outline Overview Recent Evolution and Current Conditions Oceanic Niño Index
 Page 1 of 5 Home research global climate enso effects Research Effects of El Niño on world weather Precipitation Temperature Tropical Cyclones El Niño affects the weather in large parts of the world. The
New Zealand Climate Update No 226, April 2018 Current climate March 2018
 New Zealand Climate Update No 226, April 2018 Current climate March 2018 March 2018 was characterised by significantly higher pressure than normal to the east of New Zealand. This pressure pattern, in
ENSO Cycle: Recent Evolution, Current Status and Predictions. Update prepared by Climate Prediction Center / NCEP 15 July 2013
 ENSO Cycle: Recent Evolution, Current Status and Predictions Update prepared by Climate Prediction Center / NCEP 15 July 2013 Outline Overview Recent Evolution and Current Conditions Oceanic Niño Index
ENSO Cycle: Recent Evolution, Current Status and Predictions. Update prepared by Climate Prediction Center / NCEP 24 September 2012
 ENSO Cycle: Recent Evolution, Current Status and Predictions Update prepared by Climate Prediction Center / NCEP 24 September 2012 Outline Overview Recent Evolution and Current Conditions Oceanic Niño
Seasonal Climate Watch September 2018 to January 2019
 Seasonal Climate Watch September 2018 to January 2019 Date issued: Aug 31, 2018 1. Overview The El Niño-Southern Oscillation (ENSO) is still in a neutral phase and is still expected to rise towards an
Monthly Long Range Weather Commentary Issued: February 15, 2015 Steven A. Root, CCM, President/CEO
 Monthly Long Range Weather Commentary Issued: February 15, 2015 Steven A. Root, CCM, President/CEO sroot@weatherbank.com JANUARY 2015 Climate Highlights The Month in Review During January, the average
2013 ATLANTIC HURRICANE SEASON OUTLOOK. June RMS Cat Response
 2013 ATLANTIC HURRICANE SEASON OUTLOOK June 2013 - RMS Cat Response Season Outlook At the start of the 2013 Atlantic hurricane season, which officially runs from June 1 to November 30, seasonal forecasts
El Niño 2015/2016 Impact Analysis Monthly Outlook February 2016
 El Niño 2015/2016 Impact Analysis Monthly Outlook February 2016 Linda Hirons, Nicolas Klingaman This report has been produced by University of Reading for Evidence on Demand with the assistance of the
Weather and Climate Summary and Forecast January 2018 Report
 Weather and Climate Summary and Forecast January 2018 Report Gregory V. Jones Linfield College January 5, 2018 Summary: A persistent ridge of high pressure over the west in December produced strong inversions
Impacts of Climate on the Corn Belt
 Impacts of Climate on the Corn Belt Great Lakes Crop Summit 2015 2015 Evelyn Browning Garriss Conclusions Climate change is not linear. It ebbs and flows. Recent polar volcano eruptions created a cool
Seasonal Climate Watch April to August 2018
 Seasonal Climate Watch April to August 2018 Date issued: Mar 23, 2018 1. Overview The El Niño-Southern Oscillation (ENSO) is expected to weaken from a moderate La Niña phase to a neutral phase through
JRC MARS Bulletin global outlook 2017 Crop monitoring European neighbourhood
 MARS Bulletin global outlook 2015-06 7r JRC MARS Bulletin global outlook 2017 Crop monitoring European neighbourhood Russia April 2017 Positive start to the season after winter dormancy The sowing campaign
NIDIS Intermountain West Regional Drought Early Warning System February 7, 2017
 NIDIS Drought and Water Assessment NIDIS Intermountain West Regional Drought Early Warning System February 7, 2017 Precipitation The images above use daily precipitation statistics from NWS COOP, CoCoRaHS,
Summer 2018 Southern Company Temperature/Precipitation Forecast
 Scott A. Yuknis High impact weather forecasts, climate assessment and prediction. 14 Boatwright s Loop Plymouth, MA 02360 Phone/Fax 508.927.4610 Cell: 508.813.3499 ClimateImpact@comcast.net Climate Impact
The science behind southeast Australia s wet, cool summer.
 XXXX The science behind southeast Australia s wet, cool summer. Key facts: 1. For many years scientists have painted a clear picture: that the Earth s surface is warming rapidly and the climate is changing.
Exemplar for Internal Achievement Standard. Mathematics and Statistics Level 3
 Exemplar for internal assessment resource Mathematics and Statistics for Achievement Standard 91580 Exemplar for Internal Achievement Standard Mathematics and Statistics Level 3 This exemplar supports
New Zealand Climate Update No 223, January 2018 Current climate December 2017
 New Zealand Climate Update No 223, January 2018 Current climate December 2017 December 2017 was characterised by higher than normal sea level pressure over New Zealand and the surrounding seas. This pressure
IGAD Climate Prediction and and Applications Centre Monthly Bulletin, August May 2015
 . IGAD Climate Prediction and and Applications Centre Monthly Bulletin, August May 2015 For referencing within this bulletin, the Greater Horn of Africa (GHA) is generally subdivided into three sub-regions:
Meteorology. Circle the letter that corresponds to the correct answer
 Chapter 3 Worksheet 1 Meteorology Name: Circle the letter that corresponds to the correct answer 1) If the maximum temperature for a particular day is 26 C and the minimum temperature is 14 C, the daily
Cape Verde. General Climate. Recent Climate. UNDP Climate Change Country Profiles. Temperature. Precipitation
 UNDP Climate Change Country Profiles C. McSweeney 1, M. New 1,2 and G. Lizcano 1 1. School of Geography and Environment, University of Oxford. 2. Tyndall Centre for Climate Change Research http://country-profiles.geog.ox.ac.uk
Figure 1. Carbon dioxide time series in the North Pacific Ocean (
 Evidence #1: Since 1950, Earth s atmosphere and oceans have changed. The amount of carbon released to the atmosphere has risen. Dissolved carbon in the ocean has also risen. More carbon has increased ocean
DROUGHT MONITORING BULLETIN
 DROUGHT MONITORING BULLETIN 24 th November 2014 Hot Spot Standardized Precipitation Index for time period from November 2013 to April 2014 was, due to the lack of precipitation for months, in major part
but 2012 was dry Most farmers pulled in a crop
 After a winter that wasn t, conditions late in the year pointed to a return to normal snow and cold conditions Most farmers pulled in a crop but 2012 was dry b y M i k e Wr o b l e w s k i, w e a t h e
Upper Missouri River Basin December 2017 Calendar Year Runoff Forecast December 5, 2017
 Upper Missouri River Basin December 2017 Calendar Year Runoff Forecast December 5, 2017 Calendar Year Runoff Forecast Explanation and Purpose of Forecast U.S. Army Corps of Engineers, Northwestern Division
Current and future climate of the Marshall Islands. Pacific-Australia Climate Change Science and Adaptation Planning Program
 Pacific-Australia Climate Change Science and Adaptation Planning Program North Pacific Ocean Bikini Enewetak Ailinginae Rongelap Rongrik Utrik Taka R a Bikar t a Ujelang R a l i k Wotto Ujae C h a Lae
National Wildland Significant Fire Potential Outlook
 National Wildland Significant Fire Potential Outlook National Interagency Fire Center Predictive Services Issued: September, 2007 Wildland Fire Outlook September through December 2007 Significant fire
Summary. peninsula. likely over. parts of. Asia has. have now. season. There is. season, s that the. declining. El Niño. affect the. monsoon.
 Eighth Session of South Asian Climate Outlook Forum (SASCOF-8) Colombo, Sri Lanka, 25-26 April 2016 Consensus Statement Summary Above-normal rainfalll is likely during the 2016 southwest monsoon season
Seasonal Climate Watch November 2017 to March 2018
 Seasonal Climate Watch November 2017 to March 2018 Date issued: Oct 26, 2017 1. Overview The El Niño Southern Oscillation (ENSO) continues to develop towards a La Niña state, and is expected to be in at
Climate Variability and Change Past, Present and Future An Overview
 Climate Variability and Change Past, Present and Future An Overview Dr Jim Salinger National Institute of Water and Atmospheric Research Auckland, New Zealand INTERNATIONAL WORKSHOP ON REDUCING VULNERABILITY
Weather and Climate Summary and Forecast August 2018 Report
 Weather and Climate Summary and Forecast August 2018 Report Gregory V. Jones Linfield College August 5, 2018 Summary: July 2018 will likely go down as one of the top five warmest July s on record for many
Monthly overview. Rainfall
 Monthly overview 1 to 10 April 2018 Widespread rainfall continued to fall over most parts of the summer rainfall region during this period. Unseasonably good rain fell over the eastern half of the Northern
Activity 2.2: Recognizing Change (Observation vs. Inference)
") Activity 2.2: Recognizing Change (Observation vs. Inference) Teacher Notes: Evidence for Climate Change PowerPoint Slide 1 Slide 2 Introduction Image 1 (Namib Desert, Namibia) The sun is on the horizon
Activity 2.2: Recognizing Change (Observation vs. Inference) Teacher Notes: Evidence for Climate Change PowerPoint Slide 1 Slide 2 Introduction Image 1 (Namib Desert, Namibia) The sun is on the horizon
June Current Situation and Outlook
 June 2018 Current Situation and Outlook Sea surface temperatures in the east-central tropical Pacific as well as most of the overlying atmospheric indicators suggest that ENSO-neutral conditions are prevailing;