MATH 2560 C F03 Elementary Statistics I Lecture 1: Displaying Distributions with Graphs. Outline.
|
|
|
- Domenic Wilkins
- 5 years ago
- Views:
Transcription
1 MATH 2560 C F03 Elementary Statistics I Lecture 1: Displaying Distributions with Graphs. Outline. data; variables: categorical & quantitative; distributions; bar graphs & pie charts:
2 What Is Statistics? Statistics is the science of collecting, organizing, and intrepreting numerical facts, which we call data. Individuals: A data set contains information on a collection of individuals: people, animals, things, etc. The data for one individual make up a case. What are Data? Data Variables: For each individual, the data give values for one or more variables. A variable describes some characteristic of an individual, such as a person s height, gender, or salary. What are Variables? Categorical: Some variables are categorical (place each individual into a category, such as male or female) Variables Quantitative: others variables are quantitative (have numerical values that measure some characteristic of each individual, such as height in cm or annual salary in dollars). CyberStat Corporation Data about its Employees 0 A: B: C: D: E: F: 1 Name Age Gender Race Salary Job Type 2 Fleetwood, Delores 39 Female White 62,100 Management 3 Perez, Juan 27 Male White 47,350 Technical 4 Wang, Lin 22 Female Asian 18,250 Clerical 5 Johnson, LaVeme 48 Male Black 77,600 Management Each row records data on one individual. Each row of data calles a case. Each column contains the values of one variable for all the individuals. There are 5 variables: gender+ race+job type=3 are categorical variables, and age+salary=2 in dollars are quantitative variables. Exploratory data analysis uses graphs and numerical summaries to describe the variables in a data set and the relations among them.

3 Distributions of Categorical Variables. The distribution of a variable tells us what values it takes and how often it takes these values. Bar graphs display the distributions of categorical variables with bars Categorical Variables Pie charts display the distributions with pie charts. Distribution of Marital Status for All Americans Age 18 and Over Marital Status: Count (millions): Percent: Never married Married Widowed Divorced
 digit and a leaf, the final digit.")
4 Stemplots and Histograms. Stemplots and histograms display the distributions of quantitative variables. Stemplots. Stemplots separate each observation into a stem and one-digit leaf. How to make a stemplot? To make a stemplot: 1. Separate each observation into a stem consisting of all but the final (rightmost) digit and a leaf, the final digit. Stems may have as many digits as needed, but each leaf contains only a single digit. 2. Write the stems in a vertical column with the smallest at the top, and draw a vertical line at the right of this column. 3. Write each leaf in the row to the right of its stem, in increasing order out from the stem. Examples. Example 1.4.a. Babe Ruth s Home Runs hits of 15 Years
5 Stemplot of the Data in Example 1.4.a (a) (b) (c) (a) write the stems; (b) go through the data writing each leaf on the proper stem; (c) arrange the leaves on each stem in order out from the stem. Example 1.4.b Roger Maris home runs hits of 10 years Back-to-Back Stemplot. Stemplot Comparing of the Data of the Exs 1.4.a and 1.4.b Ruth Maris
6 Example 1.5 A marketing consultant observed 50 consecutive shoppers at a supermarket. One variable of interest was how much each shopper spent in the store. Below, there are the data (in dollars), arrangedin increasing order: Supermarket Spending Figure 1.3 (a). Stemplot without splitting the stems (Example 1.5.)
7 Stemplot with splitting the stems (Example 1.5.)
8 Histograms. A histogram breaks the range of values of a variable into intervals and displays only the count or percent of the observations that fall into each interval. Histograms plot the frequencies or relative frequencies of classes of values. Example 1.9. Examining the performance of 947 Gary, Indiana, seventh graders on the reading portion. Their vocabulary scores, expressed as an equivalent grade level, ranged from 2.0 to The score of the first few of the 947 student are: 5.4, 6.8, 2.0, 7.6, 6.6, 7.8, 8.1, 5.6, 6.0, 7.9, 2.9,... How to make a Histogram? To make a histogram proceed as follows: 1. Divide the range of the data into classes of equal width. 2. Count the number of observations in each classes. These counts are called frequencies, and a table of frequencies for all classes is a frequency table. 3. Draw the histogram. To make a histogram of the distribution of scores, proceed as follows: 1. Divide the range of the data into classes of equal width. In this case,it is natural to use grade levels, so the classes are: [2.0, 3], [3.0, 4.0],..., [12.0, 13.0]. 2. Count the number of observations in each classes. Table 1.2 is a frequency table of the Gray vocabulary scores. 3. Draw the histogram. In the histogram in Figure 1.4, the4 vocabulary score scale is horizontal and the frequency scale is vertical.

9 Table 1.2 for the Data of Example 1.9. Vocabulary Scores for Seventh Graders, Gary, Indiana Class: Number of Students: Percent: Total Frequencies (counts) or relative frequencies (percents or fractions) are summarized a large number of observations on a single variable in a table.
10 Examining a Distribution. Look for shape, center, and spread and for clear deviations from the overall shape to examine a distribution. The center of a distribution is described by its midpoint, the value with roughly half the observations taking smaller values and half taking larger values. The spread of a distribution is described by giving the range between the smallest and largest values. The shape is described by one or several major peaks, called modes, and by symmetric or skewed in one direction form. A distribution with one major peak is called unimodal. A distribution is symmetric if the values smaller and larger than its midpoint are mirror images of each other. A distribution is skewed to the right if the right tail (larger values) is much longer than the left tail (smaller values). Outliers are observations that lie outside the overall pattern of a distribution. Example 1. The distribution of Babe Ruth s home run counts is symmetric and unimodal. The midpoint is 46 home runs, and the range (spread) is from 22 (smallest value) to 60 (largest value). There are no outlier. In particular, Ruth s record 60 home runs in one season does not stand outside his overall pattern. Example 2. Maris s 61 home run season, on the other hand, is an outlier that stands far above his other years. Maris s peformance (without the outlier) is roughly symmetric with midpoint 23 and range 8 to 39. Example 3. The distribution of supermarket spending (Figure 1.3(a)) is skewed to the right. The direction of the long tail (to the right) determines the direction of skewness. Because the largest amounts do not fall outside the overall skewed pattern, we do not call them outliers. The midpoint of the distribution (count up 25 entries in the stemplot) is 28D. The range is 3 to 93D. The distribution is unimodal. The right-skewed shape in Figure 1.3. is common among distributions of money amounts.

11 Table 1.1. Newcomb s measurements of the passage time of light

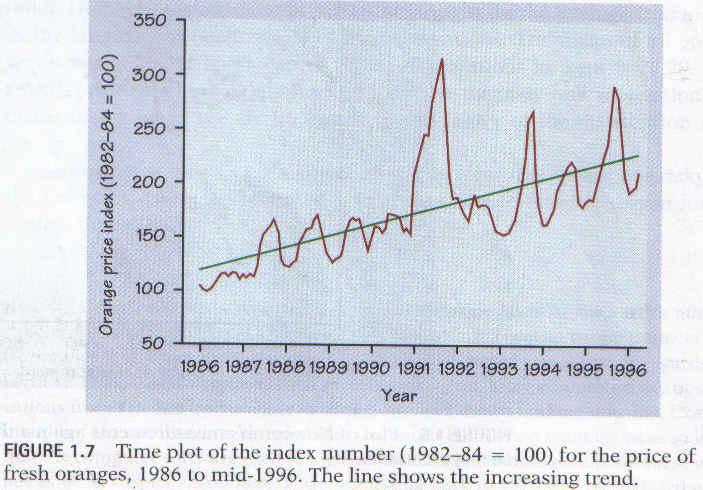
12 Time Plots A time plot is the plot for observations on a variable which are taken over time. To make a plot graph time horizontally and the values of the variable vertically. A time plot can reveal trends or other changes over time such as seasonal variation.

13
Chapter 2: Tools for Exploring Univariate Data
 Stats 11 (Fall 2004) Lecture Note Introduction to Statistical Methods for Business and Economics Instructor: Hongquan Xu Chapter 2: Tools for Exploring Univariate Data Section 2.1: Introduction What is
STP 420 INTRODUCTION TO APPLIED STATISTICS NOTES
 INTRODUCTION TO APPLIED STATISTICS NOTES PART - DATA CHAPTER LOOKING AT DATA - DISTRIBUTIONS Individuals objects described by a set of data (people, animals, things) - all the data for one individual make
Elementary Statistics
 Elementary Statistics Q: What is data? Q: What does the data look like? Q: What conclusions can we draw from the data? Q: Where is the middle of the data? Q: Why is the spread of the data important? Q:
Chapter 5: Exploring Data: Distributions Lesson Plan
 Lesson Plan Exploring Data Displaying Distributions: Histograms Interpreting Histograms Displaying Distributions: Stemplots Describing Center: Mean and Median Describing Variability: The Quartiles The
CHAPTER 5: EXPLORING DATA DISTRIBUTIONS. Individuals are the objects described by a set of data. These individuals may be people, animals or things.
 (c) Epstein 2013 Chapter 5: Exploring Data Distributions Page 1 CHAPTER 5: EXPLORING DATA DISTRIBUTIONS 5.1 Creating Histograms Individuals are the objects described by a set of data. These individuals
CHAPTER 1 Exploring Data
 CHAPTER 1 Exploring Data 1.2 Displaying Quantitative Data with Graphs The Practice of Statistics, 5th Edition Starnes, Tabor, Yates, Moore Bedford Freeman Worth Publishers Displaying Quantitative Data
are the objects described by a set of data. They may be people, animals or things.
 ( c ) E p s t e i n, C a r t e r a n d B o l l i n g e r 2016 C h a p t e r 5 : E x p l o r i n g D a t a : D i s t r i b u t i o n s P a g e 1 CHAPTER 5: EXPLORING DATA DISTRIBUTIONS 5.1 Creating Histograms
Chapter 5: Exploring Data: Distributions Lesson Plan
 Lesson Plan Exploring Data Displaying Distributions: Histograms For All Practical Purposes Mathematical Literacy in Today s World, 7th ed. Interpreting Histograms Displaying Distributions: Stemplots Describing
Chapter 1. Looking at Data
 Chapter 1 Looking at Data Types of variables Looking at Data Be sure that each variable really does measure what you want it to. A poor choice of variables can lead to misleading conclusions!! For example,
Introduction to Statistics
 Introduction to Statistics Data and Statistics Data consists of information coming from observations, counts, measurements, or responses. Statistics is the science of collecting, organizing, analyzing,
Example 2. Given the data below, complete the chart:
 Statistics 2035 Quiz 1 Solutions Example 1. 2 64 150 150 2 128 150 2 256 150 8 8 Example 2. Given the data below, complete the chart: 52.4, 68.1, 66.5, 75.0, 60.5, 78.8, 63.5, 48.9, 81.3 n=9 The data is
Topic 3: Introduction to Statistics. Algebra 1. Collecting Data. Table of Contents. Categorical or Quantitative? What is the Study of Statistics?!
 Topic 3: Introduction to Statistics Collecting Data We collect data through observation, surveys and experiments. We can collect two different types of data: Categorical Quantitative Algebra 1 Table of
CHAPTER 1. Introduction
 CHAPTER 1 Introduction Engineers and scientists are constantly exposed to collections of facts, or data. The discipline of statistics provides methods for organizing and summarizing data, and for drawing
Lecture 2. Quantitative variables. There are three main graphical methods for describing, summarizing, and detecting patterns in quantitative data:
 Lecture 2 Quantitative variables There are three main graphical methods for describing, summarizing, and detecting patterns in quantitative data: Stemplot (stem-and-leaf plot) Histogram Dot plot Stemplots
What is statistics? Statistics is the science of: Collecting information. Organizing and summarizing the information collected
 What is statistics? Statistics is the science of: Collecting information Organizing and summarizing the information collected Analyzing the information collected in order to draw conclusions Two types
Chapter. Organizing and Summarizing Data. Copyright 2013, 2010 and 2007 Pearson Education, Inc.
 Chapter 2 Organizing and Summarizing Data Section 2.1 Organizing Qualitative Data Objectives 1. Organize Qualitative Data in Tables 2. Construct Bar Graphs 3. Construct Pie Charts When data is collected
Prelude: The Case of the Missing Vans
 Prelude: The Case of the Missing Vans Auto manufacturers lend their dealers money to help them keep vehicles on their lots. The loans are repaid when the vehicles are sold. A Long Island auto dealer named
Histograms allow a visual interpretation
 Chapter 4: Displaying and Summarizing i Quantitative Data s allow a visual interpretation of quantitative (numerical) data by indicating the number of data points that lie within a range of values, called
Percentile: Formula: To find the percentile rank of a score, x, out of a set of n scores, where x is included:
 AP Statistics Chapter 2 Notes 2.1 Describing Location in a Distribution Percentile: The pth percentile of a distribution is the value with p percent of the observations (If your test score places you in
8/4/2009. Describing Data with Graphs
 Describing Data with Graphs 1 A variable is a characteristic that changes or varies over time and/or for different individuals or objects under consideration. Examples: Hair color, white blood cell count,
Describing distributions with numbers
 Describing distributions with numbers A large number or numerical methods are available for describing quantitative data sets. Most of these methods measure one of two data characteristics: The central
QUANTITATIVE DATA. UNIVARIATE DATA data for one variable
 QUANTITATIVE DATA Recall that quantitative (numeric) data values are numbers where data take numerical values for which it is sensible to find averages, such as height, hourly pay, and pulse rates. UNIVARIATE
Describing distributions with numbers
 Describing distributions with numbers A large number or numerical methods are available for describing quantitative data sets. Most of these methods measure one of two data characteristics: The central
MATH 1150 Chapter 2 Notation and Terminology
 MATH 1150 Chapter 2 Notation and Terminology Categorical Data The following is a dataset for 30 randomly selected adults in the U.S., showing the values of two categorical variables: whether or not the
Shape, Outliers, Center, Spread Frequency and Relative Histograms Related to other types of graphical displays
 Histograms: Shape, Outliers, Center, Spread Frequency and Relative Histograms Related to other types of graphical displays Sep 9 1:13 PM Shape: Skewed left Bell shaped Symmetric Bi modal Symmetric Skewed
Sampling, Frequency Distributions, and Graphs (12.1)
") 1 Sampling, Frequency Distributions, and Graphs (1.1) Design: Plan how to obtain the data. What are typical Statistical Methods? Collect the data, which is then subjected to statistical analysis, which
1 Sampling, Frequency Distributions, and Graphs (1.1) Design: Plan how to obtain the data. What are typical Statistical Methods? Collect the data, which is then subjected to statistical analysis, which
Chapter2 Description of samples and populations. 2.1 Introduction.
 Chapter2 Description of samples and populations. 2.1 Introduction. Statistics=science of analyzing data. Information collected (data) is gathered in terms of variables (characteristics of a subject that
Stat 101 Exam 1 Important Formulas and Concepts 1
 1 Chapter 1 1.1 Definitions Stat 101 Exam 1 Important Formulas and Concepts 1 1. Data Any collection of numbers, characters, images, or other items that provide information about something. 2. Categorical/Qualitative
CIVL 7012/8012. Collection and Analysis of Information
 CIVL 7012/8012 Collection and Analysis of Information Uncertainty in Engineering Statistics deals with the collection and analysis of data to solve real-world problems. Uncertainty is inherent in all real
STAT 200 Chapter 1 Looking at Data - Distributions
 STAT 200 Chapter 1 Looking at Data - Distributions What is Statistics? Statistics is a science that involves the design of studies, data collection, summarizing and analyzing the data, interpreting the
Units. Exploratory Data Analysis. Variables. Student Data
 Units Exploratory Data Analysis Bret Larget Departments of Botany and of Statistics University of Wisconsin Madison Statistics 371 13th September 2005 A unit is an object that can be measured, such as
Frequency and Histograms
 Warm Up Lesson Presentation Lesson Quiz Algebra 1 Create stem-and-leaf plots. Objectives Create frequency tables and histograms. Vocabulary stem-and-leaf plot frequency frequency table histogram cumulative
FREQUENCY DISTRIBUTIONS AND PERCENTILES
 FREQUENCY DISTRIBUTIONS AND PERCENTILES New Statistical Notation Frequency (f): the number of times a score occurs N: sample size Simple Frequency Distributions Raw Scores The scores that we have directly
A is one of the categories into which qualitative data can be classified.
 Chapter 2 Methods for Describing Sets of Data 2.1 Describing qualitative data Recall qualitative data: non-numerical or categorical data Basic definitions: A is one of the categories into which qualitative
Chapter 3: The Normal Distributions
 Chapter 3: The Normal Distributions http://www.yorku.ca/nuri/econ2500/econ2500-online-course-materials.pdf graphs-normal.doc / histogram-density.txt / normal dist table / ch3-image Ch3 exercises: 3.2,
Chapter 5. Understanding and Comparing. Distributions
 STAT 141 Introduction to Statistics Chapter 5 Understanding and Comparing Distributions Bin Zou (bzou@ualberta.ca) STAT 141 University of Alberta Winter 2015 1 / 27 Boxplots How to create a boxplot? Assume
Lecture 6: Chapter 4, Section 2 Quantitative Variables (Displays, Begin Summaries)
") Lecture 6: Chapter 4, Section 2 Quantitative Variables (Displays, Begin Summaries) Summarize with Shape, Center, Spread Displays: Stemplots, Histograms Five Number Summary, Outliers, Boxplots Cengage Learning
Lecture 6: Chapter 4, Section 2 Quantitative Variables (Displays, Begin Summaries) Summarize with Shape, Center, Spread Displays: Stemplots, Histograms Five Number Summary, Outliers, Boxplots Cengage Learning
Further Mathematics 2018 CORE: Data analysis Chapter 2 Summarising numerical data
 Chapter 2: Summarising numerical data Further Mathematics 2018 CORE: Data analysis Chapter 2 Summarising numerical data Extract from Study Design Key knowledge Types of data: categorical (nominal and ordinal)
Math 223 Lecture Notes 3/15/04 From The Basic Practice of Statistics, bymoore
 Math 223 Lecture Notes 3/15/04 From The Basic Practice of Statistics, bymoore Chapter 3 continued Describing distributions with numbers Measuring spread of data: Quartiles Definition 1: The interquartile
Chapter 4. Displaying and Summarizing. Quantitative Data
 STAT 141 Introduction to Statistics Chapter 4 Displaying and Summarizing Quantitative Data Bin Zou (bzou@ualberta.ca) STAT 141 University of Alberta Winter 2015 1 / 31 4.1 Histograms 1 We divide the range
The Empirical Rule, z-scores, and the Rare Event Approach
 Overview The Empirical Rule, z-scores, and the Rare Event Approach Look at Chebyshev s Rule and the Empirical Rule Explore some applications of the Empirical Rule How to calculate and use z-scores Introducing
Chapter 1: Exploring Data
 Chapter 1: Exploring Data Section 1.2 with Graphs The Practice of Statistics, 4 th edition - For AP* STARNES, YATES, MOORE Chapter 1 Exploring Data Introduction: Data Analysis: Making Sense of Data 1.1
What is Statistics? Statistics is the science of understanding data and of making decisions in the face of variability and uncertainty.
 What is Statistics? Statistics is the science of understanding data and of making decisions in the face of variability and uncertainty. Statistics is a field of study concerned with the data collection,
AP Final Review II Exploring Data (20% 30%)
") AP Final Review II Exploring Data (20% 30%) Quantitative vs Categorical Variables Quantitative variables are numerical values for which arithmetic operations such as means make sense. It is usually a measure
AP Final Review II Exploring Data (20% 30%) Quantitative vs Categorical Variables Quantitative variables are numerical values for which arithmetic operations such as means make sense. It is usually a measure
MATH 10 INTRODUCTORY STATISTICS
 MATH 10 INTRODUCTORY STATISTICS Tommy Khoo Your friendly neighbourhood graduate student. Week 1 Chapter 1 Introduction What is Statistics? Why do you need to know Statistics? Technical lingo and concepts:
Assignments. Statistics Workshop 1: Introduction to R. Tuesday May 26, Atoms, Vectors and Matrices
 Statistics Workshop 1: Introduction to R. Tuesday May 26, 2009 Assignments Generally speaking, there are three basic forms of assigning data. Case one is the single atom or a single number. Assigning a
Statistics lecture 3. Bell-Shaped Curves and Other Shapes
 Statistics lecture 3 Bell-Shaped Curves and Other Shapes Goals for lecture 3 Realize many measurements in nature follow a bell-shaped ( normal ) curve Understand and learn to compute a standardized score
Describing Distributions with Numbers
 Describing Distributions with Numbers Using graphs, we could determine the center, spread, and shape of the distribution of a quantitative variable. We can also use numbers (called summary statistics)
Chapter 6 The Normal Distribution
 Chapter 6 The Normal PSY 395 Oswald Outline s and area The normal distribution The standard normal distribution Setting probable limits on a score/observation Measures related to 2 s and Area The idea
Lecture 1: Descriptive Statistics
 Lecture 1: Descriptive Statistics MSU-STT-351-Sum 15 (P. Vellaisamy: MSU-STT-351-Sum 15) Probability & Statistics for Engineers 1 / 56 Contents 1 Introduction 2 Branches of Statistics Descriptive Statistics
SESSION 5 Descriptive Statistics
 SESSION 5 Descriptive Statistics Descriptive statistics are used to describe the basic features of the data in a study. They provide simple summaries about the sample and the measures. Together with simple
22S:105 Statistical Methods and Computing. Graphical Depiction of Qualitative and Quantitative Data and Measures of Central Tendency
 22S:105 Statistical Methods and Computing Graphical Depiction of Qualitative and Quantitative Data and Measures of Central Tendency 1 2 Bar charts for nominal and ordinal data present a frequency distribution
STT 315 This lecture is based on Chapter 2 of the textbook.
 STT 315 This lecture is based on Chapter 2 of the textbook. Acknowledgement: Author is thankful to Dr. Ashok Sinha, Dr. Jennifer Kaplan and Dr. Parthanil Roy for allowing him to use/edit some of their
Chapter 6 Group Activity - SOLUTIONS
 Chapter 6 Group Activity - SOLUTIONS Group Activity Summarizing a Distribution 1. The following data are the number of credit hours taken by Math 105 students during a summer term. You will be analyzing
Lecture 3B: Chapter 4, Section 2 Quantitative Variables (Displays, Begin Summaries)
") Lecture 3B: Chapter 4, Section 2 Quantitative Variables (Displays, Begin Summaries) Summarize with Shape, Center, Spread Displays: Stemplots, Histograms Five Number Summary, Outliers, Boxplots Mean vs.
Lecture 3B: Chapter 4, Section 2 Quantitative Variables (Displays, Begin Summaries) Summarize with Shape, Center, Spread Displays: Stemplots, Histograms Five Number Summary, Outliers, Boxplots Mean vs.
The empirical ( ) rule
 rule") The empirical (68-95-99.7) rule With a bell shaped distribution, about 68% of the data fall within a distance of 1 standard deviation from the mean. 95% fall within 2 standard deviations of the mean. 99.7%
The empirical (68-95-99.7) rule With a bell shaped distribution, about 68% of the data fall within a distance of 1 standard deviation from the mean. 95% fall within 2 standard deviations of the mean. 99.7%
Chapter 3: Displaying and summarizing quantitative data p52 The pattern of variation of a variable is called its distribution.
 Chapter 3: Displaying and summarizing quantitative data p52 The pattern of variation of a variable is called its distribution. 1 Histograms p53 The breakfast cereal data Study collected data on nutritional
+ Check for Understanding
 n Measuring Position: Percentiles n One way to describe the location of a value in a distribution is to tell what percent of observations are less than it. Definition: The p th percentile of a distribution
Math 082 Final Examination Review
 Math 08 Final Examination Review 1) Write the equation of the line that passes through the points (4, 6) and (0, 3). Write your answer in slope-intercept form. ) Write the equation of the line that passes
1-1. Chapter 1. Sampling and Descriptive Statistics by The McGraw-Hill Companies, Inc. All rights reserved.
 1-1 Chapter 1 Sampling and Descriptive Statistics 1-2 Why Statistics? Deal with uncertainty in repeated scientific measurements Draw conclusions from data Design valid experiments and draw reliable conclusions
Vocabulary: Data About Us
 Vocabulary: Data About Us Two Types of Data Concept Numerical data: is data about some attribute that must be organized by numerical order to show how the data varies. For example: Number of pets Measure
Math 140 Introductory Statistics
 Math 140 Introductory Statistics Professor Silvia Fernández Chapter 2 Based on the book Statistics in Action by A. Watkins, R. Scheaffer, and G. Cobb. Visualizing Distributions Recall the definition: The
Math 140 Introductory Statistics
 Visualizing Distributions Math 140 Introductory Statistics Professor Silvia Fernández Chapter Based on the book Statistics in Action by A. Watkins, R. Scheaffer, and G. Cobb. Recall the definition: The
Final Exam STAT On a Pareto chart, the frequency should be represented on the A) X-axis B) regression C) Y-axis D) none of the above
 X-axis B) regression C) Y-axis D) none of the above") King Abdul Aziz University Faculty of Sciences Statistics Department Final Exam STAT 0 First Term 49-430 A 40 Name No ID: Section: You have 40 questions in 9 pages. You have 90 minutes to solve the exam.
King Abdul Aziz University Faculty of Sciences Statistics Department Final Exam STAT 0 First Term 49-430 A 40 Name No ID: Section: You have 40 questions in 9 pages. You have 90 minutes to solve the exam.
Chapter 2: Summarizing and Graphing Data
 Chapter 2: Summarizing and Graphing Data 9 Chapter 2: Summarizing and Graphing Data Section 2-2 1. No. For each class, the frequency tells us how many values fall within the given range of values, but
(quantitative or categorical variables) Numerical descriptions of center, variability, position (quantitative variables)
 Numerical descriptions of center, variability, position (quantitative variables)") 3. Descriptive Statistics Describing data with tables and graphs (quantitative or categorical variables) Numerical descriptions of center, variability, position (quantitative variables) Bivariate descriptions
3. Descriptive Statistics Describing data with tables and graphs (quantitative or categorical variables) Numerical descriptions of center, variability, position (quantitative variables) Bivariate descriptions
Introduction to Probability and Statistics Slides 1 Chapter 1
 1 Introduction to Probability and Statistics Slides 1 Chapter 1 Prof. Ammar M. Sarhan, asarhan@mathstat.dal.ca Department of Mathematics and Statistics, Dalhousie University Fall Semester 2010 Course outline
Performance of fourth-grade students on an agility test
 Starter Ch. 5 2005 #1a CW Ch. 4: Regression L1 L2 87 88 84 86 83 73 81 67 78 83 65 80 50 78 78? 93? 86? Create a scatterplot Find the equation of the regression line Predict the scores Chapter 5: Understanding
Remember your SOCS! S: O: C: S:
 Remember your SOCS! S: O: C: S: 1.1: Displaying Distributions with Graphs Dotplot: Age of your fathers Low scale: 45 High scale: 75 Doesn t have to start at zero, just cover the range of the data Label
Practice Questions for Exam 1
 Practice Questions for Exam 1 1. A used car lot evaluates their cars on a number of features as they arrive in the lot in order to determine their worth. Among the features looked at are miles per gallon
Graphing Data. Example:
 Graphing Data Bar graphs and line graphs are great for looking at data over time intervals, or showing the rise and fall of a quantity over the passage of time. Example: Auto Sales by Year Year Number
1.3.1 Measuring Center: The Mean
 1.3.1 Measuring Center: The Mean Mean - The arithmetic average. To find the mean (pronounced x bar) of a set of observations, add their values and divide by the number of observations. If the n observations
TOPIC: Descriptive Statistics Single Variable
 TOPIC: Descriptive Statistics Single Variable I. Numerical data summary measurements A. Measures of Location. Measures of central tendency Mean; Median; Mode. Quantiles - measures of noncentral tendency
Chapter 3. Data Description
 Chapter 3. Data Description Graphical Methods Pie chart It is used to display the percentage of the total number of measurements falling into each of the categories of the variable by partition a circle.
LC OL - Statistics. Types of Data
 LC OL - Statistics Types of Data Question 1 Characterise each of the following variables as numerical or categorical. In each case, list any three possible values for the variable. (i) Eye colours in a
M 140 Test 1 B Name (1 point) SHOW YOUR WORK FOR FULL CREDIT! Problem Max. Points Your Points Total 75
 SHOW YOUR WORK FOR FULL CREDIT! Problem Max. Points Your Points Total 75") M 140 est 1 B Name (1 point) SHOW YOUR WORK FOR FULL CREDI! Problem Max. Points Your Points 1-10 10 11 10 12 3 13 4 14 18 15 8 16 7 17 14 otal 75 Multiple choice questions (1 point each) For questions
M 140 est 1 B Name (1 point) SHOW YOUR WORK FOR FULL CREDI! Problem Max. Points Your Points 1-10 10 11 10 12 3 13 4 14 18 15 8 16 7 17 14 otal 75 Multiple choice questions (1 point each) For questions
Data Analysis and Statistical Methods Statistics 651
 Data Analysis and Statistical Methods Statistics 651 http://www.stat.tamu.edu/~suhasini/teaching/ Suhasini Subba Rao Review In the previous lecture we looked at the statistics of M&Ms. This example illustrates
Chapter 4: Displaying and Summarizing Quantitative Data
 Chapter 4: Displaying and Summarizing Quantitative Data This chapter discusses methods of displaying quantitative data. The objective is describe the distribution of the data. The figure below shows three
ANOVA - analysis of variance - used to compare the means of several populations.
 12.1 One-Way Analysis of Variance ANOVA - analysis of variance - used to compare the means of several populations. Assumptions for One-Way ANOVA: 1. Independent samples are taken using a randomized design.
download instant at
 Chapter 2 Test B Multiple Choice Section 2.1 (Visualizing Variation in Numerical Data) 1. [Objective: Interpret visual displays of numerical data] For twenty days a record store owner counts the number
Resistant Measure - A statistic that is not affected very much by extreme observations.
 Chapter 1.3 Lecture Notes & Examples Section 1.3 Describing Quantitative Data with Numbers (pp. 50-74) 1.3.1 Measuring Center: The Mean Mean - The arithmetic average. To find the mean (pronounced x bar)
Statistics 511 Additional Materials
 Graphical Summaries Consider the following data x: 78, 24, 57, 39, 28, 30, 29, 18, 102, 34, 52, 54, 57, 82, 90, 94, 38, 59, 27, 68, 61, 39, 81, 43, 90, 40, 39, 33, 42, 15, 88, 94, 50, 66, 75, 79, 83, 34,31,36,
1 Probability Distributions
 1 Probability Distributions In the chapter about descriptive statistics sample data were discussed, and tools introduced for describing the samples with numbers as well as with graphs. In this chapter
(a) Find the value of x. (4) Write down the standard deviation. (2) (Total 6 marks)
 Find the value of x. (4) Write down the standard deviation. (2) (Total 6 marks)") 1. The following frequency distribution of marks has mean 4.5. Mark 1 2 3 4 5 6 7 Frequency 2 4 6 9 x 9 4 Find the value of x. (4) Write down the standard deviation. (Total 6 marks) 2. The following table
1. The following frequency distribution of marks has mean 4.5. Mark 1 2 3 4 5 6 7 Frequency 2 4 6 9 x 9 4 Find the value of x. (4) Write down the standard deviation. (Total 6 marks) 2. The following table
Exploring Data. How to Explore Data
 Exploring Data Statistics is the art and science of learning from data. This may include: Designing appropriate tools to collect data. Organizing data in a meaningful way. Displaying data with appropriate
Chapter 01 : What is Statistics?
 Chapter 01 : What is Statistics? Feras Awad Data: The information coming from observations, counts, measurements, and responses. Statistics: The science of collecting, organizing, analyzing, and interpreting
Biostatistics Presentation of data DR. AMEER KADHIM HUSSEIN M.B.CH.B.FICMS (COM.)
") Biostatistics Presentation of data DR. AMEER KADHIM HUSSEIN M.B.CH.B.FICMS (COM.) PRESENTATION OF DATA 1. Mathematical presentation (measures of central tendency and measures of dispersion). 2. Tabular
Biostatistics Presentation of data DR. AMEER KADHIM HUSSEIN M.B.CH.B.FICMS (COM.) PRESENTATION OF DATA 1. Mathematical presentation (measures of central tendency and measures of dispersion). 2. Tabular
Comparing Measures of Central Tendency *
 OpenStax-CNX module: m11011 1 Comparing Measures of Central Tendency * David Lane This work is produced by OpenStax-CNX and licensed under the Creative Commons Attribution License 1.0 1 Comparing Measures
Chapter 1 Introduction & 1.1: Analyzing Categorical Data
 Chapter 1 Chapter 1 Introduction & 1.1: Analyzing Categorical Data Population Sample Make an inference about the population. Collect data from a representative sample... Perform Data Analysis, keeping
QUIZ 1 (CHAPTERS 1-4) SOLUTIONS MATH 119 FALL 2012 KUNIYUKI 105 POINTS TOTAL, BUT 100 POINTS
 SOLUTIONS MATH 119 FALL 2012 KUNIYUKI 105 POINTS TOTAL, BUT 100 POINTS") QUIZ 1 (CHAPTERS 1-4) SOLUTIONS MATH 119 FALL 2012 KUNIYUKI 105 POINTS TOTAL, BUT 100 POINTS = 100% Show all work, simplify as appropriate, and use good form and procedure (as in class). Box in your final
QUIZ 1 (CHAPTERS 1-4) SOLUTIONS MATH 119 FALL 2012 KUNIYUKI 105 POINTS TOTAL, BUT 100 POINTS = 100% Show all work, simplify as appropriate, and use good form and procedure (as in class). Box in your final
Measures of. U4 C 1.2 Dot plot and Histogram 2 January 15 16, 2015
 U4 C 1. Dot plot and Histogram January 15 16, 015 U 4 : C 1.1 CCSS. 9 1.S ID.1 Dot Plots and Histograms Objective: We will be able to represent data with plots on the real number line, using: Dot Plots
Samples and Surveys pp
 LESSON 4-1 Samples and Surveys pp. 174 175 Vocabulary population (p. 174) sample (p. 174) biased sample (p. 174) random sample (p. 175) systematic sample (p. 175) stratified sample (p. 175) Additional
STAT 3900/4950 MIDTERM TWO Name: Spring, 2015 (print: first last ) Covered topics: Two-way ANOVA, ANCOVA, SLR, MLR and correlation analysis
 Covered topics: Two-way ANOVA, ANCOVA, SLR, MLR and correlation analysis") STAT 3900/4950 MIDTERM TWO Name: Spring, 205 (print: first last ) Covered topics: Two-way ANOVA, ANCOVA, SLR, MLR and correlation analysis Instructions: You may use your books, notes, and SPSS/SAS. NO
STAT 3900/4950 MIDTERM TWO Name: Spring, 205 (print: first last ) Covered topics: Two-way ANOVA, ANCOVA, SLR, MLR and correlation analysis Instructions: You may use your books, notes, and SPSS/SAS. NO
Lecture 1: Description of Data. Readings: Sections 1.2,
 Lecture 1: Description of Data Readings: Sections 1.,.1-.3 1 Variable Example 1 a. Write two complete and grammatically correct sentences, explaining your primary reason for taking this course and then
Lecture Slides. Elementary Statistics Twelfth Edition. by Mario F. Triola. and the Triola Statistics Series. Section 3.1- #
 Lecture Slides Elementary Statistics Twelfth Edition and the Triola Statistics Series by Mario F. Triola Chapter 3 Statistics for Describing, Exploring, and Comparing Data 3-1 Review and Preview 3-2 Measures
Tables Table A Table B Table C Table D Table E 675
 BMTables.indd Page 675 11/15/11 4:25:16 PM user-s163 Tables Table A Standard Normal Probabilities Table B Random Digits Table C t Distribution Critical Values Table D Chi-square Distribution Critical Values
Sociology 6Z03 Review I
 Sociology 6Z03 Review I John Fox McMaster University Fall 2016 John Fox (McMaster University) Sociology 6Z03 Review I Fall 2016 1 / 19 Outline: Review I Introduction Displaying Distributions Describing
Lecture 28 Chi-Square Analysis
 Lecture 28 STAT 225 Introduction to Probability Models April 23, 2014 Whitney Huang Purdue University 28.1 χ 2 test for For a given contingency table, we want to test if two have a relationship or not
UCLA STAT 10 Statistical Reasoning - Midterm Review Solutions Observational Studies, Designed Experiments & Surveys
 UCLA STAT 10 Statistical Reasoning - Midterm Review Solutions Observational Studies, Designed Experiments & Surveys.. 1. (i) The treatment being compared is: (ii). (5) 3. (3) 4. (4) Study 1: the number
9.7 Statistics and Data (Graphical)
") SECTION 9.7 Statistics and Data (Graphical) 693 9.7 Statistics and Data (Graphical) What you ll learn about Statistics Displaying Categorical Data Stemplots Frequency Tables Histograms Time Plots... and
SECTION 9.7 Statistics and Data (Graphical) 693 9.7 Statistics and Data (Graphical) What you ll learn about Statistics Displaying Categorical Data Stemplots Frequency Tables Histograms Time Plots... and