GEOPHYSICAL GAMMA-RAY SPECTROMETER
|
|
|
- Diane Austin
- 5 years ago
- Views:
Transcription

1 CZECH REPUBLIC GEOPHYSICAL GAMMA-RAY SPECTROMETER GRM-260 Operating Manual Version 2.0 Brno, October 2001
2 Contents Technical specifications 3 1. Theory 4 2. Operating Instructions GRM-260 Preparation Measurement Spectrum Dose Rate Viewer Calibration Measurement using external PC Single Spectrum Profile Measurement Dose Rate Indication Working Settings Spectrum Viewer Calibration Data Transfer to PC Maintenance Trouble Shooting 32 2
3 Technical Specifications Detector NaI(Tl) or BGO 2 x2 with shielded photomultiplier geometrical center is placed in the middle of the casing at 45 mm distance from the front side Energy resolution better than 8.5% for NaI(Tl) (at MeV) better than 13.0% for BGO (at MeV) Energy range to 3 MeV Reference source 137 Cs, activity 10 kbq Pulse shaping Semi-Gaussian, 1 µs Analyzer 256 channels, up to pulses per second 4 ROIs K, U, Th assays calibrated in %, ppm, ppm dose rate measurement in ngy/h or U equiv Working modes single spectrum profile measurement dose rate indication Control unit numeric keyboard with graphic backlit screen or user s PC PC interface RS 232C Power supply rechargeable batteries (min. 15 hours life time) Dimensions 270 x 130 x 180 mm (length, width, height) Weight 3.1 kg Ambient conditions -10 to +60 o C dropping water resistant Standard accessories battery charger cable for PC connection software for PC control and data transfer operating manual transport case Caution! Strong mechanic shocks may damage the detector inside the instrument. 3
4 1. Theory The GRM-260 gamma-ray spectrometer is designed for spectral measurements of natural and artificial radionuclides in field and laboratory conditions giving the information about the kind and the concentration of radionuclides present in rocks, soil and water. The gamma-ray spectrometry as the most common nuclear method is useful for raw material exploration, environmental radiation monitoring, geological studies of lithology and stratigraphy, geophysical mapping, borehole logging, laboratory assays of rocks and building materials. The measurement is based on the capture of emitted gamma quanta in the scintillation detector. The gamma quanta of characteristic energies are transformed into electric pulses with heights that are proportional to those energies. The queue of electric pulses is analyzed consequently and separate pulses are sorted into individual channels of the measured spectrum. The spectrum of the GRM-260 consists of 256 channels with the channel width of 12 kev. The spectrum is divided into four parts groups of channels called ROI (Region Of Interest) with the respect to the peak positions of studied radionuclides and due to the real resolution of the scintillation detector. Radioactivity of rocks is usually caused by one of three natural sources of gammaradiation: potassium (K), uranium (U) and thorium (Th). Each of those elements in natural conditions contains a fraction of a radionuclide that can be detected in either direct or indirect way. The isotope 40 K emits gamma-rays with the energy of MeV thus the determination of K is direct one. The concentration of K is given in mass percentage. The determination of U is based on the detection of 214 Bi radionuclide, which is a member of 238 U decay series emitting the energy of MeV. In the case of U the detection is indirect and the concentration is given in ppm eu (equivalent of uranium). The determination of Th contents is indirect as well the 208 Tl radionuclide with the energy of MeV originating from the 232 Th decay series is detected. The concentration of Th is given in ppm eth. Other sources of gamma-radiation may come from artificial activities as power stations, industrial enterprises, nuclear weapons. Those sources have various half times of the radioactive decay (e.g. 30 years in the case of 137 Cs with the energy of MeV) and their peak can be detected in the measured spectrum as well due to the possible contamination in field. The total gamma activity of rocks can be judged by means of dose rate measurement, which is based on the evaluation of the total spectral count. The dose rate is given in ngy/h and can be automatically recalculated into U equiv concentration units (the dose rate unit of 1 U equiv corresponds with 1 ppm concentration of U). 4
5 The accuracy of the measurement is provided by the precise system of the spectrum stabilization with the use of digital circuitry. The built in algorithm for the determination of K, U, Th contents is based on the matrix calculation from K, U, Th spectral ROIs. More advanced spectral evaluation the statistic method of spectral analysis is available if an external PC is used. This method collects the information from all the measured spectra and thus the requirement for the measuring time is significantly reduced and the accuracy is improved at the same time. The precise factory calibration of the GRM-260 instrument is made on high volume standards (etalons) for each of K, U, Th elements and for background. The GRM-260 is equipped with the easy possibility of user s calibration, which can be used alternatively to the factory calibration. Recommended literature: 1. Adams,J., Gasparini,P. : Gamma-ray spectrometry of rocks. Elsevier Publishing Co., Siegbahn,K. : Alpha-, Beta- and Gamma Ray Spectroscopy. North Holland Publishing Co., Lovborg,L. : The Calibration of Portable and Airborne Gamma-Ray Spectrometers - Theory, problems and Facilities. Risö National Laboratory, Roskilde IAEA : Radiometric Reporting Methods and calibration in Uranium Exploration. TRS No. 174, Vienna
6 Profile measurements A very common way of the field gamma-spectrometry is so called profile measurement values of counts in ROIs and concentrations are measured step by step along a marked profile line in terrain. Several profile lines (usually of parallel direction) create the net of measuring points. The contour map with isolines (lines connecting points with the same value of counts or concentrations) can be constructed above this net of points to enable detection of radioactive anomalies in the terrain under study. Used terms in GRM-260 software and their specification: PROFILE a number from 0 to 9999 for identification of the profile line. POINT a number from 0 to 9999 for identification of the starting position of the profile (in meters usually). STEP a number from 99 to +99 (not zero) that determines the distance (in meters usually) between measurement positions along the profile. For example PROFILE, POINT, STEP with 10,0,5 enter means that the profile number 10 is measured from the starting position 0 with positive step 5, i.e. the next profile positions are 5,10,15,. 6
7 2. Operating Instructions 2.1. GRM-260 Preparation GRM-260 set is delivered in the plastic transport case providing safety transport. For the start of the measurement take the instrument out of the case and turn the switch on its rear side to the position labeled I. The welcome screen is shown while the circuitry is tested. Then the main menu screen (fig. 1) will appear. No other preparation is required. Then operate the instrument from the instrument keyboard. This operation is described in the following chapter 2.2. For operation from external PC connect the GRM-260 connector (hidden under the small cover on the rear panel) with the PC serial port using the cable from instrument accessories when both GRM-260 and PC are turned on. The way of operation is described in the chapter 2.3. After the measurement is finished turn the switch on the rear side of the GRM-260 to the position labeled 0 and cancel the PC cable connection if done. Current battery charging after each longer measurement or use with PC is the necessary condition of reliable work of the GRM-260 instrument. 7
8 2.2. Measurement All the GRM-260 operation is designed in a simple interactive way with prompts on the screen. After the instrument is turned on the menu shown in fig. 1 will appear. 1. SPECTRUM 2. DOSE RATE 3. VIEWER 4. CALIBRAT. Fig. 1 You can decrease (8 key) or increase (9 key) the display contrast now or turn the display backlight on (0 key). Select the required item by appropriate number pressing Spectrum This task serves for the spectral measurement with consequent K, U, Th concentrations and dose rate analyses. Put the instrument onto the chosen point and start SPECTRUM task. The screen shown on fig. 2 will appear. MEASUR.TIME: 1 2 3: ) CALIBRATION FACTORY 6) STABILIZATION ON 7) SET AS DEFAULT Fig. 2 8
9 You can set minutes (1 or 2 keys) and tens of seconds (3 or 4 keys) of the measured time. You can choose factory or user (if already created) calibration (5 key), turn the spectrum stabilization ON/OFF (6 key) and save set parameters as default for next measurement (7 key). Pressing of the green key will start the measurement while the red key serves for the return to the main menu (fig. 1). After a short period of the energy stabilization the measured spectrum is continuously collected during the given measuring time and it is currently shown in the left part of the display. (You can see the significant 137 Cs reference peak there.) The x-axis represents pulse energies and is marked in MeV units (mega electron volt) while the y-axis represents number of pulses in cps units (count per second). Vertical lines in the spectrum show positions of K, U and Th ROIs. The rest of the measuring time in minutes and seconds is shown currently as well (fig. 3). The measuring process can be interrupted before the measuring time is run out by pressing the red key - the main menu (fig. 1) will appear. 6 0 K U Th OFF TIME 1: Fig. 3 After the measurement is finished the spectral graph disappears and the result table (fig. 4) is shown. 9
10 TOT ngy/h K 2.43 % eu 3.23 ppm eth 8.95 ppm Fig. 4 The measured dose rate and concentrations values are shown. You can look at the measured spectrum after pressing the green key (fig. 5) or save values after pressing the red key. 6 K U Th OFF TIME 0:00 ENERGY cps Fig. 5 ENERGY value shows the recent cursor position. The corresponding value of cps is given on the following line. The cursor (thick line) position can be changed using keys 1 5: 1 - coarse movement to the left, 2 - fine movement to the left, 5 - coarse movement to the right, 4 - fine movement to the right, 3 - return to the middle. 10
11 The cps scale can be increased (7 key) or decreased (6 key) to see the studied peaks in the spectrum. The 0 key turns the backlight ON. You can see the cps result table (fig 6) after pressing the green key or save values after pressing the red key. TOT K eu eth cps 2.92 cps 1.02 cps 0.37 cps Fig. 6 This table shows measured cps values in ROIs. The ROI energy borders are following: TOTAL MeV MeV K MeV MeV eu MeV MeV eth MeV MeV You can return to the concentrations table (fig. 4) by pressing the green key or save values after pressing the red key. Data saving It is possible to save 200 result tables (values from measured points) in the internal memory of the instrument. The screen similar to fig.7 shows the number following the last stored point and can be changed by writing another one. The green key pressing will save new result table while the red key pressing will cause no saving. SAVE AS: 4 Input number Fig. 7 The main menu (fig. 1) will appear consequently. 11
12 The saved data can be transferred to the PC using the GRM program as shown in the chapter or can be seen later directly in the instrument using viewer ( see chapter 2.2.3). Measurement without spectrum stabilization This way of the spectral measurement is useful for low concentrations of radionuclides or for low energy analysis when the presence of the reference source can influence the measured spectrum in a significant way. The instrument calibration is not valid at that way of measurement. To begin this measurement start the spectrum task with the stabilization source several times to reach the stable temperature balance of the instrument. Then take the reference source from the instrument and turn the stabilization OFF while screen from fig. 2 is shown. The reference source is situated on the front side under the round black cover accessible after dismantling of two screws. Do not forget to return the reference source to its place before the stabilization is activated again. In other case the error will be indicated by GRM-260 instrument. 12
13 Dose Rate This task serves for immediate indication of the total dose rate. Measured values are shown in graphic and numeric way. Dose rate indication is useful for a preliminary measurement on a locality, for search for lost gamma sources etc.. A picture similar to the fig. 11 will appear. TOT ngy/h Fig. 11 To terminate this task press (and hold) the red key. The main menu (fig. 1) will appear. 13
14 Viewer This task enables to look at previously measured result tables stored in the GRM-260 memory. The screen similar to the following one (fig. 12) will appear. No # 4 TOT cps ngy/h K cps % eu 0.66 cps 1.00 ppm eth 0.10 cps 2.15 ppm Time 360 s CAL. FACTORY, STAB. ON Fig. 12 The table contains both ROI s counts and calibrated values of the dose rate and concentrations as well as accompanying information about used calibration and spectrum stabilization. You can go to the next table (1 key or green key), go to the previous table (2 key), choose a certain table number (3 key, write the table number and then the green key) or go to the last measured table (4 key). The red key will terminate the viewer task. 14
15 Calibration This task serves for creation of the user s calibration. It is possible to do the user s calibration provided you have suitable K, U, Th, and background etalons (calibration pads) of sufficient dimensions and quality. The factory calibration was done on the surface of high volume etalons (standards with diameters of 2 m) and is related to the half-space under the instrument. In the case that you have etalons of smaller dimensions you have to correct the nominal K, U, Th concentrations of etalons by the multiplication by the geometric factor G before those values of the concentrations are included into the GRM-260. G = 1 h/r h the height of the detector middle above the pad surface h = 47 mm r the diameter of the etalon pad In all cases the precise knowledge of the concentrations of all three components in each etalon creates the basic condition of the valid user s calibration. The occurrence of the foreign gamma sources near the etalon must be eliminated. The calibration must be done with the same piece of the reference source, which is used for the measurement. The measuring time for each etalon is preset to 20 min and cannot be changed by user. The calibration is done in the middle of the surface of etalons. The calibration must be repeated periodically - at least once per year. In the course of the calibration you are instructed to put the probe onto the destined etalon (K, U, Th, background and dose rate consequently). After the measurement of the spectrum you are asked to write the nominal concentrations of the etalon. You have to know all three components (K, U, Th) concentration for each etalon. A high volume background etalon made from pure SiO 2 sand is recommended. Usually the U etalon is used as the dose rate etalon as well. In this case its dose rate value is Uequiv = 2.5 x % K + 1 x ppm U x ppm Th, where % K, ppm U, ppm Th are the concentrations of K, U, Th in the etalon. The nominal value can be given either in ngy/h or in U equiv (the choice by pressing 1 key before the nominal values for the etalon and for the background are written). After all calibration data are ready the GRM-260 instrument calculate the calibration constants and replace the old user s calibration with the new one. 15
16 2.3. Measurement using external PC Installing the GRM-260 Software for Windows We recommend you to close all applications you have been running before you start the installation procedure of the GRM-260 software. 1. Insert the floppy disk number 1 to your drive. 2. Visualize the content of the floppy disk on your screen (for example, by double clicking on "This computer" and then on the symbol of your floppy disk driver). 3. Double click on the "setup.exe" file. The installation procedure will start. Follow the instructions of this procedure: you will be asked to insert floppy disk number If some of the necessary file systems were out of date in your system the installation procedure would ask you to allow updating those files. In that case: 4a. Click "Yes" to allow the updating. 4b. Take the floppy disk out of your floppy disk driver. 4c. Allow restarting Windows. 4d. Follow these instructions again from the beginning (item 1). 5. Confirm that you have closed all other applications. 6. You can change the destination directory or use the offered directory "C:\Program Files\GRM260\". If you are satisfied with this directory just click the big square button with the picture of a computer. Otherwise, click "Change directory", make the change, and, finally, click the mentioned square button. 7. You can customize your Program group box. You can either add the new item or create a new group. If you click only "Continue" the item "GRM260" is created. 8. The GRM-260 software for Windows installation is completed. ATTENTION: During the instalation procedure the file"st6unst.log" was created. Do not modify or delete this file. It will be used for uninstalation procedure (see below). 16
17 Uninstalling the GRM-260 software for Windows Before uninstalling the GRM-260 software delete the directory "Data" and the file User.con (if exists). (If you did not change that during the installation process, you will find them in the "C:\Program Files\GRM260\" directory.) To uninstall the GRM-260 Software use Add/Remove Programs in Control Panel: 1. Click Start, Settings, and then Control Panel. 2. Double-click Add/Remove Programs. The Add/Remove Programs Properties dialog box appears. 3. From the list of programs, select GRM Click Add/Remove. GRM-260 software removal will start. 5. The question "Are you sure you want to completely remove GRM260 and all of its components?" will appear. 6. Click "Yes" to complete the uninstallation process. Starting the GRM-260 Software Click Start, Programs, GRM260. Installing and starting the GRM-260 Software for DOS Install the GRM-260 software from the diskette Gamma ray Spectrometer GRM- 260 into your computer. Cross onto the diskette driver containing that diskette and type install enter. Run GRM-260 program in GRM-260 directory. 17
18 All the measuring software is designed in a usual interactive way watch the prompts on the screen carefully. After the connection of the GRM-260 instrument with PC (see the chapter 2.1.) and after the GRM program start the menu screen shown in fig. 14 will appear. g SINGLE SPECTRUM PROFILE MEASUREMENT DOSE RATE INDICATION WORKING SETTINGS SPECTRUM VIEWER CALIBRATION DATA TRANSFER CHOOSE AND PRESS ENTER, ESC = END OF WORK Fig. 14 Select the required item by arrow up/down keys and press enter. Before the start of SINGLE SPECTRUM, PROFILE MEASUREMENT and DOSE RATE INDICATION tasks the check of the working parameters (the WORKING SETTINGS task run) is recommended Single Spectrum This task serves as a basic way of the spectral measurement. Put the instrument onto the chosen point and start SINGLE SPECTRUM task. The screen shown on fig. 15 will appear. The measured spectrum is continuously collected during the given measuring time and is currently shown in the left part of the display. The x-axis represents pulse energies and is marked in MeV units (mega electron volt) while the y-axis represents number of pulses in cps units (count per second). Vertical lines in the spectrum show positions of K, U and Th ROIs. The rest of the measuring time in minutes and seconds is shown currently as well. 18
19 The measuring process can be interrupted before the measuring time is run out by pressing the ESC key - the welcome screen and the main menu (fig. 14) will appear. 100 cps K U Th MEASURING TIME REST 2: MeV ESC = EXIT Fig. 15 After the measurement is finished the spectral graph disappears and the result table (fig. 16) is shown. TOT cps 25.8 U equiv K 2.76 cps 2.3 % eu.90 cps 2.9 ppm eth.23 cps 2.1 ppm CC.58 cps DT.60 % F1 = SPECTRUM VIEW F10 = SAVE TABLE & SPECTRUM ENTER = SAVE TABLE SPACE = NEW MEASUREMENT Fig. 16 ESC = EXIT 19
20 The TOT symbol represents the total spectrum count and dose rate value in ngy/h (or U equiv if required). The K symbol represents the K ROI count and the K concentration in %. The eu symbol represents the U ROI count and the U concentration in ppm. The eth symbol represents the Th ROI count and the Th concentration in ppm. The CC symbol represents the cosmic count. The DT symbol represents the dead time percentage. Now you can put either the result table (ENTER key) or both the result table and measured spectrum (F10 key) into the memory. You will be asked to write the output file name (for the first time), the locality and the comment as shown on fig. 17. To show the measured spectrum press the F1 key and screen shown on fig. 18 will appear. You can continue to measure another single spectrum (not saving data) by pressing SPACE key or return to the welcome screen and the main menu by pressing ESC key. FILE NAME : SAMPLE01 LOCALITY : BRNO, MEDLANKY COMMENT : GRANIT TAB = CORRECT SHOWN DATA, SPACE = SAVE & NEW MEASUREMENT, ENTER = SAVE & EXIT Fig. 17 SPACE will cause the measurement of a new single spectrum. After ENTER the welcome screen and the main menu (fig. 1) will appear. Pressing TAB you can change the written data. 20
21 100 cps K U Th SPECTR. VIEWER CP MeV cps CW MeV MeV F1 = TABLE VIEW F10 = SAVE TABLE & SPECTRUM ENTER = SAVE TABLE SPACE = NEW MEASUREMENT ESC = EXIT Fig. 18 CP value shows the recent cursor position. The corresponding value of cps is given on the following line. CW shows the preset cursor width. The cursor position can be changed using the left/right arrow keys. Now you can put either the result table (ENTER key) or both the result table and measured spectrum (F10 key) into the memory. You will be asked to write the output file name (for the first time), the locality and comment as shown on fig. 17. To show the result table press the F1 key and screen shown on fig. 16 will appear. You can continue to measure another single spectrum (not saving data) by pressing SPACE key or return to the welcome screen and the main menu (fig. 14) by pressing ESC key. 21
22 Profile Measurement This task is designed for radiometric mapping creation of contour maps of K, U, Th concentrations and dose rate. After the PROFILE MEASUREMENT task is started you are asked to write the output file name, the locality and the comment (fig. 19). FILE NAME : SAMPLE01 LOCALITY : BRNO, MEDLANKY COMMENT : GRANIT TAB = CORRECT SHOWN DATA, ENTER = CONTINUE Fig. 19 Pressing TAB you can change the written data. After ENTER the instrument awaits the profile, point and step numbers (see the Theory chapter) as shown in fig 20. PROFILE : 10 POINT : STEP : 0 5 TAB = CORRECT SHOWN DATA, ENTER = CONTINUE Fig. 20 After ENTER the screen shown on fig. 21 is shown. 22
23 50 ppm 5% PF 10 ST 0+ σ = K τ = eu ν = eth SPACE=MEASUREMENT F1= CHANGE PROFILE ESC= EXIT Fig. 21 Put the instrument onto the place with the picket of shown PF (profile) and ST (station) and press the SPACE key. The measurement starts and the collected spectrum is shown currently on the screen (fig. 22). To close this profile press the F1 key. The screen given on fig. 20 appears and you can start the measurement of another profile. The ESC key pressing will cause the return to the welcome screen and the main menu (fig. 14). 23
24 100 cps K U Th PF 10 ST 0+ MEASURING TIME REST 2:30 ESC = EXIT Fig MeV The left part of the screen shows the measured spectrum with K, U and Th ROIs position while the right part shows the rest of the measuring time. You can interrupt the measurement by pressing of the ESC key. The return to the previous screen (fig. 21) will follow. After the measuring time is ran out the picture similar to fig. 23 is shown. 50 ppm 5% PF 10 ST 20+ σ = K τ = eu ν = eth F1 = TABLE VIEW F4 = SPECTRUM VIEW F10 = SAVE ALL DATA ENTER = SAVE TABLE SPACE = MEASUREMENT + = DO NOT SAVE Fig
25 The left part of the screen shows concentration curves measured along the profile. The ppm units for eu and eth concentrations are marked on the left y axis and the % units for K concentration are marked on the right y axis. The x axis is marked in numbers of the profile positions. The K curve is marked with σ, the U curve is marked with τ and the Th curve is marked with ν. All curves are moving to the left if the right margin of the picture is reached. The right part of the screen shows the picket the profile (PF) and the station (ST). The F1 key pressing serves for the table view (similarly to fig. 16). The F4 key enables to view the measured spectrum (similarly to fig. 18). The result table is saved after ENTER key pressing, the result table and the spectrum are saved after F10 key pressing, this measuring point is skipped after + key pressing. All those (ENTER, F10 and +) keys will cause the cross to the next profile picket and to the screen similar to fig. 21 containing the measured K, U, Th curves. If you wish to repeat the measurement at the same point, press SPACE key. 25
26 Dose Rate Indication This task serves for immediate indication of the total dose rate and of the count in one of the 8 ROIs. The number of the chosen ROI is entered after the DOSE RATE INDICATION is started. The positions of the ROIs is defined in the WORKING SETTINGS task. Both values are shown in graphic and numeric way. Dose rate indication is useful for a preliminary measurement on a locality, for search for lost gamma sources etc.. A picture similar to the fig. 24 will appear ngy/h TOT (ngy/h) cps ROI 1 (cps) ESC = RETURN Fig. 24 To terminate this task press ESC. The welcome screen and the main menu (fig. 14) will appear. 26
27 Working Settings This task serves for the definition of working parameters (fig. 25). The movement between them is controlled using the arrow keys. MEASURING TIME CPS SCALE CURSOR WIDTH DOSE RATE UNIT ROIS SETTING STAB. CHANNEL CALIBRATION DATE TIME CHOOSE AND PRESS ENTER, ESC = RETURN Fig. 25 After the choice of the option and ENTER key pressing you can check and change the following working parameters (preset values are written in round brackets). A new numeric value is loaded and rounded (if needed) after the complete number is written. The choice of the requested parameter is done by the frame removal using left/right arrow keys. MEASURING TIME the measuring time in minutes and seconds (3 min 0 s) CPS SCALE the upper limit on the y axis of the spectrum (50 cps) CURSOR WIDTH the cursor width in MeV (0.012 MeV one channel) DOSE RATE UNIT the dose rate unit ngy/h or U equiv (ngy/h) 27
28 ROIS SETTING the ROI borders in MeV, the preset values are shown below ROI 1 TOTAL MeV MeV ROI 2 K MeV MeV ROI 3 eu MeV MeV ROI 4 eth MeV MeV ROI 5 (Cs) MeV MeV ROI MeV MeV ROI MeV MeV ROI MeV MeV The set ROI borders have no influence on the calculated concentrations of K, eu and eth and the dose rate value. Those quantities are taken from all spectra analysis as written in the introductory chapter. STAB. CHANNEL one of the stabilization channel 55, 30, 0 (55) The 0 value eliminate the stabilization procedure and keep the previous gain of the electronics. CALIBRATION factory or user s calibration (factory) DATE current date TIME current time Measurement without spectrum stabilization This way of the spectral measurement is useful for low concentrations of radionuclides or for low energy analysis when the presence of the reference source can influence the measured spectrum in a significant way. For this measurement, start the single spectrum measurement with the stabilization source several times to reach the stable temperature balance of the instrument. Then take the reference source from the probe and set the stabilization to 0 channel as shown above. The reference source is situated on the front side under the round black cover accessible after dismantling of two screws. Do not forget to return the reference source to its place before the stabilization is activated again. In other case the error will be indicated by GRM-260 instrument. 28
29 Spectrum viewer This task enables to look at previously measured spectra stored in the PC. In the first step the table of files is shown. Choose the requested file using arrow keys and press ENTER key. In the next step the result table (similarly to fig. 16) is shown. You can view the measured spectrum (if exists) by pressing F1 key (screen similar to fig. 18). The next result table from the chosen file is shown by pressing ENTER key. The ESC key will cause the return to the table of files. 29
30 Calibration This task serves for the creation of the user s calibration. It is possible to make the user s calibration provided you have suitable K, U, Th, and background etalons (calibration pads) of sufficient dimensions and quality. The factory calibration was done on the surface of high volume etalons (standards with diameters of 2 m) and is related to the half-space under the instrument. In the case that you have etalons of smaller dimensions you have to correct the nominal K, U, Th concentrations of etalons by the multiplication by the geometric factor G before those values of the concentrations are included into the GRM-260. G = 1 h/r h the height of the detector middle above the pad surface h = 47 mm r the diameter of the etalon pad In all cases the precise knowledge of the concentrations of all three components in each etalon creates the basic condition of the valid user s calibration. The occurrence of the foreign gamma sources near the etalon must be eliminated. The calibration must be done with the same piece of the reference source, which is used for the measurement. The measuring time for each etalon is preset to 20 min and cannot be changed by user. The calibration is done in the middle of the surface of etalons. The calibration must be repeated periodically - at least one times per year. In the course of the calibration you are instructed to put the probe onto the destined etalon (K, U, Th, background and dose rate consequently). After the measurement of the spectrum you are asked to write the nominal concentrations of the etalon. You have to know all three components (K, U, Th) concentration for each etalon. A high volume background etalon made from pure SiO 2 sand is recommended. Usually the U etalon is used as the dose rate etalon as well. In this case its dose rate value is Uequiv = 2.5 x % K + 1 x ppm U x ppm Th, where % K, ppm U, ppm Th are the concentrations of K, U, Th in the etalon. After all calibration spectra and concentration values are ready the GRM-260 instrument calculate the calibration file and replace the old user s calibration with the new one. 30
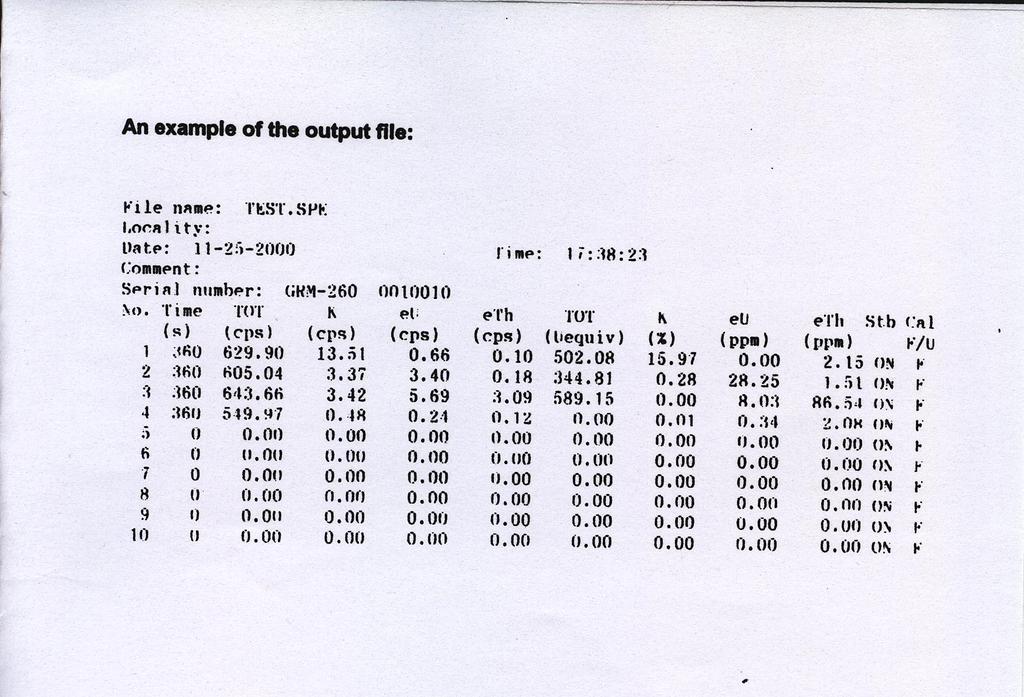
31 Data transfer to PC This task serves for the transfer of result tables from the GRM-260 memory to a PC file. After this task is run you are asked to give file name, locality and comment and then to choose the dose rate unit (ngy/h or U equiv). Data transfer is running and when it is finished, the main menu (fig. 14) will appear. Appendix shows an example of the transferred file. 31
32 3. Maintenance For reliable operation it is necessary to charge batteries regularly and enough. It is recommended to recharge batteries before each longer measurement (e.g. over night). A long charging time does not damage batteries. The battery discharge is indicated by software warning. The battery charger from accessories is connected to the GRM-260 instrument by means of the connector under the small orange cover on the rear side of the instrument. It is necessary to recharge batteries each 2 months at least once for one day even in case the instrument was not used. The battery charger from accessories is allowed to be used only for GRM-260 charging. Keep the instrument clean 4. Trouble shooting The display does not show any screen after turning ON. Batteries are quite discharged you should charge them thoroughly (one day approximately). The prompt ATTENTION! THE BATTERY IS ALMOST DISCHARGED! is shown. It means that you should finish the measurement in a short time (minutes) and charge batteries. The prompt THE STABILIZATION IS OUT OF RANGE. Check whether the reference source is included in the instrument and whether the preset position of the stabilization peak corresponds with the used reference source (55 channel for 137 C). For warranty or after warranty repair contact the producer on the address: GF Instruments, s.r.o. Mr. Vít Gregor tel.: , 366 Ječná 29a fax: BRNO, gregor@gfinstruments.cz CZECH REPUBLIC 32
33 33
QuantumMCA QuantumNaI QuantumGe QuantumGold
 QuantumMCA QuantumNaI QuantumGe QuantumGold Berkeley Nucleonics Corporation (San Rafael, CA) and Princeton Gamma Tech (Princeton, NJ) have partnered to offer gamma spectroscopy with either germanium or
IdentiFINDER Digital Hand Held Spectrometer & Dose Rate Meter for Portable Applications
 fire IdentiFINDER Digital Hand Held Spectrometer & The world s smallest spectrometer and dose rate meter designed for portable applications. safety security identifinder - CH (yellow) CZT and neutron detector
O P E R A T I N G M A N U A L
 OPERATING MANUAL WeatherJack OPERATING MANUAL 1-800-645-1061 The baud rate is 2400 ( 8 bits, 1 stop bit, no parity. Flow control = none) To make sure the unit is on line, send an X. the machine will respond
SCINTILLATION DETECTORS & GAMMA SPECTROSCOPY: AN INTRODUCTION
 SCINTILLATION DETECTORS & GAMMA SPECTROSCOPY: AN INTRODUCTION OBJECTIVE The primary objective of this experiment is to use an NaI(Tl) detector, photomultiplier tube and multichannel analyzer software system
Creating Empirical Calibrations
 030.0023.01.0 Spreadsheet Manual Save Date: December 1, 2010 Table of Contents 1. Overview... 3 2. Enable S1 Calibration Macro... 4 3. Getting Ready... 4 4. Measuring the New Sample... 5 5. Adding New
XA TERRESTRIAL GAMMA DOSE RATE MAPS, THEIR COMPILATION AND VERIFICATION RADIOMETRIC MAP OF THE CZECH REPUBLIC
 TERRESTRIAL GAMMA DOSE RATE MAPS, THEIR COMPILATION AND VERIFICATION RADIOMETRIC MAP OF THE CZECH REPUBLIC XA9745936 M. MATOLIN Faculty of Science, Charles University, Prague, Czech Republic Abstract Maps
M E E T I n s t r u m e n t s G.m.b.H.
 T a m a r i s k e n g a s s e 1 0 2 / 1 3 / 5 A - 1 2 2 0 V i e n n a, A U S T R I A T e l : + 4 3 1 2 8 5 4 5 7 2, F a x : + 4 3 1 2 8 3 6 4 2 9 E - m a i l : office@mateval.com www.mateval.com Portable
2100TR Liquid Scintillation Counter
 2100TR Liquid Scintillation Counter Description The Tri-Carb 2100TR liquid scintillation counter is computer-controlled, bench top liquid scintillation analyzer for detecting small amounts of alpha, beta
1 of :32
 Home Page Products Price List Links & PDFs DISCONTINUED: SEE GAMMA-RAD Gamma Ray & X-Ray Spectroscopy System Hand-Held, High Efficiency NaI(Tl) Detector The GAMMA-8000 is a powerful, portable instrument
Bright Advance Corporation
 USER INSTRUCTIONS TABLE OF CONTENTS INSTRUCTIONS FOR USE2 PREPARING TO USE THE SCALE2 DISPLAYS3 KEYBOARD FUNCTION4 OPERATION7 COUNTING14 DIFFERENT KEYBOARD TYPES21 INTERFACE31 POWER SOURCES40 1 INSTRUCTIONS
GT-40/GT-40S Multipurpose Gamma-Ray Spectrometer Ancestors: GS-256 by Geofyzika Brno 1975 GR-256 by Exploranium Canada 1977 GR-320 by Exploranium
 GT-40/GT-40S Multipurpose Gamma-Ray Spectrometer Ancestors: GS-256 by Geofyzika Brno 1975 GR-256 by Exploranium Canada 1977 GR-320 by Exploranium Canada 1995 1 What is common on the current market Handheld
PYCKO SCIENTIFIC LIMITED
 PYCKO SCIENTIFIC LIMITED 31 London Road, Grantham, NG31 6EX Telephone 01476 401992 bill@pycko.co.uk www.pycko.co.uk Your Alternative To The Obvious RayMon10 TM Detect, measure, identify and analyse radionuclides
Ocean Optics Red Tide UV-VIS Spectrometer (Order Code: SPRT-UV-VIS)
") Ocean Optics Red Tide UV-VIS Spectrometer (Order Code: SPRT-UV-VIS) The UV-VIS spectrometer is a portable ultraviolet light and visible light spectrophotometer, combining a spectrometer and a light source/cuvette
Ocean Optics Red Tide UV-VIS Spectrometer (Order Code: SPRT-UV-VIS) The UV-VIS spectrometer is a portable ultraviolet light and visible light spectrophotometer, combining a spectrometer and a light source/cuvette
Survey Meter OD-01 Address: Phone: Fax: URL:
 Survey Meter OD-01 Dose meter and dose rate meter for the measurement of the ambient dose and dose rate equivalent H*(10), dh*(10)/dt and the directional dose and dose rate equivalent H'(0.07), dh'(0.07)/dt
1/5 Specifications Hidex 300 SLL automatic TDCR liquid scintillation counter
 1/5 Specification Hidex 300 SL-SLL 100-240V AC and 24 V DC. Features Model (425-020) Super Low Level (SLL) Automatic TDCR Liquid Scintillation Counter with Guard Detector and Low Level PMTs General Description
THE COMPTON EFFECT Last Revised: January 5, 2007
 B2-1 THE COMPTON EFFECT Last Revised: January 5, 2007 QUESTION TO BE INVESTIGATED: How does the energy of a scattered photon change after an interaction with an electron? INTRODUCTION: When a photon is
GAMMA RAY SPECTROSCOPY
 GAMMA RAY SPECTROSCOPY Gamma Ray Spectroscopy 1 In this experiment you will use a sodium iodide (NaI) detector along with a multichannel analyzer (MCA) to measure gamma ray energies from energy level transitions
Software BioScout-Calibrator June 2013
 SARAD GmbH BioScout -Calibrator 1 Manual Software BioScout-Calibrator June 2013 SARAD GmbH Tel.: ++49 (0)351 / 6580712 Wiesbadener Straße 10 FAX: ++49 (0)351 / 6580718 D-01159 Dresden email: support@sarad.de
VELA. Getting started with the VELA Versatile Laboratory Aid. Paul Vernon
 VELA Getting started with the VELA Versatile Laboratory Aid Paul Vernon Contents Preface... 3 Setting up and using VELA... 4 Introduction... 4 Setting VELA up... 5 Programming VELA... 6 Uses of the Programs...
hν' Φ e - Gamma spectroscopy - Prelab questions 1. What characteristics distinguish x-rays from gamma rays? Is either more intrinsically dangerous?
 Gamma spectroscopy - Prelab questions 1. What characteristics distinguish x-rays from gamma rays? Is either more intrinsically dangerous? 2. Briefly discuss dead time in a detector. What factors are important
Ion-Chamber Survey Meter OD-02
 Ion-Chamber Survey Meter OD-02 Dose and dose rate meter for measuring the ambient dose equivalent H*(10) and dose rate equivalent dh*(10)/dt as well as the directional dose equivalent H (0,07) and dose
The Multi-Wiper HE. High Energy Nuclear Medicine Well Counter. The first multi-well counters designed specifically for Nuclear Medicine!
 The Multi-Wiper HE High Energy Nuclear Medicine Well Counter The first multi-well counters designed specifically for Nuclear Medicine! * Comprehensive wipe testing with concise report in DPM * Available
ɣ-radiochromatography
 nuclear instruments Kapitel_y_Graphy.indd 1 19.08.09 10:27 n u c l e a r i n s t r u m e n t s Index HPLC-detectors TLC-detectors GABI* analog output GABI* digital output to PC minigita*, 1 trace scanner
Copyright 2008, University of Chicago, Department of Physics. Experiment VI. Gamma Ray Spectroscopy
 Experiment VI Gamma Ray Spectroscopy 1. GAMMA RAY INTERACTIONS WITH MATTER In order for gammas to be detected, they must lose energy in the detector. Since gammas are electromagnetic radiation, we must
Research Gamma Counter
 Research Gamma Counter Multi-Detector Gamma Counters High performance gamma counters for RIA and research applications Complete data reduction for all RIA, IRMA, Radio and Research assays Selectable dual
Operation Manual. SPECTRO-NANO4 Nucleic Acid Analyzer PLEASE READ THIS MANUAL CAREFULLY BEFORE OPERATION
 Operation Manual SPECTRO-NANO4 Nucleic Acid Analyzer PLEASE READ THIS MANUAL CAREFULLY BEFORE OPERATION 3, Hagavish st. Israel 58817 Tel: 972 3 5595252, Fax: 972 3 5594529 mrc@mrclab.com MRC. 4.18 Foreword
473-SHX Dew Point Mirror
 Humidity and Temperature Reference Hygrometer For Temperature up to 125 C Precise and stable chilled mirror dew point mirror technology High temperature optical components High temperature sample fan Cable
Alpha-Energies of different sources with Multi Channel Analyzer
 Physical Structure of Matter Radioactivity Alpha-Energies of different sources with Multi Channel Analyzer What you can learn about Decay series Radioactive equilibrium Isotopic properties Decay energy
Scintillation Detector
 Scintillation Detector Introduction The detection of ionizing radiation by the scintillation light produced in certain materials is one of the oldest techniques on record. In Geiger and Marsden s famous
Contents. Chapter 1: Introduction 3 How The SEI Inspector EXP Detects Radiation 3 Precautions 3
 TM INTERNATIONAL S.E. International, Inc. P.O. Box 39, 436 Farm Rd. Summertown, TN 38483 USA 1.800.293.5759 931.964.3561 Fax: 1.931.964.3564 www.seintl.com radiationinfo@seintl.com Contents Chapter 1:
TitriSoft 2.5. Content
 Content TitriSoft 2.5... 1 Content... 2 General Remarks... 3 Requirements of TitriSoft 2.5... 4 Installation... 5 General Strategy... 7 Hardware Center... 10 Method Center... 13 Titration Center... 28
Structure Monitoring Technology. Features. Ordering Information. Trigger Tape. A2 Pulse Counter (Optional) Solar Radiation Sensor
 Solar Radiation Sensor") Rain detection sensor General Description Driving rain and its effective management are critical factors in determining the durability of building enclosures. An accurate measurement of driving rain can
Rain detection sensor General Description Driving rain and its effective management are critical factors in determining the durability of building enclosures. An accurate measurement of driving rain can
Creation and modification of a geological model Program: Stratigraphy
 Engineering manual No. 39 Updated: 11/2018 Creation and modification of a geological model Program: Stratigraphy File: Demo_manual_39.gsg Introduction The aim of this engineering manual is to explain the
Jasco V-670 absorption spectrometer
 Laser Spectroscopy Labs Jasco V-670 absorption spectrometer Operation instructions 1. Turn ON the power switch on the right side of the spectrophotometer. It takes about 5 minutes for the light source
WM2018 Conference, March 18-22, 2018, Phoenix, Arizona, USA. PVT and LaBr3(Ce)-based Radon Express Analyzers 18164
-based Radon Express Analyzers 18164") PVT and LaBr3(Ce)-based Radon Express Analyzers 864 Vladislav Kondrashov *, Stephen Steranka* and Glenn Paulson** * RadComm Systems Corp. 293 Portland Dr, Oakville, Ontario L6H 5S4, CANADA ** Paulson and
PVT and LaBr3(Ce)-based Radon Express Analyzers 864 Vladislav Kondrashov *, Stephen Steranka* and Glenn Paulson** * RadComm Systems Corp. 293 Portland Dr, Oakville, Ontario L6H 5S4, CANADA ** Paulson and
Multi Channel Analyzer (MCA) Analyzing a Gamma spectrum
 Analyzing a Gamma spectrum") Multi Channel Analyzer (MCA) Analyzing a Gamma spectrum Objective: Using the MCA to acquire spectrums for different gamma sources and to identify an unknown source from its spectrum, furthermore to investigate
Multi Channel Analyzer (MCA) Analyzing a Gamma spectrum Objective: Using the MCA to acquire spectrums for different gamma sources and to identify an unknown source from its spectrum, furthermore to investigate
FRAM V5.2. Plutonium and Uranium Isotopic Analysis Software
 V5.2 Plutonium and Uranium Isotopic Analysis Software Advanced Isotopic Ratio Analysis Software for HPGe Gamma-Ray Spectra Analyzes Pu, and a wide variety of heterogeneous samples containing Pu, Am, U,
CHEMISTRY 170. Radioisotopes
 CHEMISTRY 170 Radioisotopes Positron Emission Tomography or PET scans use the radioisotope 18 F to create an image of the brain. DEPARTMENT OF CHEMISTRY UNIVERSITY OF KANSAS Radioisotopes Introduction
Alpha-energies of different sources with Multi Channel Analyzer (Item No.: P )
") Alpha-energies of different sources with Multi Channel Analyzer (Item No.: P2522015) Curricular Relevance Area of Expertise: ILIAS Education Level: Physik Topic: Hochschule Subtopic: Moderne Physik Experiment:
Alpha-energies of different sources with Multi Channel Analyzer (Item No.: P2522015) Curricular Relevance Area of Expertise: ILIAS Education Level: Physik Topic: Hochschule Subtopic: Moderne Physik Experiment:
"Neutron Flux Distribution"
 TECHNICAL UNIVERSITY DRESDEN Institute of Power Engineering Training Reactor Reactor Training Course Experiment "Neutron Flux Distribution" Instruction for Experiment Neutron Flux Distribution Content:
How to Make Photometric & Colorimetric Measurements of Light Sources using an Ocean Optics Spectrometer and SpectraSuite Software
 How to Make Photometric & Colorimetric Measurements of Light Sources using an Ocean Optics Spectrometer and SpectraSuite Software This is a concise guide to setting up and calibrating your Ocean Optics
CJP EXPLORATION INC.
 PO Box 219 14579 Government Road Larder Lake, Ontario P0K 1L0, Canada Phone (705) 643-1122 Fax (705) 643-2191 CJP EXPLORATION INC. Spectrometer Survey Over the SHEBA PROPERTY Nouvel Township, Ontario TABLE
IDENTIFICATION AND QUANTIFICATION OF RADIONUCLIDES IN HISTORICAL WASTE AT ANSTO
 IDENTIFICATION AND QUANTIFICATION OF RADIONUCLIDES IN HISTORICAL WASTE AT ANSTO McOrist G D., Bowles C.J., Fernando K. and Wong R. Australian Nuclear Science and Technology Organisation Australia Abstract
MULTIFUNCTION COMPUTER METER CX-742 USERS MANUAL
 MULTIFUNCTION COMPUTER METER CX-742 USERS MANUAL CONTENTS 1. BASIC INFORMATION 3 2. USING THE INFORMATION 4 3. THE PROFILE OF THE METER 5 4. TECHNICAL DATA 7 5. SCREENS 8 6. USING THE KEYBOARD 10 7. THE
ß + RADIATION. Choose your application of. chromatography controlled. chemical purity TLC PET GABI. PET GABI 2x2 Nal (Tl) 0 1V output.
 0 1V output.") www.raytest.com Choose your application of ß + RADIATION chromatography stand alone software controlled chemical purity HPLC PET GABI 2x2 Nal (Tl) 0 1V output PET GABI 2x2 Nal (Tl) Gina-PCcontrolled TLC
www.raytest.com Choose your application of ß + RADIATION chromatography stand alone software controlled chemical purity HPLC PET GABI 2x2 Nal (Tl) 0 1V output PET GABI 2x2 Nal (Tl) Gina-PCcontrolled TLC
Experiment 13. Dilutions and Data Handling in a Spreadsheet rev 1/2013
 Absorbance Experiment 13 Dilutions and Data Handling in a Spreadsheet rev 1/2013 GOAL: This lab experiment will provide practice in making dilutions using pipets and introduce basic spreadsheet skills
Lasentec Product Group
 Document Number: 004-0043 Window Reference Procedure - M500/600 P Probes, version 6.0 and higher FBRM CI Software The Window Reference Procedure is the standard calibration procedure used to reference
Background The power radiated by a black body of temperature T, is given by the Stefan-Boltzmann Law
 Phys316 Exploration 2: Verifying Stefan-Boltzmann Relationship Background The power radiated by a black body of temperature T, is given by the Stefan-Boltzmann Law Where A is the effective radiating area,
Gamma-Spectrum Generator
 1st Advanced Training Course ITCM with NUCLEONICA, Karlsruhe, Germany, 22-24 April, 2009 1 Gamma-Spectrum Generator A.N. Berlizov ITU - Institute for Transuranium Elements Karlsruhe - Germany http://itu.jrc.ec.europa.eu/
Natural Radiation K 40
 Natural Radiation There are a few radioisotopes that exist in our environment. Isotopes that were present when the earth was formed and isotopes that are continuously produced by cosmic rays can exist
Creation and modification of a geological model Program: Stratigraphy
 Engineering manual No. 39 Updated: 02/2018 Creation and modification of a geological model Program: Stratigraphy File: Demo_manual_39.gsg Introduction The aim of this engineering manual is to explain the
Lasentec Product Group
 Prepared by: Gregor Hsiao Approved on: ECN# 3506 Effective Date: 1/14/2008 Title: Window Reference Procedure for Version 6.0.0 and Higher Purpose: Lasentec D600 Probes and FBRM/Raman Probes using version
NUCL 3000/5030 Laboratory 2 Fall 2013
 Lab #2: Passive Gamma Spec Measurements in Decoding Natural Radioactivity in SLC Area Objectives a. Learn basics of gamma spectroscopy b. Learn the equipment in Counting stations #4, #5 and #8 c. Apply
Lab NUC. Determination of Half-Life with a Geiger-Müller Counter
 Lab NUC Determination of Half-Life with a Geiger-Müller Counter Object: Apparatus: To understand the concept of half-life; to become familiar with the use of a Geiger-Müller counter; to determine the half-lives
Renewed whole-body counting chamber in STUK
 Renewed whole-body counting chamber in STUK Seminar DTU Nutech, Roskilde, Denmark Tiina Torvela, Tero Karhunen, Maarit Muikku Environmental Radiation Surveillance and Emergency Preparedness Whole-body
Overview: In this experiment we will study the decay of a radioactive nucleus, Cesium. Figure 1: The Decay Modes of Cesium 137
 Radioactivity (Part I and Part II) Objectives: To measure the absorption of beta and gamma rays To understand the concept of half life and to measure the half life of Ba 137* Apparatus: Radioactive source,
рн PRO Controller The device is used to control and regulate ph level in hydroponic systems and water preparing units automatically USER MANUAL
 рн PRO Controller The device is used to control and regulate ph level in hydroponic systems and water preparing units automatically Complete Set ph PRO Controller - 1 pcs. ph electrode - 1 pcs. Calibration
PAA-ANALYZERS PRINCIPLE OF OPERATION
 PAA-ANALYZERS PRINCIPLE OF OPERATION The PAA process analyzer comprises a control unit and an analyzing section which includes the reaction chamber and measuring cell, reagent pumps and associated valves
Jazan University College of Science Physics Department. Lab Manual. Nuclear Physics (2) 462 Phys. 8 th Level. Academic Year: 1439/1440
 462 Phys. 8 th Level. Academic Year: 1439/1440") Jazan University College of Science Physics Department جاهعة جازان كلية العل وم قسن الفيزياء Lab Manual Nuclear Physics (2) 462 Phys 8 th Level Academic Year: 1439/1440 1 Contents No. Name of the Experiment
Jazan University College of Science Physics Department جاهعة جازان كلية العل وم قسن الفيزياء Lab Manual Nuclear Physics (2) 462 Phys 8 th Level Academic Year: 1439/1440 1 Contents No. Name of the Experiment
Acceleration/Velocity/Displacement VIBRATION METER
 Acceleration/Velocity/Displacement VIBRATION METER Model : VB-8220 Your purchase of this VIBRATION METER marks a step forward for you into the field of precision measurement. Although this METER is a complex
January 2002 INSTRUMENT MANUAL 1470 WIZARD. Gamma Counter
 INSTRUMENT MANUAL 1470-931-23 January 2002 1470 WIZARD Gamma Counter Wallac 1470 WIZARD Gamma counter For instruments with software version 3.6 Wallac Oy, P.O. Box 10, FIN-20101 Turku, Finland. Tel: 358-2-2678111.
OPERATION MANUAL. 3 in 1, IR, Type K/J/R/E/T, Pt 100 ohm THERMOMETER. Model : TM-2000
 3 in 1, IR, Type K/J/R/E/T, Pt 100 ohm THERMOMETER Model : TM-2000 Your purchase of this THERMOMETER marks a step forward for you into the field of precision measurement. Although this THERMOMETER is a
AUTOMATIC AND INTERACTIVE ANALYSIS SOFTWARE FOR BETA- GAMMA COINCIDENCE SYSTEMS USED IN CTBT MONITORING
 ABSTRACT AUTOMATIC AND INTERACTIVE ANALYSIS SOFTWARE FOR BETA- GAMMA COINCIDENCE SYSTEMS USED IN CTBT MONITORING J. Rynes, K.M.F. Biegalski, P. Donohoe, and S. Biegalski Veridian Pacific-Sierra Research
GW Professional Weighing Scale. User Manual SNOWREX INTERNATIONAL CO., LTD. SRGW
 GW Professional Weighing Scale User Manual SNOWREX INTERNATIONAL CO., LTD. SRGW 20100415 Table of Contents Table of Contents...1 Specifications... 2 Basic specification... 2 Series specification(ec TYPE/OIML
Overview: In this experiment we study the decay of a radioactive nucleus, Cesium 137. Figure 1: The Decay Modes of Cesium 137
 Radioactivity (Part I and Part II) 7-MAC Objectives: To measure the absorption of beta and gamma rays To understand the concept of half life and to measure the half life of Ba 137* Apparatus: Radioactive
Latest generation testo air velocity & IAQ probes with cable handle. Instruction manual
 Latest generation testo air velocity & IAQ probes with cable handle Instruction manual Contents Contents 1 About this document... 5 2 Safety and disposal... 5 3 System description... 6 4 Description of
Acceleration, Velocity, Separate probe VIBRATION METER Model : VB-8202
 Acceleration, Velocity, Separate probe VIBRATION METER Model : VB-8202 Your purchase of this VIBRATION METER marks a step forward for you into the field of precision measurement. Although this METER is
 P6.5.5.4 Atomic and nuclear physics Nuclear physics γ spectroscopy Identifying and determining the activity of radioactive samples Description from CASSY Lab 2 For loading examples and settings, please
ON SITE SYSTEMS Chemical Safety Assistant
 ON SITE SYSTEMS Chemical Safety Assistant CS ASSISTANT WEB USERS MANUAL On Site Systems 23 N. Gore Ave. Suite 200 St. Louis, MO 63119 Phone 314-963-9934 Fax 314-963-9281 Table of Contents INTRODUCTION
SAFYR7 KAPPABRIDGE CONTROL SOFTWARE. User Manual
 SAFYR7 KAPPABRIDGE CONTROL SOFTWARE User Manual Version 1.1 April 2018 Contents Contents 1 Introduction 1 2 Getting Started 3 2.1 System Requirements................................. 3 2.2 Program Installation..................................
RADIOACTIVITY IN THE AIR
 RADIOACTIVITY IN THE AIR REFERENCES M. Sternheim and J. Kane, General Physics (See the discussion on Half Life) Evans, The Atomic Nucleus, pp. 518-522 Segre, Nuclei and Particles, p. 156 See HEALTH AND
BOXA-II ON-STREAM X-RAY FLUORESCENCE ANALYZER. Technical Description Version 2 BGRIMM AUTOMATION
 BOXA-II ON-STREAM X-RAY FLUORESCENCE ANALYZER Technical Description Version 2 BGRIMM AUTOMATION, South 4th Ring Road West, Beijing, China TEL: +86(10)59069762 Fax: +86(10)68360101 Contents BGRIMM AUTOMATION
FoodScreen Radiological Food Screening System
 Features Rapid screening of processed or raw food products for key 131I, 134 Cs and 137 Cs nuclides Clear, immediate indication if any nuclide-specific maximum permissible concentrations are exceeded Transportable
Quick Start Guide New Mountain Visit our Website to Register Your Copy (weatherview32.com)
") Quick Start Guide New Mountain Visit our Website to Register Your Copy (weatherview32.com) Page 1 For the best results follow all of the instructions on the following pages to quickly access real-time
Quick Start Guide New Mountain Visit our Website to Register Your Copy (weatherview32.com) Page 1 For the best results follow all of the instructions on the following pages to quickly access real-time
1220 QUANTULUS The Ultra Low Level Liquid Scintillation Spectrometer
 1220 QUANTULUS The Ultra Low Level Liquid Scintillation Spectrometer PerkinElmer LAS (UK) Ltd, Chalfont Rd, Seer Green, Beaconsfield, Bucks HP9 2FX tel: 0800 896046 www.perkinelmer.com John Davies January
CHEMISTRY 130 General Chemistry I. Radioisotopes
 CHEMISTRY 130 General Chemistry I Radioisotopes Positron Emission Tomography or PET scans use the radioisotope 18 F to create an image of the brain. DEPARTMENT OF CHEMISTRY UNIVERSITY OF KANSAS Radioisotopes
HMS-5000 Manual. Product Name: HMS-5000 Hall Effect Measurement System with variable temperature from 80K to 350K. - Manual version: ver 5.
 HMS-5000 Manual Product Name: HMS-5000 Hall Effect Measurement System with variable temperature from 80K to 350K - Manual version: ver 5.01- www.ecopia21.co.kr - Table of contents - 1. Hardware Installation
CONTENTS. Batteries. La Crosse Technology, Ltd Page 1
 515-1316 FAQS The links below will work in most PDF viewers and link to the topic area by clicking the link. We recommend Adobe Reader version 10 or greater available at: http://get.adobe.com/reader CONTENTS
GUIDE TO LABORATORY SURVEYS. Introduction
 APPENDIX - V GUIDE TO LABORATORY SURVEYS Introduction Routine laboratory surveys are an important part of the overall radiation safety program in a laboratory. Surveys provide a direct measure of the presence
SuperCELL Data Programmer and ACTiSys IR Programmer User s Guide
 SuperCELL Data Programmer and ACTiSys IR Programmer User s Guide This page is intentionally left blank. SuperCELL Data Programmer and ACTiSys IR Programmer User s Guide The ACTiSys IR Programmer and SuperCELL
OP-02 / OP-03 / OP-04
 FS-i Series Check Weighing Scales Option OP-02 / OP-03 / OP-04 WM+PD4001368 Contents 1. OP-02 BATTERY... 2 1-1. Using the OP-02 SLA Battery... 2 2. OP-03 RS-232C / RELAY OUTPUT... 4 2-1. Installation...
FIELD SPECTROMETER QUICK-START GUIDE FOR FIELD DATA COLLECTION (LAST UPDATED 23MAR2011)
") FIELD SPECTROMETER QUICK-START GUIDE FOR FIELD DATA COLLECTION (LAST UPDATED 23MAR2011) The ASD Inc FieldSpec Max spectrometer is a precision instrument designed for obtaining high spectral resolution
FIELD SPECTROMETER QUICK-START GUIDE FOR FIELD DATA COLLECTION (LAST UPDATED 23MAR2011) The ASD Inc FieldSpec Max spectrometer is a precision instrument designed for obtaining high spectral resolution
RADEAGLET. Lightweight Handheld Radioisotope Identification Device
 RADEAGLET Lightweight Handheld Radioisotope Identification Device Weighing Only 900 grams, the RADEAGLET is the Lightest HH-RIID in the world! The Perfect Instrument for First Responders Who Need to Wear
Identification of Naturally Occurring Radioactive Material in Sand
 Identification of Naturally Occurring Radioactive Material in Sand Michael Pope 2012 NSF/REU Program Physics Department, University of Notre Dame Advisors: Dr. Ed Stech, Dr. Michael Wiescher Abstract Radionuclides
Free fall with an interface system
 Related topics Motion along a straight line subject to constant acceleration, laws governing falling bodies, acceleration due to gravity. Principle and task The fall times t are measured for different
User's Manual altimeter V1.1
 User's Manual altimeter V1.1 The altimeter is completely autonomous. It can be installed on any model. It automatically detects the beginning of flights and does not record the period between two consecutive
Spectrometer User s Guide
 Spectrometer User s Guide (Order Codes: V-SPEC, SPRT-VIS, SP-VIS, SP-UV-VIS, ESRT-VIS) The spectrometer is a portable light spectrophotometer, combining a spectrometer and a light source/cuvette holder.
This experiment is included in the XRP 4.0 X-ray solid state, XRS 4.0 X-ray structural analysis, and XRC 4.0 X-ray characteristics upgrade sets.
 The intensity of characteristic X-rays as a TEP Related topics Characteristic X-radiation, energy levels, Bragg s law, and intensity of characteristic X-rays Principle The X-ray spectrum of an X-ray tube
Radiation Detection. 15 th Annual OSC Readiness Training Program.
 Radiation Detection 15 th Annual OSC Readiness Training Program www.oscreadiness.org GM Detectors 15 th Annual OSC Readiness Training Program www.oscreadiness.org 1 A closer look 15 th Annual OSC Readiness
ISSP User Guide CY3207ISSP. Revision C
 CY3207ISSP ISSP User Guide Revision C Cypress Semiconductor 198 Champion Court San Jose, CA 95134-1709 Phone (USA): 800.858.1810 Phone (Intnl): 408.943.2600 http://www.cypress.com Copyrights Copyrights
WM2014 Conference, March 2 6, 2014, Phoenix, Arizona, USA
 Experimental Comparison between High Purity Germanium and Scintillator Detectors for Determining Burnup, Cooling Time and Decay Heat of Used Nuclear Fuel - 14488 Peter Jansson *, Sophie Grape *, Stephen
1. Introduction. Welcome to WinDAS the easy way for measuring and analysing of gamma radiation from radioactive sources or samples.
 Introduction 1. Introduction Welcome to WinDAS the easy way for measuring and analysing of gamma radiation from radioactive sources or samples. The software WinDAS is designed for automatic determination
Dewpoint Meter Data Sheet / Instructions
 Paint Test Equipment Dewpoint Meter Data Sheet / Instructions Dewpoint Meter Information ISO 8502-4: Preparation of steel substrates before application of paints and related products. Tests for the assessment
Contents. Chapter 1: Introduction 4 How the Digilert200 Detects Radiation 4 Precautions 4
 TM INTERNATIONAL S.E. International, Inc. P.O. Box 39, 436 Farm Rd. Summertown, TN 38483 USA 1.800.293.5759 931.964.3561 Fax: 1.931.964.3564 www.seintl.com radiationinfo@seintl.com Contents Chapter 1:
New happenings in gamma spectroscopy data analysis Sylvie Ward Sales Support Specialist
 New happenings in gamma spectroscopy data analysis Sylvie Ward Sales Support Specialist Genie-2000 Latest Features Cascade Summing Correction LACE (Line Activity Consistency Evaluator) Interactive Nuclide
QUANTITATIVE Cs-137 DISTRIBUTIONS FROM AIRBORNE GAMMA RAY DATA
 QUANTITATIVE Cs-137 DISTRIBUTIONS FROM AIRBORNE GAMMA RAY DATA XA9745947 G. OBERLERCHER, W. SEIBERL Geological Survey of Austria, Vienna, Austria Abstract The Chernobyl reactor accident caused in Austria
Sample Alignment Part
 Sample Alignment Part Contents Contents 1. How to set Part conditions...1 1.1 Setting conditions... 1 1.2 Customizing scan conditions and slit conditions... 6 2. Sample alignment sequence...13 2.1 Direct
Determination of the Rydberg constant, Moseley s law, and screening constant (Item No.: P )
") Determination of the Rydberg constant, Moseley s law, and screening constant (Item No.: P2541001) Curricular Relevance Area of Expertise: ILIAS Education Level: Physik Topic: Hochschule Subtopic: Moderne
Determination of the Rydberg constant, Moseley s law, and screening constant (Item No.: P2541001) Curricular Relevance Area of Expertise: ILIAS Education Level: Physik Topic: Hochschule Subtopic: Moderne
Spread footing settlement and rotation analysis
 Engineering manual No. 10 Updated: 05/2018 Spread footing settlement and rotation analysis Program: File: Spread footing Demo_manual_10.gpa This engineering manual describes how the analysis of settlement