Solar_Power_Experiment_and_Equations_Mack_Grady_March 17, 2014.doc
|
|
|
- Kelly Houston
- 6 years ago
- Views:
Transcription
1 Report Details Choose any of the solar stations, but take your measurements only when the short circuit current is at least 3.5A. The weather forecast from can help you plan your schedule. Your report should include graphs of I versus V, and P versus V. Both actual data and Excel approximations should be plotted together. When plotting with Excel, be sure to use the scatter plot option so that the non-uniform spacing between voltage points on the x-axis show correctly. You should also work out numerical values for Equations (1) (10) for the day and time of your measurements. Overview Incident light can be converted into electricity by photovoltaic conversion using a solar. A solar consists of individual cells that are large-area semiconductor diodes, constructed so that light can penetrate into the region of the p-n junction. The junction formed between the n- type silicon wafer and the p-type surface layer governs the diode characteristics as well as the photovoltaic effect. Light is absorbed in the silicon, generating both excess holes and electrons. These excess charges can flow through an external circuit to produce power. Photons Junction n-type p-type I V + External circuit (e.g., battery, lights) 5 Isc BV A ( e 1) I V + External circuit (e.g., battery, lights) Diode Amps Diode Volts 0.6 Figure 1. Equivalent Circuit of a Solar Cell BV Diode current A ( e 1) comes from the standard I-V equation for a diode, plotted above. From Figure 1, it is clear that the current I that flows to the external circuit is Page 1 of 32
2 BV I I sc A( e 1). If the solar cell is open circuited, then all of the I sc flows through the diode and produces an open circuit voltage of about V. If the solar cell is short circuited, then no current flows through the diode, and all of the I sc flows through the short circuit. Since the V oc for one cell is approximately V, then individual cells are connected in series as a solar to produce more usable voltage and power output levels. Most solar s are made to charge 12V batteries and consist of 36 individual cells (or units) in series to yield V oc 18-20V. The voltage for maximum power output is usually about 16-17V. Each V series unit can contain a number of individual cells in parallel, thereby increasing the total surface area and power generating capability. I sc I m I I I sc BV A( e 1), where A, B, and especially Isc vary with solar insolation Increasing solar insolation Maximum power point Pmax V m I m 0 0 V m V oc V Figure 2. I-V Characteristics of Solar Panel On a clear day, direct normal solar insolation (i.e., incident solar energy) is approximately 2 1kW / m. Since solar efficiencies are approximately 14%, a solar will produce about 140W per square meter of surface area when facing a bright. High temperatures reduce efficiency. For 24/7 power availability, solar power must be stored in deepdischarge batteries that contain enough energy to power the load through the nighttime and overcast days. On good solar days in Austin, you can count on solar s producing about 1kWH of energy per square meter. An everyday use of solar power is often seen in school zone and other LED flashing signs, where TxDOT and municipal governments find them economical when conventional electric service is not readily available or when the monthly minimum electric fees are large compared to the monthly kwh used. Look for solar s on top of these signs, and also note their orientation. Page 2 of 32
3 The Solar Panels on ENS Rooftop The ENS rooftop is equipped with six pairs of commercial 12V class s, plus one larger 24V class commercial. The s are: three pair of British Petroleum BP585, (mono-crystalline silicon, laser grooved, each 85W, voltage at maximum power = 18.0V, current at maximum power = 4.7A, open circuit voltage = 22.3V, short circuit current = 5.0A). These three pairs are connected to ENS212 stations 17, 18, and 19. two pair of Solarex SX85U (now BP Solar) (polycrystalline silicon, each 85W, voltage at maximum power = 17.1V, current at maximum power = 5.0A, open circuit voltage = 21.3V, short circuit current = 5.3A). These two pairs are connected to ENS212 stations 15 and 16. one pair of Photowatt PW (multi-crystalline cells, each 80W, voltage at maximum power = 17.3V, current at maximum power = 4.6A, open circuit voltage = 21.9V, short circuit current = 5.0A). This pair is connected to ENS212 station 21. one British Petroleum BP3150U, 150W (multicrystalline), open circuit voltage = 43.5V, short circuit current = 4.5A. This is connected to ENS212 station 20. Each of the seven stations is wired to ENS212 and has an open circuit voltage of approximately 40V and a short circuit current of approximately 5A. The I-V and P-V characteristics for one of the pairs is shown in Figure 3. The I-V curve fit equation for Figure 3 is I ( V ) e V Page 3 of 32
4 PV Station, Bright Sun PV Station 13, Bright Sun, Dec. 6, I - amps V() - volts PV Station, Bright Sun PV Station 13, Bright Sun, Dec. 6, P() - watts V() - volts Figure 3. I-V and P-V Characteristics for One of the Panel Pairs (data points taken by loading the pair with a variable load resistor) Maximum Power As seen in bottom figure of Figure 3, s have a maximum power point. Maximum power corresponds to Vm and Im in Figure 2. Because solar power is relatively expensive (approx. $4-5 per watt for the s, plus the same amount for batteries and electronics), it is important to operate s at their maximum power conditions. Unfortunately, Vm, Im, and the Thevenin Page 4 of 32
5 equivalent resistance vary with light level. DC-DC converters are often used to match the load resistance to the Thevenin equivalent resistance of the to maximize the power drawn from the. These smart converters (often referred to as tracking converters ) also charge the storage batteries in such a way as to maximize battery life. Sun Position, Panel Orientation, and PV Harvest Prediction The Big 10 Equations Ideally, a solar should track the so that the incident solar rays are perpendicular to the surface, thus maximizing the capture of solar energy. However, because of high wind loads, most s are fixed in position. Often, tilt (with respect to horizontal) is adjusted seasonally. Orientation of fixed s should be carefully chosen to capture the most energy for the year, or for a season. The position of the in the sky varies dramatically with hour and season. Sun angle azimuth is expressed in degrees from vertical. Sun azimuth is expressed in degrees from true north. Sun and azimuth angles are illustrated in Figure 4. Up ( z axis) Line perpendicular to horizontal plane Horizontal plane East (y axis) azimuth North (x axis) West Note because of magnetic declination, a compass in Austin points approximately 7º east of north. Figure 4. Sun Zenith and Azimuth Angles Sun position angles are available in many references, and with different levels of complexity. Some of the following equations were taken from the University of Oregon Solar Radiation Monitoring Laboratory ( Sun declination angle (in degrees) is 23.45sin( B), where 360 B ( n 81) degrees, and 365 n = day of year (i.e., 1,2,3,, 364,365). (1) First Day of n First Day of n January 1 July 182+ February 32 August 213+ March 60+ September 244+ April 91+ October 274+ May 121+ November 305+ June 152+ December add 1 for leap years Page 5 of 32
6 Equation of time (in decimal minutes) is E qt 9.87 sin(2b) 7.53cos( B) 1.5sin( B). (2) Solar time (in decimal hours) is T solar Eqt Longitudetimezone Longitudelocal T, (3) local where T local is local standard time in decimal hours, Longitude timezone is the longitude at the eastern edge of the time zone (e.g., 90 for Central Standard Time). (Note in the Solar_Data_Analyzer Excel spreadsheet program, Longitudetimezone Longitude local is entered as Longitude shift (deg). At Austin, with Longitude , the longitude shift is local Hour angle (in degrees) is 15. (4) H 12 T solar Cosine of the angle is cos sin( L) sin( ) cos( L) cos( ) cos( H ), (5) where L is the latitude of the location. Solar azimuth comes from the following calculations. Using the formulas for solar radiation on tilted surfaces, consider vertical surfaces directed east and south. The fraction of direct component of solar radiation on an east-facing vertical surface is f VE cos( )sin( H ). (6) The fraction of direct component of solar radiation on a south-facing vertical surface is f VS sin( )cos( L) cos( )sin( L)cos( H ). (7) Page 6 of 32
7 Equations (6) and (7) correspond to the projections, on the horizontal plane, of a vector pointing azimuth toward the. By examining Figure 4, can be found as follows: azimuth 1 f If f VE 0, VS cos degrees, 2 2 fve fvs azimuth 1 fvs If f VE 0, 180 cos degrees. (8) 2 2 fve fvs As a check, all components of the radiation should account for the total, i.e. 2 2 VE f VS f cos 2 1. Illustrations of seasonal and daily positions for Austin are shown in Figures 5a and 5b. An example of the step-by-step calculations for 3pm (i.e., decimal hours) on October 25 th in Austin follows. Input n = 298 th day Compute B = 214.0º Compute º Compute E decimal minutes qt Input Longitude = 97.74º Input Longitude shift = º Input T decimal hours local Compute T decimal hours solar Compute H º Input Latitude (L) = 30.29º Compute f VE 58.81º Compute Compute f Compute VS azimuth º output output Page 7 of 32
8 Solar Zenith versus Azimuth at Austin 22nd Day of Dec, Jan, Feb, Mar, Apr, May, Jun (Sun hrs/day. Dec=10.0,Jan=10.3,Feb=11.0,Mar=12.0,Apr=12.8,May=13.6,Jun=13.9) 0 Azimuth (South = 180) Zenith (Degrees from Vertical) Figure 5a. Sun Position for Winter and Spring Seasons in Austin (note solar noon in Austin occurs at approximately 12:30pm CST) Solar Zenith versus Azimuth at Austin 22nd Day of Jun, Jly, Aug, Sep, Oct, Nov, Dec (Sun hrs/day. Jun=13.9,Jly=13.6,Aug=12.8,Sep=12.0,Oct=11.0,Nov=10.3,Dec=10.0) 0 Azimuth (South = 180) Zenith (Degrees from Vertical) Figure 5b. Sun Position for Summer and Fall Seasons in Austin (note solar noon in Austin occurs at approximately 12:30pm CST) Page 8 of 32
9 Definitions from Twilight This is the time before rise and after set where it is still light outside, but the is not in the sky. Civil Twilight This is defined to be the time period when the is no more than 6 degrees below the horizon at either rise or set. The horizon should be clearly defined and the brightest stars should be visible under good atmospheric conditions (i.e. no moonlight, or other lights). One still should be able to carry on ordinary outdoor activities. Nautical Twilight Astronomical Twilight Length Of Day Length Of Visible Light Altitude (or Elevation) Azimuth This is defined to be the time period when the is between 6 and 12 degrees below the horizon at either rise or set. The horizon is not defined and the outline of objects might be visible without artificial light. Ordinary outdoor activities are not possible at this time without extra illumination. This is defined to be the time period when the is between 12 and 18 degrees below the horizon at either rise or set. The does not contribute to the illumination of the sky before this time in the morning, or after this time in the evening. In the beginning of morning astronomical twilight and at the end of astronomical twilight in the evening, sky illumination is very faint, and might be undetectable. This is defined to be the time of Actual Sunset minus the time of Actual Sunrise. The change in length of daylight between today and tomorrow is also listed when available. This is defined to be the time of Civil Sunset minus the time of Civil Sunrise. First, find your azimuth. Next, the Altitude (or elevation) is the angle between the Earth's surface (horizon) and the, or object in the sky. Altitudes range from -90 (straight down below the horizon, or the nadir) to +90 (straight up above the horizon or the Zenith) and 0 straight at the horizon. The azimuth (az) angle is the compass bearing, relative to true (geographic) north, of a point on the horizon directly beneath the. The horizon is defined as an imaginary circle centered on the observer. This is the 2-D, or Earth's surface, part of calculating the 's position. As seen from above the observer, these compass bearings are measured clockwise in degrees from north. Azimuth angles can range from is due geographic north, 90 due east, 180 due south, and 360 due north again. Page 9 of 32
10 Hour Angle of the Sun Mean Anomaly of the Sun Obliquity Right Ascension of the Sun Solar Noon (and Solar Time) Sun Declination The Solar Hour Angle of the Sun for any local location on the Earth is zero when the is straight overhead, at the, and negative before local solar noon and positive after solar noon. In one 24-hour period, the Solar Hour Angle changes by 360 degrees (i.e. one revolution). The movement of the Earth around the Sun is an ellipse. However, if the movement of the Earth around the Sun were a circle, it would be easy to calculate its position. Since, the Earth moves around the about one degree per day, (in fact, it's 1/ of the circle), we say the Mean Anomaly of the Sun is the position of the Earth along this circular path. The True Anomaly of the Sun is the position along its real elliptical path. Obliquity is the angle between a planet's equatorial plane and its orbital plane. The Celestial Sphere is a sphere where we project objects in the sky. We project stars, the moon, and, on to this imaginary sphere. The Right Ascension of the Sun is the position of the on our Celestial Sphere Solar Time is based on the motion of the around the Earth. The apparent 's motion, and position in the sky, can vary due to a few things such as: the elliptical orbits of the Earth and Sun, the inclination of the axis of the Earth's rotation, the perturbations of the moon and other planets, and of course, your latitude and longitude of observation. Solar Noon is when the is at the highest in the sky, and is defined when the Hour Angle is 0. Solar Noon is also the midpoint between Sunrise and Sunset. The Declination of the is how many degrees North (positive) or South (negative) of the equator that the is when viewed from the center of the earth. The range of the declination of the ranges from approximately (North) in June to (South) in December. Page 10 of 32
11 Panel Orientation and Solar Incident Angle Unless there are obstructions, s should face due south (i.e., have an azimuth angle of 180º). Recommended tilt angles (above horizontal) are latitude + 15º in winter, and latitude 15º in summer. In Austin, with latitude = 30º, these recommendations correspond to 45º in winter, and 15º in summer. If no seasonal adjustments are made, then the best fixed tilt angle is latitude (i.e., 30º in Austin). The tilt angles of our s are adjusted twice each year, at the spring and fall equinoxes. Our tilt angles are 20o in summer, and 45o in winter. tilt Line perpendicular to horizontal plane Line perpendicular to surface tilt Edge of Horizontal plane Figure 6. Panel Tilt Angle Area of each is 0.54m2 Area of this is 1.04m2 Station 19 BP Station 17 BP Area of each is 0.52m2 Area of each is 0.60m2 Station 21 Photowatt Station 20 BP Station 19 BP Station 17 BP Station 16 Solarex Station 15 Solarex Station 21 Photowatt Station 18 BP Station 18 BP Station 16 Solarex Station 15 Solarex All s atop ENS have azimuth angle = 190 o View Facing Front of ENS Panels (i.e., looking toward north) (Note areas shown are for individual s, so for a pair, double the values shown) Page 11 of 32


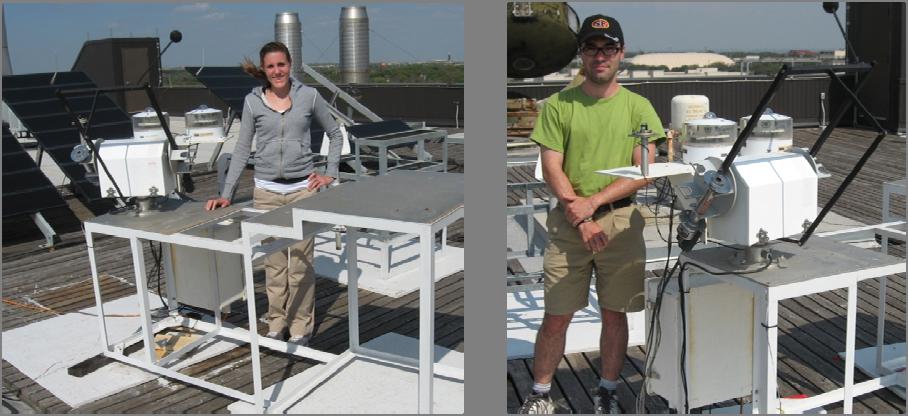
12 Panels atop ENS Page 12 of 32
13 The angle between the rays of the and a vector perpendicular to the surface is known as the angle of incidence ( incident ). The cosine of incident is found by first expressing a unit vector pointed toward the, and a unit vector perpendicular to the surface, and then taking the dot product of the two unit vectors. When cos( incident ) 1, then the s rays are perpendicular to the surface, so that maximum incident solar energy is captured. The expressions follow. Considering Figure 4, the unit vector pointed toward the is aˆ azimuth a ˆ azimuth x a ˆ sin cos sin sin y cos a ˆ z. Considering Figure 6, the unit vector perpendicular to the surface is aˆ tilt azimuth a ˆ tilt azimuth x a ˆ tilt sin cos sin sin y cos a ˆ z The dot product of the two unit vectors is then cos incident a ˆ aˆ sin cos azimuth sin tilt cos azimuth azimuth tilt azimuth tilt sin sin sin sin cos cos. Combining terms yields cos incident sin sin tilt cos azimuth cos azimuth sin azimuth sin azimuth tilt cos cos. Simplifying the above equation yields the general case, cos incident sin sin tilt cos azimuth azimuth tilt cos cos. (9) Some special cases are tilt 1. Flat (i.e., 0 ). Then, incident cos cos. 2. Sun directly overhead (i.e., 0). Then, Page 13 of 32
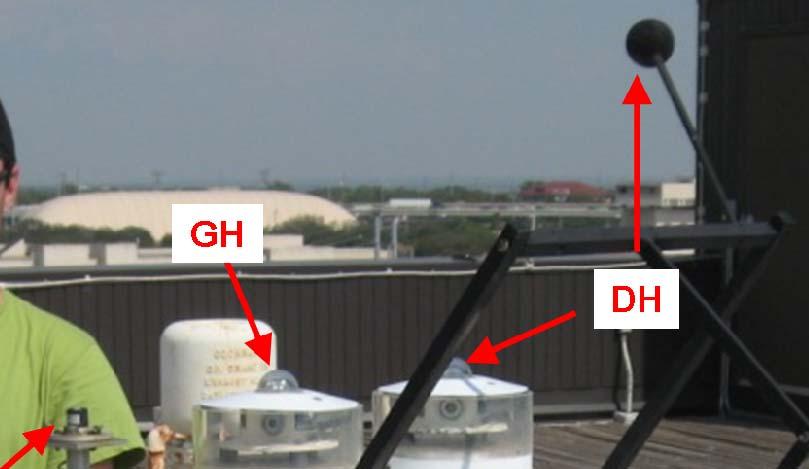
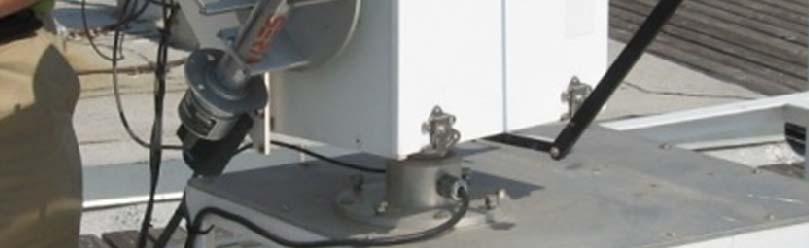
14 tilt cos incident cos. azimuth azimuth 3. Equal azimuth angles (i.e., azimuth tracking, ). Then, tilt tilt tilt cos incident sin sin cos cos cos. 4. Sun angle equals tilt angle (i.e., tracking, ). Then, cos azimuth azimuth 2 cos 2 incident sin cos. tilt To illustrate the general case, consider the following example: 3pm (standard time) in Austin on October 25. The position is azimuth = 228.7º, and the angles are azimuth = 190º, = 58.8º, so that aˆ 0.565aˆ x 0.643aˆ y 0.517aˆ z, tilt Evaluating the dot product yields = 45º, so that aˆ 0.696aˆ x aˆ y 0.707aˆ z. cos incident = 0.838, so incident = 33.1º. Solar Radiation Measurements The three most important solar radiation measurements for studying solar performance are global horizontal (GH), diffuse horizontal (DH), and direct normal (DN). GH is entire sky, including the disk, looking straight up. DH is entire sky, excluding the disk, looking straight up. DN is facing directly toward the. The units for GH, DH, and DN are W/m2. The direct measurement of DN requires a tracking device. The Sci Tek 2AP tracker takes DN, GH, and DH readings every five minutes using three separate thermocouple sensors. The DN sensor tracks and sees only the disk of the. The GH sensor points straight up and sees the entire sky with disk. The DH sensor points straight up, but a shadow ball blocks the disk of the, so that it sees entire sky minus disk. Rotating shadowband pyranometers use one PV sensor, pointed straight up, to measure GH and DH every minute, and then save average values every 5 minutes. Once per minute, the shadow band swings over, and when the shadow falls on the sensor, the DH reading is taken. Using GH and DH, the rotating shadow-band pyranometer estimates DN. Page 14 of 32

15 Rotating Shadowband Pyranometers Rotating shadow band pyranometers are simple in that they do not track the. Instead, they merely rotate a shadow band every minute across the PV sensor. When there is no shadow on the sensor, the sensor reads GH. When the shadow falls on the sensor, the sensor reads DH. Computing Incident Solar Power on a Panel Surface To compute the incident solar power on a surface, we assume that the captures all of the diffuse horizontal (DH) power, plus the fraction of (GH DH) that is perpendicular to the surface. ( GH DH ) Pincident DH cos( incident ) W/m2. (10) cos( ) The above value, in W/m2, is then multiplied by the surface area to yield total incident solar power P incident. Multiplying by efficiency yields maximum expected electrical power output. Because s are rated at 1kW/m2, (10) is also the estimated W output per kw rated. Integrate over all hours of the day and divide by 1000, and you get estimated kwh output per kw rated (i.e., the PV daily harvest). Considering inverter losses and the fact that s are likely not on their true max power operating points some of the time, a realistic efficiency multiplier of 0.7 to 0.8 should be applied. To avoid serious overcorrection when the is near the horizon, ignore the cos( ) term when > 85º. For the 3pm, October 25 th 2 example, the readings are GH 535W / m, and 2 DH 38W / m, Page 15 of 32
16 Solar_Power_Experiment_and_Equations_Mack_Grady_March 17, 2014.doc (535 38) Pincident 38 cos(33.1 ) A = 844 A W / m 2, cos(58.9 ) which means that a PV or array would produce 844 W per kw rated power. NREL Sci Tec Two-Axis Tracker Page 16 of 32

17 Computing Sunrise and Sunset Times To reduce the volume of data stored and processed, it is best to start and stop solar data loggers just before rise and just after set. I developed the following empirical formulas for rise and set, which are applicable to north latitudes 25 through 45. The worst-case error is 6 minutes. To take into account the error and the fact that the formulas apply to the situation where one-half of the is above the horizon, start/stop 15 minutes before/after the computed values. Sunrise A rise 2 DOY B sin 365 Crise 4 DOY D sin E, 180 where Sunrise is the decimal minute of the day at the eastern edge of the time zone, and DOY is day of the year (1 through 365, ignore leap year), A rise 360, C rise 94, D 9. 0, E 20. 1, B B 2 0B1L B2L B , B , B , where L is latitude north, Sunset follows the same formula, but replace A A rise 720, C C rise 168. set set A rise with A set, and C rise with C set, where To correct for locations west of the eastern edge, recall that the moves 15 degrees of longitude in one hour, which corresponds to 4 minutes delay per degree of longitude. Rotating Shadow Band Monitor at Toyah, TX Page 17 of 32
18 Master s Clear Sky Equations The Master s textbook, G. M. Masters, Renewable and Efficient Electric Power Systems, John Wiley & Sons, 2004, gives a set of equations knows as clear sky equations. These equations predict solar intensity for cloudless, very clear days that are common in West Texas, especially in winter. They have proven very useful for checking the reasonableness of measured data on very clear days, and for giving best case daily harvest predictions. The twelve steps for predicting the incident solar energy on a solar for a given day and time is given here. And, given a year of actual data, it is possible to adjust the variables of these equations to account for the local atmosphere. 1. Extraterrestrial Solar Insolation I 0 (just outside Earth s atmosphere) [Master s 7.20, Solar_Data_Analyzer Col. N] 360N I 0 SC cos( ) 365 W/m 2, where SC (solar constant) = kw/ m 2. N = Day of Year, Note from the table: I 0 is max in winter, min in summer, nominal at equinoxes, and has 6.8% peakto-peak variation. The above equation is not actually used in the following Clear Sky predictions. N Approx. Value of Bracketed Term Air Mass Ratio m (relative atmosphere travel distance to reach Earth s surface) [Master s 7.4, Solar_Data_Analyzer Col. O] 1 m cos( ) 3. Apparent Extraterrestrial Flux A [Master s 7.22, Solar_Data_Analyzer Col. P] 360 A sin ( N 275) 365 W/m 2, or in general form, 360 A A1 A2 sin ( N N A) 365 W/m 2, where Note from the table: A is max in winter, min in summer, nominal at equinoxes, and has 12.9% peak-to-peak variation 4. Optical Depth k [Master s 7.23, Solar_Data_Analyzer Col. Q] N Approx. Value of Second term Page 18 of 32
19 360 k sin ( n 100) 365, or in general form 360 k K1 K2 sin ( N N K ) Beam Reaching Earth I B [Master s 7.21, Solar_Data_Analyzer Col. R] km I B Ae W/m 2 6. Sky Diffuse Factor C [Master s 7.28, Solar_Data_Analyzer Col. S] 360 C sin ( n 100) 365, or in general form, 360 C C1 C2 sin ( N NC ) Diffuse Radiation on Horizontal Surface I DH [Master s 7.27, Solar_Data_Analyzer Col. T] I C W/m 2 DH I B 8. Beam Normal to a Panel I BC [Master s 7.24, Solar_Data_Analyzer Col. U] I ) W/m 2 BC I B cos( incident 9. Beam on Horizontal Surface I BH [Master s 7.25, Solar_Data_Analyzer Col. V] I BH I B cos( ) W/m Diffuse Radiation on Panel I DC [Master s 7.29, Solar_Data_Analyzer Col. W] 1 costilt I DC I DH 2 W/m Reflected on Panel I RC (from the ground and surrounding objects) [Master s 7.30, Solar_Data_Analyzer Col. X] 1 costilt I RC I BH I DH 2 W/m 2, where ground reflectance is typically 0.2, but can be as large as 0.8 for fresh snow. Page 19 of 32

20 12. Total Clear Sky Insolation on Panel I C [Master s 7.32, Solar_Data_Analyzer Col. Y] I I I I W/m 2 C BC DC RC The Experiment Your assignment is to measure the I-V and P-V characteristics of a solar pair, plot the points, determine maximum power, estimate efficiency, and use the Excel Solver to approximate the I-V and P-V curves using BV BV I I A( e 1), P VI V I A( e 1), sc sc where the Solver estimates coefficients Isc, A, and B from your measured I-V data set. See the Appendix for a description of the Excel Solver. Experimental Procedure You will need about 30 minutes to take the experimental data. Go to an available station, and check the short circuit current. Take your measurements when the short circuit current is at least 3.5A (try for a ny day, between 11:30am and 1:30pm. CDT (corresponding to solar noon, plus or minus 1 hour). (Note - weather site can help you make your plans for upcoming days.) Then, using the voltage at the (i.e., the left-most meter in the yellow solar interface box), and the ammeter (the rightmost meter), perform the following steps given below, recording and plotting your data on the experimental form and on the graph as you go: Voltage at solar Voltage at lab bench (don t record) Current Page 20 of 32
21 Form and Graph for Recording and Plotting Your Readings as You Take Them (have this page signed by Dr. Grady before beginning your report) Panel Station = Date and Time of Measurements=, Sky Conditions = V* I* P (i.e., V Notes I ) Voc = Open circuit condition 2V spacing for V > 25V 5V spacing for V 25V Isc = Short Circuit Condition * V (i.e., at the ) is the left-most meter in the yellow interface box, and I is the right-most meter. 6A 5A 4A 3A 2A 1A 0A 0V 10V 20V 30V 40V 50V Page 21 of 32


22 Steps 1. Measure the pair s open circuit voltage, and record in the table and on the graph. The current is zero for this case. 2. Short the output terminals with one of the red shorting bar or with a wire. Measure the short circuit current and pair voltage. Record both and add the point to your graph. The voltage will be small for this condition. 3. Connect one of the solar testers (i.e., the heavy-duty variable resistor boxes with the large knobs) to the pair output terminals. You will use the variable rheostat and switch to sweep the entire I-V curve. 4. Beginning with the near open circuit condition, (i.e., maximum resistance), lower the solar tester resistance so that the pair voltage decreases from open circuit toward zero in steps of approximately 2V between 25-40V, and in 5V steps below 25V. Record pair voltage and current at each step, and hand plot I versus V results as you go. If your points do not form a smooth curve, you may want to retake the outliers. Cloud movement can cause these variations. The laboratory measurement portion of the experiment is now completed. Your graph should be fairly smooth and free of outlying points. You can now leave the lab bench. Next, you will 5. Download Excel file PV_Plots_Solver.xls from the course web page, and then enter your V and I values in Excel. Modify the plot command so that all the data for your experiment will be plotted. Plot I versus V points, and P = V I versus V points using the scatter plot option. 6. Visually estimate Vm, Im, and Pmax (i.e., peak power conditions) from your plots. 7. Use the Excel Solver to compute coefficients Isc, A, and B from your I-V data. Modify the Solver command so that all your data will be included in the calculations. Page 22 of 32
23 Superimpose the Solver equations on the I-V and P-V graphs of Step 5. See the Appendix for Solver instructions. Use your Solver graph to estimate Pmax. Now, use the following steps to estimate pair efficiency: 8. Go to the class web page and download the Excel spreadsheet and solar data files Solar_Data_Analyzer.xls, and SOLAR_DATA_through_XXX.zip, (XXX is the last data day in the zip) Note the 1-minute data averages are recorded by a shadow band tracker atop ETC and are updated daily on the web page while EE462L is being taught. 9. Display the data for your day (note these data are given in Central Standard Time). 10. For the minute that best represents your time of measurements, work through the Big 10 equations. 11. Compare your Big 10 equations to the Solar_Data_Analyzer spreadsheet values for your day/minute (see Appendix B). 12. For your day, use the Solar_Data_Analyzer spreadsheet as demonstrated in class to predict Method 1 daily kwh per installed kw for for fixed azimuth = 180, and tilts 20, 30, and 40 degrees, for single axis tracking, azimuth = 180, tilt = 20 and 30, for two-axis tracking. Interpret and comment on the results. Page 23 of 32

24 Appendix A: Using the Excel Solver to Curve-Fit Measured Data The Excel Solver is not part of the Typical User installation. Check to see if the Solver is activated in your Excel installation by selecting Tools, and then Add-Ins. If Solver is checked, it is ready for use. Otherwise, check Solver Add-In, and Excel will guide you through the steps. It will probably be necessary to insert your Excel installation CD rom. To use Solver, refer to the following page. Enter your V and I data, and establish cells for I equation coefficients Isc, A, and B. Then, key-in the I equation shown previously to form a column of predicted currents, linking each cell to the Isc, A, and B cells. Next, establish a column of squared errors for current, and then one cell with sum of squared errors. Coefficients of I Equation Add rows so you can enter all your data points PV Station 13 Isc= 5.340E+00 A= 5.232E-03 B= 1.778E-01 V I I equation (I error)^2 P = VI E E E E E E Currents Predicted by I Equation Sum of Squared Errors Individual Squared Errors Page 24 of 32


25 Now, under Tools, select Solver. The following window will appear. Enter your Target Cell (the sum of squared errors cell), plus the Changing Cells that correspond to Isc, A, and B. It is for your starting values for I sc, A, and B are reasonable. You should probably use the A and B values shown above as your starting point. Use your own measured short circuit current for I sc. Be sure to request Min to minimize the error, and then click Solve. If successful, click OK and then plot your measured I, and your estimated I, versus V to make a visual comparison between the measured and estimated currents. Use the scatter plot option to maintain proper spacing between voltage points on the x-axis. If unsuccessful when curve fitting, try changing Isc, A, or B, and re-try. Page 25 of 32
 and spreadsheet in a directory named C:\SOLAR_DATA, and then Double-click on Solar_Data_Analyzer_130123.xlsm. Enable macros (you can trust me!")

26 Appendix B: Daily Analysis of Solar Radiation Data Taken by Rotating Shadow Band Radiometers, Using Solar_Data_Analyzer.xlsm Spreadsheet Put the daily data files (unzipped) and spreadsheet in a directory named C:\SOLAR_DATA, and then Double-click on Solar_Data_Analyzer_ xlsm. Enable macros (you can trust me!) In order to speed up execution, pull up the bottom of the spreadsheet screen so that the graphs are hidden. If the graphs are displayed during execution, they will be continually updated as solar data files are read, which slows down execution. Press Execute in the top left corner, and the program interface will appear Page 26 of 32

27 Select the station (e.g., BAYLOR_SOLAR) Insert the year, and then day of year (three digits) in the day box Click "READ". The spreadsheet is slow to read the day, perhaps 2-minues, because it is building graphs that describe the day and predict solar performance with fixed, singleaxis, and double-axis tracking. When the spreadsheet is actually reading the data file, you will see minute-by-minute updates in the green boxes near the top of Column J. Once the program has finished reading the day, you will see the green OK light and the fields in the Single Day Analysis box will be populated. Page 27 of 32

28 You can click "STOP" to reset, and then start over with a new day. Print the spreadsheet, black-and-white is OK, which will produce one page that summarizes the day and also points out any measurement problems The example shown above (Baylor, Jan. 19, 2013) is a day with some, interrupted by cloud shadows. Sunny periods are when the measured GH has peaks (purple curve in left graph, black curve in right graph). Indication of proper shadow band movement is shown where the green curve (DH) in the right graph is below or borders the black curve (GH). If DH consistently rises to GH, there is either no measurable beam, or the shadow band is stuck. Keep the prints in a three-ring binder. Also, keep a spreadsheet table that shows for each day the values of Station Name, Year, Day of Year, Month (name), Day of Month, Meas. GH, Clear Sky GH, Measured PA, Clear Sky PA, PA Calc. Method 1, and and a column for observations such as odd events, and any indications of suspect data such as stuck shadow band or missing values. More example days follow: Page 28 of 32
29 Baylor, Jan. 20, 2013 Clear sky conditions. Shadow band stops operating just before 15:00. While not obvious to the user, the GH, DH readings are about 20% high because calibration had not yet been performed. Toyah, Jan. 22, 2013 Clear sky conditions. In addition to GH, DH, Toyah has a PA sensor and a backup GH sensor Page 29 of 32
30 Toyah, Jan. 01, 2013 Clear air with moving shadows from white cumulus clouds until 14:30, then becoming mostly cloudy. Note the high peaks in GH due to an intense surrounded by bright white clouds. The peaks are higher than clear sky conditions on the previous figure. Page 30 of 32


31 Appendix C: National and State Solar Insolation Data Direct Solar Insolation Levels (courtesy of Texas State Energy Conservation Office, AVERAGE DIRECT NORMAL INSOLATION MAP LEGEND COLOR KEY per day (kwh/m 2 -day) per YEAR (MJ/m2) (quads/100 mi 2 ) <3.0 <3,940 < ,940-4, ,600-5, ,260-5, ,910-6, ,570-7, ,230-7, ,880-8, ,540-9, >7.0 >9,200 >2.3 Page 31 of 32

32 Appendix D: Magnetic Declination Page 32 of 32
Solar_Power_Experiment_and_Equations_Mack_Grady_May_08_2012.doc
 Report Details Choose any of the solar stations, but take your measurements only when the short circuit current is at least 3.5A. The weather forecast from www.weatherunderground.com can help you plan
Exercise 6. Solar Panel Orientation EXERCISE OBJECTIVE DISCUSSION OUTLINE. Introduction to the importance of solar panel orientation DISCUSSION
 Exercise 6 Solar Panel Orientation EXERCISE OBJECTIVE When you have completed this exercise, you will understand how the solar illumination at any location on Earth varies over the course of a year. You
Sunlight and its Properties II. EE 446/646 Y. Baghzouz
 Sunlight and its Properties II EE 446/646 Y. Baghzouz Solar Time (ST) and Civil (clock) Time (CT) There are two adjustments that need to be made in order to convert ST to CT: The first is the Longitude
Earth Motions Packet 14
 Earth Motions Packet 14 Your Name Group Members Score Minutes Standard 4 Key Idea 1 Performance Indicator 1.1 Explain complex phenomena, such as tides, variations in day length, solar insolation, apparent
ME 476 Solar Energy UNIT THREE SOLAR RADIATION
 ME 476 Solar Energy UNIT THREE SOLAR RADIATION Unit Outline 2 What is the sun? Radiation from the sun Factors affecting solar radiation Atmospheric effects Solar radiation intensity Air mass Seasonal variations
CCMR Educational Programs
 CCMR Educational Programs Title: Date Created: August 10, 2006 Latest Revision: August 10, 2006 Author(s): Myriam Ibarra Appropriate Level: Grades 8-10 Abstract: Energy and the Angle of Insolation Sun
Solar Time, Angles, and Irradiance Calculator: User Manual
 Solar Time, Angles, and Irradiance Calculator: User Manual Circular 674 Thomas Jenkins and Gabriel Bolivar-Mendoza 1 Cooperative Extension Service Engineering New Mexico Resource Network College of Agricultural,
LESSON PLAN - Optimum Orientation of Solar Panels Using Soltrex Data
 LESSON PLAN - Optimum Orientation of Solar Panels Using Soltrex Data Title of Lesson: Optimum Orientation of Solar Panels Using Soltrex Data Description of class: High School physics, astronomy, or environmental
Optimizing the Photovoltaic Solar Energy Capture on Sunny and Cloudy Days Using a Solar Tracking System
 Optimizing the Photovoltaic Solar Energy Capture on Sunny and Cloudy Days Using a Solar Tracking System Nelson A. Kelly and Thomas L. Gibson Chemical Sciences and Material Systems Laboratory General Motors
Sunlight and its Properties Part I. EE 446/646 Y. Baghzouz
 Sunlight and its Properties Part I EE 446/646 Y. Baghzouz The Sun a Thermonuclear Furnace The sun is a hot sphere of gas whose internal temperatures reach over 20 million deg. K. Nuclear fusion reaction
5 - Seasons. Figure 1 shows two pictures of the Sun taken six months apart with the same camera, at the same time of the day, from the same location.
 ASTR 110L 5 - Seasons Purpose: To plot the distance of the Earth from the Sun over one year and to use the celestial sphere to understand the cause of the seasons. What do you think? Write answers to questions
Computer Activity #3 SUNRISE AND SUNSET: THE SEASONS
 NAME(S)!!!!!!!!!!!!!!!!!!!!!!!!!!!!!!!!!! ASTRONOMY 25 Computer Activity #3 SUNRISE AND SUNSET: THE SEASONS SECTION DAY/TIME S. V. LLOYD Overview The seasonal variation in temperature is due to two changes
C) the seasonal changes in constellations viewed in the night sky D) The duration of insolation will increase and the temperature will increase.
 the seasonal changes in constellations viewed in the night sky D) The duration of insolation will increase and the temperature will increase.") 1. Which event is a direct result of Earth's revolution? A) the apparent deflection of winds B) the changing of the Moon phases C) the seasonal changes in constellations viewed in the night sky D) the
1. Which event is a direct result of Earth's revolution? A) the apparent deflection of winds B) the changing of the Moon phases C) the seasonal changes in constellations viewed in the night sky D) the
Agricultural Science Climatology Semester 2, Anne Green / Richard Thompson
 Agricultural Science Climatology Semester 2, 2006 Anne Green / Richard Thompson http://www.physics.usyd.edu.au/ag/agschome.htm Course Coordinator: Mike Wheatland Course Goals Evaluate & interpret information,
CHARTING THE HEAVENS USING A VIRTUAL PLANETARIUM
 Name Partner(s) Section Date CHARTING THE HEAVENS USING A VIRTUAL PLANETARIUM You have had the opportunity to look at two different tools to display the night sky, the celestial sphere and the star chart.
FLATE Hillsborough Community College - Brandon (813)
") The Florida Advanced Technological Education (FLATE) Center wishes to make available, for educational and noncommercial purposes only, materials relevant to the EST1830 Introduction to Alternative/Renewable
The Florida Advanced Technological Education (FLATE) Center wishes to make available, for educational and noncommercial purposes only, materials relevant to the EST1830 Introduction to Alternative/Renewable
Motion of the Sun. View Comments
 Login 2017 Survey to Improve Photovoltaic Education Christiana Honsberg and Stuart Bowden View Comments Instructions 1. Introduction 2. Properties of Sunlight 2.1. Basics of Light Properties of Light Energy
EELE408 Photovoltaics Lecture 04: Apparent Motion of the Sum
 EELE408 Photovoltaics Lecture 04: Apparent Motion of the um Dr. Todd J. Kaiser tjkaiser@ece.montana.edu Apparent motion of the sun EAT Department of Electrical and Computer Engineering Montana tate University
Which Earth latitude receives the greatest intensity of insolation when Earth is at the position shown in the diagram? A) 0 B) 23 N C) 55 N D) 90 N
 0 B) 23 N C) 55 N D) 90 N") 1. In which list are the forms of electromagnetic energy arranged in order from longest to shortest wavelengths? A) gamma rays, x-rays, ultraviolet rays, visible light B) radio waves, infrared rays, visible
1. In which list are the forms of electromagnetic energy arranged in order from longest to shortest wavelengths? A) gamma rays, x-rays, ultraviolet rays, visible light B) radio waves, infrared rays, visible
March 21. Observer located at 42 N. Horizon
 March 21 Sun Observer located at 42 N Horizon 48 June 21 March 21 A 48 90 S 23.5 S 0 23.5 N 42 N 90 N Equator (June 21) C (March 21) B A 71.5 48 Horizon 24.5 Observer Sun 40 Observer Sun 22 Observer Sun
Exercise 7.0 THE CHANGING DIURNAL CIRCLES OF THE SUN
 Exercise 7.0 THE CHANGING DIURNAL CIRCLES OF THE SUN I. The Apparent Annual Motion of the Sun A star always rises and sets at the same place on the horizon and, hence, it is above the horizon for the same
Solar photovoltaic energy production comparison of east, west, south-facing and tracked arrays
 The Canadian Society for Bioengineering The Canadian society for engineering in agricultural, food, environmental, and biological systems. La Société Canadienne de Génie Agroalimentaire et de Bioingénierie
OPTIMIZATION OF GLOBAL SOLAR RADIATION OF TILT ANGLE FOR SOLAR PANELS, LOCATION: OUARGLA, ALGERIA
 OPTIMIZATION OF GLOBAL SOLAR RADIATION OF TILT ANGLE FOR SOLAR PANELS, LOCATION: OUARGLA, ALGERIA Mohamed Lakhdar LOUAZENE Dris KORICHI Department of Electrical Engineering, University of Ouargla, Algeria.
Introduction To Modern Astronomy I: Solar System
 ASTR 111 003 Fall 2007 Lecture 02 Sep. 10, 2007 Introduction To Modern Astronomy I: Solar System Introducing Astronomy (chap. 1-6) Planets and Moons (chap. 7-15) Chap. 16: Our Sun Chap. 28: Search for
Section 2: The Science of Solar Energy
 Section 2: The Science of Solar Energy SECTION 2: THE SCIENCE OF SOLAR ENERGY Solar Radiation 9 Solar radiation outside the earth s atmosphere is called extraterrestrial radiation. On average the extraterrestrial
4. Solar radiation on tilted surfaces
 4. Solar radiation on tilted surfaces Petros Axaopoulos TEI of Athens Greece Learning Outcomes After studying this chapter, readers will be able to: define the direct, diffuse and reflected solar radiation
The following terms are some of the vocabulary that students should be familiar with in order to fully master this lesson.
 Lesson 211: EARTH'S SEASONS Students learn the complex geometry and planetary motions that cause Earth to have four distinct seasons. Fundamental Questions Attempting to give thorough and reasonable answers
Astron 104 Laboratory #2 The Celestial Sphere
 Name: Date: Section: Astron 104 Laboratory #2 The Celestial Sphere Basic Setup Once the celestial sphere is properly setup, it will serve as an exact model of the heavens relative to your location on Earth.
A User s Guide to the Sky
 A User s Guide to the Sky Constellations Betelgeuse Rigel Stars are named by a Greek letter ( ) according to their relative brightness within a given constellation plus the possessive form of the name
LECTURE ONE The Astronomy of Climate
 LECTURE ONE The Astronomy of Climate Agricultural Science Climatology Semester 2, 2006 Richard Thompson http://www.physics.usyd.edu.au/ag/agschome.htm Course Coordinator: Mike Wheatland AMMENDED TIMETABLE
drinking straw, protractor, string, and rock. observer on Earth. Sun across the sky on March 21 as seen by an
 1. The diagram below represents some constellations and one position of Earth in its orbit around the Sun. These constellations are visible to an observer on Earth at different times of the year. When
10/17/2012. Observing the Sky. Lecture 8. Chapter 2 Opener
 Observing the Sky Lecture 8 Chapter 2 Opener 1 Figure 2.1 Figure 2.2 2 Figure 2.6 Figure 2.4 Annotated 3 The Celestial Sphere The celestial sphere is the vast hollow sphere on which the stars appear fixed.
Celestial Sphere. Altitude [of a celestial object] Zenith. Meridian. Celestial Equator
![Celestial Sphere. Altitude [of a celestial object] Zenith. Meridian. Celestial Equator](/thumbs/83/88077665.jpg "Celestial Sphere. Altitude [of a celestial object] Zenith. Meridian. Celestial Equator") Earth Science Regents Interactive Path of the Sun University of Nebraska Resources Copyright 2011 by Z. Miller Name Period COMPANION WEBSITES: http://www.analemma.com/ http://www.stellarium.org/ INTRODUCTION:
Earth Science Regents Interactive Path of the Sun University of Nebraska Resources Copyright 2011 by Z. Miller Name Period COMPANION WEBSITES: http://www.analemma.com/ http://www.stellarium.org/ INTRODUCTION:
Practice Questions: Seasons #1
 1. Seasonal changes on Earth are primarily caused by the A) parallelism of the Sun's axis as the Sun revolves around Earth B) changes in distance between Earth and the Sun C) elliptical shape of Earth's
MiSP Astronomy Seasons Worksheet #1 L1
 MiSP Astronomy Seasons Worksheet #1 L1 Name Date CHANGING HOURS OF DAYLIGHT ON LONG ISLAND Introduction You sometimes hear people say, Days are longer in the summer and shorter in the winter. That is a
LAB 3: THE SUN AND CLIMATE NAME: LAB PARTNER(S):
:") GEOG 101L PHYSICAL GEOGRAPHY LAB SAN DIEGO CITY COLLEGE SELKIN 1 LAB 3: THE SUN AND CLIMATE NAME: LAB PARTNER(S): The main objective of today s lab is for you to be able to visualize the sun s position
GEOG 101L PHYSICAL GEOGRAPHY LAB SAN DIEGO CITY COLLEGE SELKIN 1 LAB 3: THE SUN AND CLIMATE NAME: LAB PARTNER(S): The main objective of today s lab is for you to be able to visualize the sun s position
LOCATING CELESTIAL OBJECTS: COORDINATES AND TIME. a. understand the basic concepts needed for any astronomical coordinate system.
 UNIT 2 UNIT 2 LOCATING CELESTIAL OBJECTS: COORDINATES AND TIME Goals After mastery of this unit, you should: a. understand the basic concepts needed for any astronomical coordinate system. b. understand
Chapter 1: Discovering the Night Sky. The sky is divided into 88 unequal areas that we call constellations.
 Chapter 1: Discovering the Night Sky Constellations: Recognizable patterns of the brighter stars that have been derived from ancient legends. Different cultures have associated the patterns with their
Time Series Model of Photovoltaic Generation for Distribution Planning Analysis. Jorge Valenzuela
 Time Series Model of Photovoltaic Generation for Distribution Planning Analysis Jorge Valenzuela Overview Introduction: The solar problem and our limitations Modeling What information do we have? Solar
Fundamentals of Satellite technology
 Fundamentals of Satellite technology Prepared by A.Kaviyarasu Assistant Professor Department of Aerospace Engineering Madras Institute Of Technology Chromepet, Chennai Orbital Plane All of the planets,
Page 1. Name:
 Name: 1) What is the primary reason New York State is warmer in July than in February? A) The altitude of the noon Sun is greater in February. B) The insolation in New York is greater in July. C) The Earth
Motions of the Sun Model Exploration
 Name Date Bell Motions of the Sun Model Exploration 1. Go to the University of Nebraska-Lincoln Motions of the Sun Simulator: http://astro.unl.edu/naap/motion3/animations/sunmotions.swf 2. This is what
Calculating equation coefficients
 Solar Energy 1 Calculating equation coefficients Construction Conservation Equation Surface Conservation Equation Fluid Conservation Equation needs flow estimation needs radiation and convection estimation
COMPUTER PROGRAM FOR THE ANGLES DESCRIBING THE SUN S APPARENT MOVEMENT IN THE SKY
 COMPUTER PROGRAM FOR THE ANGLES DESCRIBING THE SUN S APPARENT MOVEMENT IN THE SKY B. BUTUC 1 Gh. MOLDOVEAN 1 Abstract: The paper presents software developed for the determination of the Sun-Earth geometry.
Photovoltaic Systems Solar Radiation
 PowerPoint Presentation Photovoltaic Systems Solar Radiation The Sun Solar Radiation Sun- Earth Relationships Array Orientation Solar Radiation Data Sets Estimating Array Performance Arizona Solar Power
NABCEP Entry Level Exam Review Solfest practice test by Sean White
 1. A fall protection system must be in place for all work done at heights in excess of a. 4 feet b. 6 feet c. 8 feet d. 10 feet 2. A circuit breaker performs the same function a. as a fuse b. as a switch
TILT, DAYLIGHT AND SEASONS WORKSHEET
 TILT, DAYLIGHT AND SEASONS WORKSHEET Activity Description: Students will use a data table to make a graph for the length of day and average high temperature in Utah. They will then answer questions based
Estimation of Hourly Solar Radiation on Horizontal and Inclined Surfaces in Western Himalayas
 Smart Grid and Renewable Energy, 2011, 2, 45-55 doi:10.4236/sgre.2011.21006 Published Online February 2011 (http://www.scirp.org/journal/sgre) 45 Estimation of Hourly Solar Radiation on Horizontal and
Astro 101 Lab #2. Start up the Stellarium program. If you do not remember how to use the user interface, please refer to Lab#1 or the user s guide.
 Name: Astro 101 Lab #2 Lab objectives 1) Learn about how the Sun s path, through the sky, changes with the changing seasons. 2) Learn about how the Sun s path changes while viewing it at different locations
One sine wave is 7.64 minutes peak to peak variation. Two sine waves is 9.86
 WHY THE SUN IS SOMETIMES FAST AND SOMETIMES SLOW As the earth orbits the sun in an ellipse, it goes faster approaching the sun and slower when receding, just like when you throw a ball up in the air and
Bi-annual Sun Tracking for Solar PV Module Support Structure: Study and Implementation
 16th NATIONAL POWER SYSTEMS CONFERENCE, 15th-17th DECEMBER, 2010 56 Bi-annual Sun Tracking for Solar PV Module Support Structure: Study and Implementation Prabodh Bajpai, Member IEEE, Vaishalee Dash, N.K.
MiSP Astronomy - Seasons Worksheet #1 L2
 MiSP Astronomy - Seasons Worksheet #1 L2 Name Date Changing Hours of Daylight on Long Island (L 1, 2, 3) Introduction You sometimes hear people say, Days are longer in the summer and shorter in the winter.
NAVIGATION THEORY QUESTIONS Basics of Navigation
 NAVIGATION THEORY QUESTIONS Basics of Navigation Q610065 look at it The angle between the plane of the ecliptic and the plane of equator is approx? 23.5 degrees In which two months of the year is the difference
Chapter 1 Solar Radiation
 Chapter 1 Solar Radiation THE SUN The sun is a sphere of intensely hot gaseous matter with a diameter of 1.39 10 9 m It is, on the average, 1.5 10 11 m away from the earth. The sun rotates on its axis
Time, coordinates and how the Sun and Moon move in the sky
 Time, coordinates and how the Sun and Moon move in the sky Using the colors and magnitudes of quasars drawn from the SDSS Catalog Archive Server to distinguish quasars from stars using the light they emit
Lecture 2: Motions of the Earth and Moon. Astronomy 111 Wednesday August 30, 2017
 Lecture 2: Motions of the Earth and Moon Astronomy 111 Wednesday August 30, 2017 Reminders Online homework #1 due Monday at 3pm Labs start next week Motions of the Earth ASTR111 Lecture 2 Observation:
Chapter 2 Available Solar Radiation
 Chapter 2 Available Solar Radiation DEFINITIONS Figure shows the primary radiation fluxes on a surface at or near the ground that are important in connection with solar thermal processes. DEFINITIONS It
EAS 535 Laboratory Exercise Solar Radiation
 EAS 535 Laboratory Exercise Solar Radiation Lab Objectives: Estimate the atmospheric optical depth and solar constant from a set of measurements of the total and diffuse solar radiation at the surface.
Solutions to Lab Exercise #2: Solar Radiation & Temperature Part II: Exploring & Interpreting Data
 METR 104: Our Dynamic Weather (w/lab) Solutions to Lab Exercise #2: Solar Radiation & Temperature Part II: Exploring & Interpreting Data (10 points) Dr. Dave Dempsey Dept. of Geosciences SFSU, Spring 2013
ClassAction: Coordinates and Motions Module Instructor s Manual
 ClassAction: Coordinates and Motions Module Instructor s Manual Table of Contents Section 1: Warm-up Questions...3 The Sun s Path 1 4 Section 2: General Questions...5 Sledding or Going to the Beach...6
SOLAR WATER HEATER WITH TRACKING SYSTEM
 SOLAR WATER HEATER WITH TRACKING SYSTEM Jyoti Verma 1, Shweta Tyagi 2, R. B. Dubey 3 1,2,3 Department of Electronics and Communication Engineering Hindu College of Engineering, Sonepat, Haryana, (India)
Introduction to the sky
 Introduction to the sky On a clear, moonless night, far from city lights, the night sky is magnificent. Roughly 2000 stars are visible to the unaided eye. If you know where to look, you can see Mercury,
Introduction to Photovoltaics
 INTRODUCTION Objectives Understand the photovoltaic effect. Understand the properties of light. Describe frequency and wavelength. Understand the factors that determine available light energy. Use software
Student Exploration: Seasons: Earth, Moon, and Sun
 Name: Date: Student Exploration: Seasons: Earth, Moon, and Sun Vocabulary: altitude, axis, azimuth, equinox, horizon, latitude, revolution, rotation, solstice Prior Knowledge Questions (Do these BEFORE
THE SOLAR RESOURCE: PART I MINES ParisTech Center Observation, Impacts, Energy (Tel.: +33 (0) )
 )") MASTER REST Solar Resource Part I THE SOLAR RESOURCE: PART I MINES ParisTech Center Observation, Impacts, Energy philippe.blanc@mines-paristech.fr (Tel.: +33 (0)4 93 95 74 04) MASTER REST Solar Resource
MASTER REST Solar Resource Part I THE SOLAR RESOURCE: PART I MINES ParisTech Center Observation, Impacts, Energy philippe.blanc@mines-paristech.fr (Tel.: +33 (0)4 93 95 74 04) MASTER REST Solar Resource
Basic human requirements
 Basic human requirements Core Temperature 37 0 C 36 0 C 34 0 C 32 0 C 31 0 C 28 0 C Room Temperature 0 o C 20 o C 35 o C Energy [kw/(m² μm)] 2.0-1.5 - Black body at 800 K Solar radiation at atmosphere
b. So at 12:00 p.m., are the shadows pointing in the direction you predicted? If they are not, you must explain this observation.
 Astronomy 100 Name(s): Exercise 2: Timekeeping and astronomy The following exercise illustrates some basic ideas about time, and how our position in the solar system uniquely configures the measurement
Chapter 6. Solar Geometry. Contents
 Chapter 6. Solar Geometry Contents 6.1 Introduction 6.2 The Sun 6.3 Elliptical Orbit 6.4 Tilt of the Earth s Axis 6.5 Consequences of the Altitude Angle 6.6 Winter 6.7 The Sun Revolves Around the Earth!
Earth Science Seasons Test Name Per Date
 Name Per Date Page 1 1. The diagram below represents four positions of the Earth as it revolves around the Sun. 5. Base your answer to the following question on the diagram below, which shows the apparent
EE Properties of Sunlight. Y. Baghzouz Professor of Electrical Engineering
 EE 495-695 2.2 Properties of Sunlight Y. Baghzouz Professor of Electrical Engineering Azimuth angle The azimuth angle is the compass direction from which the sunlight is coming. At the equinoxes, the sun
PHOTOVOLTAIC SOLAR ENERGY TRAINER DL SOLAR-D1 Manual
 PHOTOVOLTAIC SOLAR ENERGY TRAINER DL SOLAR-D1 Manual DL SOLAR-D1 Contents 1. Solar energy: our commitment 5 to the environment 1.1. Basic principles and concepts 6 Mechanical work, energy and power: 6
The celestial sphere, the coordinates system, seasons, phases of the moon and eclipses. Chapters 2 and S1
 The celestial sphere, the coordinates system, seasons, phases of the moon and eclipses Chapters 2 and S1 The celestial sphere and the coordinates system Chapter S1 How to find our way in the sky? Let s
Solar Energy Basics II - Estimation of Solar Radiation to a Solar Panel
 PDHonline Course E287 (3 PDH) Solar Energy Basics II - Estimation of Solar Radiation to a Solar Panel Instructor: Harlan H. Bengtson, Ph.D., PE 2012 PDH Online PDH Center 5272 Meadow Estates Drive Fairfax,
Geography Class 6 Chapters 3 and
 CHAPTER 3 MOTIONS OF THE EARTH The Earth is always travelling in Space. That makes each person on Earth, a Space Traveller. No one feels the movement of the Earth because humans are too tiny when compared
Average Weather For Coeur d'alene, Idaho, USA
 Average Weather For Coeur d'alene, Idaho, USA Information courtesy of weatherspark.com Location This report describes the typical weather at the Coeur d'alene Air Terminal (Coeur d'alene, Idaho, United
LAB 2: Earth Sun Relations
 LAB 2: Earth Sun Relations Name School The amount of solar energy striking the Earth s atmosphere is not uniform; distances, angles and seasons play a dominant role on this distribution of radiation. Needless
C) wavelength C) eastern horizon B) the angle of insolation is high B) increases, only D) thermosphere D) receive low-angle insolation
 wavelength C) eastern horizon B) the angle of insolation is high B) increases, only D) thermosphere D) receive low-angle insolation") 1. What is the basic difference between ultraviolet, visible, and infrared radiation? A) half-life B) temperature C) wavelength D) wave velocity 2. In New York State, the risk of sunburn is greatest between
1. What is the basic difference between ultraviolet, visible, and infrared radiation? A) half-life B) temperature C) wavelength D) wave velocity 2. In New York State, the risk of sunburn is greatest between
Celestial Sphere & Solar Motion Lab (Norton s Star Atlas pages 1-4)
") Name: Date: Celestial Sphere & Solar Motion Lab (Norton s Star Atlas pages 1-4) Italicized topics below will be covered only at the instructor s discretion. 1.0 Purpose: To understand a) the celestial
Name: Date: Celestial Sphere & Solar Motion Lab (Norton s Star Atlas pages 1-4) Italicized topics below will be covered only at the instructor s discretion. 1.0 Purpose: To understand a) the celestial
These notes may contain copyrighted material! They are for your own use only during this course.
 Licensed for Personal Use Only DO NOT DISTRIBUTE These notes may contain copyrighted material! They are for your own use only during this course. Distributing them in anyway will be considered a breach
Astronomy 291. Professor Bradley M. Peterson
 Astronomy 291 Professor Bradley M. Peterson The Sky As a first step, we need to understand the appearance of the sky. Important points (to be explained): The relative positions of stars remain the same
The Sky Perceptions of the Sky
 The Sky Perceptions of the Sky An Observer-Centered Hemisphere Night & Day - Black & Blue - Stars & Sun Atmospheric & Astronomical Phenomena Weather, Clouds, Rainbows,... versus Sun, Moon, Stars, Planets,...
astronomy A planet was viewed from Earth for several hours. The diagrams below represent the appearance of the planet at four different times.
 astronomy 2008 1. A planet was viewed from Earth for several hours. The diagrams below represent the appearance of the planet at four different times. 5. If the distance between the Earth and the Sun were
COMPUTER ACTIVITY 3: THE SEASONS: LENGTH OF THE DAY
 NAME ASTRONOMY 20 SECTION DAY/ S. V. LLOYD COMPUTER ACTIVITY 3: THE SEASONS: LENGTH OF THE DAY Overview Software Configuration The seasonal variation in temperature is due to two changes in the Sun's path
Basic Solar Geometry. Contents
 Basic Solar Geometry Soteris A. Kalogirou Cyprus University of Technology Limassol, Cyprus Contents Introduction The sun (general characteristics) Solar geometry Solar Geometry Reckoning of time (AST)
2018 Annual Review of Availability Assessment Hours
 2018 Annual Review of Availability Assessment Hours Amber Motley Manager, Short Term Forecasting Clyde Loutan Principal, Renewable Energy Integration Karl Meeusen Senior Advisor, Infrastructure & Regulatory
Earth s Orbit. Sun Earth Relationships Ridha Hamidi, Ph.D. ESCI-61 Introduction to Photovoltaic Technology
 1 ESCI-61 Introduction to Photovoltaic Technology Sun Earth Relationships Ridha Hamidi, Ph.D. Spring (sun aims directly at equator) Winter (northern hemisphere 23.5 tilts away from sun) 2 Solar radiation
Astronomy 122 Section 1 TR Outline. The Earth is Rotating. Question Digital Computer Laboratory
 Astronomy 122 Section 1 TR 1300-1350 Outline 1320 Digital Computer Laboratory Leslie Looney Phone: 244-3615 Email: lwlw@wuiucw. wedu Office: Astro Building #218 Office Hours: T 10:30-11:30 a.m. or by appointment
Which graph best shows the relationship between intensity of insolation and position on the Earth's surface? A) B) C) D)
 B) C) D)") 1. The hottest climates on Earth are located near the Equator because this region A) is usually closest to the Sun B) reflects the greatest amount of insolation C) receives the most hours of daylight D)
1. The hottest climates on Earth are located near the Equator because this region A) is usually closest to the Sun B) reflects the greatest amount of insolation C) receives the most hours of daylight D)
Before you Sit. Please Pick-up: Blue Information Sheet for Evening Observing. 1 Red and 1 Blue ticket for Observing/ Planetarium
 Before you Sit Please Pick-up: Blue Information Sheet for Evening Observing. 1 Red and 1 Blue ticket for Observing/ Planetarium Evening Observing Observing at the Brooks Observatory: Three different weeks
5 - Seasons. Figure 1 shows two pictures of the Sun taken six months apart with the same camera, at the same time of the day, from the same location.
 Name: Partner(s): 5 - Seasons ASTR110L Purpose: To measure the distance of the Earth from the Sun over one year and to use the celestial sphere to understand the cause of the seasons. Answer all questions
The Earth is a Rotating Sphere
 The Earth is a Rotating Sphere The Shape of the Earth Earth s Rotation ( and relative movement of the Sun and Moon) The Geographic Grid Map Projections Global Time The Earth s Revolution around the Sun
Phys Lab #1: The Sun and the Constellations
 Phys 10293 Lab #1: The Sun and the Constellations Introduction Astronomers use a coordinate system that is fixed to Earth s latitude and longitude. This way, the coordinates of a star or planet are the
Chapter 4 Earth, Moon, and Sky 107
 Chapter 4 Earth, Moon, and Sky 107 planetariums around the world. Figure 4.4 Foucault s Pendulum. As Earth turns, the plane of oscillation of the Foucault pendulum shifts gradually so that over the course
Lecture #03. January 20, 2010, Wednesday
 Lecture #03 January 20, 2010, Wednesday Causes of Earth s Seasons Earth-Sun geometry Day length Solar angle (beam spread) Atmospheric beam depletion Shape and Size of the Earth North Pole E Geoid: not
Heat Transfer. Energy from the Sun. Introduction
 Heat Transfer Energy from the Sun Introduction The sun rises in the east and sets in the west, but its exact path changes over the course of the year, which causes the seasons. In order to use the sun
CELESTIAL COORDINATES
 ASTR 1030 Astronomy Lab 27 Celestial Coordinates CELESTIAL COORDINATES GEOGRAPHIC COORDINATES The Earth's geographic coordinate system is familiar to everyone - the north and south poles are defined by
CHAPTER 2 A USER'S GUIDE TO THE SKY
 CHAPTER 2 A USER'S GUIDE TO THE SKY MULTIPLE CHOICE 1. In one way of naming stars, a letter indicates its brightness relative to the other stars in the constellation. a. English b. Arabic c. Greek d. Cyrillic
Questions you should be able to answer after reading the material
 Module 4 Radiation Energy of the Sun is of large importance in the Earth System, it is the external driving force of the processes in the atmosphere. Without Solar radiation processes in the atmosphere
For most observers on Earth, the sun rises in the eastern
 632 CHAPTER 25: EARTH, SUN, AND SEASONS WHAT IS THE SUN S APPARENT PATH ACROSS THE SKY? For most observers on Earth, the sun rises in the eastern part of the sky. The sun reaches its greatest angular altitude
Assignment #0 Using Stellarium
 Name: Class: Date: Assignment #0 Using Stellarium The purpose of this exercise is to familiarize yourself with the Stellarium program and its many capabilities and features. Stellarium is a visually beautiful