Recap: Ø Distribution Shape Ø Mean, Median, Mode Ø Standard Deviations
|
|
|
- Christina Lane
- 5 years ago
- Views:
Transcription
1 DAY 4 16 Jan 2014
2 Recap: Ø Distribution Shape Ø Mean, Median, Mode Ø Standard Deviations
3 Two Important Three-Standard-Deviation Rules 1. Chebychev s Rule : Implies that at least 89% of the observations for any data set lie with in three standard deviations to either side of the mean. 2. Empirical Rule : Implies that roughly 99.7% of the observations for bell shaped data lie with in three standard deviations to either side of the mean.
4 Objective of the day: Ø Quartiles, Five number summary, Box Plot Ø Descriptive Measures for Population: Use of Samples
5 Section 3.3 The Five-Number Summary; Boxplots
6 Definition 3.7 Quartiles Arrange the data in increasing order and determine the median. The first quartile is the median of the part of the entire data set that lies at or below the median of the entire data set. The second quartile is the median of the entire data set. The third quartile is the median of the part of the entire data set that lies at or above the median of the entire data set.
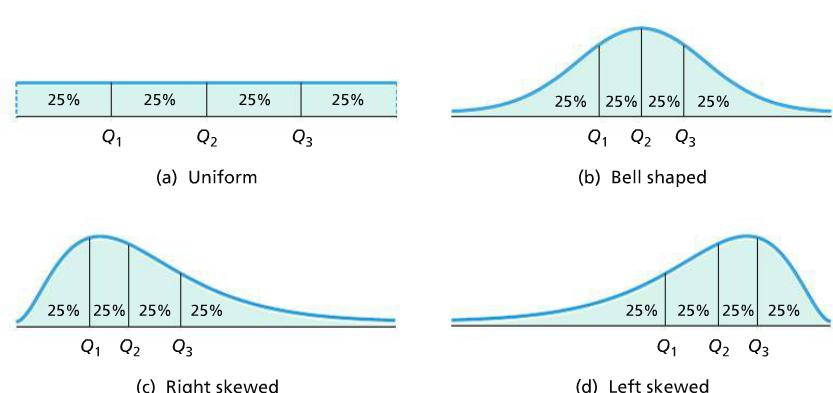
7 Note: The quartiles divide the set of measurements into four equal parts. Twenty-five per cent of the measurements are less than the lower quartile, fifty per cent of the measurements are less than the median and seventyfive per cent of the measurements are less than the upper quartile. So, fifty per cent of the measurements are between the lower quartile and the upper quartile. The lower quartile, median and upper quartile are often denoted by Q1, Q2 and Q3 respectively.

8
9 Quartiles Arrange the data in increasing order and determine the median. The first quartile is the median of the part of the entire data set that lies at or below the median of the entire data set. Example: Weekly TV viewing time of 20 people First Quartile = Q 1 =? Q 1 = 23
10 Quartiles Arrange the data in increasing order and determine the median. The second quartile is the median of the entire data set. Example: Weekly TV viewing time of 20 people Second Quartile = Q 2 =? Q 2 = 30.5
11 Quartiles Arrange the data in increasing order and determine the median. The third quartile is the median of the part of the entire data set that lies at or above the median of the entire data set. Example: Weekly TV viewing time of 20 people Third Quartile = Q 3 =? Q 3 = 36.5
12 Definition 3.8 Interquartile Range The interquartile range, or IQR, is the difference between the first and third quartiles; that is, IQR = Q 3 Q 1.
13 Example: Weekly TV viewing time of 20 people Q 1 = 23 Q 3 = 36.5 IQR = Q 3 - Q 1 = = 13.5
14 From the three quartiles, we can obtain a measure of center ( the median, Q 2 ) and measures of variation of the two middle quarters of the data, Q 2 Q 1 for the second quarter and Q 3 Q 2 for the third quarter. But Q 1, Q 2, Q 3 don t tell us anything about the variation of the first and fourth quarters. To get that information we need Min and Max values of data. Variation of the first quarter can be measured by (Q 1 Min) and Variation of fourth quarter can be measured by ( Max Q 3 )
15 Definition 3.9 Five-Number Summary The five-number summary of a data set is Min, Q 1, Q 2, Q 3, Max. Example: Weekly TV viewing time of 20 people Min = 5, Q 1 =23, Q 2 =30.5, Q 3 =36.5, Max = 66

16 Definition 3.10 Example: Weekly TV viewing time of 20 people Q 1 =23, Q 3 =36.5, IQR = 13.5 Lower limit = = 2.75 Upper Limit = = 56.75
17 Example: Weekly TV viewing time of 20 people Lower limit = 2.75 Upper Limit = 56.75

18 Procedure 3.1
19 Example: Weekly TV viewing time of 20 people
20 Example: Weekly TV viewing time of 20 people
21 Example: Weekly TV viewing time of 20 people
22
23
24
25 Why Quartiles? Mean and Standard deviations are sensitive to the influence of a few extreme observations, but Quartiles are not.
26 Section 3.4 Descriptive Measures for Populations; Use of Samples
27
28 Definition 3.11

29 Definition 3.12

30 Figure 3.13 & Definition 3.13 Population and sample for bolt diameters Parameter and Statistic Parameter: A descriptive measure for a population. Statistic: A descriptive measure for a sample.

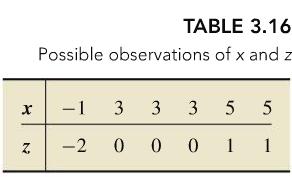
31 Definition 3.14 & 3.15 z-score For an observed value of a variable x, the corresponding value of the standardized variable z is called the z-score of the observation. The term standard score is often used instead of z-score.
32 μ = 3, σ = 2
33 z = (5-3) / 2 = 1
34
35
36 μ z = 0, σ z = 1
37
38
39
40
41 Note: 1. A z-score is calculated for a single value and indicates the distance of that value from the mean in units of standard deviations. 2. A positive z-score indicates that the value is above the mean. 3. A negative z-score indicates that the value is below the mean. 4. z can be any whole number or a fraction, so z = 3, z = 1.3 or z = 0.5 are all valid.
42 Summary: Ø Quartiles, Five number summary, Box Plot Ø Z-scores
43 Next Week: Ø Sections 4.1 & 4.2 Ø Quiz 2, Entrance Exam Ø Sections 5.1 & 5.2
44 Thank You J
CHAPTER 2: Describing Distributions with Numbers
 CHAPTER 2: Describing Distributions with Numbers The Basic Practice of Statistics 6 th Edition Moore / Notz / Fligner Lecture PowerPoint Slides Chapter 2 Concepts 2 Measuring Center: Mean and Median Measuring
Review Packet for Test 8 - Statistics. Statistical Measures of Center: and. Statistical Measures of Variability: and.
 Name: Teacher: Date: Section: Review Packet for Test 8 - Statistics Part I: Measures of CENTER vs. Measures of VARIABILITY Statistical Measures of Center: and. Statistical Measures of Variability: and.
Chapter 1: Exploring Data
 Chapter 1: Exploring Data Section 1.3 with Numbers The Practice of Statistics, 4 th edition - For AP* STARNES, YATES, MOORE Chapter 1 Exploring Data Introduction: Data Analysis: Making Sense of Data 1.1
are the objects described by a set of data. They may be people, animals or things.
 ( c ) E p s t e i n, C a r t e r a n d B o l l i n g e r 2016 C h a p t e r 5 : E x p l o r i n g D a t a : D i s t r i b u t i o n s P a g e 1 CHAPTER 5: EXPLORING DATA DISTRIBUTIONS 5.1 Creating Histograms
Section 3. Measures of Variation
 Section 3 Measures of Variation Range Range = (maximum value) (minimum value) It is very sensitive to extreme values; therefore not as useful as other measures of variation. Sample Standard Deviation The
Lecture Slides. Elementary Statistics Tenth Edition. by Mario F. Triola. and the Triola Statistics Series. Slide 1
 Lecture Slides Elementary Statistics Tenth Edition and the Triola Statistics Series by Mario F. Triola Slide 1 Chapter 3 Statistics for Describing, Exploring, and Comparing Data 3-1 Overview 3-2 Measures
TOPIC: Descriptive Statistics Single Variable
 TOPIC: Descriptive Statistics Single Variable I. Numerical data summary measurements A. Measures of Location. Measures of central tendency Mean; Median; Mode. Quantiles - measures of noncentral tendency
CHAPTER 5: EXPLORING DATA DISTRIBUTIONS. Individuals are the objects described by a set of data. These individuals may be people, animals or things.
 (c) Epstein 2013 Chapter 5: Exploring Data Distributions Page 1 CHAPTER 5: EXPLORING DATA DISTRIBUTIONS 5.1 Creating Histograms Individuals are the objects described by a set of data. These individuals
Describing Data: Two Variables
 STAT 250 Dr. Kari Lock Morgan Describing Data: Two Variables SECTIONS 2.4, 2.5 One quantitative variable (2.4) One quantitative and one categorical (2.4) Two quantitative (2.5) z- score Which is better,
Review: Central Measures
 Review: Central Measures Mean, Median and Mode When do we use mean or median? If there is (are) outliers, use Median If there is no outlier, use Mean. Example: For a data 1, 1.2, 1.5, 1.7, 1.8, 1.9, 2.3,
Chapter 3. Measuring data
 Chapter 3 Measuring data 1 Measuring data versus presenting data We present data to help us draw meaning from it But pictures of data are subjective They re also not susceptible to rigorous inference Measuring
Quantitative Tools for Research
 Quantitative Tools for Research KASHIF QADRI Descriptive Analysis Lecture Week 4 1 Overview Measurement of Central Tendency / Location Mean, Median & Mode Quantiles (Quartiles, Deciles, Percentiles) Measurement
Practice problems from chapters 2 and 3
 Practice problems from chapters and 3 Question-1. For each of the following variables, indicate whether it is quantitative or qualitative and specify which of the four levels of measurement (nominal, ordinal,
2011 Pearson Education, Inc
 Statistics for Business and Economics Chapter 2 Methods for Describing Sets of Data Summary of Central Tendency Measures Measure Formula Description Mean x i / n Balance Point Median ( n +1) Middle Value
Review for Exam #1. Chapter 1. The Nature of Data. Definitions. Population. Sample. Quantitative data. Qualitative (attribute) data
 data") Review for Exam #1 1 Chapter 1 Population the complete collection of elements (scores, people, measurements, etc.) to be studied Sample a subcollection of elements drawn from a population 11 The Nature
Review for Exam #1 1 Chapter 1 Population the complete collection of elements (scores, people, measurements, etc.) to be studied Sample a subcollection of elements drawn from a population 11 The Nature
Unit 2: Numerical Descriptive Measures
 Unit 2: Numerical Descriptive Measures Summation Notation Measures of Central Tendency Measures of Dispersion Chebyshev's Rule Empirical Rule Measures of Relative Standing Box Plots z scores Jan 28 10:48
Describing Distributions with Numbers
 Describing Distributions with Numbers Using graphs, we could determine the center, spread, and shape of the distribution of a quantitative variable. We can also use numbers (called summary statistics)
1.3: Describing Quantitative Data with Numbers
 1.3: Describing Quantitative Data with Numbers Section 1.3 Describing Quantitative Data with Numbers After this section, you should be able to MEASURE center with the mean and median MEASURE spread with
Chapter 2: Tools for Exploring Univariate Data
 Stats 11 (Fall 2004) Lecture Note Introduction to Statistical Methods for Business and Economics Instructor: Hongquan Xu Chapter 2: Tools for Exploring Univariate Data Section 2.1: Introduction What is
First Quartile = 26 Third Quartile = 35 Interquartile Range = 9
 Lesson 9.4 Name: Quartile The quartiles of a set of data divide the data into 4 equal parts. First Quartile The first quartile of a set of data is the median of the lower half of the data. Median The median
Section 2.4. Measuring Spread. How Can We Describe the Spread of Quantitative Data? Review: Central Measures
 mean median mode Review: entral Measures Mean, Median and Mode When do we use mean or median? If there is (are) outliers, use Median If there is no outlier, use Mean. Example: For a data 1, 1., 1.5, 1.7,
ADMS2320.com. We Make Stats Easy. Chapter 4. ADMS2320.com Tutorials Past Tests. Tutorial Length 1 Hour 45 Minutes
 We Make Stats Easy. Chapter 4 Tutorial Length 1 Hour 45 Minutes Tutorials Past Tests Chapter 4 Page 1 Chapter 4 Note The following topics will be covered in this chapter: Measures of central location Measures
Describing distributions with numbers
 Describing distributions with numbers A large number or numerical methods are available for describing quantitative data sets. Most of these methods measure one of two data characteristics: The central
CHAPTER 1 Exploring Data
 CHAPTER 1 Exploring Data 1.3 Describing Quantitative Data with Numbers The Practice of Statistics, 5th Edition Starnes, Tabor, Yates, Moore Bedford Freeman Worth Publishers 1.3 Reading Quiz True or false?
Determining the Spread of a Distribution
 Determining the Spread of a Distribution 1.3-1.5 Cathy Poliak, Ph.D. cathy@math.uh.edu Department of Mathematics University of Houston Lecture 3-2311 Lecture 3-2311 1 / 58 Outline 1 Describing Quantitative
MATH 117 Statistical Methods for Management I Chapter Three
 Jubail University College MATH 117 Statistical Methods for Management I Chapter Three This chapter covers the following topics: I. Measures of Center Tendency. 1. Mean for Ungrouped Data (Raw Data) 2.
Determining the Spread of a Distribution
 Determining the Spread of a Distribution 1.3-1.5 Cathy Poliak, Ph.D. cathy@math.uh.edu Department of Mathematics University of Houston Lecture 3-2311 Lecture 3-2311 1 / 58 Outline 1 Describing Quantitative
Lecture 3: Chapter 3
 Lecture 3: Chapter 3 C C Moxley UAB Mathematics 26 January 16 3.2 Measurements of Center Statistics involves describing data sets and inferring things about them. The first step in understanding a set
Unit 2. Describing Data: Numerical
 Unit 2 Describing Data: Numerical Describing Data Numerically Describing Data Numerically Central Tendency Arithmetic Mean Median Mode Variation Range Interquartile Range Variance Standard Deviation Coefficient
3.1 Measure of Center
 3.1 Measure of Center Calculate the mean for a given data set Find the median, and describe why the median is sometimes preferable to the mean Find the mode of a data set Describe how skewness affects
Perhaps the most important measure of location is the mean (average). Sample mean: where n = sample size. Arrange the values from smallest to largest:
. Sample mean: where n = sample size. Arrange the values from smallest to largest:") 1 Chapter 3 - Descriptive stats: Numerical measures 3.1 Measures of Location Mean Perhaps the most important measure of location is the mean (average). Sample mean: where n = sample size Example: The number
1 Chapter 3 - Descriptive stats: Numerical measures 3.1 Measures of Location Mean Perhaps the most important measure of location is the mean (average). Sample mean: where n = sample size Example: The number
3 Lecture 3 Notes: Measures of Variation. The Boxplot. Definition of Probability
 3 Lecture 3 Notes: Measures of Variation. The Boxplot. Definition of Probability 3.1 Week 1 Review Creativity is more than just being different. Anybody can plan weird; that s easy. What s hard is to be
Section 3.2 Measures of Central Tendency
 Section 3.2 Measures of Central Tendency 1 of 149 Section 3.2 Objectives Determine the mean, median, and mode of a population and of a sample Determine the weighted mean of a data set and the mean of a
Math 120 Introduction to Statistics Mr. Toner s Lecture Notes 3.1 Measures of Central Tendency
 Math 1 Introduction to Statistics Mr. Toner s Lecture Notes 3.1 Measures of Central Tendency The word average: is very ambiguous and can actually refer to the mean, median, mode or midrange. Notation:
Finding Quartiles. . Q1 is the median of the lower half of the data. Q3 is the median of the upper half of the data
 Finding Quartiles. Use the median to divide the ordered data set into two halves.. If n is odd, do not include the median in either half. If n is even, split this data set exactly in half.. Q1 is the median
CHAPTER 1. Introduction
 CHAPTER 1 Introduction Engineers and scientists are constantly exposed to collections of facts, or data. The discipline of statistics provides methods for organizing and summarizing data, and for drawing
Stats Review Chapter 3. Mary Stangler Center for Academic Success Revised 8/16
 Stats Review Chapter Revised 8/16 Note: This review is composed of questions similar to those found in the chapter review and/or chapter test. This review is meant to highlight basic concepts from the
Lecture 2 and Lecture 3
 Lecture 2 and Lecture 3 1 Lecture 2 and Lecture 3 We can describe distributions using 3 characteristics: shape, center and spread. These characteristics have been discussed since the foundation of statistics.
Chapter 2 Class Notes Sample & Population Descriptions Classifying variables
 Chapter 2 Class Notes Sample & Population Descriptions Classifying variables Random Variables (RVs) are discrete quantitative continuous nominal qualitative ordinal Notation and Definitions: a Sample is
Example 2. Given the data below, complete the chart:
 Statistics 2035 Quiz 1 Solutions Example 1. 2 64 150 150 2 128 150 2 256 150 8 8 Example 2. Given the data below, complete the chart: 52.4, 68.1, 66.5, 75.0, 60.5, 78.8, 63.5, 48.9, 81.3 n=9 The data is
STP 420 INTRODUCTION TO APPLIED STATISTICS NOTES
 INTRODUCTION TO APPLIED STATISTICS NOTES PART - DATA CHAPTER LOOKING AT DATA - DISTRIBUTIONS Individuals objects described by a set of data (people, animals, things) - all the data for one individual make
MEASURING THE SPREAD OF DATA: 6F
 CONTINUING WITH DESCRIPTIVE STATS 6E,6F,6G,6H,6I MEASURING THE SPREAD OF DATA: 6F othink about this example: Suppose you are at a high school football game and you sample 40 people from the student section
Data Analysis and Statistical Methods Statistics 651
 Data Analysis and Statistical Methods Statistics 651 http://www.stat.tamu.edu/~suhasini/teaching.html Boxplots and standard deviations Suhasini Subba Rao Review of previous lecture In the previous lecture
Determining the Spread of a Distribution Variance & Standard Deviation
 Determining the Spread of a Distribution Variance & Standard Deviation 1.3 Cathy Poliak, Ph.D. cathy@math.uh.edu Department of Mathematics University of Houston Lecture 3 Lecture 3 1 / 32 Outline 1 Describing
6 THE NORMAL DISTRIBUTION
 CHAPTER 6 THE NORMAL DISTRIBUTION 341 6 THE NORMAL DISTRIBUTION Figure 6.1 If you ask enough people about their shoe size, you will find that your graphed data is shaped like a bell curve and can be described
Slide 1. Slide 2. Slide 3. Pick a Brick. Daphne. 400 pts 200 pts 300 pts 500 pts 100 pts. 300 pts. 300 pts 400 pts 100 pts 400 pts.
 Slide 1 Slide 2 Daphne Phillip Kathy Slide 3 Pick a Brick 100 pts 200 pts 500 pts 300 pts 400 pts 200 pts 300 pts 500 pts 100 pts 300 pts 400 pts 100 pts 400 pts 100 pts 200 pts 500 pts 100 pts 400 pts
CHAPTER 1 Univariate data
 Chapter Answers Page 1 of 17 CHAPTER 1 Univariate data Exercise 1A Types of data 1 Numerical a, b, c, g, h Categorical d, e, f, i, j, k, l, m 2 Discrete c, g Continuous a, b, h 3 C 4 C Exercise 1B Stem
SMAM 319 Exam 1 Name. 1.Pick the best choice for the multiple choice questions below (10 points 2 each)
") SMAM 319 Exam 1 Name 1.Pick the best choice for the multiple choice questions below (10 points 2 each) A b In Metropolis there are some houses for sale. Superman and Lois Lane are interested in the average
SMAM 319 Exam 1 Name 1.Pick the best choice for the multiple choice questions below (10 points 2 each) A b In Metropolis there are some houses for sale. Superman and Lois Lane are interested in the average
Further Mathematics 2018 CORE: Data analysis Chapter 2 Summarising numerical data
 Chapter 2: Summarising numerical data Further Mathematics 2018 CORE: Data analysis Chapter 2 Summarising numerical data Extract from Study Design Key knowledge Types of data: categorical (nominal and ordinal)
value mean standard deviation
 Mr. Murphy AP Statistics 2.4 The Empirical Rule and z - Scores HW Pg. 208 #4.45 (a) - (c), 4.46, 4.51, 4.52, 4.73 Objectives: 1. Calculate a z score. 2. Apply the Empirical Rule when appropriate. 3. Calculate
Instructor: Doug Ensley Course: MAT Applied Statistics - Ensley
 Student: Date: Instructor: Doug Ensley Course: MAT117 01 Applied Statistics - Ensley Assignment: Online 04 - Sections 2.5 and 2.6 1. A travel magazine recently presented data on the annual number of vacation
Describing distributions with numbers
 Describing distributions with numbers A large number or numerical methods are available for describing quantitative data sets. Most of these methods measure one of two data characteristics: The central
MAT Mathematics in Today's World
 MAT 1000 Mathematics in Today's World Last Time 1. Three keys to summarize a collection of data: shape, center, spread. 2. Can measure spread with the fivenumber summary. 3. The five-number summary can
MgtOp 215 Chapter 3 Dr. Ahn
 MgtOp 215 Chapter 3 Dr. Ahn Measures of central tendency (center, location): measures the middle point of a distribution or data; these include mean and median. Measures of dispersion (variability, spread):
Introduction to Statistics
 Introduction to Statistics Data and Statistics Data consists of information coming from observations, counts, measurements, or responses. Statistics is the science of collecting, organizing, analyzing,
Revision Topic 13: Statistics 1
 Revision Topic 13: Statistics 1 Averages There are three common types of average: the mean, median and mode. The mode (or modal value) is the data value (or values) that occurs the most often. The median
Objective A: Mean, Median and Mode Three measures of central of tendency: the mean, the median, and the mode.
 Chapter 3 Numerically Summarizing Data Chapter 3.1 Measures of Central Tendency Objective A: Mean, Median and Mode Three measures of central of tendency: the mean, the median, and the mode. A1. Mean The
M 225 Test 1 B Name SHOW YOUR WORK FOR FULL CREDIT! Problem Max. Points Your Points Total 75
 M 225 Test 1 B Name SHOW YOUR WORK FOR FULL CREDIT! Problem Max. Points Your Points 1-13 13 14 3 15 8 16 4 17 10 18 9 19 7 20 3 21 16 22 2 Total 75 1 Multiple choice questions (1 point each) 1. Look at
Chapter 4.notebook. August 30, 2017
 Sep 1 7:53 AM Sep 1 8:21 AM Sep 1 8:21 AM 1 Sep 1 8:23 AM Sep 1 8:23 AM Sep 1 8:23 AM SOCS When describing a distribution, make sure to always tell about three things: shape, outliers, center, and spread
Chapter 3. Data Description
 Chapter 3. Data Description Graphical Methods Pie chart It is used to display the percentage of the total number of measurements falling into each of the categories of the variable by partition a circle.
Measures of center. The mean The mean of a distribution is the arithmetic average of the observations:
 Measures of center The mean The mean of a distribution is the arithmetic average of the observations: x = x 1 + + x n n n = 1 x i n i=1 The median The median is the midpoint of a distribution: the number
Lecture Slides. Elementary Statistics Twelfth Edition. by Mario F. Triola. and the Triola Statistics Series. Section 3.1- #
 Lecture Slides Elementary Statistics Twelfth Edition and the Triola Statistics Series by Mario F. Triola Chapter 3 Statistics for Describing, Exploring, and Comparing Data 3-1 Review and Preview 3-2 Measures
Lecture 6: Chapter 4, Section 2 Quantitative Variables (Displays, Begin Summaries)
") Lecture 6: Chapter 4, Section 2 Quantitative Variables (Displays, Begin Summaries) Summarize with Shape, Center, Spread Displays: Stemplots, Histograms Five Number Summary, Outliers, Boxplots Cengage Learning
Lecture 6: Chapter 4, Section 2 Quantitative Variables (Displays, Begin Summaries) Summarize with Shape, Center, Spread Displays: Stemplots, Histograms Five Number Summary, Outliers, Boxplots Cengage Learning
What is statistics? Statistics is the science of: Collecting information. Organizing and summarizing the information collected
 What is statistics? Statistics is the science of: Collecting information Organizing and summarizing the information collected Analyzing the information collected in order to draw conclusions Two types
Chapter 5. Understanding and Comparing. Distributions
 STAT 141 Introduction to Statistics Chapter 5 Understanding and Comparing Distributions Bin Zou (bzou@ualberta.ca) STAT 141 University of Alberta Winter 2015 1 / 27 Boxplots How to create a boxplot? Assume
Section 3.4 Normal Distribution MDM4U Jensen
 Section 3.4 Normal Distribution MDM4U Jensen Part 1: Dice Rolling Activity a) Roll two 6- sided number cubes 18 times. Record a tally mark next to the appropriate number after each roll. After rolling
In this chapter, you will study the normal distribution, the standard normal, and applications associated with them.
 The Normal Distribution The normal distribution is the most important of all the distributions. It is widely used and even more widely abused. Its graph is bell-shaped. You see the bell curve in almost
3.3. Section. Measures of Central Tendency and Dispersion from Grouped Data. Copyright 2013, 2010 and 2007 Pearson Education, Inc.
 Section 3.3 Measures of Central Tendency and Dispersion from Grouped Data Objectives 1. Approximate the mean of a variable from grouped data 2. Compute the weighted mean 3. Approximate the standard deviation
Chapter 6 Assessment. 3. Which points in the data set below are outliers? Multiple Choice. 1. The boxplot summarizes the test scores of a math class?
 Chapter Assessment Multiple Choice 1. The boxplot summarizes the test scores of a math class? Test Scores 3. Which points in the data set below are outliers? 73, 73, 7, 75, 75, 75, 77, 77, 77, 77, 7, 7,
AP STATISTICS: Summer Math Packet
 Name AP STATISTICS: Summer Math Packet DIRECTIONS: Complete all problems on this packet. Packet due by the end of the first week of classes. Attach additional paper if needed. Calculator may be used. 1.
Describing Distributions
 Describing Distributions With Numbers April 18, 2012 Summary Statistics. Measures of Center. Percentiles. Measures of Spread. A Summary Statement. Choosing Numerical Summaries. 1.0 What Are Summary Statistics?
The empirical ( ) rule
 rule") The empirical (68-95-99.7) rule With a bell shaped distribution, about 68% of the data fall within a distance of 1 standard deviation from the mean. 95% fall within 2 standard deviations of the mean. 99.7%
The empirical (68-95-99.7) rule With a bell shaped distribution, about 68% of the data fall within a distance of 1 standard deviation from the mean. 95% fall within 2 standard deviations of the mean. 99.7%
QUIZ 1 (CHAPTERS 1-4) SOLUTIONS MATH 119 SPRING 2013 KUNIYUKI 105 POINTS TOTAL, BUT 100 POINTS = 100%
 SOLUTIONS MATH 119 SPRING 2013 KUNIYUKI 105 POINTS TOTAL, BUT 100 POINTS = 100%") QUIZ 1 (CHAPTERS 1-4) SOLUTIONS MATH 119 SPRING 2013 KUNIYUKI 105 POINTS TOTAL, BUT 100 POINTS = 100% 1) (6 points). A college has 32 course sections in math. A frequency table for the numbers of students
QUIZ 1 (CHAPTERS 1-4) SOLUTIONS MATH 119 SPRING 2013 KUNIYUKI 105 POINTS TOTAL, BUT 100 POINTS = 100% 1) (6 points). A college has 32 course sections in math. A frequency table for the numbers of students
Chapter. Numerically Summarizing Data Pearson Prentice Hall. All rights reserved
 Chapter 3 Numerically Summarizing Data Section 3.1 Measures of Central Tendency Objectives 1. Determine the arithmetic mean of a variable from raw data 2. Determine the median of a variable from raw data
Math 7 /Unit 5 Practice Test: Statistics
 Math 7 /Unit 5 Practice Test: Statistics Name: Date: Define the terms below and give an example. 1. population 2. random sample 3. interquartile range (IQR) 4. Determine whether each sample is a random
Resistant Measure - A statistic that is not affected very much by extreme observations.
 Chapter 1.3 Lecture Notes & Examples Section 1.3 Describing Quantitative Data with Numbers (pp. 50-74) 1.3.1 Measuring Center: The Mean Mean - The arithmetic average. To find the mean (pronounced x bar)
Elementary Statistics
 Elementary Statistics Q: What is data? Q: What does the data look like? Q: What conclusions can we draw from the data? Q: Where is the middle of the data? Q: Why is the spread of the data important? Q:
Statistics Add Ins.notebook. November 22, Add ins
 Add ins We have LOADS of things we need to know for the IGCSE that you haven't learnt as part of the Bavarian Curriculum. We are now going to shoehorn in some of those topics and ideas. Nov 12 11:50 Main
1.3.1 Measuring Center: The Mean
 1.3.1 Measuring Center: The Mean Mean - The arithmetic average. To find the mean (pronounced x bar) of a set of observations, add their values and divide by the number of observations. If the n observations
GRACEY/STATISTICS CH. 3. CHAPTER PROBLEM Do women really talk more than men? Science, Vol. 317, No. 5834). The study
. The study") CHAPTER PROBLEM Do women really talk more than men? A common belief is that women talk more than men. Is that belief founded in fact, or is it a myth? Do men actually talk more than women? Or do men and
CHAPTER PROBLEM Do women really talk more than men? A common belief is that women talk more than men. Is that belief founded in fact, or is it a myth? Do men actually talk more than women? Or do men and
Range The range is the simplest of the three measures and is defined now.
 Measures of Variation EXAMPLE A testing lab wishes to test two experimental brands of outdoor paint to see how long each will last before fading. The testing lab makes 6 gallons of each paint to test.
= n 1. n 1. Measures of Variability. Sample Variance. Range. Sample Standard Deviation ( ) 2. Chapter 2 Slides. Maurice Geraghty
 2. Chapter 2 Slides. Maurice Geraghty") Chapter Slides Inferential Statistics and Probability a Holistic Approach Chapter Descriptive Statistics This Course Material by Maurice Geraghty is licensed under a Creative Commons Attribution-ShareAlike.
Chapter Slides Inferential Statistics and Probability a Holistic Approach Chapter Descriptive Statistics This Course Material by Maurice Geraghty is licensed under a Creative Commons Attribution-ShareAlike.
Chapter 6 The Standard Deviation as a Ruler and the Normal Model
 Chapter 6 The Standard Deviation as a Ruler and the Normal Model Overview Key Concepts Understand how adding (subtracting) a constant or multiplying (dividing) by a constant changes the center and/or spread
Topic 3: Introduction to Statistics. Algebra 1. Collecting Data. Table of Contents. Categorical or Quantitative? What is the Study of Statistics?!
 Topic 3: Introduction to Statistics Collecting Data We collect data through observation, surveys and experiments. We can collect two different types of data: Categorical Quantitative Algebra 1 Table of
Exercises from Chapter 3, Section 1
 Exercises from Chapter 3, Section 1 1. Consider the following sample consisting of 20 numbers. (a) Find the mode of the data 21 23 24 24 25 26 29 30 32 34 39 41 41 41 42 43 48 51 53 53 (b) Find the median
Describing Distributions With Numbers
 Describing Distributions With Numbers October 24, 2012 What Do We Usually Summarize? Measures of Center. Percentiles. Measures of Spread. A Summary Statement. Choosing Numerical Summaries. 1.0 What Do
Numerical Measures of Central Tendency
 ҧ Numerical Measures of Central Tendency The central tendency of the set of measurements that is, the tendency of the data to cluster, or center, about certain numerical values; usually the Mean, Median
Lecture 11. Data Description Estimation
 Lecture 11 Data Description Estimation Measures of Central Tendency (continued, see last lecture) Sample mean, population mean Sample mean for frequency distributions The median The mode The midrange 3-22
LC OL - Statistics. Types of Data
 LC OL - Statistics Types of Data Question 1 Characterise each of the following variables as numerical or categorical. In each case, list any three possible values for the variable. (i) Eye colours in a
Measures of the Location of the Data
 Measures of the Location of the Data 1. 5. Mark has 51 films in his collection. Each movie comes with a rating on a scale from 0.0 to 10.0. The following table displays the ratings of the aforementioned
Chapter 3: Displaying and summarizing quantitative data p52 The pattern of variation of a variable is called its distribution.
 Chapter 3: Displaying and summarizing quantitative data p52 The pattern of variation of a variable is called its distribution. 1 Histograms p53 The breakfast cereal data Study collected data on nutritional
Lecture 3B: Chapter 4, Section 2 Quantitative Variables (Displays, Begin Summaries)
") Lecture 3B: Chapter 4, Section 2 Quantitative Variables (Displays, Begin Summaries) Summarize with Shape, Center, Spread Displays: Stemplots, Histograms Five Number Summary, Outliers, Boxplots Mean vs.
Lecture 3B: Chapter 4, Section 2 Quantitative Variables (Displays, Begin Summaries) Summarize with Shape, Center, Spread Displays: Stemplots, Histograms Five Number Summary, Outliers, Boxplots Mean vs.
Units. Exploratory Data Analysis. Variables. Student Data
 Units Exploratory Data Analysis Bret Larget Departments of Botany and of Statistics University of Wisconsin Madison Statistics 371 13th September 2005 A unit is an object that can be measured, such as
Lecture Slides. Elementary Statistics Eleventh Edition. by Mario F. Triola. and the Triola Statistics Series 3.1-1
 Lecture Slides Elementary Statistics Eleventh Edition and the Triola Statistics Series by Mario F. Triola 3.1-1 Chapter 3 Statistics for Describing, Exploring, and Comparing Data 3-1 Review and Preview
2.1 Measures of Location (P.9-11)
") MATH1015 Biostatistics Week.1 Measures of Location (P.9-11).1.1 Summation Notation Suppose that we observe n values from an experiment. This collection (or set) of n values is called a sample. Let x 1
MATH1015 Biostatistics Week.1 Measures of Location (P.9-11).1.1 Summation Notation Suppose that we observe n values from an experiment. This collection (or set) of n values is called a sample. Let x 1
MATH 1150 Chapter 2 Notation and Terminology
 MATH 1150 Chapter 2 Notation and Terminology Categorical Data The following is a dataset for 30 randomly selected adults in the U.S., showing the values of two categorical variables: whether or not the
equal to the of the. Sample variance: Population variance: **The sample variance is an unbiased estimator of the
 DEFINITION The variance (aka dispersion aka spread) of a set of values is a measure of equal to the of the. Sample variance: s Population variance: **The sample variance is an unbiased estimator of the
Probability and Samples. Sampling. Point Estimates
 Probability and Samples Sampling We want the results from our sample to be true for the population and not just the sample But our sample may or may not be representative of the population Sampling error
Sections 2.3 and 2.4
 1 / 24 Sections 2.3 and 2.4 Note made by: Dr. Timothy Hanson Instructor: Peijie Hou Department of Statistics, University of South Carolina Stat 205: Elementary Statistics for the Biological and Life Sciences
1 Descriptive Statistics (solutions)
") 1 Descriptive Statistics (solutions) 1. Below is a list of test scores for a small class: 100, 98, 97, 94, 100, 90, 4 (a) What is the average test score x? Answer: 83.3 (b) What is the median test score
1 Descriptive Statistics (solutions) 1. Below is a list of test scores for a small class: 100, 98, 97, 94, 100, 90, 4 (a) What is the average test score x? Answer: 83.3 (b) What is the median test score