Research Article Line Intensity Measurements of the ] 7 + ] 8 Band of Ethylene ( 12 C 2 H 4 )
|
|
|
- Diane Howard
- 5 years ago
- Views:
Transcription
1 International Spectroscopy Volume 23, Article ID 49292, 7 pages Research Article Line Intensity Measurements of the ] 7 + ] 8 Band of Ethylene ( 2 C 2 H 4 ) G. B. Lebron and T. L. Tan Natural Sciences and Science Education, National Institute of Education, Nanyang Technological University, NanyangWalk,Singapore63766 Correspondence should be addressed to T. L. Tan; augustine.tan@nie.edu.sg Received 22 March 23; Accepted 23 June 23 Academic Editor: Hakan Arslan Copyright 23 G. B. Lebron and T. L. Tan. This is an open access article distributed under the Creative Commons Attribution License, which permits unrestricted use, distribution, and reproduction in any medium, provided the original work is properly cited. From the four high-resolution FTIR absorbance spectra recorded at a spectral resolution of.63 cm, 23 line intensities belonging to the ] 7 + ] 8 band of 2 C 2 H 4 were measured and fit. The upper V 7 + V 8 =state rovibrational constants up to sextic terms determined using a Watson s A-reduced Hamiltonian model in I r representation were used to calculate the line intensities of the band. Results of the experimental fit of the line intensities agree well with those obtained by calculations.. Introduction Spectroscopists take special interest in ethylene ( 2 C 2 H 4 ) for its atmospheric and astrophysical importance. Ethylene isnaturallypresentintheatmosphereandisoneofseveral precursors for the formation of tropospheric ozone, a pollutant that has adverse effects on human health. It also has been detected in the atmospheres of the Jovian planets Jupiter, Saturn, Neptune [ 4] and the satellite Titan [5]. Since accurate rotation-vibration parameters and knowledge of line positions and intensities are needed in the detection and monitoring of ethylene in the atmosphere, there have been a number of ethylene studies on the subject in the literature (e.g., [6 ]). As part of our ongoing FTIR investigation of ethylene and its isotopic variants [ 2], determination of the upper state rovibrational constants and line intensity measurements of the A-type ] 7 + ] 8 band of 2 C 2 H 4 in the cm region were performed. The present study aims to contribute to the limited but growing body of knowledge on ethylene line positions and intensities. Previous studies on the ] 7 + ] 8 band of 2 C 2 H 4 include [22 25] which all considered the Coriolis interactions between the band and the ] 4 + ] 8 and ] 8 + ] states. Ben Hassen and coworkers [6] measured the absolute line intensities of ethylene in the cm region. According to a previous paper [25], 39 of the 264 line intensities they measured belonged to the ] 7 + ] 8 band. In the present study, the upper V 7 + V 8 =state rovibrational constants up to sextic centrifugal distortion terms were determined first using a standard Watson s Hamiltonian model. The derived parameters were then used to calculate line intensities and positions of the ] 7 + ] 8 band of 2 C 2 H 4. From the high-resolution FTIR spectra collected in the laboratory, 23 ethylene line positions and intensities were measured using a peak fitting analysis that implemented the Levenberg-Marquardt algorithm. We found the fit to be satisfactory falling within 6% error when compared to the calculated line intensities. 2. Experimental Details A Bruker 25HR Fourier transform spectrometer located at the FTIR laboratory of the National Institute of Education, Nanyang Technological University, in Singapore was used to record all high-resolution infrared spectra used for the present study. It was equipped with a Globar mid-infrared source, a high sensitivity liquid nitrogen-cooled Hg-Cd-Te detector, and a KBr beamsplitter. By adjusting for four passes in the multiple absorption gas cell with a 2 cm base length, an absorption length of 8 cm was attained. The background spectra and the infrared spectra of the 99.99%


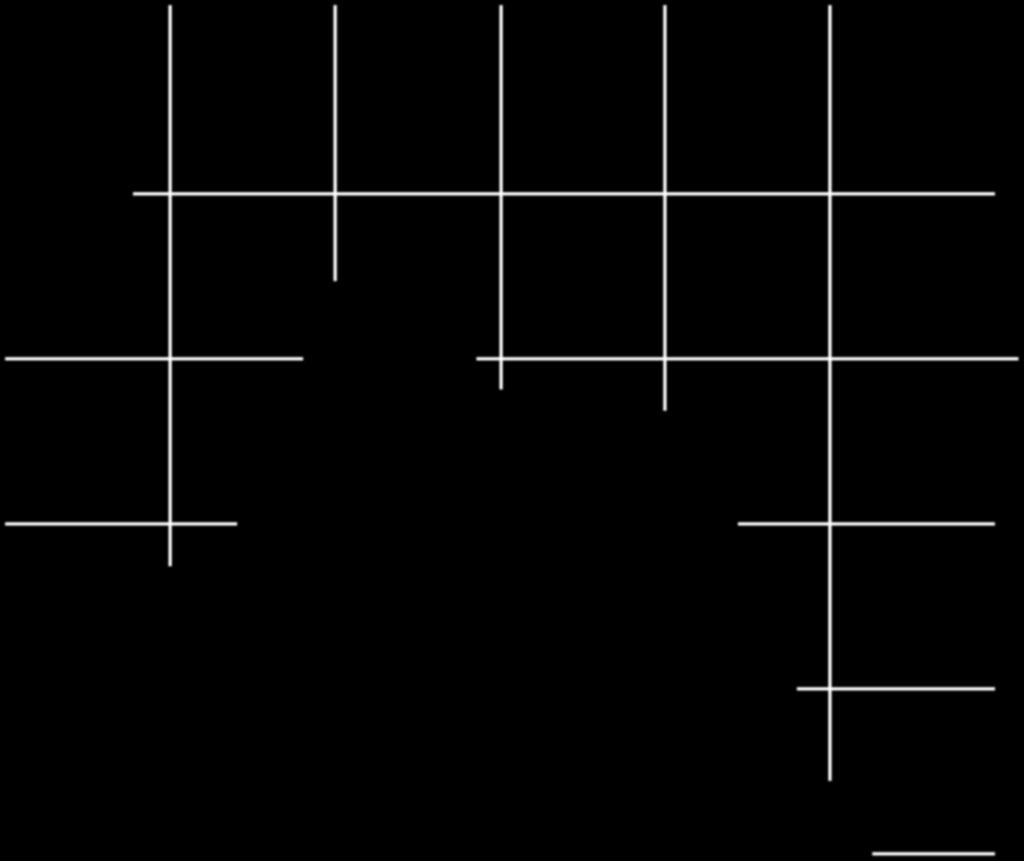
![Figure : The four high-resolution FTIR spectra showing the ] 7 +] 8 combination band of 2 C 2 H 4 in the 82 95 cm](/docs-images/91/106043846/images/2-2.jpg "region collected at different pressures (see Table ).")


![cm region along with the standard water wavenumber values taken from Guelachvili and Rao [26] were used to](/docs-images/91/106043846/images/2-6.jpg "calibrate the transmittance spectrum.")


![Four of the seven sample spectra recorded were also used tomeasurelineintensitiesofthe] 7 +] 8 band of 2 C 2 H 4.](/docs-images/91/106043846/images/2-11.jpg "Each of the four sample spectra which are shown in Figure were calibrated using water absorption lines as discussed")

![Rovibrational Analysis of the ] 7 + ] 8 Band of Ethylene In Figure 2, the 82 95 cm region of the transmittance](/docs-images/91/106043846/images/2-13.jpg "spectrum where the ] 7 + ] 8 combination band of 2 C 2 H 4 is located is shown.")


![For this, the nonlinear least-squares fitting program originally written by Maki [28] wasused.](/docs-images/91/106043846/images/2-16.jpg "For the initial assignments and calculations, we used the line list provided by Herman [29] and the groundstate")
![constants from [3].](/docs-images/91/106043846/images/2-17.jpg "As more lines were assigned and fitted, the upper V 7 + V 8 = staterovibrationalconstantswerecalculated and")
 assigned to each infrared transition was applied to the fitting procedure.")

2 2 International Spectroscopy Transmittance.5.5 Spectrum no. 4 Spectrum no. 3 Transmittance = cm.5 Spectrum no. 2 Spectrum no Wavenumber (cm ) Wavenumber (cm ) Figure 2: An overview of the FTIR absorption spectrum of the ] 7 + ] 8 combination band of 2 C 2 H 4 in the cm region collected at a resolution of.63 cm. Figure : The four high-resolution FTIR spectra showing the ] 7 +] 8 combination band of 2 C 2 H 4 in the cm region collected at different pressures (see Table ). pure ethylene gas samples purchased from Sigma- Aldrich, USA, were recorded at a spectral resolution of.63 cm andatanambienttemperatureof296kinthe atm vapor pressure range. A capacitance pressure gauge was installed on the gas cell. The sample spectra were coadded, and the resultant average spectrum was ratioed against the background spectrum to generate a transmittance spectrum with a smooth baseline and high signal-to-noise ratio. The gas samples contained water vapor as impurities and the unblended water absorption lines recorded in the cm region along with the standard water wavenumber values taken from Guelachvili and Rao [26] were used to calibrate the transmittance spectrum. From the least-square fitting of 62 water frequencies, a relative precision of.2 cm for all measured frequencies was achieved. The correction factor applied to the measured spectrum was.343. The frequencies from the corrected spectrum were used in the determination of the rotation-vibration constants of the ] 7 + ] 8 band of 2 C 2 H 4. Four of the seven sample spectra recorded were also used tomeasurelineintensitiesofthe] 7 +] 8 band of 2 C 2 H 4. Each of the four sample spectra which are shown in Figure were calibrated using water absorption lines as discussed above. Table presents these spectra and the calibration results for each spectrum. After calibration, each of the spectra was convertedtoanabsorbancespectrum. 3. Rovibrational Analysis of the ] 7 + ] 8 Band of Ethylene In Figure 2, the cm region of the transmittance spectrum where the ] 7 + ] 8 combination band of 2 C 2 H 4 is located is shown. As evident in Figure 2, the band exhibits the characteristic contour features of an A-type band: moderate P- andr-branches on opposite ends and a strong Qbranch in the middle. A rather straightforward rovibrational analysis of the unperturbed lines of the band was carried out using a standard A-reduced Watson s Hamiltonian in I r representation [27]. For this, the nonlinear least-squares fitting program originally written by Maki [28] wasused. For the initial assignments and calculations, we used the line list provided by Herman [29] and the groundstate constants from [3]. As more lines were assigned and fitted, the upper V 7 + V 8 = staterovibrationalconstantswerecalculated and improved. A weighting equivalent to the inverse square of the estimated uncertainty (.6 cm ) assigned to each infrared transition was applied to the fitting procedure. The final fit with a root mean square (rms) deviation of.653 cm included a total of 39 infrared transitions. The rovibrational constants determined for the excited state consistedofthethreerotationalconstants,thebandcenter,all five quartic, and two sextic centrifugal distortion parameters. Table 2 presents the results of the rotational analysis. 4. Line Intensity Measurements and Calculations Extraction of the line positions and intensities in the cm spectral region of all four high-resolution absorbance spectra of 2 C 2 H 4 (see Table )wasdoneusing a peak fitting analysis that implemented the Levenberg- Marquardt algorithm. Although the vapor pressure range maybeconsideredtobeonthelowside,eachpeakwas fitted to a Voigt profile which accounts for the effects of both Doppler and collisional broadening. Figure 3 illustrates the quality of the peak fitting analysis that was performed in Spectrum no. 2 (see Table ). The blue circles are actual data points extracted from Spectrum no. 2, and the red line traces thevoigtprofilefit.thebottompaneloffigure 3 gives the residual plot (observed calculated).
3 International Spectroscopy 3 Table : Infrared spectra collected for this study and wavenumber calibration results. Spectrum no. No. of scans Pressure ( 4 Calibration results atm) RMS error 4 (cm ) Correction factor Table2:GroundstateandupperV 7 + V 8 = state rovibrational constants (cm )forthe] 7 + ] 8 combination band of 2 C 2 H 4 (Areduction and I r representation). Ground state [3] V 7 + V 8 =state A (464) a (24) a B (9) (22) C (7) () Δ J (46).3957 (37) Δ JK (3678).2836 (27) Δ K (953).794 (85) δ J (49).236 (4) δ K (39).255 () Φ J (53) [.24347] b Φ JK (3364).428 (6) Φ KJ (85).4229 (54) Φ K (3) [ ] b φ J (669) [.2776] b φ JK (277) [.854] b φ K (3) [3.7555] b ] (92) no. of IR transitions 39 rms deviation (cm ).653 a The uncertainty in the last digits (twice the estimated standard error) is given in parentheses. b Fixed to ground state value (see column 2). ln A Wavenumber (cm ) Voigt profile fit Observed spectrum Figure 3: Part of peak fitting analysis performed in observed Spectrum no. 2 (P = atm) with the corresponding residuals in the lower panel (peak nos in Table 3). Beer s law could be expressed as [3]: S = pl ln I dυ. () I In the above equation, S is the experimental line intensity given in cm /(cm atm), p is vapor pressure in atm, l is the path length which for this study was 8 cm (see Section 2), and I and I are the incident and transmitted intensities of light, respectively, at frequency υ. From the peak fitting analysis that has just been described, ln A = ln(i /I)dυ (in cm ) was obtained for each peak. To determine the experimental line intensity, ln A= ln(i /I)dυ was plotted against p, and the gradient of the best fit line passing through the origin gives the experimental line intensity. An example of this pressure dependence plot is shown in Figure 4 for line positions cm in the P-branch and cm in the R-branch. ln A ( 3 cm ) Pressure ( 4 atm) line at cm line at cm Figure 4: Beer s law plot showing pressure dependence for two lines.
4 4 International Spectroscopy Peak no. J K a K c J K a Table 3: Line positions, assignments, and intensities of the ] 7 + ] 8 band of 2 C 2 H 4. K c Measured wavenumber (cm ) O C(cm ) Line intensities [cm /(cm atm)] Expt l Calc d %Error
5 International Spectroscopy 5 Peak no. J K a K c J K a Table 3: Continued. K c Measured wavenumber (cm ) O C(cm ) Line intensities [cm /(cm atm)] Expt l Calc d %Error
6 6 International Spectroscopy Peak no. J K a K c J K a Table 3: Continued. K c Measured wavenumber (cm ) O C(cm ) Line intensities [cm /(cm atm)] Expt l Calc d %Error The intensity S B A in cm /(cm atm) of an individual absorption line with frequency υ AB in cm is given by [7]: S B A =(8π3 3hc )(N a )(hcυ ABg A Q T )(e E A/hckT ) [ e hcυ AB/kT ] A μ B 2. In (2), h is Planck s constant in erg s; c is the speed of light in cm/s; a =.9773 [32] is the isotopic abundance of 2 C 2 H 4 ; Q T is the total partition function; E A is the energy of the lower state in erg; k is Boltzmann constant in erg/k; T is the temperature in K; and A μ B isthedipolemomentoperator. For 2 C 2 H 4, the nuclear spin factor g A has a value of 7 if K a and K c of the transition are both even and 3 if otherwise. The total population N = T L /pt where L = molecules/cm 3 at standard temperature and pressure and T = K[7]. Using the upper V 7 + V 8 =rovibrational constants we determined (see Table 2), line positions and assignments were generated which in turn were used in (2) for the line intensity calculations. Calculations were made at the same experimental conditions when the high-resolution FTIR spectra were recorded. The calculated dipole moment was.75 D. Table 3 lists the 23 measured and calculated (2) line intensities along with the observed frequencies and the assignments. The experimental fit was satisfactory with the % error between measured and calculated line intensities within ±6% for all 23 lines. Also, the measured and calculated frequencies agree very closely (see O CcolumninTable 3). 5. Conclusion In the present study, 23 line intensities of the ] 7 + ] 8 band of 2 C 2 H 4 were measured by carrying out a peak fitting analysis based on Levenberg-Marquardt algorithm. Results of the experimental fit agree well when compared with the line intensities calculated using the upper V 7 +V 8 =rovibrational constants determined for this study. Acknowledgments The authors thank Dr. Arthur G. Maki for the set of FORTRAN codes they used for their rovibrational analyses. WearealsoindebtedtotheNationalInstituteofEducation, NanyangTechnologicalUniversity,Singapore,forthesupport through research Grants RS 3/8 TTL and RI 9/9 TTL. Ms. G. B. Lebron thanks Nanyang Technological University for her Ph.D. research scholarship. She also acknowledges the support of the NIE Advancement Fund. Partial results of the
7 International Spectroscopy 7 research were presented in the 3th Symposium on Molecular Spectroscopy, Okayama, Japan. References [] B.Bezard,J.L.Moses,J.Lacy,T.Greathouse,M.Richter,and C. Griffith, Detection of ethylene (C 2 H 4 ) on jupiter and saturn in non-auroral regions, Bulletin of the American Astronomical Society,vol.33,p.79,2. [2] H. Feuchtgruber, E. Lellouch, B. Bézard, T. Encrenaz, T. de Graauw, and G. R. Davis, Detection of HD in the atmospheres of Uranus and Neptune: a new determination of the D/H ratio, Astronomy and Astrophysics,vol.34,no.,pp.L7 L2,999. [3] L. N. Fletcher, P. Drossart, M. Burgdorf, G. S. Orton, and T. Encrenaz, Neptune s atmospheric composition from AKARI infrared spectroscopy, Astronomy and Astrophysics, vol. 54, no., article A7, 2. [4] R.Hanel,B.Conrath,F.M.Flasaretal., Infraredobservations of the Saturnian system from voyager, Science, vol.22,no. 449, pp. 92 2, 98. [5] A. Bar-nun and M. Podolak, The photochemistry of hydrocarbons in Titan s atmosphere, Icarus, vol. 38, no., pp. 5 22, 979. [6] A. Ben Hassen, F. Kwabia Tchana, J. M. Flaud, W. J. Lafferty, X. Landsheere, and H. Aroui, Absolute line intensities for ethylene from 8 to 235 cm, Molecular Spectroscopy,vol. 282,pp.3 33,22. [7] W. E. Blass, J. J. Hillman, A. Faytetal., μm ethylene: spectroscopy, intensities and a planetary modeler s atlas, Quantitative Spectroscopy and Radiative Transfer, vol.7,no., pp.47 6,2. [8] D. C. Reuter and J. M. Sirota, Absolute intensities and foreign gas broadening coefficients of the, 2, and 8,8 8,8 lines in the ] 7 band of C 2 H 2, Quantitative Spectroscopy and Radiative Transfer, vol.5,no.5,pp , 993. [9] M. Rotger, V. Boudon, and J. Vander Auwera, Line positions and intensities in the ] 2 band of ethylene near 45 cm : an experimental and theoretical study, Quantitative Spectroscopy and Radiative Transfer,vol.9,no.6,pp , 28. [] J. Walrand, M. Lengelé, G. Blanquet, and M. Lepère, Absolute line intensities determination in the ] 7 band of C 2 H 4, Spectrochimica Acta A,vol.59,pp ,23. [] G. B. Lebron and T. L. Tan, High-resolution FTIR measurement and analysis of the ] 3 band of C 2 H 2 D, Molecular Spectroscopy,vol.26,no.2,pp.9 23,2. [2] G. B. Lebron and T. L. Tan, Improved rovibrational constants for the ] 2 band of C 2 H 3 D, Molecular Spectroscopy, vol. 265, no., pp , 2. [3] G. B. Lebron and T. L. Tan, Integrated Band Intensities of Ethylene ( 2 C 2 H 2 ) by Fourier Transform Infrared Spectroscopy, International Spectroscopy, vol. 22, Article ID , 5 pages, 22. [4] G. B. Lebron and T. L. Tan, The high-resolution FTIR spectrum of the ] 4 + ] 4 band of trans-d 2 -ethylene (trans-c 2 H 2 D 2 ), Journal of Molecular Spectroscopy,vol.27,no.,pp.44 49,22. [5] G. B. Lebron and T. L. Tan, Improved rovibrational constants for the ] 6 + ] band of ethylene ( 2 C 2 H 4 ) by high-resolution Fourier transform infrared spectroscopy, Molecular Spectroscopy,vol.283,pp.29 3,23. [6] T. L. Tan, M. G. Gabona, and G. B. Lebron, The ] 2 band of C 2 D 4, Molecular Spectroscopy,vol.266,no.2,pp.3 5, 2. [7] T. L. Tan and G. B. Lebron, The high-resolution FTIR spectrum of the ] 6 band of C 2 H 3 D, Molecular Spectroscopy,vol. 263, no. 2, pp. 6 65, 2. [8] T. L. Tan and G. B. Lebron, The ] 2 band of ethylene-- 3 C ( 3 C 2 CH 4 ) by high-resolution FTIR spectroscopy, Molecular Spectroscopy,vol.26,no.,pp.63 67,2. [9] T. L. Tan and G. B. Lebron, High-resolution infrared analysis of the ] 7 band of cis-ethylene-d 2 (cis-c 7 H 7 D 7 ), Molecular Spectroscopy,vol.26,no.2,pp.87 9,2. [2] T. L. Tan and G. B. Lebron, Rovibrational constants for the ground state and ] 8 = state of ethylene-d 3 (C 2 HD 3 ) by high-resolution FTIR spectroscopy, Molecular Spectroscopy,vol.269,no.,pp.9 2,2. [2] G.B.LebronandT.L.Tan, High-resolutionFouriertransform infraredspectrumofthe] band of ethylene ( 2 C 2 H 4 ), Journal of Molecular Spectroscopy,vol.288,pp. 3,23. [22]D.Hurtmans,A.Rizopoulos,M.Herman,L.M.S.Hassan, and A. Perrin, Vibration-rotation analysis of the jet-cooled ] 2, ] 7 + ] 8 and v] 6 + ] absorption bands of 2 C 2 H 4, Molecular Physics,vol.99,no.5,pp ,2. [23] C. Lambeau, M. de Vleeschouwer, D. van Lerberghe et al., Spin-flip laser spectra of ethylene in the 2 cm region, Molecular Physics,vol.46,no.5,pp.98 99,982. [24] D. van Lerberghe and A. Fayt, High resolution study of the ] 7 + ] 8 band of ethylene (C 2 H 4 )at889cm, Molecular Physics, vol. 3, pp , 976. [25] W. J. Lafferty, J.-M. Flaud, and F. K. Tchana, The highresolutioninfraredspectrumofethyleneinthe8 235cm spectral region, Molecular Physics, vol. 9, no. 2, pp , 2. [26] G. Guelachvili and K. N. Rao, Handbook of Infrared Standards, Academic Press, Orlando, Fla, USA, 986. [27] J. K. G. Watson, Aspects of quartic and sextic centrifugal effects of rotational energy levels, in Vibrational Spectra and Structure: ASeriesofAdvances, J. R. Durig, Ed., Elsevier, New York, NY, USA, 977. [28] A. G. Maki, ASYM9. [29] M. Herman, Private communication. [3] F. Willaert, J. Demaison, L. Margules et al., The spectrum of ethylene from microwave to submillimetre-wave, Molecular Physics,vol.4,no.2,pp ,26. [3] P. F. Bernath, Spectra of Atoms and Molecules, Oxford University Press, New York, NY, USA, 25. [32] P. de Bievre, M. Gallet, N. E. Holden, and I. L. Barnes, Isotopic abundances and atomic weights of the elements, Physical and Chemical Reference Data,vol.3,pp.89 89,984.


8 International Medicinal Chemistry Photoenergy International Organic Chemistry International International Analytical Chemistry Advances in Physical Chemistry International Carbohydrate Chemistry Quantum Chemistry Submit your manuscripts at The Scientific World Journal International Inorganic Chemistry Theoretical Chemistry Spectroscopy Analytical Methods in Chemistry Chromatography Research International International Electrochemistry Catalysts Applied Chemistry Bioinorganic Chemistry and Applications International Chemistry Spectroscopy
FIRST HIGH-RESOLUTION ANALYSIS OF PHOSGENE 35 Cl 2. CO AND 35 Cl 37 ClCO FUNDAMENTALS IN THE CM -1 SPECTRAL REGION
 FIRST HIGH-RESOLUTION ANALYSIS OF PHOSGENE 35 Cl 2 CO AND 35 Cl 37 ClCO FUNDAMENTALS IN THE 250-480 CM -1 SPECTRAL REGION F. Kwabia Tchana 1, M. Ndao 1, L. Manceron 2, A. Perrin 1, J. M. Flaud 1, W.J.
Line Intensities in the ν 6 Fundamental Band of CH 3 Br at 10 µm
 Journal of Molecular Spectroscopy 216, 30 47 (2002) doi:10.1006/jmsp.2002.8640 Line Intensities in the ν 6 Fundamental Band of CH 3 Br at 10 µm E. Brunetaud, I. Kleiner, and N. Lacome Laboratoire de Dynamique,
Infrared and Microwave Spectra and Force Field of DBO: The Coriolis Interaction between the 1 and 2 3 States
 JOURNAL OF MOLECULAR SPECTROSCOPY 192, 152 161 (1998) ARTICLE NO. MS987633 Infrared and Microwave Spectra and Force Field of DBO: The Coriolis Interaction between the 1 and 2 3 States Yoshiyuki Kawashima,*
[1]. It is produced endogeneously by plants which are the largest natural producers of ethylene. It
![[1]. It is produced endogeneously by plants which are the largest natural producers of ethylene. It](/thumbs/95/123322277.jpg "[1]. It is produced endogeneously by plants which are the largest natural producers of ethylene. It") Chapter 1 Introduction CHAPTER 1 INTRODUCTION 1.1 Ethylene Ethylene, H C = CH, is an organic molecule containing the alkene (C=C) functional group [1]. It is produced endogeneously by plants which are
Chapter 1 Introduction CHAPTER 1 INTRODUCTION 1.1 Ethylene Ethylene, H C = CH, is an organic molecule containing the alkene (C=C) functional group [1]. It is produced endogeneously by plants which are
E. V. Karlovets ab, A. Campargue a*, D. Mondelain a, S. Kassi a, S. A. Tashkun b, V. I. Perevalov b
 High sensitivity Cavity Ring Down spectroscopy of 18 O enriched carbon dioxide between 5850 and 7000 cm -1 : III. Analysis and theoretical modelling of the 12 C 17 O 2, 16 O 12 C 17 O, 17 O 12 C 18 O,
Aminoethanol. Chapter Introduction. Aminoalcohols are central to the gas phase formation of glycine in current hot
 75 Chapter 7 Aminoethanol 7.1 Introduction Aminoalcohols are central to the gas phase formation of glycine in current hot core chemical models. The protonated forms of aminomethanol (NH 2 CH 2 OH) and
Molecular spectroscopy
 Molecular spectroscopy Origin of spectral lines = absorption, emission and scattering of a photon when the energy of a molecule changes: rad( ) M M * rad( ' ) ' v' 0 0 absorption( ) emission ( ) scattering
Research Article Study of Transport Properties of Tris (hydroxymethyl)aminomethane Hydrochloride in 20% (v/v) Acetone-Water System at 303.
aminomethane Hydrochloride in 20% (v/v) Acetone-Water System at 303.") Applied Chemistry Volume 03, Article ID 8053, 4 pages http://dx.doi.org/0.55/03/8053 Research Article Study of Transport Properties of Tris (hydroxymethyl)aminomethane Hydrochloride in 0% (v/v) Acetone-Water
Applied Chemistry Volume 03, Article ID 8053, 4 pages http://dx.doi.org/0.55/03/8053 Research Article Study of Transport Properties of Tris (hydroxymethyl)aminomethane Hydrochloride in 0% (v/v) Acetone-Water
This article appeared in a journal published by Elsevier. The attached copy is furnished to the author for internal non-commercial research and
 This article appeared in a journal published by Elsevier. The attached copy is furnished to the author for internal non-commercial research and education use, including for instruction at the authors institution
Meridional Transport in the Stratosphere of Jupiter
 Submitted to Astrophysical Journal Letters Meridional Transport in the Stratosphere of Jupiter Mao-Chang Liang 1, Run-Lie Shia 1, Anthony Y.-T. Lee 1, Mark Allen 1,2,A.James Friedson 2, and Yuk L. Yung
DIODE- AND DIFFERENCE-FREQUENCY LASER STUDIES OF ATMOSPHERIC MOLECULES IN THE NEAR- AND MID-INFRARED: H2O, NH3, and NO2
 DIODE- AND DIFFERENCE-FREQUENCY LASER STUDIES OF ATMOSPHERIC MOLECULES IN THE NEAR- AND MID-INFRARED: H2O, NH3, and NO2 Johannes ORPHAL, Pascale CHELIN, Nofal IBRAHIM, and Pierre-Marie FLAUD Laboratoire
New infrared integrated band intensities for HC 3 N and extensive line list for the m 5 and m 6 bending modes
 Journal of Molecular Spectroscopy 242 (2007) 46 54 www.elsevier.com/locate/jms New infrared integrated band intensities for HC 3 N and extensive line list for the m 5 and m 6 bending modes A. Jolly a,
The Laboratory Measurement of Pressure Broadening Parameter for Atmospheric Remote Sensing
 The Laboratory Measurement of Pressure Broadening Parameter for Atmospheric Remote Sensing YAMADA Masumi, KASAI Yasuko, and AMANO Takayoshi The upcoming JEM/SMILES (Superconducting Submillimeter-wave Limb
Lecture 3. Composition and structure of the atmosphere. Absorption and emission by atmospheric gases.
 Lecture 3. Composition and structure of the atmosphere. Absorption and emission by atmospheric gases. 1. Structure and composition of the Earth s atmosphere. 2. Properties of atmospheric gases. 3. Basic
Linda R. Brown. Jet Propulsion Laboratory California Institute of Technology Pasadena, CA
 Infrared Laboratory Spectroscopy. of CH4 and CH3D for Atmospheric Studies Linda R. Brown Jet Propulsion Laboratory California Institute of Technology Pasadena, CA 91109 linda.brown@jpl.nasa.gov The part
Composition and structure of the atmosphere. Absorption and emission by atmospheric gases.
 Lecture 3. Composition and structure of the atmosphere. Absorption and emission by atmospheric gases. 1. Structure and composition of the Earth s atmosphere. 2. Properties of atmospheric gases. 3. Basic
Chapter 3. Infrared Reflectance Spectra of Tholins
 3-1 Chapter 3. Infrared Reflectance Spectra of Tholins at Cryogenic Temperatures 3.1. Introduction Infrared spectroscopy is one of the cornerstone techniques for molecular structure determination. Because
High Sensitivity Gas Sensor Based on IR Spectroscopy Technology and Application
 PHOTONIC SENSORS / Vol. 6, No. 2, 2016: 127 131 High Sensitivity Gas Sensor Based on IR Spectroscopy Technology and Application Hengyi LI Department of Electronic Information Engineering, Jincheng College
Vibrational Spectra of Chloroform, Freon-11 and Selected Isotopomers in the THz Frequency Region
 Vibrational Spectra of Chloroform, Freon-11 and Selected Isotopomers in the THz Frequency Region Christa Haase, Jinjun Liu, Frédéric Merkt, Laboratorium für physikalische Chemie, ETH Zürich current address:
Molecular spectroscopy for planetary and exoplanetary radiative transfer : The rock of Sisyphus or the barrel of the Danaids?
 Molecular spectroscopy for planetary and exoplanetary radiative transfer : The rock of Sisyphus or the barrel of the Danaids? Pierre Drossart LESIA, Observatoire de Meudon Situation of molecular spectroscopy
Elsevier Journal Archives
 Elsevier Journal Archives Perpetual Access (Basic Science Collection 260 Titles) (Physical and Analytical Chemistry, Inorganic Chemistry, Mathematics, Physics, and High Energy Nuclear Physics Astronomy)
Theoretical and Experimental Studies on Alkali Metal Phenoxyacetates
 Spectroscopy: An International Journal Volume 27 (2012), Issue 5-6, Pages 321 328 doi:10.1155/2012/498439 Theoretical and Experimental Studies on Alkali Metal Phenoxyacetates E. Regulska, M. Samsonowicz,
Absorption Line Physics
 Topics: 1. Absorption line shapes 2. Absorption line strength 3. Line-by-line models Absorption Line Physics Week 4: September 17-21 Reading: Liou 1.3, 4.2.3; Thomas 3.3,4.4,4.5 Absorption Line Shapes
Physical Chemistry II Laboratory
 Kuwata Spring 2003 Physical Chemistry II Laboratory The Rovibrational Spectra of H 35 Cl and H 37 Cl Using FTIR Write-Up Due Date: Thursday, April 17 (You may record spectra and write your reports in teams
6.2 Polyatomic Molecules
 6.2 Polyatomic Molecules 6.2.1 Group Vibrations An N-atom molecule has 3N - 5 normal modes of vibrations if it is linear and 3N 6 if it is non-linear. Lissajous motion A polyatomic molecule undergoes a
Research Article Elementary Statistical Models for Vector Collision-Sequence Interference Effects with Poisson-Distributed Collision Times
 Spectroscopy Volume, Article ID 56697, 5 pages doi:55//56697 Research Article Elementary Statistical Models for Vector Collision-Sequence Interference Effects with Poisson-Distributed Collision Times John
Isotopic effect of Cl + 2 rovibronic spectra in the A X system
 Vol 18 No 7, July 009 c 009 Chin. Phys. Soc. 1674-1056/009/1807)/74-05 Chinese Physics B and IOP Publishing Ltd Isotopic effect of Cl + rovibronic spectra in the A X system Wu Ling ) a)c), Yang Xiao-Hua
Solar-System Objects as Radiance Calibrators in the Far-Infrared and Submillimeter
 Solar-System Objects as Radiance Calibrators in the Far-Infrared and Submillimeter Glenn Orton Jet Propulsion Laboratory California Institute of Technology Planetary astronomers: Calibrate planetary flux
Chapter 17: Fundamentals of Spectrophotometry
 Chapter 17: Fundamentals of Spectrophotometry Spectroscopy: the science that deals with interactions of matter with electromagnetic radiation or other forms energy acoustic waves, beams of particles such
Impact of different spectroscopic datasets on CH 4 retrievals from Jungfraujoch FTIR spectra
 Impact of different spectroscopic datasets on CH 4 retrievals from Jungfraujoch FTIR spectra P. Duchatelet (1), E. Mahieu (1), P. Demoulin (1), C. Frankenberg (2), F. Hase (3), J. Notholt (4), K. Petersen
NORTH CAROLINA STATE UNIVERSITY Department of Chemistry. Physical Chemistry CH437 Problem Set #4 Due Date: September 22, 2015
 NORTH CAROLINA STATE UNIVERSITY Department of Chemistry Name Physical Chemistry CH437 Problem Set #4 Due Date: September 22, 2015 Using a Fourier Transform Infra-red (FTIR) spectrometer we can obtain sufficiently
Fourier Transform Infrared Spectrometry Prelab Last modified: June 17, 2014
 Fourier Transform Infrared Spectrometry Prelab Recommended reading: AirUCI Lab Manual: Environmental Chemistry Text: FTIR Lab Pages: 6, 7, 13 16 on Light Absorption Pages: 175 177, 184, 185 on Molecular
Observations 3: Data Assimilation of Water Vapour Observations at NWP Centres
 Observations 3: Data Assimilation of Water Vapour Observations at NWP Centres OUTLINE: Data Assimilation A simple analogy: data fitting 4D-Var The observation operator : RT modelling Review of Radiative
Because light behaves like a wave, we can describe it in one of two ways by its wavelength or by its frequency.
 Light We can use different terms to describe light: Color Wavelength Frequency Light is composed of electromagnetic waves that travel through some medium. The properties of the medium determine how light
LECTURE NOTES. Ay/Ge 132 ATOMIC AND MOLECULAR PROCESSES IN ASTRONOMY AND PLANETARY SCIENCE. Geoffrey A. Blake. Fall term 2016 Caltech
 LECTURE NOTES Ay/Ge 132 ATOMIC AND MOLECULAR PROCESSES IN ASTRONOMY AND PLANETARY SCIENCE Geoffrey A. Blake Fall term 2016 Caltech Acknowledgment Part of these notes are based on lecture notes from the
Research Article Conformity Check of Thickness to the Crystal Plate λ/4(λ/2)
") Spectroscopy Volume 23, Article ID 87589, 4 pages http://dx.doi.org/5/23/87589 Research Article Conformity Check of Thickness to the Crystal Plate λ/4(λ/2) Alexander Syuy, Dmitriy Shtarev, Victor Krishtop,
Spectroscopy Volume 23, Article ID 87589, 4 pages http://dx.doi.org/5/23/87589 Research Article Conformity Check of Thickness to the Crystal Plate λ/4(λ/2) Alexander Syuy, Dmitriy Shtarev, Victor Krishtop,
Educational experiment package Volume 1. Molecular spectroscopy
 Educational experiment package Volume 1 Molecular spectroscopy Overview Thermo Fisher Scientific is proud to offer a variety of educational experiments for use with Fourier transform infrared (FTIR) spectrometers.
Chapter 17: Fundamentals of Spectrophotometry
 Chapter 17: Fundamentals of Spectrophotometry Spectroscopy: the science that deals with interactions of matter with electromagnetic radiation or other forms energy acoustic waves, beams of particles such
Infrared Spectroscopy: Identification of Unknown Substances
 Infrared Spectroscopy: Identification of Unknown Substances Suppose a white powder is one of the four following molecules. How can they be differentiated? H N N H H H H Na H H H H H A technique that is
WATER (AND CHEMISTRY) IN THE SOLAR SYSTEM
 IN THE SOLAR SYSTEM") WATER (AND CHEMISTRY) IN THE SOLAR SYSTEM A GT-KP planetary program proposed for Herschel R. Moreno (Obs( Obs.. Paris), P. Hartogh,, E. Lellouch,, J. Crovisier and the HIFI Solar System Team Science Objectives
WATER (AND CHEMISTRY) IN THE SOLAR SYSTEM A GT-KP planetary program proposed for Herschel R. Moreno (Obs( Obs.. Paris), P. Hartogh,, E. Lellouch,, J. Crovisier and the HIFI Solar System Team Science Objectives
Dimethyl Carbonate & Methyl Glycolate
 46 Chapter 5 Dimethyl Carbonate & Methyl Glycolate 5.1 Introduction Structural isomerism is widespread in the ISM. The abundances of the 2C structural isomers methyl formate, acetic acid, and glycolaldehyde
Radiative Transfer and Molecular Lines Sagan Workshop 2009
 Radiative Transfer and Molecular Lines Sagan Workshop 2009 Sara Seager Trent Schindler Trent Schindler MIT Lecture Contents Overview of Equations for Planetary Atmospheres Radiative Transfer Thermal Inversions
William H. Brown & Christopher S. Foote
 Requests for permission to make copies of any part of the work should be mailed to:permissions Department, Harcourt Brace & Company, 6277 Sea Harbor Drive, Orlando, Florida 32887-6777 William H. Brown
Fourier transform infrared spectroscopy (FTIR) is a method used to obtain an infrared
 is a method used to obtain an infrared") Fourier Transform Infrared Spectroscopy: Low Density Polyethylene, High Density Polyethylene, Polypropylene and Polystyrene Eman Mousa Alhajji North Carolina State University Department of Materials Science
Fourier Transform Infrared Spectroscopy: Low Density Polyethylene, High Density Polyethylene, Polypropylene and Polystyrene Eman Mousa Alhajji North Carolina State University Department of Materials Science
Experiment 4 INFRARED SPECTROSCOPY
 Experiment INFRARED SPECTROSCOPY Infrared (IR) spectroscopy is one tool for the study of molecular structure. In the case of diatomic molecules, one can extract bond lengths and bond force constants from
Lecture 6 - spectroscopy
 Lecture 6 - spectroscopy 1 Light Electromagnetic radiation can be thought of as either a wave or as a particle (particle/wave duality). For scattering of light by particles, air, and surfaces, wave theory
Experiment 3: The Rovibrational Spectrum of HCl (was Experiment 4 in the syllabus, but the original Experiment 3 was canceled)
") Varberg and Kuwata Chemistry 312 Spring 28 Experiment 3: The Rovibrational Spectrum of HCl (was Experiment 4 in the syllabus, but the original Experiment 3 was canceled) Meet for lab on Thursday, April
Varberg and Kuwata Chemistry 312 Spring 28 Experiment 3: The Rovibrational Spectrum of HCl (was Experiment 4 in the syllabus, but the original Experiment 3 was canceled) Meet for lab on Thursday, April
Lecture 3: Light absorbance
 Lecture 3: Light absorbance Perturbation Response 1 Light in Chemistry Light Response 0-3 Absorbance spectrum of benzene 2 Absorption Visible Light in Chemistry S 2 S 1 Fluorescence http://www.microscopyu.com
Jacquinet-Husson N., Capelle V., Crépeau L., Scott N.A., Armante R., Chédin A.
 Jacquinet-Husson N., Capelle V., Crépeau L., Scott N.A., Armante R., Chédin A. Laboratoire de Météorologie Dynamique Atmospheric Radiation Analysis Group Ecole Polytechnique 91128, Palaiseau, France http://ara.lmd.polytechnique.fr
The ISO spectra of Uranus and Neptune between 2.5 and 4.2 µm: constraints on albedos and H 3
 Astron. Astrophys. 358, L83 L87 (2000) Letter to the Editor ASTRONOMY AND ASTROPHYSICS The ISO spectra of Uranus and Neptune between 2.5 and 4.2 µm: constraints on albedos and H 3 Th. Encrenaz 1, B. Schulz
Fourier Transform Infrared. Spectrometry
 Fourier Transform Infrared. Spectrometry Second Editio n PETER R. GRIFFITH S JAMES A. de HASETH PREFACE x v CHAPTER 1 INTRODUCTION TO VIBRATIONAL SPECTROSCOPY 1 1.1. Introduction 1 1.2. Molecular Vibrations
FT-IR Spectroscopy. An introduction in measurement techniques and interpretation
 FT-IR Spectroscopy An introduction in measurement techniques and interpretation History Albert Abraham Michelson (1852-1931) Devised Michelson Interferometer with Edward Morley in 1880 (Michelson-Morley
APPLICATIONS WITH METEOROLOGICAL SATELLITES. W. Paul Menzel. Office of Research and Applications NOAA/NESDIS University of Wisconsin Madison, WI
 APPLICATIONS WITH METEOROLOGICAL SATELLITES by W. Paul Menzel Office of Research and Applications NOAA/NESDIS University of Wisconsin Madison, WI July 2004 Unpublished Work Copyright Pending TABLE OF CONTENTS
Detection of ozone for use as an extrasolar biosignature
 Detection of ozone for use as an extrasolar biosignature Kristina Pistone ABSTRACT While it has previously been proposed that ozone could be a sign of life if detected in an extrasolar planetary atmosphere,
Advanced Spectroscopy Laboratory
 Advanced Spectroscopy Laboratory - Raman Spectroscopy - Emission Spectroscopy - Absorption Spectroscopy - Raman Microscopy - Hyperspectral Imaging Spectroscopy FERGIELAB TM Raman Spectroscopy Absorption
Chapter 12 Mass Spectrometry and Infrared Spectroscopy
 Organic Chemistry, 6 th Edition L. G. Wade, Jr. Chapter 12 Mass Spectrometry and Infrared Spectroscopy Jo Blackburn Richland College, Dallas, TX Dallas County Community College District 2006, Prentice
Vibrational and Rotational Analysis of Hydrogen Halides
 Vibrational and Rotational Analysis of Hydrogen Halides Goals Quantitative assessments of HBr molecular characteristics such as bond length, bond energy, etc CHEM 164A Huma n eyes Near-Infrared Infrared
Spectroscopy. Practical Handbook of. J. W. Robinson, Ph.D., D.Sc, F.R.C.S. Department of Chemistry Louisiana State University Baton Rouge, Louisiana
 Practical Handbook of Spectroscopy Edited by J. W. Robinson, Ph.D., D.Sc, F.R.C.S. Department of Chemistry Louisiana State University Baton Rouge, Louisiana CRC Press Boca Raton Ann Arbor Boston TABLE
Infrared quantitative spectroscopy and atmospheric satellite measurements
 Infrared quantitative spectroscopy and atmospheric satellite measurements Jean-Marie Flaud Laboratoire Interuniversitaire des Systèmes Atmosphériques CNRS, Universités Paris Est Créteil et Paris Diderot
SPECTROSCOPY MEASURES THE INTERACTION BETWEEN LIGHT AND MATTER
 SPECTROSCOPY MEASURES THE INTERACTION BETWEEN LIGHT AND MATTER c = c: speed of light 3.00 x 10 8 m/s (lamda): wavelength (m) (nu): frequency (Hz) Increasing E (J) Increasing (Hz) E = h h - Planck s constant
ATMO 551a Fall Resonant Electromagnetic (EM) Interactions in Planetary atmospheres. Electron transition between different electron orbits
 Interactions in Planetary atmospheres. Electron transition between different electron orbits") Resonant Electromagnetic (EM) Interactions in Planetary atmospheres There are three classes of energy states that interact with EM radiation that we are interested in to understand how light (EM radiation)
Resonant Electromagnetic (EM) Interactions in Planetary atmospheres There are three classes of energy states that interact with EM radiation that we are interested in to understand how light (EM radiation)
Abstract... I. Acknowledgements... III. Table of Content... V. List of Tables... VIII. List of Figures... IX
 Abstract... I Acknowledgements... III Table of Content... V List of Tables... VIII List of Figures... IX Chapter One IR-VUV Photoionization Spectroscopy 1.1 Introduction... 1 1.2 Vacuum-Ultraviolet-Ionization
Atmosphere Properties and Molecular Absorption Spectrum
 Week 3: September 10-14 Atmosphere Properties and Molecular Absorption Spectrum Topics: 1. Atmospheric composition and structure 2. Molecular absorption line formation 3. Molecular absorption spectrum
Lecture 4: Polyatomic Spectra
 Lecture 4: Polyatomic Spectra 1. From diatomic to polyatomic Ammonia molecule A-axis. Classification of polyatomic molecules 3. Rotational spectra of polyatomic molecules N 4. Vibrational bands, vibrational
THE VIBRATIONAL SPECTRA OF A POLYATOMIC MOLECULE (Revised 3/27/2006)
") THE VIBRATIONAL SPECTRA OF A POLYATOMIC MOLECULE (Revised 3/27/2006) 1) INTRODUCTION The vibrational motion of a molecule is quantized and the resulting energy level spacings give rise to transitions in
THE VIBRATIONAL SPECTRA OF A POLYATOMIC MOLECULE (Revised 3/27/2006) 1) INTRODUCTION The vibrational motion of a molecule is quantized and the resulting energy level spacings give rise to transitions in
Molecular spectroscopy Multispectral imaging (FAFF 020, FYST29) fall 2017
 fall 2017") Molecular spectroscopy Multispectral imaging (FAFF 00, FYST9) fall 017 Lecture prepared by Joakim Bood joakim.bood@forbrf.lth.se Molecular structure Electronic structure Rotational structure Vibrational
Molecular spectroscopy Multispectral imaging (FAFF 00, FYST9) fall 017 Lecture prepared by Joakim Bood joakim.bood@forbrf.lth.se Molecular structure Electronic structure Rotational structure Vibrational
Quote from Eugene Paul Wigner
 Quote from Eugene Paul Wigner See also: Current Science, vol. 69, no. 4, 25 August 1995, p. 375 From the preface to his book on group theory: Wigner relates a conversation with von Laue on the use of group
Abstract. Introduction
 DESIGNING A MULTIPASS ABSORPTION CELL FOR A HIGH RESOLUTION FTIR SPECTROMETER P. Karhu, T. Ahonen, V.-M. Horneman, and R. Anttila Department of Physical Sciences in the University of Oulu B.O.X 3000 Fin-90014
José Cernicharo IFF-CSIC
 An Introduction to Molecular Spectroscopy José Cernicharo IFF-CSIC jose.cernicharo@csic.es INTRODUCTION TO MOLECULAR RADIO ASTRONOMY FROM MILLIMETER TO SUBMILLIMETER AND FAR INFRARED Molecular Spectroscopy
Real-time ppb CO 2 Impurity Detection by an Advanced FTIR- UVF System
 Real-time ppb CO 2 Impurity Detection by an Advanced FTIR- UVF System Presented at the BevTech Conference, Albuquerque, NM 2018 by Charles M. Phillips Ph.D., Max Analytical Technologies Mark Taylor, Vice
Jacquinet-Husson N., Capelle V., Crépeau L., Scott N.A., Armante R., Chédin A.
 Jacquinet-Husson N., Capelle V., Crépeau L., Scott N.A., Armante R., Chédin A. Laboratoire de Météorologie Dynamique Atmospheric Radiation Analysis Group Ecole Polytechnique 91128, Palaiseau, France http://ara.lmd.polytechnique.fr
Modeling of Jupiter s stratosphere: new radiation code and impacts on the dynamics
 Symposium on Planetary Science 2015, 2015/02/16, Tohoku Univ. Modeling of Jupiter s stratosphere: new radiation code and impacts on the dynamics Takeshi Kuroda Tohoku University A.S. Medvedev, J. Sethunadh,
Headspace Raman Spectroscopy
 ELECTRONICALLY REPRINTED FROM SEPTEMBER 2014 Molecular Spectroscopy Workbench Raman Spectroscopy We examine vapor-phase Raman spectroscopy through the acquisition of spectra from gas molecules confined
Lecture 0. NC State University
 Chemistry 736 Lecture 0 Overview NC State University Overview of Spectroscopy Electronic states and energies Transitions between states Absorption and emission Electronic spectroscopy Instrumentation Concepts
Physics and Chemistry of the Interstellar Medium
 Physics and Chemistry of the Interstellar Medium Sun Kwok The University of Hong Kong UNIVERSITY SCIENCE BOOKS Sausalito, California * Preface xi The Interstellar Medium.1.1 States of Matter in the ISM
Rotation and vibration of Molecules
 Rotation and vibration of Molecules Overview of the two lectures... 2 General remarks on spectroscopy... 2 Beer-Lambert law for photoabsorption... 3 Einstein s coefficients... 4 Limits of resolution...
II. WAVELENGTH SELECTION
 Ozone detection by DFB QCL absorption technique using Multipass cell S.S. Yenaganti 1, S.S.Kulkarni 2, A.J.Verma 3, N.Sreevalsen 4, V.Rathore 5 1 Department of Electronics and Telecommunications Engineering,
Preface to the Second Edition. Preface to the First Edition
 Contents Preface to the Second Edition Preface to the First Edition iii v 1 Introduction 1 1.1 Relevance for Climate and Weather........... 1 1.1.1 Solar Radiation.................. 2 1.1.2 Thermal Infrared
A critical review of the absorption cross-sections of O 3 and NO 2 in the ultraviolet and visible
 Journal of Photochemistry and Photobiology A: Chemistry 157 (2003) 185 209 A critical review of the absorption cross-sections of O 3 and NO 2 in the ultraviolet and visible J. Orphal Laboratoire de Photophysique
7a. Structure Elucidation: IR and 13 C-NMR Spectroscopies (text , , 12.10)
") 2009, Department of Chemistry, The University of Western Ontario 7a.1 7a. Structure Elucidation: IR and 13 C-NMR Spectroscopies (text 11.1 11.5, 12.1 12.5, 12.10) A. Electromagnetic Radiation Energy is
2009, Department of Chemistry, The University of Western Ontario 7a.1 7a. Structure Elucidation: IR and 13 C-NMR Spectroscopies (text 11.1 11.5, 12.1 12.5, 12.10) A. Electromagnetic Radiation Energy is
Substellar Atmospheres. PHY 688, Lecture 18 Mar 9, 2009
 Substellar Atmospheres PHY 688, Lecture 18 Mar 9, 2009 Outline Review of previous lecture the Kepler mission launched successfully results P < 1 month planets by September 09 giant planet interiors comparison
 Spectral infrared analysis in thermal cameras with diffraction gratings by R. Olbrycht*, B. Więcek* and M. Kałuża* * Lodz Univ. of Technology, Institute of Electronics, Poland, robert.olbrycht@p.lodz.pll
Planetary Temperatures
 Planetary Temperatures How does Sunlight heat a planet with no atmosphere? This is similar to our dust grain heating problem First pass: Consider a planet of radius a at a distance R from a star of luminosity
Research Article Fourier Transform Infrared Spectroscopy of (Bisphenol A)
") Spectroscopy Volume 2016, Article ID 2073613, 5 pages http://dx.doi.org/10.1155/2016/2073613 Research Article Fourier Transform Infrared Spectroscopy of (Bisphenol A) Ramzan Ullah, 1,2 Ishaq Ahmad, 2 and
Spectroscopy Volume 2016, Article ID 2073613, 5 pages http://dx.doi.org/10.1155/2016/2073613 Research Article Fourier Transform Infrared Spectroscopy of (Bisphenol A) Ramzan Ullah, 1,2 Ishaq Ahmad, 2 and
24/ Rayleigh and Raman scattering. Stokes and anti-stokes lines. Rotational Raman spectroscopy. Polarizability ellipsoid. Selection rules.
 Subject Chemistry Paper No and Title Module No and Title Module Tag 8/ Physical Spectroscopy 24/ Rayleigh and Raman scattering. Stokes and anti-stokes lines. Rotational Raman spectroscopy. Polarizability
Wolfgang Demtroder. Molecular Physics. Theoretical Principles and Experimental Methods WILEY- VCH. WILEY-VCH Verlag GmbH & Co.
 Wolfgang Demtroder Molecular Physics Theoretical Principles and Experimental Methods WILEY- VCH WILEY-VCH Verlag GmbH & Co. KGaA v Preface xiii 1 Introduction 1 1.1 Short Historical Overview 2 1.2 Molecular
Observing Habitable Environments Light & Radiation
 Homework 1 Due Thurs 1/14 Observing Habitable Environments Light & Radiation Given what we know about the origin of life on Earth, how would you recognize life on another world? Would this require a physical
Radiation in the Earth's Atmosphere. Part 1: Absorption and Emission by Atmospheric Gases
 Radiation in the Earth's Atmosphere Part 1: Absorption and Emission by Atmospheric Gases Electromagnetic Waves Electromagnetic waves are transversal. Electric and magnetic fields are perpendicular. In
Exoplanets Atmospheres. Characterization of planetary atmospheres. Photometry of planetary atmospheres from direct imaging
 Photometry of planetary atmospheres from direct imaging Exoplanets Atmospheres Planets and Astrobiology (2016-2017) G. Vladilo Example: planetary system detected with direct imaging HR 8799 b, c, d (Marois
IR Spectrography - Absorption. Raman Spectrography - Scattering. n 0 n M - Raman n 0 - Rayleigh
 RAMAN SPECTROSCOPY Scattering Mid-IR and NIR require absorption of radiation from a ground level to an excited state, requires matching of radiation from source with difference in energy states. Raman
An Overview of Molecular Opacities
 Experimental Molecular Spectroscopy & Data Compilations An Overview of Molecular Opacities Peter Peter Bernath Old Dominion University Norfolk, VA JWST Spectroscopy: mainly IR and low resolution Spectra
Molecular beam infrared spectroscopy of the HCCCN HCCH and HCN HCCCCH van der Waals complexes
 Molecular beam infrared spectroscopy of the HCCCN HCCH and HCN HCCCCH van der Waals complexes X. Yang, a) R. Z. Pearson, K. K. Lehmann, and G. Scoles Department of Chemistry, Princeton University, Princeton,
JOINT RETRIEVAL OF CO AND VIBRATIONAL TEMPERATURE FROM MIPAS-ENVISAT
 JOINT RETRIEVAL OF CO AND VIBRATIONAL TEMPERATURE FROM MIPAS-ENVISAT Joanne Walker and Anu Dudhia Atmospheric, Oceanic and Planetary Physics, Oxford Universtity, UK ABSTRACT MIPAS is a limb viewing fourier
Vibrational Spectroscopy of Molecules on Surfaces
 Vibrational Spectroscopy of Molecules on Surfaces Edited by John T. Yates, Jr. University of Pittsburgh Pittsburgh, Pennsylvania and Theodore E. Madey National Bureau of Standards Gaithersburg, Maryland
7. Our Solar System. Planetary Orbits to Scale. The Eight Planetary Orbits
 7. Our Solar System Terrestrial & Jovian planets Seven large satellites [moons] Chemical composition of the planets Asteroids & comets The Terrestrial & Jovian Planets Four small terrestrial planets Like
Lecture 2 Interstellar Absorption Lines: Line Radiative Transfer
 Lecture 2 Interstellar Absorption Lines: Line Radiative Transfer 1. Atomic absorption lines 2. Application of radiative transfer to absorption & emission 3. Line broadening & curve of growth 4. Optical/UV
HONOUR SCHOOL OF NATURAL SCIENCE. Final Examination GENERAL PHYSICAL CHEMISTRY I. Answer FIVE out of nine questions
 HONOUR SCHOOL OF NATURAL SCIENCE Final Examination GENERAL PHYSICAL CHEMISTRY I Monday, 12 th June 2000, 9.30 a.m. - 12.30 p.m. Answer FIVE out of nine questions The numbers in square brackets indicate
Near-Infrared Spectroscopy of Nitride Heterostructures EMILY FINAN ADVISOR: DR. OANA MALIS PURDUE UNIVERSITY REU PROGRAM AUGUST 2, 2012
 Near-Infrared Spectroscopy of Nitride Heterostructures EMILY FINAN ADVISOR: DR. OANA MALIS PURDUE UNIVERSITY REU PROGRAM AUGUST 2, 2012 Introduction Experimental Condensed Matter Research Study of large
Chemistry 213 Practical Spectroscopy
 Chemistry 213 Practical Spectroscopy Dave Berg djberg@uvic.ca Elliott 314 A course in determining structure by spectroscopic methods Different types of spectroscopy afford different information about molecules
COMBINED OZONE RETRIEVAL USING THE MICHELSON INTERFEROMETER FOR PASSIVE ATMOSPHERIC SOUNDING (MIPAS) AND THE TROPOSPHERIC EMISSION SPECTROMETER (TES)
 AND THE TROPOSPHERIC EMISSION SPECTROMETER (TES)") COMBINED OZONE RETRIEVAL USING THE MICHELSON INTERFEROMETER FOR PASSIVE ATMOSPHERIC SOUNDING (MIPAS) AND THE TROPOSPHERIC EMISSION SPECTROMETER (TES) Claire Waymark, Anu Dudhia, John Barnett, Fred Taylor,
COMBINED OZONE RETRIEVAL USING THE MICHELSON INTERFEROMETER FOR PASSIVE ATMOSPHERIC SOUNDING (MIPAS) AND THE TROPOSPHERIC EMISSION SPECTROMETER (TES) Claire Waymark, Anu Dudhia, John Barnett, Fred Taylor,