Time-resolved Molecule Counting by Photon Statistics Across the Visible Spectrum
|
|
|
- Allison Blankenship
- 5 years ago
- Views:
Transcription

 CoPS infers the number of independent fluorescent emitters (further referred to as emitter number) by analyzing the occurence of multiple photon detection events")
1 Electronic Supplementary Material (ESI) for Physical Chemistry Chemical Physics. This journal is the Owner Societies 2017 Time-resolved Molecule Counting by Photon Statistics Across the Visible Spectrum K. S. Grußmayer,* ab and D.-P. Herten* a a Physikalisch-Chemisches Institut, Universität Heidelberg, Heidelberg, Germany, b École Polytechnique Fédérale de Lausanne, Laboratoire d Optique Biomédicale, 1015 Lausanne, Switzerland Counting by Photon Statistics (CoPS) CoPS infers the number of independent fluorescent emitters (further referred to as emitter number) by analyzing the occurence of multiple photon detection events (mde) in confocal microscopy. In experiments, the sample typically consists of immobile, single probe molecules that sparsely decorate the surface. After generating an overview scan of the field of view, the photon statistics of each diffraction limited probe molecule is measured with pulsed laser excitation. A time correlated single-photon counting (TCSPC) unit records the individual photon arrival times for each of the four avalanche photodiodes (APDs) (for details on the instrumentation see Experimental and theoretical methods) of a modified Hanbury Brown-Twiss detection scheme. The laser pulses are short compared to the excited state lifetime with relatively long times between excitations, i.e. moderate laser repetition rates. This ensures that only single photons can be detected from a single fluorophore after one laser excitation pulse. The Monte-Carlo simulations mimic the experiments, but do not include simulation of the fluorescence lifetime of the emitters (for details see Experimental and theoretical methods). The photon statistics thus carries information on the number of emitters in the excitation volume. The scheme in Figure S1a) illustrates the counting principle. If one emitter is present in the confocal volume, at most one photon can be detected. A single laser pulse can result in the detection of two or more photons only if two or more emitters are present. The frequency of up to four mdes are reconstructed in data post-processing, as exemplified in Figure S1b for three different emitter numbers N. Figure S1. Counting by Photon Statistics. a) Scheme describing the probability of multiple photon detection events (mde) after excitation with a pulsed laser for a certain number of independent emitters N in the laser focus. b) Expectation values for the relative frequencies for i detection events, i.e. the detection of i photons after a laser pulse, for N = 1, 4 and 24 emitters and four detectors (detection probability p = 0.4%, background detection probability p b = 0.03%) for 10 8 simulated laser pulses. For counting by photon statistics, the full mde probabilities P m (N, p; i) are modeled (see eq S1 and S3-7 and Figure S1b). They depend on the number of emitters N and the average photon detection probability per laser pulse and per emitter (further referred to as detection probability) p of the microscope setup (see Equation S2). In the recursive expression, m denotes the number of detectors (here, m=4) while i is the number of multiple photons detected after one laser pulse. The model accounts for the stochastic processes of excitation, emission and detection of photons including the geometry of the detection path. Background photons in the photon probability distribution are modeled as an additional, fixed low detection probability of p b. It 1
2 is important to note that the model takes into account that at most one photon can be detected by one APD after one laser pulse due to the dead time of the detectors and TCSPC electronics (~100ns). Background detection probabilities are typically estimated for each experiment and excitation laser power using the CoPS algorithm with p b = 0 at the end of a trace when the fluorphores are photobleached. The resulting detection probabilities for estimated N=1 of 5 20 traces are averaged and used as input parameter p b for the analysis. For simulations, the simulated p b is used. The number of emitters N and their detection probability p is estimated by non-linear regression with a Levenberg- Marquardt algorithm of the model P m (N, p; i) to the mde histograms accumulated over the analysis period t acq. Repeated subsampling of a randomly chosen subset of 75% of all laser cycles in the analysis period t acq is used to achieve a more robust estimation. After 100 repetitions, the number of emitters for a single measurement is estimated as the median of the fit results and the error is indicated by the quantiles Q 0.25 and Q Modeling the photon probability distribution i 1 m i m i The photon probability distribution P m is given by P m (N, p;i) = ( m i ) [ ( 1 ( m ) p ) N ( 1 ( m ) p b) k 0 ( i k) ( m k ) P m (N, p;k)] (S1) with N the number of independent fluorescent emitters, p the detection probability (see eq S2), m the number of detectors, i the number of multiple detection events (mde). The detection probability p depends on the photon flux, i.e. the average laser intensity I laser divided by the photon energy hν, the laser repetition frequency f rep, the absorption cross-section σ abs, the fluorescence quantum yield Q f and the overall detection efficiency of the microscope setup η. p = I laser f rep hν σ abs Q f η = ε MB f rep (S2) ε MB The molecular brightness and the detection probability p are related by the laser repetition frequency. The photon probability distributions for the setup used in experiments with four detectors can be expressed explicitly as: P 4 (N, p; i = 0) = (1 p) N (1 p b ) P 4 (N, p; i = 1) = 4( p ) N ( p b) 4(1 p)n (1 p b ) P 4 (N, p; i = 2) = 6( p ) N ( p b) 12 ( p ) N ( p b) + 6(1 p)n (1 p b ) P 4 (N, p; i = 3) = 4( p ) N ( p b) 12 ( p ) N ( p b) + 12 ( p ) N ( p b) 4(1 p)n (1 p b ) (S6) P 4 (N, p; i = 4) = 1 4( p ) N ( p b) + 6 ( p ) N ( p b) 4 ( p ) N ( p b) (1 p)n (1 p b ) (S5) (S3) (S4) (S7) i 1 In fact, the probability to detect i photons per laser cycle for a given emitter number scales with p i : 13 P 4 (N, p;1 i 4)~ (N k) p i for small Np 1 k = 0 (S8) Filter sets and lasers Table S1. Filters and lasers used for experiments. All filters are from AHF Analysetechnik (Tübingen, Germany) and all lasers are from PicoQuant (Berlin, Germany). Experiment Laser and Notch Filter Dichroic Mirror Bandpass Filter Shortpass Filter 640 nm excitation a LDH-P-C-640B, triple notch Dual Line Strahlenteiler ET Bandpass - 2
3 filter 488/532/ zt532/640rpc 685/ nm excitation b fibre coupled, randomly polarized LDH-P-635 with cleanup filter HQ 635/10, dual notch filter 488/635 Dual Line Strahlenteiler z488/633 ET Bandpass 685/ nm excitation c 532nm Pico TA, triple notch filter 488/532/ Strahlenteiler 530dcxr, BrightLine 582/75 694/SP HC Kurzpass- Filter BrightLine 470 nm excitation d LDH-P-C-470 with cleanup filter z473/10, single notch filter zet473nf HC Laser- Strahlenteiler BS R488 Laser- Sperrfilter HQ 530/ nm excitation II e LDH-P-C-470 with cleanup filter z473/10, single notch filter zet473nf HC Laser- Strahlenteiler BS R /SP HC Kurzpass- Filter BrightLine a tetraatto633/647n and DNA hybridization sample with Silicon Rhodamine, b DNA hybridization sample with Atto647N, Atto633, Cy5, Alexa647 and AbberiorStar635 and streptavidin-alexa647, c DNA hybridization sample with Cy3B, Atto565, Atto550, AttoRho6G, Atto532 and Alexa532, d DNA hybridization sample with OregonGreen514, OregonGreen488, Atto488 and Alexa488, e.conjugated polymer poly(3-hexylthiophene). Properties of the DNA probes The properties of the DNA hybridization probes with 635 nm excitation are listed in Grussmayer et al. 1. Table S2. Degree of labeling (DOL) of DNA probes with different fluorophores and 640 nm excitation measured by ensemble absorption spectroscopy and number of probes n measured in single molecule experiments. tetraatto633 tetraatto647n SiR hybridization probe DOL REP 4 or REP 3.8 ± ± ± 0.3 DOL REP n/ # 2.5µW/5µW/10µW/20µW 97/91/152/164 20µW 143 5µW/10µW 157/ 154 Table S3. Degree of labeling (DOL) of DNA hybridization probe with different fluorophores and 532 nm excitation measured by ensemble absorption spectroscopy and number of probes n measured in single molecule experiments. Cy3B Atto550 Atto565 AttoRho6G Alexa532 Atto532 DOL REP 1.84 ± ± ± ± ± ± 0.2 DOL REP n/ # high/low laser power 127/ / / / / - 150/ - Table S4. Degree of labeling (DOL) of DNA hybridization probe with different fluorophores and 470 nm excitation measured by ensemble absorption and number of probes n measured in single molecule experiments. Atto488 Alexa488 OregonGreen488 OregonGreen514 3
4 DOL REP 1.0 ± ± ± ± 0.2 DOL REP ± n/ # Table S5. Fluorescence properties and brightness comparison of fluorophores with 635 nm/640 nm laser excitation. Table S1 of Grussmayer et al. 1 modified. Atto647N Atto633 Cy5 Alexa647 AbberiorStar635 SiR λ abs / nm λ em / nm ε max /10 5 M -1 cm ,0 ε 635 nm /10 5 M -1 cm Q f > B = ε 635 nm Q f /10 5 M -1 cm > Table S6. Fluorescence properties and brightness comparison of fluorophores with 532 nm laser excitation. Cy3B Atto550 Atto565 AttoRho6G Alexa532 Atto532 λ abs / nm λ em / nm ε max /10 5 M -1 cm ε 635 nm /10 5 M -1 cm Q f > B = ε 635 nm Q f /10 5 M -1 cm -1 > Table S7. Fluorescence properties and brightness comparison of fluorophores with 470 nm laser excitation. Atto488 Alexa488 OregonGreen488 (6- OregonGreen514 Isomer) λ abs / nm λ em / nm ε max /10 5 M -1 cm ε 635 nm /10 5 M -1 cm Q f B = ε 635 nm Q f /10 5 M -1 cm
 and experiments with the tetraatto633 probe at 10 μw laser excitation power at 640 nm and a laser repetition rate of 20 MHz (dark grey).")
 Comparison of the probability for mde from data with 10 8 simulated laser pulses (symbols indicate the median of 200 simulated traces with the lower and upper quartiles as error bars; the error is")

5 Figure S2. Comparison of experiments with simulation. Graphs display the intensity over time and the intensity histogram along with its quantiles (median(q 0.25,Q 0.75 )). Simulation with N = 4, p = 0.4% and p b = 0.03% (light grey) and experiments with the tetraatto633 probe at 10 μw laser excitation power at 640 nm and a laser repetition rate of 20 MHz (dark grey). Experimental traces with higher (a)) and comparable (b)) intensity fluctuation than the simulated trace. Figure S3. Verification of simulations. a) Comparison of the probability for mde from data with 10 8 simulated laser pulses (symbols indicate the median of 200 simulated traces with the lower and upper quartiles as error bars; the error is very small and cannot be seen) and of the CoPS model supplied with simulation parameters detection probability p = 0.4%, background detection probability p b = 0.03% (lines). Black left-pointing triangles i = 0, blue crosses i = 1, red right-pointing triangles i = 2, green asterisks i = 3, magenta downward-pointing triangle i = 4. b) Comparison of the average photostability times τ ph (black crosses) estimated by fitting the sum of 200 simulated intensity traces with a monoexponential decay and the simulated τ ph parameters. The red line indicates the true, simulated photostability times. 5
 and determined by a deviation")

6 Figure S4. Comparison of minimum analysis period determined by different criteria. Minimum analysis period shown for varying simulated detection probability determined by the relative deviation from the maximum obtained emitter number estimate (black) and determined by a deviation of 5% or less from the simulated emitter number (grey). The error bars are derived by varying the threshold to determine the minimum analysis period to 90% and 95% of the maximum moving average, respectively. Figure S5. Comparison of minimum analysis period for simulations and photon statistics analysis with N = 4 emitters and N = 16 emitters. a) Median of estimated emitter numbers for CoPS analysis with varying analysis period in blue/orange/magenta for simulated N = 16, p = (10/2/1)x10-3 and p b = (6/2/1)x10-4. The blue/orange/magenta line is the three point moving average of emitter number estimates and the plateau of valid CoPS estimates is shaded in dark grey/light grey. The red line indicates the simulated emitter number N = 16. b) Minimum analysis period for simulated detection probability p = (10/9/8/7/6/5/4/3/2/1/0.75/0.5)x10-3 and p b = (6/5.5/5/4.5/4/3.5/3/2.5/2/1/0.75/0.5)x10-4 for N = 4 (black) and N = 16 (grey). 6
 N = 4/16/50, p = 4x10⁻³ and p b = 3x10⁻⁴, b) N = 4/16/50, p = 2x10⁻³ and p b")
7 Figure S6. Comparison of minimum analysis period for simulations and photon statistics analysis with N = 1, 2, 4, 50 emitters and different detection probabilities. Median of estimated emitter numbers for CoPS analysis with varying analysis period in blue/orange/magenta for simulated a) N = 4/16/50, p = 4x10⁻³ and p b = 3x10⁻⁴, b) N = 4/16/50, p = 2x10⁻³ and p b = 2x10⁻⁴, c) N = 4/16/28, p = and p b = 1x10⁻⁴. The blue/orange/magenta line is the three point moving average of emitter number estimates and the plateau of valid CoPS estimates is shaded in dark grey/light grey. The red line indicates the normalized simulated emitter number. d) Minimum analysis period for simulated detection probability p = (4/2/1)x10-3 (black/dark grey/light grey). Connecting the minimum photostability with Fluorophore brightness For simplicity, we assume that the timepoints of fluorophore photobleaching are distributed according to a monoexponential probability distribution function pdf(t, τ ph ) given in eq S9. The probability for fluorophores to photobleach in a certain timespan Δt is then given by the cumulative distribution function cdf(δt, τ ph ) (see eq S10). In turn, the probability for fluorophores to still be fluorescent after Δt is P ph (Δt, τ ph ) = 1 - cdf(δt, τ ph ) (see eq S11). Photobleaching of a pure N-mer leads to a distribution of label numbers k that can be described by a binomial distribution with fluorescence success probability P ph (Δt, τ ph ). The average of the binomial distribution is NP ph, thus the fraction of molecules that are still fluorescent after a certain analysis period t acq is given by eq S12 and this fraction of surviving fluorophores is plotted in Figure S7 for typical parameters. pdf(t; τ ph ) = 1 t τ e ph τ ph Δt Δt (S9) τ cdf(δt; τ ph ) = pdf(t; τ ph )dt = 1 e ph 0 (S10) Δt τ ph P ph (Δt; τ ph ) = 1 cdf(δt; τ ph ) = e F surv (t acq,τ ph ) = k (t acq,τ ph ) = P N ph (t acq ; τ ph ) = e t acq τ ph (S11) (S12) 7
, F surv ) = t acq,min (p) ln(f surv ) (S13) Figure S7.")
 Same as a).")
8 We can now estimate the minimum required photostability necessary to retain a certain fraction of surviving molecules for fluorophores of a particular brightness by using the minimum analysis period that delivers valid CoPS estimates determined by simulations with different detection probabilities as a starting point: τ ph,min (t acq,min (p), F surv ) = t acq,min (p) ln(f surv ) (S13) Figure S7. Modeling the fraction of surviving fluorophores. a) Fraction of remaining fluorescent labels for certain analysis periods with varying average photostability time. t acq = 25/50/125 /250/375/500 ms from dark grey to light grey. The dotted red line indicates the fraction of remaining fluorescence for τ ph = 0.5 s and τ ph = 3 s. b) Same as a). The dotted red lines indicates the average photobleaching time τ ph corresponding to 95% remaining fluorescence for the set of curves. Figure S8. Experiments and photon statistics analysis with tetraprobes and varying laser excitation power. a) Precision of estimated emitter numbers for CoPS analysis with varying analysis period in magenta/blue for tetraatto633 with 2.5 μw/20 μw laser excitation power and in orange for tetraatto647n with 20 μw at 640 nm and a repetition rate of 20 MHz. The blue/orange/magenta line is the three point moving average. B) Comparison of minimum analysis periods for varying detection probability in simulations (black) with minimum analysis periods in experiments. TetraAtto633 measurements with 2.5 μw/5 µw/10 µw and 20 μw (grey) and tetraatto647n measurements (light blue) with 20 μw laser excitation power at 640nm and a repetition rate of 20 MHz. The error bars are derived by varying the threshold to determine the minimum analysis period to 90% and 95% of the maximum moving average, respectively. 8
 for the number of simulated emitters (grey bars) together with the average")
/b)/c)/d). Additional simulation parameters: detection probability p = 0.")

 and the PDF of a Gaussian (red line) supplied with the simulation parameters μ p, sim = 0.")
9 Figure S9. Exemplary verification of simulations with variable number of emitters. Probability distribution functions (PDF) for the number of simulated emitters (grey bars) together with the average (standard deviation) and the PDF of a Gaussian (red line) supplied with the simulation parameters μ N, sim = 4.0 and σ N, sim = 0.5/1.0/1.5/2.0 in a)/b)/c)/d). Additional simulation parameters: detection probability p = 0.4%, background detection probability p b = 0.03% and 400 simulated traces. Figure S10. Exemplary verification of simulations with variable detection probability. Probability distribution functions (PDF) for the simulated detection probability (grey bars) together with the average (standard deviation) and the PDF of a Gaussian (red line) supplied with the simulation parameters μ p, sim = 0.4% and σ p, sim = (0.02//0.08/0.14/0.2)% in a)/b)/c)/d). Additional simulation parameters: emitter number N = 4, background detection probability p b = 0.03% and 200 simulated traces. 9
 and estimated emitter number precision (bottom) for t acq = 500 ms relative to the mean of the simulated emitter numbers as a function of increasing σ N, sim")

10 Figure S11. Simulations with variable number of emitters. Simulated mean emitter number a) μ N, sim = 4.0 and b) μ N, sim = 16.0 with increasing variability. Median estimated emitter number (top) and estimated emitter number precision (bottom) for t acq = 500 ms relative to the mean of the simulated emitter numbers as a function of increasing σ N, sim relative to μ N, sim. The red line indicates the target relative emitter number (top) and the bisecting line (bottom). Additional simulation parameters: detection probability p = 0.4%, background detection probability p b = 0.03% and 400 simulated traces. Figure S12. Simulations with variable photon detection probability. Simulated emitter number a) N = 4 and b) N = 16 with increasing variability of the detection probability. Median estimated emitter number (top) and estimated emitter number precision (bottom) for t acq = 500 ms relative to the mean of the simulated emitter numbers as a function of increasing σ p, sim relative to μ p, sim. The red line indicates the target relative emitter number (top). Additional simulation parameters: detection probability μ p, sim = 0.4%, background detection probability p b = 0.03% and 200 simulated traces. 10
 of 500 ms. CoPS estimates correlate with intensity bleaching steps.")
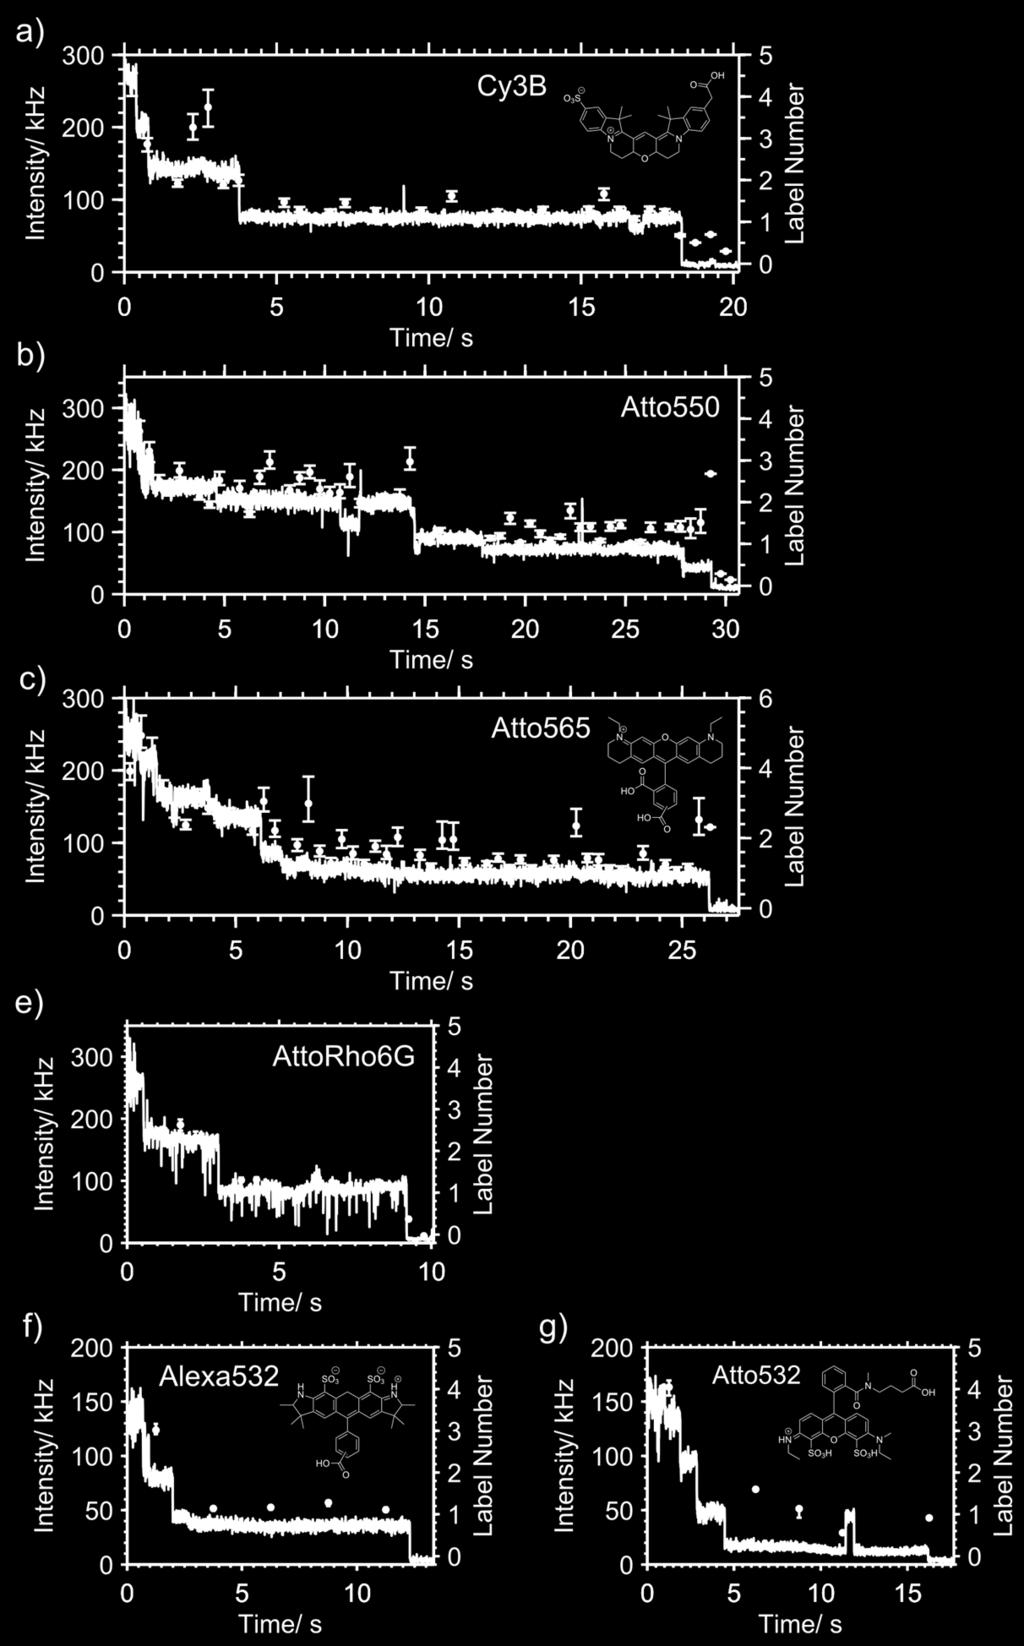
11 Photostability and control of photophysics for DNA hybridization probes Figure S13. Single molecule CoPS analysis of DNA hybridization probe labeled with SiR. 10 μw laser excitation power at 640 nm and a repetition rate of 20 MHz. Time resolution (= analysis period t acq ) of 500 ms. CoPS estimates correlate with intensity bleaching steps. Label number estimates with error bars derived from resampling algorithm (black), intensity (grey). All buffers achieved photostabilization compared to imaging of the dyes in PBS (TIRF and confocal experiments, data not shown). Atto647N, Atto633, Cy5, Alexa647 and AbberiorStar635 from 1, SiR, Cy3B and Alexa532 were nicely stabilized except for rare, long off-times (seconds timescale). Atto550 and Atto565 displayed almost no fast blinking (millisecond off-time), but frequently entered a dimmer fluorescent states with time, which rendered identification of photobleaching steps difficult. For AttoRho6G fast blinking was not completely prevented, but the dye showed no other fluctuations in fluorescence intensity. Atto532 often presented residual, dim fluorescence at the end of intensity traces. For the dyes that were excited with a 470 nm laser, photobleaching was prominent. Figure S14 (following page). Single molecule CoPS analysis of DNA hybridization probe with dyes that are excited with a 532 nm laser. a) Cy3B, b) Atto550, c) Atto565, d) AttoRho6G, e) Alexa532 and f) Atto532 with e), f) 6 μw, a), d) 12 μw and b), c) 24 μw laser excitation power at 532 nm and a repetition rate of 20 MHz. Time resolution (= analysis period t acq ) of 500 ms for a) d) and 2.5 s for e) and f). CoPS estimates correlate with intensity bleaching steps. Label number estimates with error bars derived from resampling algorithm (black), intensity (black). 11
12 12
 of 125 ms. CoPS estimates correlate with intensity bleaching steps.")

13 Figure S15. Single molecule CoPS analysis of DNA hybridization probe labeled with dyes that are excited with a 470 nm laser. a) Atto488, b) Alexa488, c) OregonGreen488 and d) OregonGreen514 at 6.75 μw laser excitation power at 470 nm and a repetition rate of 20 MHz. Time resolution (= analysis period t acq ) of 125 ms. CoPS estimates correlate with intensity bleaching steps. Traces are not representative; most dyes photobleached faster. Label number estimates with error bars derived from resampling algorithm (black), intensity (grey). Figure S16. Single molecule CoPS analysis of DNA hybridization probe labeled with dyes that are excited with a 532 nm laser. Black crosses/ light grey downward-pointing triangles: low and high laser excitation power (6μW and 12μW for Cy3B, AttoRho6G, Alexa532 and Atto532, 12μW and 24μW for Atto550 and Atto565) at 532nm and a repetition rate of 20 MHz. a) Estimated detection probabilities (median with Q 0.25 and Q 0.75 ) for CoPS analysis with t acq = 500 ms for low and t acq = 125 ms for high laser excitation power. b) Average photostability lifetime τ ph estimated by fitting a single-exponential decay to photostability time histograms derived from fluorescent traces. Errors indicate the 95% confidence intervals of the fit parameter τ ph. 13
, emitter number (black dots) and detection probability (dark grey downward-pointing triangles) estimates with 500 ms time resolution and errors determined by")
14 Figure S17. Time-resolved photon statistics analysis of photophysical dynamics in proteins and conjugated polymers. Fluorescence intensity (light grey), emitter number (black dots) and detection probability (dark grey downward-pointing triangles) estimates with 500 ms time resolution and errors determined by resampling. Labeled streptavidin-alexa647 with a step in the intensity transient due to a) photobleaching of one emitter or b) changing brightness of one emitter. Experimental conditions were 5μW laser excitation power at 635 nm and a repetition rate of 20 MHz. c) Changing number of independent emitters in a single, 55 kda poly(3-hexylthiophene) (P3HT) chain in Zeonex due to temporary quenching by deep charge trap states at about 45s followed by photodestruction 2 after about 80s. Experimental conditions were 2 μw laser excitation power at 470 nm and a repetition rate of 20 MHz. References 1 K. S. Grußmayer, A. Kurz and D.-P. Herten, ChemPhysChem, 2014, 15, K. S. Grußmayer, F. Steiner, J. M. Lupton, D.-P. Herten and J. Vogelsang, ChemPhysChem, 2015, 16,
Confocal Microscopy Imaging of Single Emitter Fluorescence and Hanbury Brown and Twiss Photon Antibunching Setup
 1 Confocal Microscopy Imaging of Single Emitter Fluorescence and Hanbury Brown and Twiss Photon Antibunching Setup Abstract Jacob Begis The purpose of this lab was to prove that a source of light can be
Ultrafast Dynamics and Single Particle Spectroscopy of Au-CdSe Nanorods
 Supporting Information Ultrafast Dynamics and Single Particle Spectroscopy of Au-CdSe Nanorods G. Sagarzazu a, K. Inoue b, M. Saruyama b, M. Sakamoto b, T. Teranishi b, S. Masuo a and N. Tamai a a Department
Detection of Single Photon Emission by Hanbury-Brown Twiss Interferometry
 Detection of Single Photon Emission by Hanbury-Brown Twiss Interferometry Greg Howland and Steven Bloch May 11, 009 Abstract We prepare a solution of nano-diamond particles on a glass microscope slide
Supplementary Figures Supplementary Figure 1: Estimation of the error of the number and brightness of molecules in a single cluster; Simulation
 Supplementary Figures Supplementary Figure 1: Estimation of the error of the number and brightness of molecules in a single cluster; Simulation (a,c) Relative estimated numbers of molecules ; (b,d) relative
Supplementary Figures
 Supplementary Figures Supplementary Figure. X-ray diffraction pattern of CH 3 NH 3 PbI 3 film. Strong reflections of the () family of planes is characteristics of the preferred orientation of the perovskite
Laboratory 3&4: Confocal Microscopy Imaging of Single-Emitter Fluorescence and Hanbury Brown and Twiss setup for Photon Antibunching
 Laboratory 3&4: Confocal Microscopy Imaging of Single-Emitter Fluorescence and Hanbury Brown and Twiss setup for Photon Antibunching Jose Alejandro Graniel Institute of Optics University of Rochester,
Laboratory 3: Confocal Microscopy Imaging of Single Emitter Fluorescence and Hanbury Brown, and Twiss Setup for Photon Antibunching
 Laboratory 3: Confocal Microscopy Imaging of Single Emitter Fluorescence and Hanbury Brown, and Twiss Setup for Photon Antibunching Jonathan Papa 1, * 1 Institute of Optics University of Rochester, Rochester,
LABORATORY OF ELEMENTARY BIOPHYSICS
 LABORATORY OF ELEMENTARY BIOPHYSICS Experimental exercises for III year of the First cycle studies Field: Applications of physics in biology and medicine Specialization: Molecular Biophysics Fluorescence
Supplemental Materials and Methods
 Supplemental Materials and Methods Time-resolved FRET (trfret) to probe for changes in the Box A/A stem upon complex assembly U3 MINI was folded and the decay of Fl fluorescence was measured at 20 ºC (see
LAB 3: Confocal Microscope Imaging of single-emitter fluorescence. LAB 4: Hanbury Brown and Twiss setup. Photon antibunching. Roshita Ramkhalawon
 LAB 3: Confocal Microscope Imaging of single-emitter fluorescence LAB 4: Hanbury Brown and Twiss setup. Photon antibunching Roshita Ramkhalawon PHY 434 Department of Physics & Astronomy University of Rochester
BMB Class 17, November 30, Single Molecule Biophysics (II)
") BMB 178 2018 Class 17, November 30, 2018 15. Single Molecule Biophysics (II) New Advances in Single Molecule Techniques Atomic Force Microscopy Single Molecule Manipulation - optical traps and tweezers
BMB 178 2018 Class 17, November 30, 2018 15. Single Molecule Biophysics (II) New Advances in Single Molecule Techniques Atomic Force Microscopy Single Molecule Manipulation - optical traps and tweezers
Anti-Bunching from a Quantum Dot
 Anti-Bunching from a Quantum Dot Gerardo I. Viza 1, 1 Department of Physics and Astronomy, University of Rochester, Rochester, NY 14627 We study the nature of non-classical single emitter light experimentally
Increasing your confidence Proving that data is single molecule. Chem 184 Lecture David Altman 5/27/08
 Increasing your confidence Proving that data is single molecule Chem 184 Lecture David Altman 5/27/08 Brief discussion/review of single molecule fluorescence Statistical analysis of your fluorescence data
Supplementary Materials
 Supplementary Materials Sample characterization The presence of Si-QDs is established by Transmission Electron Microscopy (TEM), by which the average QD diameter of d QD 2.2 ± 0.5 nm has been determined
Lab 3 and 4: Single Photon Source
 Lab 3 and 4: Single Photon Source By: Justin Deuro, December 10 th, 2009 Abstract We study methods of single photon emission by exciting single colloidal quantum dot (QD) samples. We prepare the single
Differentiation between shallow and deep charge trap states on single poly(3-hexylthiophene) chains through fluorescence photon statistics
 chains through fluorescence photon statistics") Differentiation between shallow and deep charge trap states on single poly(3-hexylthiophene) chains through fluorescence photon statistics Kristin S. Grußmayer, Florian Steiner, John M. Lupton, Dirk-Peter
Differentiation between shallow and deep charge trap states on single poly(3-hexylthiophene) chains through fluorescence photon statistics Kristin S. Grußmayer, Florian Steiner, John M. Lupton, Dirk-Peter
Single-Molecule Methods I - in vitro
 Single-Molecule Methods I - in vitro Bo Huang Macromolecules 2014.03.10 F 1 -ATPase: a case study Membrane ADP ATP Rotation of the axle when hydrolyzing ATP Kinosita group, 1997-2005 Single Molecule Methods
This document contains the following supporting information: 1. Wide field scanning electron microscope image
 Supporting information for Self-assembled nanoparticle dimer antennas for plasmonic-enhanced single-molecule fluorescence detection at micromolar concentrations Deep Punj, Raju Regmi, Alexis Devilez, Robin
Lab 3-4 : Confocal Microscope Imaging of Single-Emitter Fluorescence and Hanbury-Brown and Twiss Set Up, Photon Antibunching
 Lab 3-4 : Confocal Microscope Imaging of Single-Emitter Fluorescence and Hanbury-Brown and Twiss Set Up, Photon Antibunching Mongkol Moongweluwan 1 1 Department of Physics and Astronomy, University of
Confocal Microscope Imaging of Single-Emitter Fluorescence and Photon Antibunching
 Confocal Microscope Imaging of Single-Emitter Fluorescence and Photon Antibunching By Dilyana Mihaylova Abstract The purpose of this lab is to study different types of single emitters including quantum
Quantum Optics and Quantum Information Laboratory
 Quantum Optics and Quantum Information Laboratory OPT 253, Fall 2011 Institute of Optics University of Rochester Instructor: Dr. Lukishova Jonathan Papa Contents Lab 1: Entanglement and Bell s Inequalities
3. Excitation and Detection of Fluorescence
 3. Excitation and Detection of Fluorescence In this chapter, we examine key experimental components and methods to observe weakly fluorescing objects. We consider in turn the excitation source, the detectors,
Quantitative fluorescence correlation spectroscopy in three-dimensional systems under stimulated emission depletion conditions: supplementary material
 Quantitative fluorescence correlation spectroscopy in three-dimensional systems under stimulated emission depletion conditions: supplementary material KRZYSZTOF SOZANSKI 1,*, EVANGELOS SISAMAKIS 2, XUZHU
Confocal Microscope Imaging of Single emitter fluorescence and Observing Photon Antibunching Using Hanbury Brown and Twiss setup. Lab.
 Submitted for the partial fulfilment of the course PHY 434 Confocal Microscope Imaging of Single emitter fluorescence and Observing Photon Antibunching Using Hanbury Brown and Twiss setup Lab. 3 and 4
Enhancement of Exciton Transport in Porphyrin. Aggregate Nanostructures by Controlling. Hierarchical Self-Assembly
 Electronic Supplementary Material (ESI) for Nanoscale. This journal is The Royal Society of Chemistry 2018 Supporting Information for Enhancement of Exciton Transport in Porphyrin Aggregate Nanostructures
Quantum and Nano Optics Laboratory. Jacob Begis Lab partners: Josh Rose, Edward Pei
 Quantum and Nano Optics Laboratory Jacob Begis Lab partners: Josh Rose, Edward Pei Experiments to be Discussed Lab 1: Entanglement and Bell s Inequalities Lab 2: Single Photon Interference Labs 3 and 4:
Supplementary Information
 Supplementary Information Single molecule FRET reveals the energy landscape of the full length SAM I riboswitch Christoph Manz, 1,2 Andrei Yu. Kobitski, 1 Ayan Samanta, 3 Bettina G. Keller 4, Andres Jäschke,
Lab Experimental observation of singleemitter fluorescence and photon anti-bunching
 Lab. 3-4. Experimental observation of singleemitter fluorescence and photon anti-bunching Laboratory Report Group, Fall 6 Abstract: Fluorescence from single emitters, such as DiDye molecules and CdSe quantum
Supporting Information
 Supporting Information Wiley-VCH 2014 69451 Weinheim, Germany Geminate Recombination as a Photoprotection Mechanism for Fluorescent Dyes** Phil Holzmeister, Andreas Gietl, and Philip Tinnefeld* anie_201310300_sm_miscellaneous_information.pdf
SUPPLEMENTARY INFORMATION
 DOI: 10.1038/ncb2215 Figure S1 Number of egfp-vps4a bursts versus cellular expression levels. The total number of egfp-vps4a bursts, counted at the end of each movie (frame 2000, after 1h 28 min) are plotted
FROM LOCALIZATION TO INTERACTION
 EPFL SV PTBIOP FROM LOCALIZATION TO INTERACTION BIOP COURSE 2015 COLOCALIZATION TYPICAL EXAMPLE EPFL SV PTBIOP Vinculin Alexa568 Actin Alexa488 http://www.olympusconfocal.com/applications/colocalization.html
1. Transition dipole moment
 1. Transition dipole moment You have measured absorption spectra of aqueous (n=1.33) solutions of two different chromophores (A and B). The concentrations of the solutions were the same. The absorption
single-molecule fluorescence resonance energy transfer
 single-molecule fluorescence resonance energy transfer (2) determing the Förster radius: quantum yield, donor lifetime, spectral overlap, anisotropy michael börsch 26/05/2004 1 fluorescence (1) absorbance
Diagnostics of Filamentation in Laser Materials with Fluorescent Methods
 Diagnostics of Filamentation in Laser Materials with Fluorescent Methods A.V. Kuznetsov, E.F. Martynovich Irkutsk Branch of Institute of Laser Physics SB RAS Lermontov st. 130a, Irkutsk, 664033, Russia
Γ43 γ. Pump Γ31 Γ32 Γ42 Γ41
 Supplementary Figure γ 4 Δ+δe Γ34 Γ43 γ 3 Δ Ω3,4 Pump Ω3,4, Ω3 Γ3 Γ3 Γ4 Γ4 Γ Γ Supplementary Figure Schematic picture of theoretical model: The picture shows a schematic representation of the theoretical
Supplementary Figure 1 Comparison of single quantum emitters on two type of substrates:
 Supplementary Figure 1 Comparison of single quantum emitters on two type of substrates: a, Photoluminescence (PL) spectrum of localized excitons in a WSe 2 monolayer, exfoliated onto a SiO 2 /Si substrate
I. Proteomics by Mass Spectrometry 1. What is an internal standard and what does it accomplish analytically?
 Name I. Proteomics by Mass Spectrometry 1. What is an internal standard and what does it accomplish analytically? Internal standards are standards added intentionally to all samples, standards and blanks.
Electronic Supplementary Information
 Electronic Supplementary Material (ESI) for Journal of Materials Chemistry C. This journal is The Royal Society of Chemistry 2017 Electronic Supplementary Information Polymorphism and microcrystal shape
1 Instrument response function
 Electronic Supplementary Material ESI) for Lab on a Chip. This journal is The Royal Society of Chemistry 214 High-throughput Time-Correlated Single Photon Counting Supplementary Information Jérémie Léonard,
Sharper low power STED nanoscopy by time gating
 Nature Methods Sharper low power nanoscopy by time gating G. Vicidomini,3, G. Moneron,3, K. Y. Han,3, V. Westphal, H. Ta, M. Reuss, J. Engelhardt, C. Eggeling, S. W. Hell, Max Planc nstitute for Biophysical
Quantum Optics and Quantum Information Laboratory Review
 Quantum Optics and Quantum Information Laboratory Review Fall 2010 University of Rochester Instructor: Dr. Lukishova Joshua S. Geller Outline Lab 1: Entanglement and Bell s Inequalities Lab 2: Single Photon
Manipulating and Probing Enzymatic Conformational Fluctuations and Enzyme-Substrate Interactions by Single-Molecule FRET- Magnetic Tweezers Microscopy
 Electronic Supplementary Material (ESI) for Physical Chemistry Chemical Physics. This journal is the Owner Societies 2014 Supporting Information (SI) Manipulating and Probing Enzymatic Conformational Fluctuations
Optics and Spectroscopy
 Introduction to Optics and Spectroscopy beyond the diffraction limit Chi Chen 陳祺 Research Center for Applied Science, Academia Sinica 2015Apr09 1 Light and Optics 2 Light as Wave Application 3 Electromagnetic
Modular scanning FCS quantifies receptor-ligand interactions in living multicellular organisms
 nature methods Modular scanning FCS quantifies receptor-ligand interactions in living multicellular organisms Jonas Ries, Shuizi Rachel Yu, Markus Burkhardt, Michael Brand & Petra Schwille Supplementary
χ (3) Microscopic Techniques
 Microscopic Techniques") χ (3) Microscopic Techniques Quan Wang Optical Science and Engineering University of New Mexico Albuquerque, NM 87131 Microscopic techniques that utilize the third order non-linearality (χ (3) ) of the
χ (3) Microscopic Techniques Quan Wang Optical Science and Engineering University of New Mexico Albuquerque, NM 87131 Microscopic techniques that utilize the third order non-linearality (χ (3) ) of the
Administrative details:
 Administrative details: Anything from your side? www.photonics.ethz.ch 1 Where do we stand? Optical imaging: Focusing by a lens Angular spectrum Paraxial approximation Gaussian beams Method of stationary
FLUORESCENCE MICROSCOPY TECHNIQUES PRACTICAL MANUAL FOR
 FLUORESCENCE PRACTICAL MANUAL FOR MICROSCOPY TECHNIQUES Sohail Ahmed Sudhaharan Thankiah Radek Machán Martin Hof Andrew H. A. Clayton Graham Wright Jean-Baptiste Sibarita Thomas Korte Andreas Herrmann
Lab3-4: Single Photon Source
 Lab3-4: Single Photon Source Xiaoshu Chen* Department of Mechanical Engineering, University of ochester, NY, 1463 ABSAC n this lab, we studied the quantum dot excitation method of single photon source.
Single Molecule Spectroscopy and Imaging
 Single Molecule Spectroscopy and Imaging Ingo Gregor, Thomas Dertinger, Iris von der Hocht, Jan Sykora, Luru Dai, Jörg Enderlein Institute for Biological Information Processing 1 Forschungszentrum Jülich
Self-calibrated, line-scan STED-FCS to quantify lipid dynamics in model and cell membranes
 Self-calibrated, line-scan STED-FCS to quantify lipid dynamics in model and cell membranes Aleš Benda, Yuanqing Ma and Katharina Gaus Centre for Vascular Research, Australian Centre for Nanomedicine and
Fluorescence Resonance Energy Transfer (FRET) Microscopy
 Microscopy") Fluorescence Resonance Energy Transfer () Microscopy Mike Lorenz Optical Technology Development mlorenz@mpi-cbg.de -FLM course, May 2009 What is fluorescence? Stoke s shift Fluorescence light is always
Fluorescence Resonance Energy Transfer () Microscopy Mike Lorenz Optical Technology Development mlorenz@mpi-cbg.de -FLM course, May 2009 What is fluorescence? Stoke s shift Fluorescence light is always
SUPPLEMENTARY INFORMATION
 SUPPLEMENTARY INFORMATION DOI: 10.1038/NNANO.2015.242 1 Quantum emission from hexagonal boron nitride monolayers Toan Trong Tran, Kerem Bray, Michael J. Ford, Milos Toth, and Igor Aharonovich 1. Materials
Labs 3-4: Single-photon Source
 Labs 3-4: Single-photon Source Lab. 3. Confocal fluorescence microscopy of single-emitter Lab. 4. Hanbury Brown and Twiss setup. Fluorescence antibunching 1 Labs 3-4: Single-photon Source Efficiently produces
Lab 1 Entanglement and Bell s Inequalities
 Quantum Optics Lab Review Justin Winkler Lab 1 Entanglement and Bell s Inequalities Entanglement Wave-functions are non-separable Measurement of state of one particle alters the state of the other particle
Measurement Examples. Excitation and Emission Scans. Steady State Fluorescence Anisotropy. Kinetic Measurements
 Measurement Examples A division of Edinburgh Instruments Ltd. Excitation and Emission Scans Excitation and emission spectra are standard measurements in fluorescence spectroscopy. The figure demonstrates
Room temperature phosphorescence vs thermally activated delayed fluorescence in carbazole pyrimidine cored compounds
 Electronic Supplementary Material (ESI) for Journal of Materials Chemistry C. This journal is The Royal Society of Chemistry 2018 Electronic Supplementary Information Room temperature phosphorescence vs
Determining the orientation of the emissive dipole moment associated with dye molecules in microcavity structures
 journal of modern optics, 15 october 2004 vol. 51, no. 15, 2287 2295 Determining the orientation of the emissive dipole moment associated with dye molecules in microcavity structures S. H. GARRETT, J.
Rice/TCU REU on Computational Neuroscience. Fundamentals of Molecular Imaging
 Rice/TCU REU on Computational Neuroscience Fundamentals of Molecular Imaging June 3, 2008 Neal Waxham 713-500-5621 m.n.waxham@uth.tmc.edu Objectives Brief discussion of optical resolution and lasers as
Single Emitter Detection with Fluorescence and Extinction Spectroscopy
 Single Emitter Detection with Fluorescence and Extinction Spectroscopy Michael Krall Elements of Nanophotonics Associated Seminar Recent Progress in Nanooptics & Photonics May 07, 2009 Outline Single molecule
Optical Properties of CdSe Colloidal Quantum Dots and NV-Nanodiamonds
 Optical Properties of CdSe Colloidal Quantum Dots and NV-Nanodiamonds James MacNeil and Madhu Ashok University of Rochester The Institute of Optics Submitted to Dr. Svetlana Lukishova on 11/20/2013 Abstract:
Single Photon Generation & Application in Quantum Cryptography
 Single Photon Generation & Application in Quantum Cryptography Single Photon Sources Photon Cascades Quantum Cryptography Single Photon Sources Methods to Generate Single Photons on Demand Spontaneous
University of Groningen
 University of Groningen Enzymatic Control of the Size of DNA Block Copolymer Nanoparticles Alemdaroglu, Fikri E.; Wang, Jie; Börsch, Michael; Berger, Rüdiger; Herrmann, Andreas Published in: Angewandte
Selected measurements with FluoTime 300
 Selected measurements with FluoTime 300 Sebastian Tannert, Peter Kapusta, Felix Koberling, Manoel Veiga, Steffen Rüttinger Uwe Ortmann, Matthias Patting, Marcus Sackrow, Michael Wahl, Rainer Erdmann 12th
Joshua S. Geller. Department of Physics and Astronomy, University of Rochester, Rochester NY, 14627
 LAB 3-4, PHY434. Single Photon Source: Confocal Microscope Imaging of Single-Emitter Fluorescence and Hanbury Brown and Twiss setup for Photon Antibunching Measurements Joshua S. Geller Department of Physics
INVESTIGATION OF PHOTOPHYSICAL AND PHOTOCHEMICAL PROCESSES IN CONJUGATED POLYMER NANOPARTICLES BY SINGLE PARTICLE AND ENSEMBLE SPECTROSCOPY
 Clemson University TigerPrints All Dissertations Dissertations 5-2009 INVESTIGATION OF PHOTOPHYSICAL AND PHOTOCHEMICAL PROCESSES IN CONJUGATED POLYMER NANOPARTICLES BY SINGLE PARTICLE AND ENSEMBLE SPECTROSCOPY
PHOTOLUMINESCENCE SPECTRA AND QUANTUM YIELDS OF GOLD NANOSPHERE MONOMERS AND DIMERS IN AQUEOUS SUSPENSION
 Electronic Supplementary Material (ESI) for Physical Chemistry Chemical Physics. This journal is the Owner Societies 2016 ELECTRONIC SUPPLEMENTARY INFORMATION FOR PHOTOLUMINESCENCE SPECTRA AND QUANTUM
Using Alba with the FemtoFiber laser by Toptica for 2-photon quantitative imaging
 TECHNICAL NOTE Using Alba with the FemtoFiber laser by Toptica for 2-photon quantitative imaging Shih-Chu Liao, Yuansheng Sun, Ulas Coskun ISS, Inc. Introduction The advantages of multiphoton excitation
D \ Basis for Detection. Rapid DNA SequencinglSingle-Molecule Spectroscopy. Steven A. Soper, Lloyd A.!?.Davis, and E. Brooks Shera
 Rapid DNA SequencinglSingle-Molecule Spectroscopy Steven A Soper, Lloyd A!?Davis, and E Brooks Shera D \,,, ) ~ etecting minute concentrations of chemicals in liquid environments has many applications
B.J.C.M. van Gils. Optical Techniques Group Applied Physics Department of Science and Technology University of Twente
 Towards quantum dot luminescence enhancement An investigation of radiative properties of single quantum dots in close proximity to a nanosize metal object B.J.C.M. van Gils Optical Techniques Group Applied
Supplementary Information: Three-dimensional quantum photonic elements based on single nitrogen vacancy-centres in laser-written microstructures
 Supplementary Information: Three-dimensional quantum photonic elements based on single nitrogen vacancy-centres in laser-written microstructures Andreas W. Schell, 1, a) Johannes Kaschke, 2 Joachim Fischer,
Single Photon Sources
 Single Photon Sources Graham Jensen and Samantha To University of Rochester, Rochester, New York Abstract Graham Jensen: We present the results of an investigation to verify the feasibility of quantum
Supplementary Material
 Supplentary Material Three-Color Alternating-Laser xcitation of Single Molecules: Monitoring Multiple Interactions and Distances Nam Ki Lee, Achillefs N. Kapanidis, Hye an Koh, You Korlann, Sam On Ho,
Supporting Information. Evaluating steady-state and time-resolved fluorescence as a tool to study the behavior of asphaltene in toluene
 Electronic Supplementary Material (ESI) for Photochemical & Photobiological Sciences. This journal is The Royal Society of Chemistry and Owner Societies 2014 Supporting Information Evaluating steady-state
Singlet. Fluorescence Spectroscopy * LUMO
 Fluorescence Spectroscopy Light can be absorbed and re-emitted by matter luminescence (photo-luminescence). There are two types of luminescence, in this discussion: fluorescence and phosphorescence. A
One-pot synthesis of micron partly hollow anisotropic dumbbell shaped silica core-shell particles
 Electronic Supplementary Material (ESI) for ChemComm. This journal is The Royal Society of Chemistry 2016 Supporting Information One-pot synthesis of micron partly hollow anisotropic dumbbell shaped silica
Supporting Information
 Electronic Supplementary Material (ESI) for Photochemical & Photobiological Sciences. This journal is The Royal Society of Chemistry and Owner Societies 2014 Supporting Information 1. General procedure
Fluorescence Workshop UMN Physics June 8-10, 2006 Quantum Yield and Polarization (1) Joachim Mueller
 Joachim Mueller") Fluorescence Workshop UMN Physics June 8-10, 2006 Quantum Yield and Polarization (1) Joachim Mueller Quantum yield, polarized light, dipole moment, photoselection, dipole radiation, polarization and anisotropy
Fluorescence Workshop UMN Physics June 8-10, 2006 Quantum Yield and Polarization (1) Joachim Mueller Quantum yield, polarized light, dipole moment, photoselection, dipole radiation, polarization and anisotropy
Single photons. how to create them, how to see them. Alessandro Cerè
 Single photons how to create them, how to see them Alessandro Cerè Intro light is quantum light is cheap let s use the quantum properties of light Little interaction with the environment We can send them
High photostability and enhanced fluorescence of gold nanoclusters by silver doping-supporting information
 High photostability and enhanced fluorescence of gold nanoclusters by silver doping-supporting information Size measurements Figure S1 P2 FTIR measurements Figure S2 P2 XPS measurements Figure S3 P3 Photo-physical
SUPPLEMENTARY INFORMATION
 Supplementary Information Speckle-free laser imaging using random laser illumination Brandon Redding 1*, Michael A. Choma 2,3*, Hui Cao 1,4* 1 Department of Applied Physics, Yale University, New Haven,
Effects of Temperature and Concentration on the Rate of Photo-bleaching of Erythrosine in Water
 Supporting Information for: Effects of Temperature and Concentration on the Rate of Photo-bleaching of Erythrosine in Water Joshua K. G. Karlsson, Owen J. Woodford, Roza Al-Aqar and Anthony Harriman* Molecular
Nature Methods: doi: /nmeth Supplementary Figure 1
 Supplementary Figure 1 Control experiments on the fluorescence stability of single Atto647N-biotin complexes. a, Exemplary signal trace (black line) in counts per second (cps) of a single Atto647N molecule
Technology, Techniques and Applications. Ric Allott Business Development Manager
 Technology, Techniques and Applications Ric Allott Business Development Manager 1 Central Laser Facility ASTRA GEMINI VULCAN ARTEMIS ULTRA OCTOPUS High power, ultrashort pulse dual beams of 15 J, 30 fs
Discussion Session prior to the Second Examination: Sunday evening April 13 6 to 8 pm. 161 Noyes Laboratory
 Discussion Session prior to the Second Examination: Sunday evening April 13 6 to 8 pm 161 Noyes Laboratory Determination of the Stokes Radius by measuring the Rotational Diffusion Coefficient: D rot D
The Photon Counting Histogram: Statistical Analysis of Single Molecule Populations
 The Photon Counting Histogram: Statistical Analysis of Single Molecule Populations E. Gratton Laboratory for Fluorescence Dynamics University of California, Irvine Transition from FCS The Autocorrelation
Supporting information for the manuscript. Excited state structural evolution during charge-transfer reactions in Betaine-30
 Electronic Supplementary Material (ESI) for Physical Chemistry Chemical Physics. This journal is the Owner Societies 2015 Supporting information for the manuscript Excited state structural evolution during
Self-assembled Nanoscale DNA-porphyrin Complex for. Artificial Light-harvesting
 Supporting Information for Self-assembled Nanoscale DNA-porphyrin Complex for Artificial Light-harvesting Jakob G. Woller, Jonas K. Hannestad, and Bo Albinsson Department of Chemical and Biological Engineering/Physical
Solutions for Exercise session I
 Solutions for Exercise session I 1. The maximally polarisation-entangled photon state can be written as Ψ = 1 ( H 1 V V 1 H ). Show that the state is invariant (i.e. still maximally entangled) after a
SUPPLEMENTARY INFORMATION
 DETECTION LIMITS IN PHOTOTHERMAL MICROSCOPY Alexander Gaiduk, Paul V. Ruijgrok, Mustafa Yorulmaz, Michel Orrit Institute of Physics, Leiden University, P.O. Box 9504, 300 RA Leiden, The Netherlands SUPPLEMENTARY
Electronic Supplementary Information
 Electronic Supplementary Material (ESI) for Physical Chemistry Chemical Physics. This journal is the wner Societies 217 Electronic Supplementary Information Cylcodextrin-assisted Modulation in the Photophysical
Conformation-dependent Photostability among and within Single Conjugated Polymers. Supporting Information
 Conformation-dependent Photostability among and within Single Conjugated Polymers Heungman Park, Dat Tien Hoang, Keewook Paeng, Jaesung Yang, Laura J. Kaufman * Department of Chemistry, Columbia University,
Federal University of São Carlos Physics Department. Time Resolved Measurement System MUE: 2014/
 Federal University of São Carlos Physics Department Semiconductor Nanostructure Group Optical Properties, Vibrational, Spin and Transport Time Resolved Measurement System MUE: 2014/07375-2 Young Investigator:
Co-localization, FRET
 Co-localization, FRET Last class FRAP Diffusion This class Co-localization Correlation FRET Co-localization Can you infer function of protein from it s intracellular location How do you measure if two
Quantum yield determination by low-intensity Fluorescence Correlation Spectroscopy (lifcs)
") Quantum yield determination by low-intensity Fluorescence Correlation Spectroscopy (lifcs) Daryan Kempe 1, Jörg Fitter 1 and Matteo Gabba 1 RWTH Aachen, Germany Forschungszentrum Jülich, Germany July 15,
Quantum yield determination by low-intensity Fluorescence Correlation Spectroscopy (lifcs) Daryan Kempe 1, Jörg Fitter 1 and Matteo Gabba 1 RWTH Aachen, Germany Forschungszentrum Jülich, Germany July 15,
QUANTUM OPTICS AND QUANTUM INFORMATION TEACHING LABORATORY at the Institute of Optics, University of Rochester
 QUANTUM OPTICS AND QUANTUM INFORMATION TEACHING LABORATORY at the Institute of Optics, University of Rochester Svetlana Lukishova, Luke Bissell, Carlos Stroud, Jr, Anand Kumar Jha, Laura Elgin, Nickolaos
Petra Schwille and Elke Haustein Fluorescence Correlation Spectroscopy 1 TABLE OF CONTENTS 1 1. INTRODUCTION 2 2. EXPERIMENTAL REALIZATION 4
 Petra Schwille and Elke Haustein Fluorescence Correlation Spectroscopy Table of Contents TABLE OF CONTENTS. INTRODUCTION. EXPERIMENTAL REALIZATION 4.. ONE-PHOTON EXCITATION 4.. TWO-PHOTON EXCITATION 6.3.
Supporting Information: Ultrafast Excited State Transport and Decay Dynamics in Cesium Lead Mixed-Halide Perovskites
 Supporting Information: Ultrafast Excited State Transport and Decay Dynamics in Cesium Lead MixedHalide Perovskites Casey L. Kennedy, Andrew H. Hill, Eric S. Massaro, Erik M. Grumstrup *,,. Department
Radiation-matter interaction.
 Radiation-matter interaction Radiation-matter interaction Classical dipoles Dipole radiation Power radiated by a classical dipole in an inhomogeneous environment The local density of optical states (LDOS)
CHEM Outline (Part 15) - Luminescence 2013
 - Luminescence 2013") CHEM 524 -- Outline (Part 15) - Luminescence 2013 XI. Molecular Luminescence Spectra (Chapter 15) Kinetic process, competing pathways fluorescence, phosphorescence, non-radiative decay Jablonski diagram
CHEM 524 -- Outline (Part 15) - Luminescence 2013 XI. Molecular Luminescence Spectra (Chapter 15) Kinetic process, competing pathways fluorescence, phosphorescence, non-radiative decay Jablonski diagram
Singlet-triplet annihilation limits exciton yield in poly(3-hexylthiophene) Florian Steiner, Jan Vogelsang*, John M. Lupton
 Florian Steiner, Jan Vogelsang*, John M. Lupton") Singlet-triplet annihilation limits exciton yield in poly(3-hexylthiophene) Florian Steiner, Jan Vogelsang*, John M. Lupton Institut für Experimentelle und Angewandte Physik, Universität Regensburg, Universitätsstrasse
Singlet-triplet annihilation limits exciton yield in poly(3-hexylthiophene) Florian Steiner, Jan Vogelsang*, John M. Lupton Institut für Experimentelle und Angewandte Physik, Universität Regensburg, Universitätsstrasse