ECONOMET RICS P RELIM EXAM August 19, 2014 Department of Economics, Michigan State University
|
|
|
- Bathsheba Cunningham
- 5 years ago
- Views:
Transcription
1 ECONOMET RICS P RELIM EXAM August 19, 2014 Department of Economics, Michigan State University Instructions: Answer all ve (5) questions. Be sure to show your work or provide su cient justi cation for your answers. Unless explicitly asked, do not worry about regularity conditions such as existence of moments or di erentiability in parameters. This exam is closed book. You may use a calculator and tables of relevant distributions are provided on additional pages of the exam. 1. (20 points) A sequence of random variables fx n : n = 1; 2; :::g converges in probability to the constant a if for all " > 0 or equivalently: lim P (jx n aj > ") = 0; n!1 lim P (jx n aj ") = 1: n!1 Let fv t : t = 1; 2; :::g be a sequence of independent identically distributed random variables with E(v t ) = and E(jv t j) < 1. Then a law of large numbers holds for the sample average p lim v = p lim n 1 v t = : Let fv t : t = 1; 2; :::g be a sequence of independent identically distributed random variables with E(v t ) = 0 and E(v 2 t ) = 2 < 1. Then a central limit holds for the scaled sample average p nv = n 1=2 v d t! N(0; 2 ): The limits are taken as n! 1. Let y 1 ; y 2 ; :::; y n be a random sample from a normal population with mean and variance 2. Assume that 2 < 1. Let y denote the sample average of the y data. a) First show that y is a consistent estimator of and then calculate lim var p n(y ) : n!1 b) Show that p n(y ) converges in distribution to a mean zero normal random variable. What is the variance of the limiting normal random variable (i.e. asymptotic variance)? Compare your result for the asymptotic variance with the result you obtained in part (a) for lim n!1 var ( p n(y )). 1
2 c) De ne an alternative estimator of as e = y + z n ; where z n is a discrete random variable de ned as z n = 1 with probability n 1 ; z n = 0 with probability 1 n 1 : Assume that z n is independent of the y data. Is e a consistent estimator of? Please provide a detailed argument either way. Next calculate lim var p n(e ) : n!1 d) Compute p lim p nz n and then show that p n(e ) converges in distribution to a mean zero normal random variable. What is the variance of the limiting normal random variable (i.e. asymptotic variance)? Compare your result for the asymptotic variance with the result you obtained in part (c) for lim n!1 var ( p n(e )). Are you surprised? Why or why not? 2
3 2. (30 points) Consider the regression model given by y = X 0 +u where 0 is a k 1 vector of parameters, y and u are n 1 vectors and X is an n k matrix. Let W be an n k matrix. Assume that rank(x) = k, rank(w > X) = k, E(ujX; W) = 0 and var(ujx; W) =E(uu > jx; W) = 2 0I. If the conditions for the Gauss-Markov Theorem hold for a particular estimator of 0, you may use the Gauss-Markov Theorem without having to prove it. a) Let b be the OLS estimator of 0. Derive the bias of b and derive a formula for var( b jx; W). b) Let b IV be the instrumental variables estimator of 0 using W as instruments for X. Derive the bias of b IV and derive a formula for var( b IV jx; W). c) Compare the bias of the two estimators and compare var( b jx; W) with var( b IV jx; W). Is one estimator preferred over the other based on bias and variance? Why or why not? d) Let s 2 = 1 y X n k b > y X b be an estimator of 2 0. Determine whether nor not s 2 is an unbiased estimator of 2 0. e) An alternative estimator of 2 0 is given by s 2 IV = 1 n k y X b > IV y X b IV : Determine whether or not s 2 IV is an unbiased estimator of 2 0: f) Suppose that you found out that W is related to u and because of this E(ujX; W) 6= 0. Suppose that X and u are not related and that E(ujX) = 0 holds. Suppose that the other assumptions continue to hold. How would you adjust your answer to part (c) in this case? You can answer this question qualitatively without deriving explicit formulas for biases and conditional variances. 3
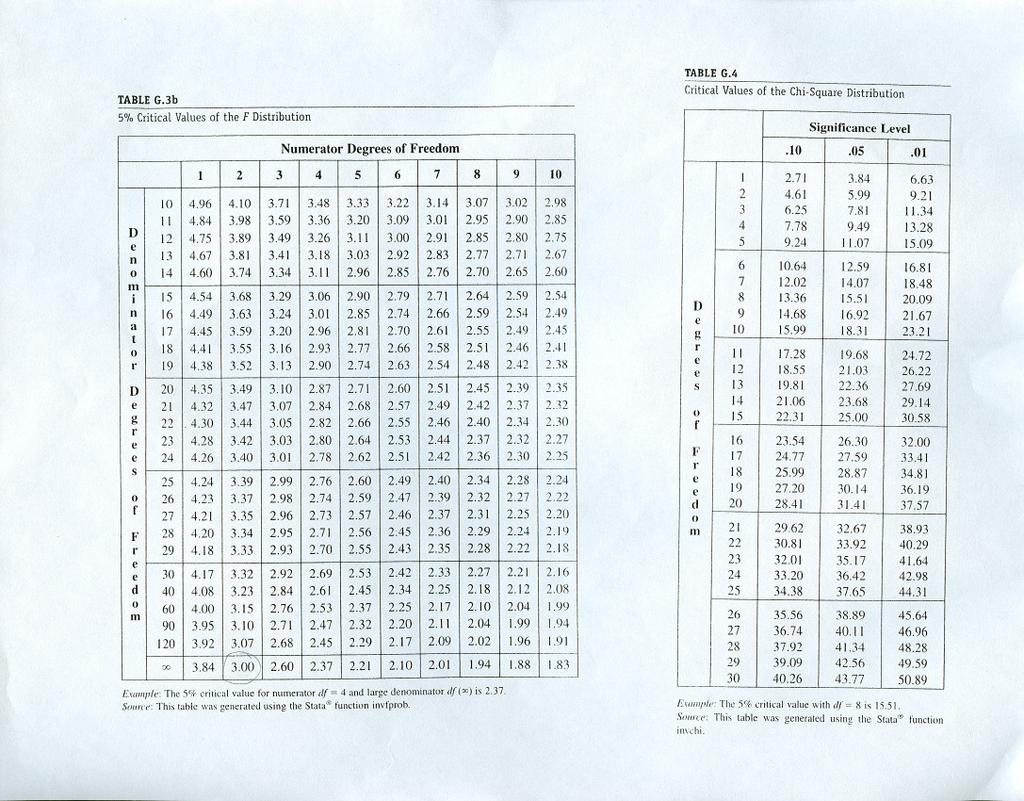
4 3. (20 points) For this question you may assume that the Gauss-Markov assumptions hold and that the population from which the data is sampled is normally distributed. Consider the following regression model to test the rationality of assessments of housing prices. Here we want to test whether the assessed house price is a rational prediction (in the sense that there does not exist systematic over- or under- prediction given available information) for the actual transaction price using data on the following variables: price = house price assess = the assessed housing value (before the house was sold) lotsize = size of the lot, in feet sqf t = square footage; bdrms = number of bedrooms: First, consider a simple regression model price t = assess t + u t ; where the assessment is rational if 1 = 0 and 2 = 1. The OLS estimated model (with values in the parenthesis being usual OLS standard errors) is d price t = 14:45 + 0:975 assess t (16:23) (0:047) n = 92; SSR = 165; 645; Rc 2 = 0:805 (price t assess t ) 2 = 209; 450; ( price d t assess t ) 2 = 58; 400 a) Using a 5% signi cance level, test the hypothesis that H 0 : 1 = 0 against the two-sided alternative. Then, test H 0 : 2 = 1 against the alternative 2 > 1. State the relevant critical values for your test statistics. b) Test the joint hypotheses H 0 : 1 = 0 and 2 = 1 at the 1% signi cance level. State the relevant critical value for your test statistic. c) Using a 5% signi cance level, test H 0 : 3 = 0; 4 = 0; and 5 = 0 in the model (1) price t = assess t + 3 lotsize t + 4 sqft + 5 bdrms t + u t 4
5 where Rc 2 from estimating this model (using the same 92 houses) is Brie y interpret the null hypotheses and the result of your test. Hint: Take the formula for the F-statistic expressed in terms of USSR and RSSR: F = (RSSR USSR) =r ; USSR=(n k) and write it in terms of the R 2 c for the restricted and unrestricted regressions. d) From the model of (1) test the joint hypotheses H 0 : 2 = 0; 3 = 0; 4 = 0; and 5 = 0 at the 5% signi cance level. State the relevant critical value for your test statistic. 4. (10 points) In this question assume that the Gauss-Markov assumptions hold and assume that any regularity conditions needed to justify the use of central limit theorems hold. For the estimation of the regression (2) y t = x 2t + 3 x 3t + u t ; t = 1; : : : ; n; suppose you have the following information: X > X = ; X> Y = ; (y t y) 2 = 200; 100 where X denotes the n 3 matrix stacking n observations of X t = (1; x 2t ; x 3t ), Y is an n 1 vector stacking n observations of y t, and y denotes the sample average of Y. a) Using a 5% signi cance level, test H 0 : 2 0:5 3 = 0:5 against the two-sided alternative. State the relevant critical value for your test statistic. b) Now suppose you have the following information for estimation of the same model (2) using a di erent sample that is independent of the original sample: (3) y t = 1 + 2x 2t + 3x 3t + u t ; t = 1; : : : ; m X > X = ; X> Y = ; X m (y t y) 2 = 100:
6 Combining information from (2) and (3), test the joint hypothesis H 0 : 2 = 2 and 3 = 3 at the 5% signi cance level. State the relevant critical value for your test statistic. Hint: In case you had forgotten, the formula for the F-statistic for testing H 0 : R = r is F = R b > r hrdvar( )R b i 1 > R b r =r; where is the vector of parameters, R and r are known matrices corresponding to the restrictions being tested, r is the number of restrictions being tested and dvar( b ) is an estimate of var( b ). 5. (20 points) Let y t be a binary variable that takes on the values of 0 and 1. Suppose we want to model the probability that y t is equal to 1 conditional on some variable, x t. The simplest model is a linear model given by P (y t = 1jx t ) = x t ; where it trivially holds that P (y t = 0jx t ) = 1 P (y t = 1jx t ). a) Show that E(y t jx t ) = P (y t = 1jx t ) = x t ; b) Using the result from part (a), we can write the regression model where E(u t jx t ) = 0. Derive the formula for y t = x t + u t var(u t jx t ); using the fact that y t is a binary random variable. c) Assuming necessary laws of large numbers hold, will b 2, the OLS estimator of 2, be a consistent estimator? Why or why not? d) Letting 2 = p lim b 2 and assuming that necessary central limit theorems hold, then p n b2 d 2! N(0; V 2 ) where V 2 is the asymptotic variance of b 2. Under what conditions, if any, will V 2 take the form V 2 = 2 0A 22 where A 22 is the lower right element of the 2 2 matrix A = (E(X > t X t )) 1 where X t = [1; x t ]? Please sketch the details of your argument. 6

7

8
9
ECONOMET RICS P RELIM EXAM August 24, 2010 Department of Economics, Michigan State University
 ECONOMET RICS P RELIM EXAM August 24, 2010 Department of Economics, Michigan State University Instructions: Answer all four (4) questions. Be sure to show your work or provide su cient justi cation for
ECONOMETRICS FIELD EXAM Michigan State University May 9, 2008
 ECONOMETRICS FIELD EXAM Michigan State University May 9, 2008 Instructions: Answer all four (4) questions. Point totals for each question are given in parenthesis; there are 00 points possible. Within
Econometrics Homework 1
 Econometrics Homework Due Date: March, 24. by This problem set includes questions for Lecture -4 covered before midterm exam. Question Let z be a random column vector of size 3 : z = @ (a) Write out z
x i = 1 yi 2 = 55 with N = 30. Use the above sample information to answer all the following questions. Show explicitly all formulas and calculations.
 Exercises for the course of Econometrics Introduction 1. () A researcher is using data for a sample of 30 observations to investigate the relationship between some dependent variable y i and independent
Testing Linear Restrictions: cont.
 Testing Linear Restrictions: cont. The F-statistic is closely connected with the R of the regression. In fact, if we are testing q linear restriction, can write the F-stastic as F = (R u R r)=q ( R u)=(n
Review of Econometrics
 Review of Econometrics Zheng Tian June 5th, 2017 1 The Essence of the OLS Estimation Multiple regression model involves the models as follows Y i = β 0 + β 1 X 1i + β 2 X 2i + + β k X ki + u i, i = 1,...,
1 A Non-technical Introduction to Regression
 1 A Non-technical Introduction to Regression Chapters 1 and Chapter 2 of the textbook are reviews of material you should know from your previous study (e.g. in your second year course). They cover, in
STATISTICS 110/201 PRACTICE FINAL EXAM
 STATISTICS 110/201 PRACTICE FINAL EXAM Questions 1 to 5: There is a downloadable Stata package that produces sequential sums of squares for regression. In other words, the SS is built up as each variable
Econometrics Midterm Examination Answers
 Econometrics Midterm Examination Answers March 4, 204. Question (35 points) Answer the following short questions. (i) De ne what is an unbiased estimator. Show that X is an unbiased estimator for E(X i
1. The Multivariate Classical Linear Regression Model
 Business School, Brunel University MSc. EC550/5509 Modelling Financial Decisions and Markets/Introduction to Quantitative Methods Prof. Menelaos Karanasos (Room SS69, Tel. 08956584) Lecture Notes 5. The
Econometrics I KS. Module 2: Multivariate Linear Regression. Alexander Ahammer. This version: April 16, 2018
 Econometrics I KS Module 2: Multivariate Linear Regression Alexander Ahammer Department of Economics Johannes Kepler University of Linz This version: April 16, 2018 Alexander Ahammer (JKU) Module 2: Multivariate
Homework Set 2, ECO 311, Spring 2014
 Homework Set 2, ECO 311, Spring 2014 Due Date: At the beginning of class on March 31, 2014 Instruction: There are twelve questions. Each question is worth 2 points. You need to submit the answers of only
Least Squares Estimation-Finite-Sample Properties
 Least Squares Estimation-Finite-Sample Properties Ping Yu School of Economics and Finance The University of Hong Kong Ping Yu (HKU) Finite-Sample 1 / 29 Terminology and Assumptions 1 Terminology and Assumptions
Inference in Regression Analysis
 ECNS 561 Inference Inference in Regression Analysis Up to this point 1.) OLS is unbiased 2.) OLS is BLUE (best linear unbiased estimator i.e., the variance is smallest among linear unbiased estimators)
1. The shoe size of five randomly selected men in the class is 7, 7.5, 6, 6.5 the shoe size of 4 randomly selected women is 6, 5.
 Economics 3 Introduction to Econometrics Winter 2004 Professor Dobkin Name Final Exam (Sample) You must answer all the questions. The exam is closed book and closed notes you may use calculators. You must
Föreläsning /31
 1/31 Föreläsning 10 090420 Chapter 13 Econometric Modeling: Model Speci cation and Diagnostic testing 2/31 Types of speci cation errors Consider the following models: Y i = β 1 + β 2 X i + β 3 X 2 i +
2. Linear regression with multiple regressors
 2. Linear regression with multiple regressors Aim of this section: Introduction of the multiple regression model OLS estimation in multiple regression Measures-of-fit in multiple regression Assumptions
ECONOMETRICS II (ECO 2401S) University of Toronto. Department of Economics. Winter 2014 Instructor: Victor Aguirregabiria
 University of Toronto. Department of Economics. Winter 2014 Instructor: Victor Aguirregabiria") ECONOMETRICS II (ECO 2401S) University of Toronto. Department of Economics. Winter 2014 Instructor: Victor guirregabiria SOLUTION TO FINL EXM Monday, pril 14, 2014. From 9:00am-12:00pm (3 hours) INSTRUCTIONS:
ECONOMETRICS II (ECO 2401S) University of Toronto. Department of Economics. Winter 2014 Instructor: Victor guirregabiria SOLUTION TO FINL EXM Monday, pril 14, 2014. From 9:00am-12:00pm (3 hours) INSTRUCTIONS:
ECONOMETFUCS FIELD EXAM Michigan State University May 11, 2007
 ECONOMETFUCS FIELD EXAM Michigan State University May 11, 2007 Instructions: Answer all four (4) questions. Point totals for each question are given in parenthesis; there are 100 points possible. Within
Chapter 1. GMM: Basic Concepts
 Chapter 1. GMM: Basic Concepts Contents 1 Motivating Examples 1 1.1 Instrumental variable estimator....................... 1 1.2 Estimating parameters in monetary policy rules.............. 2 1.3 Estimating
Multiple Regression Analysis: Heteroskedasticity
 Multiple Regression Analysis: Heteroskedasticity y = β 0 + β 1 x 1 + β x +... β k x k + u Read chapter 8. EE45 -Chaiyuth Punyasavatsut 1 topics 8.1 Heteroskedasticity and OLS 8. Robust estimation 8.3 Testing
Econ 583 Final Exam Fall 2008
 Econ 583 Final Exam Fall 2008 Eric Zivot December 11, 2008 Exam is due at 9:00 am in my office on Friday, December 12. 1 Maximum Likelihood Estimation and Asymptotic Theory Let X 1,...,X n be iid random
Contest Quiz 3. Question Sheet. In this quiz we will review concepts of linear regression covered in lecture 2.
 Updated: November 17, 2011 Lecturer: Thilo Klein Contact: tk375@cam.ac.uk Contest Quiz 3 Question Sheet In this quiz we will review concepts of linear regression covered in lecture 2. NOTE: Please round
Linear Regression. y» F; Ey = + x Vary = ¾ 2. ) y = + x + u. Eu = 0 Varu = ¾ 2 Exu = 0:
 y = + x + u. Eu = 0 Varu = ¾ 2 Exu = 0:") Linear Regression 1 Single Explanatory Variable Assume (y is not necessarily normal) where Examples: y» F; Ey = + x Vary = ¾ 2 ) y = + x + u Eu = 0 Varu = ¾ 2 Exu = 0: 1. School performance as a function
Linear Regression 1 Single Explanatory Variable Assume (y is not necessarily normal) where Examples: y» F; Ey = + x Vary = ¾ 2 ) y = + x + u Eu = 0 Varu = ¾ 2 Exu = 0: 1. School performance as a function
Introduction to Econometrics. Heteroskedasticity
 Introduction to Econometrics Introduction Heteroskedasticity When the variance of the errors changes across segments of the population, where the segments are determined by different values for the explanatory
Multiple Regression Analysis
 Multiple Regression Analysis y = 0 + 1 x 1 + x +... k x k + u 6. Heteroskedasticity What is Heteroskedasticity?! Recall the assumption of homoskedasticity implied that conditional on the explanatory variables,
Introductory Econometrics
 Introductory Econometrics Violation of basic assumptions Heteroskedasticity Barbara Pertold-Gebicka CERGE-EI 16 November 010 OLS assumptions 1. Disturbances are random variables drawn from a normal distribution.
Final Exam. Economics 835: Econometrics. Fall 2010
 Final Exam Economics 835: Econometrics Fall 2010 Please answer the question I ask - no more and no less - and remember that the correct answer is often short and simple. 1 Some short questions a) For each
Homework Set 2, ECO 311, Fall 2014
 Homework Set 2, ECO 311, Fall 2014 Due Date: At the beginning of class on October 21, 2014 Instruction: There are twelve questions. Each question is worth 2 points. You need to submit the answers of only
Multiple Regression Analysis
 Multiple Regression Analysis y = β 0 + β 1 x 1 + β 2 x 2 +... β k x k + u 2. Inference 0 Assumptions of the Classical Linear Model (CLM)! So far, we know: 1. The mean and variance of the OLS estimators
ECONOMETRICS II (ECO 2401S) University of Toronto. Department of Economics. Spring 2013 Instructor: Victor Aguirregabiria
 University of Toronto. Department of Economics. Spring 2013 Instructor: Victor Aguirregabiria") ECONOMETRICS II (ECO 2401S) University of Toronto. Department of Economics. Spring 2013 Instructor: Victor Aguirregabiria SOLUTION TO FINAL EXAM Friday, April 12, 2013. From 9:00-12:00 (3 hours) INSTRUCTIONS:
ECONOMETRICS II (ECO 2401S) University of Toronto. Department of Economics. Spring 2013 Instructor: Victor Aguirregabiria SOLUTION TO FINAL EXAM Friday, April 12, 2013. From 9:00-12:00 (3 hours) INSTRUCTIONS:
Multiple Regression: Inference
 Multiple Regression: Inference The t-test: is ˆ j big and precise enough? We test the null hypothesis: H 0 : β j =0; i.e. test that x j has no effect on y once the other explanatory variables are controlled
Linear Regression with 1 Regressor. Introduction to Econometrics Spring 2012 Ken Simons
 Linear Regression with 1 Regressor Introduction to Econometrics Spring 2012 Ken Simons Linear Regression with 1 Regressor 1. The regression equation 2. Estimating the equation 3. Assumptions required for
Economics 620, Lecture 9: Asymptotics III: Maximum Likelihood Estimation
 Economics 620, Lecture 9: Asymptotics III: Maximum Likelihood Estimation Nicholas M. Kiefer Cornell University Professor N. M. Kiefer (Cornell University) Lecture 9: Asymptotics III(MLE) 1 / 20 Jensen
Economics 241B Review of Limit Theorems for Sequences of Random Variables
 Economics 241B Review of Limit Theorems for Sequences of Random Variables Convergence in Distribution The previous de nitions of convergence focus on the outcome sequences of a random variable. Convergence
Economics Introduction to Econometrics - Fall 2007 Final Exam - Answers
 Student Name: Economics 4818 - Introduction to Econometrics - Fall 2007 Final Exam - Answers SHOW ALL WORK! Evaluation: Problems: 3, 4C, 5C and 5F are worth 4 points. All other questions are worth 3 points.
WISE MA/PhD Programs Econometrics Instructor: Brett Graham Spring Semester, Academic Year Exam Version: A
 WISE MA/PhD Programs Econometrics Instructor: Brett Graham Spring Semester, 2016-17 Academic Year Exam Version: A INSTRUCTIONS TO STUDENTS 1 The time allowed for this examination paper is 2 hours. 2 This
ECE 302 Division 1 MWF 10:30-11:20 (Prof. Pollak) Final Exam Solutions, 5/3/2004. Please read the instructions carefully before proceeding.
 Final Exam Solutions, 5/3/2004. Please read the instructions carefully before proceeding.") NAME: ECE 302 Division MWF 0:30-:20 (Prof. Pollak) Final Exam Solutions, 5/3/2004. Please read the instructions carefully before proceeding. If you are not in Prof. Pollak s section, you may not take this
NAME: ECE 302 Division MWF 0:30-:20 (Prof. Pollak) Final Exam Solutions, 5/3/2004. Please read the instructions carefully before proceeding. If you are not in Prof. Pollak s section, you may not take this
WISE MA/PhD Programs Econometrics Instructor: Brett Graham Spring Semester, Academic Year Exam Version: A
 WISE MA/PhD Programs Econometrics Instructor: Brett Graham Spring Semester, 2016-17 Academic Year Exam Version: A INSTRUCTIONS TO STUDENTS 1 The time allowed for this examination paper is 2 hours. 2 This
Multiple Regression. Midterm results: AVG = 26.5 (88%) A = 27+ B = C =
 A = 27+ B = C =") Economics 130 Lecture 6 Midterm Review Next Steps for the Class Multiple Regression Review & Issues Model Specification Issues Launching the Projects!!!!! Midterm results: AVG = 26.5 (88%) A = 27+ B =
Economics 130 Lecture 6 Midterm Review Next Steps for the Class Multiple Regression Review & Issues Model Specification Issues Launching the Projects!!!!! Midterm results: AVG = 26.5 (88%) A = 27+ B =
coefficients n 2 are the residuals obtained when we estimate the regression on y equals the (simple regression) estimated effect of the part of x 1
 estimated effect of the part of x 1") Review - Interpreting the Regression If we estimate: It can be shown that: where ˆ1 r i coefficients β ˆ+ βˆ x+ βˆ ˆ= 0 1 1 2x2 y ˆβ n n 2 1 = rˆ i1yi rˆ i1 i= 1 i= 1 xˆ are the residuals obtained when
Review - Interpreting the Regression If we estimate: It can be shown that: where ˆ1 r i coefficients β ˆ+ βˆ x+ βˆ ˆ= 0 1 1 2x2 y ˆβ n n 2 1 = rˆ i1yi rˆ i1 i= 1 i= 1 xˆ are the residuals obtained when
WISE International Masters
 WISE International Masters ECONOMETRICS Instructor: Brett Graham INSTRUCTIONS TO STUDENTS 1 The time allowed for this examination paper is 2 hours. 2 This examination paper contains 32 questions. You are
Multiple Regression Analysis: Inference MULTIPLE REGRESSION ANALYSIS: INFERENCE. Sampling Distributions of OLS Estimators
 1 2 Multiple Regression Analysis: Inference MULTIPLE REGRESSION ANALYSIS: INFERENCE Hüseyin Taştan 1 1 Yıldız Technical University Department of Economics These presentation notes are based on Introductory
SIMILAR-ON-THE-BOUNDARY TESTS FOR MOMENT INEQUALITIES EXIST, BUT HAVE POOR POWER. Donald W. K. Andrews. August 2011
 SIMILAR-ON-THE-BOUNDARY TESTS FOR MOMENT INEQUALITIES EXIST, BUT HAVE POOR POWER By Donald W. K. Andrews August 2011 COWLES FOUNDATION DISCUSSION PAPER NO. 1815 COWLES FOUNDATION FOR RESEARCH IN ECONOMICS
Economics 620, Lecture 4: The K-Variable Linear Model I. y 1 = + x 1 + " 1 y 2 = + x 2 + " 2 :::::::: :::::::: y N = + x N + " N
 1 Economics 620, Lecture 4: The K-Variable Linear Model I Consider the system y 1 = + x 1 + " 1 y 2 = + x 2 + " 2 :::::::: :::::::: y N = + x N + " N or in matrix form y = X + " where y is N 1, X is N
Economics 113. Simple Regression Assumptions. Simple Regression Derivation. Changing Units of Measurement. Nonlinear effects
 Economics 113 Simple Regression Models Simple Regression Assumptions Simple Regression Derivation Changing Units of Measurement Nonlinear effects OLS and unbiased estimates Variance of the OLS estimates
The Statistical Property of Ordinary Least Squares
 The Statistical Property of Ordinary Least Squares The linear equation, on which we apply the OLS is y t = X t β + u t Then, as we have derived, the OLS estimator is ˆβ = [ X T X] 1 X T y Then, substituting
Simple Linear Regression: The Model
 Simple Linear Regression: The Model task: quantifying the effect of change X in X on Y, with some constant β 1 : Y = β 1 X, linear relationship between X and Y, however, relationship subject to a random
CHAPTER 6: SPECIFICATION VARIABLES
 Recall, we had the following six assumptions required for the Gauss-Markov Theorem: 1. The regression model is linear, correctly specified, and has an additive error term. 2. The error term has a zero
1 Correlation between an independent variable and the error
 Chapter 7 outline, Econometrics Instrumental variables and model estimation 1 Correlation between an independent variable and the error Recall that one of the assumptions that we make when proving the
Birkbeck Economics MSc Economics, PGCert Econometrics MSc Financial Economics Autumn 2009 ECONOMETRICS Ron Smith :
 Birkbeck Economics MSc Economics, PGCert Econometrics MSc Financial Economics Autumn 2009 ECONOMETRICS Ron Smith : R.Smith@bbk.ac.uk Contents 1. Background 2. Exercises 3. Advice on Econometric projects
ECON 4230 Intermediate Econometric Theory Exam
 ECON 4230 Intermediate Econometric Theory Exam Multiple Choice (20 pts). Circle the best answer. 1. The Classical assumption of mean zero errors is satisfied if the regression model a) is linear in the
1 The Multiple Regression Model: Freeing Up the Classical Assumptions
 1 The Multiple Regression Model: Freeing Up the Classical Assumptions Some or all of classical assumptions were crucial for many of the derivations of the previous chapters. Derivation of the OLS estimator
Environmental Econometrics
 Environmental Econometrics Syngjoo Choi Fall 2008 Environmental Econometrics (GR03) Fall 2008 1 / 37 Syllabus I This is an introductory econometrics course which assumes no prior knowledge on econometrics;
Econometrics Problem Set 6
 Econometrics Problem Set 6 WISE, Xiamen University Spring 2016-17 Conceptual Questions 1. This question refers to the estimated regressions shown in Table 1 computed using data for 1988 from the CPS. The
Test Code: STA/STB (Short Answer Type) 2013 Junior Research Fellowship for Research Course in Statistics
 2013 Junior Research Fellowship for Research Course in Statistics") Test Code: STA/STB (Short Answer Type) 2013 Junior Research Fellowship for Research Course in Statistics The candidates for the research course in Statistics will have to take two shortanswer type tests
Test Code: STA/STB (Short Answer Type) 2013 Junior Research Fellowship for Research Course in Statistics The candidates for the research course in Statistics will have to take two shortanswer type tests
(c) i) In ation (INFL) is regressed on the unemployment rate (UNR):
 i) In ation (INFL) is regressed on the unemployment rate (UNR):") BRUNEL UNIVERSITY Master of Science Degree examination Test Exam Paper 005-006 EC500: Modelling Financial Decisions and Markets EC5030: Introduction to Quantitative methods Model Answers. COMPULSORY (a)
BRUNEL UNIVERSITY Master of Science Degree examination Test Exam Paper 005-006 EC500: Modelling Financial Decisions and Markets EC5030: Introduction to Quantitative methods Model Answers. COMPULSORY (a)
Problem Set #6: OLS. Economics 835: Econometrics. Fall 2012
 Problem Set #6: OLS Economics 835: Econometrics Fall 202 A preliminary result Suppose we have a random sample of size n on the scalar random variables (x, y) with finite means, variances, and covariance.
Motivation for multiple regression
 Motivation for multiple regression 1. Simple regression puts all factors other than X in u, and treats them as unobserved. Effectively the simple regression does not account for other factors. 2. The slope
(Y jz) t (XjZ) 0 t = S yx S yz S 1. S yx:z = T 1. etc. 2. Next solve the eigenvalue problem. js xx:z S xy:z S 1
 t (XjZ) 0 t = S yx S yz S 1. S yx:z = T 1. etc. 2. Next solve the eigenvalue problem. js xx:z S xy:z S 1") Abstract Reduced Rank Regression The reduced rank regression model is a multivariate regression model with a coe cient matrix with reduced rank. The reduced rank regression algorithm is an estimation procedure,
Abstract Reduced Rank Regression The reduced rank regression model is a multivariate regression model with a coe cient matrix with reduced rank. The reduced rank regression algorithm is an estimation procedure,
STA 302f16 Assignment Five 1
 STA 30f16 Assignment Five 1 Except for Problem??, these problems are preparation for the quiz in tutorial on Thursday October 0th, and are not to be handed in As usual, at times you may be asked to prove
Econometrics Summary Algebraic and Statistical Preliminaries
 Econometrics Summary Algebraic and Statistical Preliminaries Elasticity: The point elasticity of Y with respect to L is given by α = ( Y/ L)/(Y/L). The arc elasticity is given by ( Y/ L)/(Y/L), when L
f (1 0.5)/n Z =
/n Z =") Math 466/566 - Homework 4. We want to test a hypothesis involving a population proportion. The unknown population proportion is p. The null hypothesis is p = / and the alternative hypothesis is p > /.
Math 466/566 - Homework 4. We want to test a hypothesis involving a population proportion. The unknown population proportion is p. The null hypothesis is p = / and the alternative hypothesis is p > /.
Comprehensive Examination Quantitative Methods Spring, 2018
 Comprehensive Examination Quantitative Methods Spring, 2018 Instruction: This exam consists of three parts. You are required to answer all the questions in all the parts. 1 Grading policy: 1. Each part
Wooldridge, Introductory Econometrics, 4th ed. Chapter 6: Multiple regression analysis: Further issues
 Wooldridge, Introductory Econometrics, 4th ed. Chapter 6: Multiple regression analysis: Further issues What effects will the scale of the X and y variables have upon multiple regression? The coefficients
Economics 620, Lecture 4: The K-Varable Linear Model I
 Economics 620, Lecture 4: The K-Varable Linear Model I Nicholas M. Kiefer Cornell University Professor N. M. Kiefer (Cornell University) Lecture 4: The K-Varable Linear Model I 1 / 20 Consider the system
Economics 241B Estimation with Instruments
 Economics 241B Estimation with Instruments Measurement Error Measurement error is de ned as the error resulting from the measurement of a variable. At some level, every variable is measured with error.
Math 104 Section 2 Midterm 2 November 1, 2013
 Math 104 Section 2 Midterm 2 November 1, 2013 Name: Complete the following problems. In order to receive full credit, please provide rigorous proofs and show all of your work and justify your answers.
Concordia University (5+5)Q 1.
Q 1.") (5+5)Q 1. Concordia University Department of Mathematics and Statistics Course Number Section Statistics 360/1 40 Examination Date Time Pages Mid Term Test May 26, 2004 Two Hours 3 Instructor Course Examiner
(5+5)Q 1. Concordia University Department of Mathematics and Statistics Course Number Section Statistics 360/1 40 Examination Date Time Pages Mid Term Test May 26, 2004 Two Hours 3 Instructor Course Examiner
Quantitative Techniques - Lecture 8: Estimation
 Quantitative Techniques - Lecture 8: Estimation Key words: Estimation, hypothesis testing, bias, e ciency, least squares Hypothesis testing when the population variance is not known roperties of estimates
Statistics Ph.D. Qualifying Exam: Part I October 18, 2003
 Statistics Ph.D. Qualifying Exam: Part I October 18, 2003 Student Name: 1. Answer 8 out of 12 problems. Mark the problems you selected in the following table. 1 2 3 4 5 6 7 8 9 10 11 12 2. Write your answer
Linear models. Linear models are computationally convenient and remain widely used in. applied econometric research
 Linear models Linear models are computationally convenient and remain widely used in applied econometric research Our main focus in these lectures will be on single equation linear models of the form y
ECONOMETRICS FIELD EXAM May 10,2013 Department ofeconomics, Michigan State University
 ECONOMETRICS FIELD EXAM May 10,2013 Department ofeconomics, Michigan State University Instructions: Answer all four (4) questions. Be sure to show your work or provide sufficient justification for your
Linear Model Under General Variance
 Linear Model Under General Variance We have a sample of T random variables y 1, y 2,, y T, satisfying the linear model Y = X β + e, where Y = (y 1,, y T )' is a (T 1) vector of random variables, X = (T
Advanced Econometrics I
 Lecture Notes Autumn 2010 Dr. Getinet Haile, University of Mannheim 1. Introduction Introduction & CLRM, Autumn Term 2010 1 What is econometrics? Econometrics = economic statistics economic theory mathematics
Basic Econometrics - rewiev
 Basic Econometrics - rewiev Jerzy Mycielski Model Linear equation y i = x 1i β 1 + x 2i β 2 +... + x Ki β K + ε i, dla i = 1,..., N, Elements dependent (endogenous) variable y i independent (exogenous)
ECONOMETRICS FIELD EXAM Michigan State University August 21, 2009
 ECONOMETRICS FIELD EXAM Michigan State University August 21, 2009 Instructions: Answer all four (4) questions. Point totals for each question are given in parentheses; there are 100 points possible. Within
Suggested Solution for PS #5
 Cornell University Department of Economics Econ 62 Spring 28 TA: Jae Ho Yun Suggested Solution for S #5. (Measurement Error, IV) (a) This is a measurement error problem. y i x i + t i + " i t i t i + i
Economics 620, Lecture 2: Regression Mechanics (Simple Regression)
") 1 Economics 620, Lecture 2: Regression Mechanics (Simple Regression) Observed variables: y i ; x i i = 1; :::; n Hypothesized (model): Ey i = + x i or y i = + x i + (y i Ey i ) ; renaming we get: y i =
1 Economics 620, Lecture 2: Regression Mechanics (Simple Regression) Observed variables: y i ; x i i = 1; :::; n Hypothesized (model): Ey i = + x i or y i = + x i + (y i Ey i ) ; renaming we get: y i =
Testing for Regime Switching: A Comment
 Testing for Regime Switching: A Comment Andrew V. Carter Department of Statistics University of California, Santa Barbara Douglas G. Steigerwald Department of Economics University of California Santa Barbara
Intermediate Econometrics
 Intermediate Econometrics Heteroskedasticity Text: Wooldridge, 8 July 17, 2011 Heteroskedasticity Assumption of homoskedasticity, Var(u i x i1,..., x ik ) = E(u 2 i x i1,..., x ik ) = σ 2. That is, the
Econometrics Master in Business and Quantitative Methods
 Econometrics Master in Business and Quantitative Methods Helena Veiga Universidad Carlos III de Madrid Models with discrete dependent variables and applications of panel data methods in all fields of economics
i) the probability of type I error; ii) the 95% con dence interval; iii) the p value; iv) the probability of type II error; v) the power of a test.
 the probability of type I error; ii) the 95% con dence interval; iii) the p value; iv) the probability of type II error; v) the power of a test.") 1. Explain what is: i) the probability of type I error; ii) the 95% con dence interval; iii) the p value; iv) the probability of type II error; v) the power of a test. Answer: i) It is the probability
1. Explain what is: i) the probability of type I error; ii) the 95% con dence interval; iii) the p value; iv) the probability of type II error; v) the power of a test. Answer: i) It is the probability
Instead of using all the sample observations for estimation, the suggested procedure is to divide the data set
 Chow forecast test: Instead of using all the sample observations for estimation, the suggested procedure is to divide the data set of N sample observations into N 1 observations to be used for estimation
Mathematical statistics
 October 4 th, 2018 Lecture 12: Information Where are we? Week 1 Week 2 Week 4 Week 7 Week 10 Week 14 Probability reviews Chapter 6: Statistics and Sampling Distributions Chapter 7: Point Estimation Chapter
This exam is closed book and closed notes. (You will have access to a copy of the Table of Common Distributions given in the back of the text.
 TEST #3 STA 536 December, 00 Name: Please read the following directions. DO NOT TURN THE PAGE UNTIL INSTRUCTED TO DO SO Directions This exam is closed book and closed notes. You will have access to a copy
Problem set 1 - Solutions
 EMPIRICAL FINANCE AND FINANCIAL ECONOMETRICS - MODULE (8448) Problem set 1 - Solutions Exercise 1 -Solutions 1. The correct answer is (a). In fact, the process generating daily prices is usually assumed
Multiple Regression Analysis. Part III. Multiple Regression Analysis
 Part III Multiple Regression Analysis As of Sep 26, 2017 1 Multiple Regression Analysis Estimation Matrix form Goodness-of-Fit R-square Adjusted R-square Expected values of the OLS estimators Irrelevant
Regression #4: Properties of OLS Estimator (Part 2)
") Regression #4: Properties of OLS Estimator (Part 2) Econ 671 Purdue University Justin L. Tobias (Purdue) Regression #4 1 / 24 Introduction In this lecture, we continue investigating properties associated
Regression #4: Properties of OLS Estimator (Part 2) Econ 671 Purdue University Justin L. Tobias (Purdue) Regression #4 1 / 24 Introduction In this lecture, we continue investigating properties associated
Business Statistics. Tommaso Proietti. Linear Regression. DEF - Università di Roma 'Tor Vergata'
 Business Statistics Tommaso Proietti DEF - Università di Roma 'Tor Vergata' Linear Regression Specication Let Y be a univariate quantitative response variable. We model Y as follows: Y = f(x) + ε where
SIMILAR-ON-THE-BOUNDARY TESTS FOR MOMENT INEQUALITIES EXIST, BUT HAVE POOR POWER. Donald W. K. Andrews. August 2011 Revised March 2012
 SIMILAR-ON-THE-BOUNDARY TESTS FOR MOMENT INEQUALITIES EXIST, BUT HAVE POOR POWER By Donald W. K. Andrews August 2011 Revised March 2012 COWLES FOUNDATION DISCUSSION PAPER NO. 1815R COWLES FOUNDATION FOR
Economics 345: Applied Econometrics Section A01 University of Victoria Midterm Examination #2 Version 2 Fall 2016 Instructor: Martin Farnham
 Economics 345: Applied Econometrics Section A01 University of Victoria Midterm Examination #2 Version 2 Fall 2016 Instructor: Martin Farnham Last name (family name): First name (given name): Student ID
2. Variance and Covariance: We will now derive some classic properties of variance and covariance. Assume real-valued random variables X and Y.
 CS450 Final Review Problems Fall 08 Solutions or worked answers provided Problems -6 are based on the midterm review Identical problems are marked recap] Please consult previous recitations and textbook
Econometrics Problem Set 6
 Econometrics Problem Set 6 WISE, Xiamen University Spring 2016-17 Conceptual Questions 1. This question refers to the estimated regressions shown in Table 1 computed using data for 1988 from the CPS. The
AMCS243/CS243/EE243 Probability and Statistics. Fall Final Exam: Sunday Dec. 8, 3:00pm- 5:50pm VERSION A
 AMCS243/CS243/EE243 Probability and Statistics Fall 2013 Final Exam: Sunday Dec. 8, 3:00pm- 5:50pm VERSION A *********************************************************** ID: ***********************************************************
Lecture 6: Dynamic Models
 Lecture 6: Dynamic Models R.G. Pierse 1 Introduction Up until now we have maintained the assumption that X values are fixed in repeated sampling (A4) In this lecture we look at dynamic models, where the
Heteroskedasticity and Autocorrelation
 Lesson 7 Heteroskedasticity and Autocorrelation Pilar González and Susan Orbe Dpt. Applied Economics III (Econometrics and Statistics) Pilar González and Susan Orbe OCW 2014 Lesson 7. Heteroskedasticity
Heteroskedasticity. We now consider the implications of relaxing the assumption that the conditional
 Heteroskedasticity We now consider the implications of relaxing the assumption that the conditional variance V (u i x i ) = σ 2 is common to all observations i = 1,..., In many applications, we may suspect
Linear Models in Econometrics
 Linear Models in Econometrics Nicky Grant At the most fundamental level econometrics is the development of statistical techniques suited primarily to answering economic questions and testing economic theories.