The Economics of Density: Evidence from the Berlin Wall
|
|
|
- Sharyl Washington
- 5 years ago
- Views:
Transcription
1 The Economics of Density: Evidence from the Berlin Wall Ahlfeldt, Redding, Sturm and Wolf, Econometrica 2015 Florian Oswald Graduate Labor, Sciences Po 2017 April 13, 2017 Florian Oswald (Graduate Labor, Sciences The PoEconomics 2017) of Density: Evidence from the Berlin Wall April 13, / 38
2 Introduction Last time we looked at the monocentric model to think about the city. There is another approach: Trade. What determines the flow of goods across countries Role of consumer preferences, tariffs, shipping costs what are the gains from trade? Instead of goods we can think of shipping people, from one location to another. In the city, need to ship workers to firms, which is costly. There are similar agglomeration forces within and between cities. [Ahlfeldt et al.(2015)ahlfeldt, Redding, Sturm, and Wolf] use a trade model to enrich the standard urban model. Florian Oswald (Graduate Labor, Sciences The PoEconomics 2017) of Density: Evidence from the Berlin Wall April 13, / 38
3 Challenges Main Challenge: distinguish agglomeration forces from variation in location fundamentals High land prices or productivity could be due to agglomeration forces but could also be due to highly value amenities. [Hanson(1997)]: Agglomeration due to static increasing returns is observationally equivalent to agglomeration due to exogenous site-specific characteristics. Florian Oswald (Graduate Labor, Sciences The PoEconomics 2017) of Density: Evidence from the Berlin Wall April 13, / 38
4 Challenges Theoretical challenge: literature makes strong assumptions on geography: Monocentric. Symmetric. Empirical challenge: Find exogenous variation in surrounding economic activity separate agglomeration (should be affected) from amenity (should not) hard to come by in general! Florian Oswald (Graduate Labor, Sciences The PoEconomics 2017) of Density: Evidence from the Berlin Wall April 13, / 38
5 The Berlin Wall July 1945: Berlin is separated into sectors along existing district boundaries June 1948: Tensions between East and West start to emerge. Berlin Blockade. 1961: To stem flow of refugees into Western Germany, East Germany constructs the Berlin Wall. This ends all local interaction between East and West of the city. Cuts through transport and communication networks. Wall falls in 1989, and Germany formally reunified on 3 October Florian Oswald (Graduate Labor, Sciences The PoEconomics 2017) of Density: Evidence from the Berlin Wall April 13, / 38
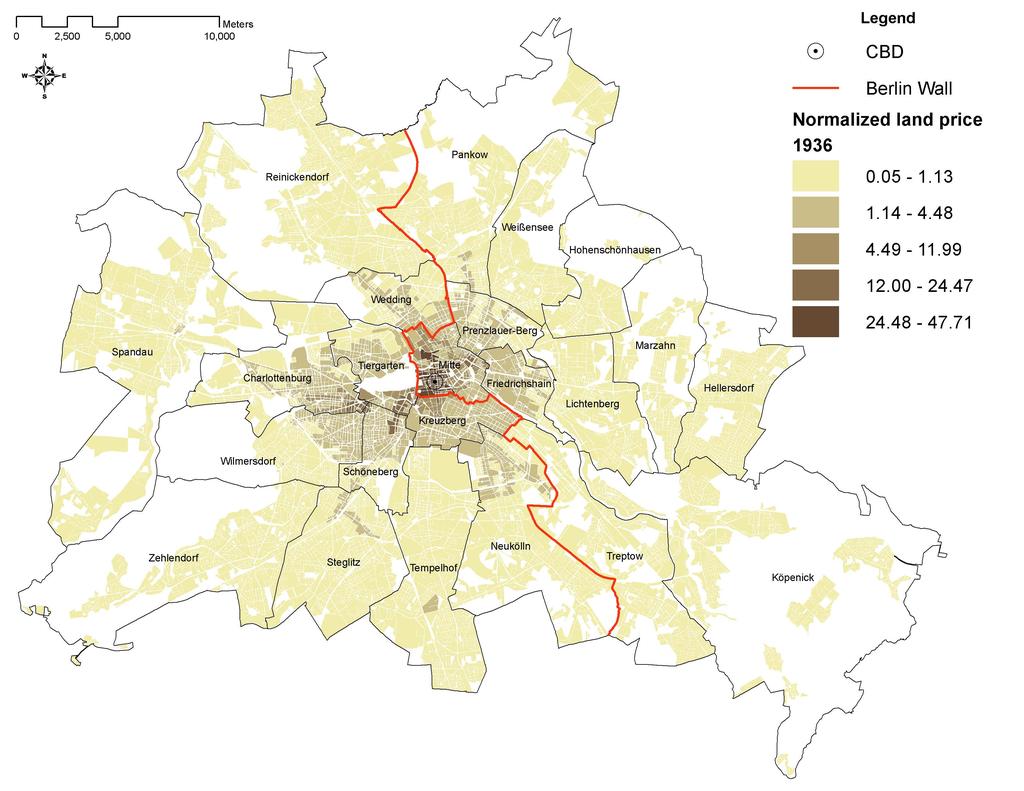
6
7 Model Outline picture. Describe tensions between agglomeration and dispersion production and residential externalities commuting costs and inelastic housing supply. Florian Oswald (Graduate Labor, Sciences The PoEconomics 2017) of Density: Evidence from the Berlin Wall April 13, / 38
8 Model There are i = 1,..., S discrete blocks each block is of size L i (think m 2 ) an endogenous fraction θ i is used for residential, rest commercial H workers live in the city, perfectly mobile within city and economy. Reservation level of utility Ū. Workers deciding to move to Berlin draw idiosyncratic utility shocks for each residence/workplace combination and choose most preferred bundle. Florian Oswald (Graduate Labor, Sciences The PoEconomics 2017) of Density: Evidence from the Berlin Wall April 13, / 38
9 Workers risk neutral: U ijo = C ijo is a consumption index. Worker o resides in block i and works in block j at wage w j. Residential amenity B i, residential floor space l ijo, numeraire consumption c ijo C ijo = B iz ijo d ij ( cijo β ) β ( ) 1 β lijo, 0 < β < 1 1 β iceberg commuting cost d ij = e κτ ij [1, ) from i to j McFadden and [Eaton and Kortum(2002)] utility shock z Florian Oswald (Graduate Labor, Sciences The PoEconomics 2017) of Density: Evidence from the Berlin Wall April 13, / 38
10 Frechet Distribution zis drawn from a Frechet Distribution F (z ijo ) = e T i E j z ε ijo, T i, E j > 0, ε > 1 T i : mean idiosyncratic utility from living in i E j : mean idiosyncratic utility from working in j ε: dispersion of utilities Florian Oswald (Graduate Labor, Sciences The PoEconomics 2017) of Density: Evidence from the Berlin April Wall 13, / 38
11 Frechet Distribution Florian Oswald (Graduate Labor, Sciences The PoEconomics 2017) of Density: Evidence from the Berlin April Wall 13, / 38
12 Worker Sorting Take residential amenities, goods and factor prices and location of firms and other workers as given. Choose location with highest utility. Optimal consumption and housing choices are independent of z ijo. Given prices Q i for residential housing l ijo, p i = 1 for c ijo, and wage w j, max c ij,l ij U ij s.t.w j = p i c ij + Q i l ij Florian Oswald (Graduate Labor, Sciences The PoEconomics 2017) of Density: Evidence from the Berlin April Wall 13, / 38
13 Worker optimal choice We obtain l ijo = w j Q i (1 β) c ijo = βw j plugged into utility gives indirect utility u ijo = z ijob i w j Q β 1 i (1) d ij So, workers compare u ijo across all (i, j) given their shock z ijo. Florian Oswald (Graduate Labor, Sciences The PoEconomics 2017) of Density: Evidence from the Berlin April Wall 13, / 38
14 Probability of Location Choice Indirect u (1) is a function of a Frechet RV. The maximum of a set of Frechet RVs is Frechet as well. Can derive probability of worker choosing to live in i and work in j as ( ) T i E j d ij Q 1 β i (B i w j ) ε π ij = S ) S r=1 s=1 T r E s (d Φ ij (2) rs Qr 1 β (B r w s ) ε Φ Think of a transition matrix: rows where to live, columns where to work Summing over rows or columns give the marginal probabilities. Florian Oswald (Graduate Labor, Sciences The PoEconomics 2017) of Density: Evidence from the Berlin April Wall 13, / 38
15 Locational Probabilities: Interpretation π ij = ( ) ε T i E j d ij Q 1 β (Bi w j ) ε S r=1 S s=1 T r E s (d ij Q 1 β i i ) ε (Br w s ) ε Φ ij Φ Workers facing identical prices {Q i, w j }, commuting costs d ij, and location characteristics {B i, T i, E j } will choose differently between (i, j) Comparative statics are intuitive from this expression: higher amenity B i increases probability of choosing i higher commuting costs decrease it higher average idiosyncratic utilities (in z via T i, E j ) increase it. Florian Oswald (Graduate Labor, Sciences The PoEconomics 2017) of Density: Evidence from the Berlin April Wall 13, / 38
16 Commuting Market Clearing Requires that the measure of workers employed in block j, H Mj, is equal to the measure of workers who choose to commute there. Conditional probability of commuting to j, given living in i is π ij i Then, if H Ri is the measure of workers who reside in i, commuting equlibrium is H Mj = The expression for π ij i is interesting: π ij i = S π ij i H Ri i=1 E j ( wj S s=1 E s d ij ) ε ( ws d is ) ε Supply of workers to j is an increasing function of relative wages w j. Florian Oswald (Graduate Labor, Sciences The PoEconomics 2017) of Density: Evidence from the Berlin April Wall 13, / 38
17 Production Perfect Competition final good producers, CRS. y j = A j H α Mj L1 α Mj A j is productivity in j, L Mj is commercial land used in j. Firms take distribution of z as well as prices given. standard: max A j HMj α H Mj,L L1 α Mj w j H Mj q j L Mj Mj where q j is the price of commercial floor space. FOCS: ( ) 1 αaj 1 α H Mj = LMj (3) L Mj = w j ( (1 α)aj q j ) 1 α HMj Florian Oswald (Graduate Labor, Sciences The PoEconomics 2017) of Density: Evidence from the Berlin April Wall 13, / 38
18 Equilibrium commercial floor space price We impose zero profits: A j H α Mj L1 α Mj w j H Mj q j L Mj = 0 Together with (3) this implies that equilibrium price ( ) α α q j = (1 α) w j 1 α A 1 1 α j higher productivity (or lower wages) allow firms to pay higher rent, while still making zero profits. Florian Oswald (Graduate Labor, Sciences The PoEconomics 2017) of Density: Evidence from the Berlin April Wall 13, / 38
19 Housing Supply Given that blocks can be mixed use (θ i ), we need a no-arbitrage condition Let ξ i 1 denote one plus the tax equivalent of land use regulation for commercial land relative to residential land. θ i = 1 if q i > ξ i Q i θ i [0, 1] if q i = ξ i Q i θ i = 0 if q i < ξ i Q i Remember landlords allocating land to the highest bidder (bid rent approach)? Q i = max {q i, Q i } and Q is the observed floor price. There is a competitive construction sector that uses capital M and land K to supply floorspace. Florian Oswald (Graduate Labor, Sciences The PoEconomics 2017) of Density: Evidence from the Berlin April Wall 13, / 38
20 Land Market Clearing 1 Demand for residential floor space equals supply, (1 θ i )L i E [l i ] H Ri = (1 β) E [w s i] H Ri Q i = (1 θ i )L i 2 Demand for commerical space equals supply ( ) (1 1/α α)aj H Mj = θ j L j q j 3 If 1. and 2. are satisfied, total demand must equal total supply (1 θ i )L i + θ i L i = L i = ϕ i K 1 µ i Florian Oswald (Graduate Labor, Sciences The PoEconomics 2017) of Density: Evidence from the Berlin April Wall 13, / 38
21 General Equilibrium and Agglomeration Multiple Equilibria: Standard problem in urban models. Endogenous agglomeration forces: the density of people/firms/agents affects productivity (+?) and amenities (?) Each workers location decision depends on amenities and productivity But given that productivity is affected by agglomeration forces, we are in a circle. Florian Oswald (Graduate Labor, Sciences The PoEconomics 2017) of Density: Evidence from the Berlin April Wall 13, / 38
22 GE without Agglomeration Start by having no agglomeration. Model as is. This means fixing T i, E j, ϕ i, K i, ξ i, A i, B i at admissible values. then, there exists a unique general equilibrium vector {π M, π R, H, Q, q, w,θ} In other words, if there are no agglomeration forces, the equilibrium is unique. Florian Oswald (Graduate Labor, Sciences The PoEconomics 2017) of Density: Evidence from the Berlin April Wall 13, / 38
23 Adding Agglomeration Standard approach: use employment density in surroundings A j = a j Y λ j where Y j is the travel-time weighted sum of employment density in surrounding blocks. clearly, Y j is an endogenous object of the model. it s worker s location choices. Similarly for Residential externalities: B i = b i Ω η i where Ω i is the weighted sum of residential density in surroundings. Potential for multiple equilibria: if agglomeration is strong relative to exogenous differences across blocks. Florian Oswald (Graduate Labor, Sciences The PoEconomics 2017) of Density: Evidence from the Berlin April Wall 13, / 38
24 Identification of the Model 1 Given observed location decisions and travel times, get commuting probabilities π 2 Get unique wages via commuting market clearing 3 Given wages and observed floor prices, use firm cost function to get productivity 4 Given wages, observed floor prices, residence choices, worker utility gives amenities Florian Oswald (Graduate Labor, Sciences The PoEconomics 2017) of Density: Evidence from the Berlin April Wall 13, / 38
25 Division and Reunification The model has 4 channels which are affected by the Wall: 1 Loss of employment opportunity in East Berlin 2 Loss of commuters from East 3 Loss of production externalities from East 4 Loss of residential externalities from East Operationalized by imposing inifinte commuting costs for affected commutes, and the shutdown of externality parameters for affected areas. Note all endogenous variables adjust in the model after this. New Equilibrium In particular, removing the Wall need not restore the previous equilbrium. Florian Oswald (Graduate Labor, Sciences The PoEconomics 2017) of Density: Evidence from the Berlin April Wall 13, / 38
26 Data Requirements This paper needs a lot of good data. 1 workplace employment (job density per cell) 2 resident employment (density of employed people residing per cell) 3 price of floor space (via Land prices and model assumption) 4 commuting times between cells. 1 they have 15,937 blocks. i.e. they have travel times in minutes for each of 254 million connections (15,937 x 15,937), for car and public transport. Florian Oswald (Graduate Labor, Sciences The PoEconomics 2017) of Density: Evidence from the Berlin April Wall 13, / 38
 of Density: Evidence from the Berlin April Wall 13, 2017 27 /")
27 Evolution of Land Price Gradient Florian Oswald (Graduate Labor, Sciences The PoEconomics 2017) of Density: Evidence from the Berlin April Wall 13, / 38
28 Effects of Division investigate this closer with K ln outcome i = α + I ik β k + ln M i γ + u i k=1 outcome: floor prices, workplace employment, resident employment I ik : indicator for whether bock i is in distance grid k (500m intervals) M i : time-invariante observable characteristics (close to park...) Florian Oswald (Graduate Labor, Sciences The PoEconomics 2017) of Density: Evidence from the Berlin April Wall 13, / 38
29 Effects of Division TABLE I BASELINE DIVISION DIFFERENCE-IN-DIFFERENCE RESULTS ( ) a (1) (2) (3) (4) (5) (6) (7) (8) (9) ln Q ln Q ln Q ln Q ln Q ln EmpR ln EmpR ln EmpW ln EmpW CBD (0 071) (0 071) (0 071) (0 071) (0 077) (0 383) (0 311) (0 408) (0 338) CBD (0 042) (0 047) (0 046) (0 043) (0 050) (0 299) (0 280) (0 293) (0 243) CBD (0 034) (0 039) (0 037) (0 032) (0 034) (0 239) (0 206) (0 241) (0 190) CBD (0 022) (0 033) (0 033) (0 030) (0 026) (0 145) (0 159) (0 199) (0 169) CBD (0 016) (0 024) (0 024) (0 023) (0 020) (0 110) (0 113) (0 151) (0 124) CBD (0 018) (0 019) (0 017) (0 016) (0 016) (0 100) (0 089) (0 130) (0 116) Inner Boundary 1 6 Yes Yes Yes Yes Yes Outer Boundary 1 6 Yes Yes Yes Yes Yes Kudamm 1 6 Yes Yes Yes Yes Block Characteristics Yes Yes Yes District Fixed Effects Yes Yes Yes Yes Yes Yes Yes Yes Observations 6,260 6,260 6,260 6,260 6,260 5,978 5,978 2,844 2,844 R a Q denotes the price of floor space. EmpR denotes employment by residence. EmpW denotes employment by workplace. CBD1 CBD6 are six 500 m distance grid cells for distance from the pre-war CBD. Inner Boundary 1 6 are six 500 m grid cells for distance to the Inner Boundary between East and West Berlin. Outer Boundary 1 6 are six 500 m grid cells for distance to the outer boundary between West Berlin and East Germany. Kudamm 1 6 are six 500 m grid cells for distance to Breitscheid Platz on the Kurfürstendamm. The coefficients on the other distance grid cells are reported in Table A.2 of the Technical Data Appendix. Block characteristics include the log distance to schools, parks and water, the land area of the block, the share of the block s built-up area destroyed during the Second World War, indicators for residential, commercial and industrial land use, and indicators for whether a block includes a government building and urban regeneration policies post-reunification. Heteroscedasticity and Autocorrelation Consistent (HAC) standard errors in parentheses (Conley (1999)). significant at 10%; significant at 5%; significant at 1%. Florian Oswald (Graduate Labor, Sciences The PoEconomics 2017) of Density: Evidence from the Berlin April Wall 13, / 38
30 Effects of Reunification BASELINE REUNIFICATION DIFFERENCE-IN-DIFFERENCE RESULTS ( ) a (1) (2) (3) (4) (5) (6) (7) (8) (9) ln Q ln Q ln Q ln Q ln Q ln EmpR ln EmpR ln EmpW ln EmpW CBD (0 105) (0 090) (0 083) (0 081) (0 088) (0 307) (0 297) (0 479) (0 517) CBD (0 111) (0 096) (0 090) (0 088) (0 087) (0 315) (0 299) (0 326) (0 334) CBD (0 037) (0 033) (0 032) (0 032) (0 028) (0 180) (0 158) (0 216) (0 239) CBD (0 013) (0 023) (0 022) (0 021) (0 020) (0 068) (0 066) (0 161) (0 185) CBD (0 010) (0 015) (0 014) (0 014) (0 013) (0 056) (0 057) (0 118) (0 131) CBD (0 009) (0 012) (0 012) (0 012) (0 011) (0 039) (0 041) (0 095) (0 098) Inner Boundary 1 6 Yes Yes Yes Yes Yes Outer Boundary 1 6 Yes Yes Yes Yes Yes Kudamm 1 6 Yes Yes Yes Yes Block Characteristics Yes Yes Yes District Fixed Effects Yes Yes Yes Yes Yes Yes Yes Yes Observations 7,050 7,050 7,050 7,050 7,050 6,718 6,718 5,602 5,602 R a Q denotes the price of floor space. EmpR denotes employment by residence. EmpW denotes employment by workplace. CBD1 CBD6 are six 500 m distance grid cells for distance from the pre-war CBD. Inner Boundary 1 6 are six 500 m grid cells for distance to the Inner Boundary between East and West Berlin. Outer Boundary 1 6 are six 500 m grid cells for distance to the outer boundary between West Berlin and East Germany. Kudamm 1 6 are six 500 m grid cells for distance to Breitscheid Platz on the Kurfürstendamm. The coefficients on the other distance grid cells are reported in Table A.4 of the Technical Data Appendix. Block characteristics include the log distance to schools, parks and water, the land area of the block, the share of the block s built-up area destroyed during the Second World War, indicators for residential, commercial and industrial land use, and indicators for whether a block includes a government building and urban regeneration policies post-reunification. Heteroscedasticity and Autocorrelation Consistent (HAC) standard errors in parentheses (Conley (1999)). significant at 10%; significant at 5%; significant at 1%. Florian Oswald (Graduate Labor, Sciences The PoEconomics 2017) of Density: Evidence from the Berlin April Wall 13, / 38
31 Gravity equation Taking the log of commuting probabilities (2) allows to write ln π ij = ντ ij + ϑ i + ς j Residence fixed effect ϑ i : B i, T i, Q i workplce fixed effect ς j : w j, E j denominator goes into FEs commuting costs are d ij = e κτ ij. So ν = εκ is semi-elasticity of commuting flow wrt travel times. In commuting micro data, find ν = εκ Additional minute of travel time reduces flow of commuters by 7%. Later use that estimate to set Frechet parameter ε Florian Oswald (Graduate Labor, Sciences The PoEconomics 2017) of Density: Evidence from the Berlin April Wall 13, / 38
32 Model Checks: First set of overidentication Florian Oswald (Graduate Labor, Sciences The PoEconomics 2017) of Density: Evidence from the Berlin April Wall 13, / 38
33 Counterfactuals without Agglomeration Calibrate the model with Gravity equation results. Demonstrate that a model with exogenous amenities and productivity is unable to explain the data of before/after division. There is of course some effect, since workers can t commute anymore. It s just too small. They predict 1986 floor prices with the model, and compare to the 1936 baseline Data showed a change at the CBD of -0.8 log points. Column 1 of Effects of divisoin slide. This model shows -0.4 log points. About half the effect is missing. Florian Oswald (Graduate Labor, Sciences The PoEconomics 2017) of Density: Evidence from the Berlin April Wall 13, / 38
34 Structural Estimation Proportional change in amenities and productivity can be written as functions of parameters and data. Given those, it is possible to write moment conditions. Identifying assumption: changes in gradient of economic activity in West berlin after Wall relative to pre-war CDB are explained by mechanisms of themodel ie. changes in commuting access, production and residential externalities not changes in production/residential fundamentals. Additional moments conditions: 1 number of workers commuting for less than 30 min in model is equal to number in data. 2 variance of log wages in model is equal to variance in data. Florian Oswald (Graduate Labor, Sciences The PoEconomics 2017) of Density: Evidence from the Berlin April Wall 13, / 38
35 GMM Results TABLE V GENERALIZED METHOD OF MOMENTS (GMM) ESTIMATION RESULTS a (3) (1) (2) Division and Division Reunification Reunification Efficient Efficient Efficient GMM GMM GMM Commuting Travel Time Elasticity (κε) (0 0016) (0 0016) (0 0016) Commuting Heterogeneity (ε) (0 0939) (0 1005) (0 0934) Productivity Elasticity (λ) (0 0064) (0 0079) (0 0054) Productivity Decay (δ) (0 1030) (0 3525) (0 0782) Residential Elasticity (η) (0 0092) (0 0313) (0 0083) Residential Decay (ρ) (0 2968) (0 3979) (0 1741) Florian a Oswald Generalized (Graduate Method Labor, of Moments Sciences The (GMM) PoEconomics 2017) estimates. of Density: Heteroscedasticity Evidence from and the Autocorrelation Berlin April Wall 13, Consistent 2017 (HAC) 35 / 38
36 Externalities and Commuting Costs TABLE VI EXTERNALITIES AND COMMUTING COSTS a (1) (2) (3) Production Residential Utility After Externalities Externalities Commuting (1 e δτ ) (1 e ρτ ) (1 e κτ ) 0minutes minute minutes minutes minutes minutes minutes minutes minutes minutes a Proportional reduction in production and residential externalities with travel time and proportional reduction in utility from commuting with travel time. Travel time is measured in minutes. Results are based on the pooled efficient FlorianGMM Oswald parameter (Graduate estimates: Labor, Sciences δ = , The PoEconomics ρ 2017) = , of κ Density: = Evidence from the Berlin April Wall 13, / 38
37 Counterfactuals WITH Agglomeration: much better! TABLE VII COUNTERFACTUALS a (1) (2) (3) (4) (5) (6) (7) ln QC ln QC ln QC ln QC ln QC ln QC ln QC CBD (0 052) (0 032) (0 060) (0 051) (0 041) (0 052) (0 043) CBD (0 034) (0 025) (0 019) (0 029) (0 028) (0 044) (0 027) CBD (0 036) (0 030) (0 030) (0 036) (0 031) (0 045) (0 031) CBD (0 026) (0 019) (0 022) (0 031) (0 021) (0 042) (0 021) CBD (0 032) (0 022) (0 027) (0 039) (0 032) (0 038) (0 032) CBD (0 025) (0 016) (0 022) (0 029) (0 024) (0 034) (0 023) Counterfactuals Yes Yes Yes Yes Yes Yes Yes Agglomeration Effects Yes Yes Yes Yes Yes Yes Yes Observations 6,260 6,260 6,260 6,260 7,050 6,260 7,050 R a Columns (1) (6) are based on the parameter estimates pooling division and reunification from Table V. Column(7)isbasedontheparameterestimatesfordivisionfrom Table V. QC denotes counterfactual floor prices.column(1)simulates division using our estimates of production and residential externalities and 1936 fundamentals.column (2) simulates division using our estimates of production externalities and 1936 fundamentals but setting residential externalities to zero. Column (3) simulates division using our estimates of residential externalities and 1936 fundamentals but setting production externalities to zero. Column (4) simulates division using our estimates of production and residential externalities and 1936 fundamentals but halving their rates of spatial decay with travel time. Column (5) simulates reunification using our estimates of production and residential externalities, 1986 fundamentals for West Berlin, and 2006 fundamentals for East Berlin. Column (6) simulates reunification using our estimates of production and residential externalities, 1986 fundamentals for West Berlin and 1936 fundamentals for East Berlin. Column (7) simulates reunification using division rather than pooled parameter estimates, 1986 fundamentals for West Berlin, and 2006 fundamentals for East Berlin. CBD 1 CBD6 are six 500 m distance grid cells for distance from the pre-war CBD. Heteroscedasticity and Autocorrelation Consistent (HAC) standard errors in parentheses (Conley (1999)). significant at 10%; significant at 5%; significant at 1%. Florian Oswald (Graduate Labor, Sciences The PoEconomics 2017) of Density: Evidence from the Berlin April Wall 13, / 38
38 References Gabriel M Ahlfeldt, Stephen J Redding, Daniel M Sturm, and Nikolaus Wolf. The economics of density: Evidence from the berlin wall. Econometrica, URL _all.pdf. Jonathan Eaton and Samuel Kortum. Technology, geography, and trade. Econometrica, 70(5): , Gordon H Hanson. Increasing returns, trade and the regional structure of wages. The Economic Journal, pages , Florian Oswald (Graduate Labor, Sciences The PoEconomics 2017) of Density: Evidence from the Berlin April Wall 13, / 38
NBER WORKING PAPER SERIES THE ECONOMICS OF DENSITY: EVIDENCE FROM THE BERLIN WALL
 NBER WORKING PAPER SERIES THE ECONOMICS OF DENSITY: EVIDENCE FROM THE BERLIN WALL Gabriel M. Ahlfeldt Stephen J. Redding Daniel M. Sturm Nikolaus Wolf Working Paper 20354 http://www.nber.org/papers/w20354
Economic Development and the Spatial Allocation of Labor: Evidence From Indonesia. Gharad Bryan (LSE) Melanie Morten (Stanford) May 19, 2015
 Melanie Morten (Stanford) May 19, 2015") Economic Development and the Spatial Allocation of Labor: Evidence From Indonesia Gharad Bryan (LSE) Melanie Morten (Stanford) May 19, 2015 Gains from Spatial Reallocation of Labor? Remove observables
Economic Development and the Spatial Allocation of Labor: Evidence From Indonesia Gharad Bryan (LSE) Melanie Morten (Stanford) May 19, 2015 Gains from Spatial Reallocation of Labor? Remove observables
CEP Discussion Paper No 1154 June 2012
 ISSN 2042-2695 CEP Discussion Paper No 1154 June 2012 The Economics of Density: Evidence from the Berlin Wall Gabriel M Ahlfeldt, Stephen J. Redding, Daniel M. Sturm and Nikolaus Wolf Abstract This paper
Commuting, public transport investments and gentrification
 Commuting, public transport investments and gentrification Evidence from Copenhagen Ismir Mulalic Technical University of Denmark and Kraks Fond June 12, 2018 Ismir Mulalic (DTU and Kraks Fond) Commuting
The Geography of Development: Evaluating Migration Restrictions and Coastal Flooding
 The Geography of Development: Evaluating Migration Restrictions and Coastal Flooding Klaus Desmet SMU Dávid Krisztián Nagy Princeton University Esteban Rossi-Hansberg Princeton University World Bank, February
The Monocentric City Model
 1 / 58 The Monocentric City Model Nathan Schiff Shanghai University of Finance and Economics Graduate Urban Economics, Lecture 2 March 7, 2019 2 / 58 Introduction One of the biggest questions in urban
Eaton Kortum Model (2002)
") Eaton Kortum Model (2002) Seyed Ali Madanizadeh Sharif U. of Tech. November 20, 2015 Seyed Ali Madanizadeh (Sharif U. of Tech.) Eaton Kortum Model (2002) November 20, 2015 1 / 41 Introduction Eaton and
Eaton Kortum Model (2002) Seyed Ali Madanizadeh Sharif U. of Tech. November 20, 2015 Seyed Ali Madanizadeh (Sharif U. of Tech.) Eaton Kortum Model (2002) November 20, 2015 1 / 41 Introduction Eaton and
I-1. The slope of the bid-price function, P{u}, is - t / H. Use Equation (35) to derive general
 to derive general") ECN 741, Professor Yinger Exercises Part I. Bid Functions and Density Functions I-1. The slope of the bid-price function, P{u}, is - t / H. Use Equation (35) to derive general expression for the slope
ECN 741, Professor Yinger Exercises Part I. Bid Functions and Density Functions I-1. The slope of the bid-price function, P{u}, is - t / H. Use Equation (35) to derive general expression for the slope
A New Central Station for a UnifiedCity: Predicting Impact on Property Prices for Urban Railway Network Extensions in Berlin
 A New Central Station for a UnifiedCity: Predicting Impact on Property Prices for Urban Railway Network Extensions in Berlin Gabriel Ahlfeldt,University of Hamburg 1 Contents A. Research Motivation & Basic
Modern Urban and Regional Economics
 Modern Urban and Regional Economics SECOND EDITION Philip McCann OXFORD UNIVERSITY PRESS Contents List of figures List of tables Introduction xii xiv xvii Part I Urban and Regional Economic Models and
CEMMAP Masterclass: Empirical Models of Comparative Advantage and the Gains from Trade 1 Lecture 3: Gravity Models
 CEMMAP Masterclass: Empirical Models of Comparative Advantage and the Gains from Trade 1 Lecture 3: Gravity Models Dave Donaldson (MIT) CEMMAP MC July 2018 1 All material based on earlier courses taught
Urban Economics. Yves Zenou Research Institute of Industrial Economics. July 17, 2006
 Urban Economics Yves Zenou Research Institute of Industrial Economics July 17, 2006 1. The basic model with identical agents We assume that the city is linear and monocentric. This means that the city
Cross-Country Differences in Productivity: The Role of Allocation and Selection
 Cross-Country Differences in Productivity: The Role of Allocation and Selection Eric Bartelsman, John Haltiwanger & Stefano Scarpetta American Economic Review (2013) Presented by Beatriz González January
MIT PhD International Trade Lecture 15: Gravity Models (Theory)
") 14.581 MIT PhD International Trade Lecture 15: Gravity Models (Theory) Dave Donaldson Spring 2011 Introduction to Gravity Models Recall that in this course we have so far seen a wide range of trade models:
14.581 MIT PhD International Trade Lecture 15: Gravity Models (Theory) Dave Donaldson Spring 2011 Introduction to Gravity Models Recall that in this course we have so far seen a wide range of trade models:
International Trade Lecture 16: Gravity Models (Theory)
") 14.581 International Trade Lecture 16: Gravity Models (Theory) 14.581 Week 9 Spring 2013 14.581 (Week 9) Gravity Models (Theory) Spring 2013 1 / 44 Today s Plan 1 The Simplest Gravity Model: Armington
14.581 International Trade Lecture 16: Gravity Models (Theory) 14.581 Week 9 Spring 2013 14.581 (Week 9) Gravity Models (Theory) Spring 2013 1 / 44 Today s Plan 1 The Simplest Gravity Model: Armington
Commuting, Migration and Local Employment Elasticities
 Commuting, Migration and Local Employment Elasticities Ferdinando Monte Georgetown University Stephen J. Redding Princeton University Esteban Rossi-Hansberg Princeton University April 24, 2015 Abstract
Melitz, M. J. & G. I. P. Ottaviano. Peter Eppinger. July 22, 2011
 Melitz, M. J. & G. I. P. Ottaviano University of Munich July 22, 2011 & 1 / 20 & & 2 / 20 My Bachelor Thesis: Ottaviano et al. (2009) apply the model to study gains from the euro & 3 / 20 Melitz and Ottaviano
Commuting, Migration and Local Employment Elasticities
 Commuting, Migration and Local Employment Elasticities Ferdinando Monte Georgetown University Stephen J. Redding Princeton University Esteban Rossi-Hansberg Princeton University June 15, 2015 Abstract
1 The Basic RBC Model
 IHS 2016, Macroeconomics III Michael Reiter Ch. 1: Notes on RBC Model 1 1 The Basic RBC Model 1.1 Description of Model Variables y z k L c I w r output level of technology (exogenous) capital at end of
Melitz, M. J. & G. I. P. Ottaviano. Peter Eppinger. July 22, 2011
 Melitz, M. J. & G. I. P. Ottaviano University of Munich July 22, 2011 & 1 / 20 & & 2 / 20 My Bachelor Thesis: Ottaviano et al. (2009) apply the model to study gains from the euro & 3 / 20 Melitz and Ottaviano
Econometrics in a nutshell: Variation and Identification Linear Regression Model in STATA. Research Methods. Carlos Noton.
 1/17 Research Methods Carlos Noton Term 2-2012 Outline 2/17 1 Econometrics in a nutshell: Variation and Identification 2 Main Assumptions 3/17 Dependent variable or outcome Y is the result of two forces:
Cities in Bad Shape: Urban Geometry in India
 Cities in Bad Shape: Urban Geometry in India Mariaflavia Harari presented by Federico Curci September 15, 2015 Harari Cities in Bad Shape September 15, 2015 1 / 19 Research question Estimate effect of
(a) Write down the Hamilton-Jacobi-Bellman (HJB) Equation in the dynamic programming
 Write down the Hamilton-Jacobi-Bellman (HJB) Equation in the dynamic programming") 1. Government Purchases and Endogenous Growth Consider the following endogenous growth model with government purchases (G) in continuous time. Government purchases enhance production, and the production
1. Government Purchases and Endogenous Growth Consider the following endogenous growth model with government purchases (G) in continuous time. Government purchases enhance production, and the production
Modelling Czech and Slovak labour markets: A DSGE model with labour frictions
 Modelling Czech and Slovak labour markets: A DSGE model with labour frictions Daniel Němec Faculty of Economics and Administrations Masaryk University Brno, Czech Republic nemecd@econ.muni.cz ESF MU (Brno)
Commuting, Migration, and Rural Development
 MPRA Munich Personal RePEc Archive Commuting, Migration, and Rural Development Ayele Gelan Socio-economic Research Program, The Macaulay Institute, Aberdeen, UK 003 Online at http://mpra.ub.uni-muenchen.de/903/
Subject: Note on spatial issues in Urban South Africa From: Alain Bertaud Date: Oct 7, A. Spatial issues
 Page 1 of 6 Subject: Note on spatial issues in Urban South Africa From: Alain Bertaud Date: Oct 7, 2009 A. Spatial issues 1. Spatial issues and the South African economy Spatial concentration of economic
4- Current Method of Explaining Business Cycles: DSGE Models. Basic Economic Models
 4- Current Method of Explaining Business Cycles: DSGE Models Basic Economic Models In Economics, we use theoretical models to explain the economic processes in the real world. These models de ne a relation
Lecture 2: Firms, Jobs and Policy
 Lecture 2: Firms, Jobs and Policy Economics 522 Esteban Rossi-Hansberg Princeton University Spring 2014 ERH (Princeton University ) Lecture 2: Firms, Jobs and Policy Spring 2014 1 / 34 Restuccia and Rogerson
NBER WORKING PAPER SERIES COMMUTING, MIGRATION AND LOCAL EMPLOYMENT ELASTICITIES. Ferdinando Monte Stephen J. Redding Esteban Rossi-Hansberg
 NBER WORKING PAPER SERIES COMMUTING, MIGRATION AND LOCAL EMPLOYMENT ELASTICITIES Ferdinando Monte Stephen J. Redding Esteban Rossi-Hansberg Working Paper 21706 http://www.nber.org/papers/w21706 NATIONAL
Cities in Bad Shape: Urban Geometry in India
 Cities in Bad Shape: Urban Geometry in India Mariaflavia Harari MIT IGC Cities Research Group Conference 21 May 2015 Introduction Why Study City Shape A wide range of factors determine intra-urban commuting
Class Notes on New Economic Geography Models
 Class Notes on New Economic Geography Models Econ 8401-T.Holmes (incomplete) 1 Overview Last class we discussed various models of trade with increasing returns, e.g. those based on Dixit and Stiglitz models.
Location theory and clusters. Dr. Hans Koster Assistant professor
 Dr. Hans Koster Assistant professor 1 Internal economies of scale (EofS) can lead to Trading cities (EofS in transport) Factory cities (EofS in production) But where do cities emerge? Why is Colombo located
ECO 2901 EMPIRICAL INDUSTRIAL ORGANIZATION
 ECO 2901 EMPIRICAL INDUSTRIAL ORGANIZATION Lecture 7 & 8: Models of Competition in Prices & Quantities Victor Aguirregabiria (University of Toronto) Toronto. Winter 2018 Victor Aguirregabiria () Empirical
problem. max Both k (0) and h (0) are given at time 0. (a) Write down the Hamilton-Jacobi-Bellman (HJB) Equation in the dynamic programming
 and h (0) are given at time 0. (a) Write down the Hamilton-Jacobi-Bellman (HJB) Equation in the dynamic programming") 1. Endogenous Growth with Human Capital Consider the following endogenous growth model with both physical capital (k (t)) and human capital (h (t)) in continuous time. The representative household solves
1. Endogenous Growth with Human Capital Consider the following endogenous growth model with both physical capital (k (t)) and human capital (h (t)) in continuous time. The representative household solves
WORKING PAPER NO CONGESTION, AGGLOMERATION, AND THE STRUCTURE OF CITIES
 WORKING PAPER NO. 16-13 CONGESTION, AGGLOMERATION, AND THE STRUCTURE OF CITIES Jeffrey C. Brinkman Research Department Federal Reserve Bank of Philadelphia May 2016 Congestion, Agglomeration, and the Structure
Urban unemployment and job search
 Urban unemployment and job search Yves Zenou Research Institute of Industrial Economics July 3, 2006 1. Introduction 2. A benchmark model There is a continuum of ex ante identical workers whose mass is
Commuting, Migration and Local Employment Elasticities
 Commuting, Migration and Local Employment Elasticities Ferdinando Monte Georgetown University Stephen J. Redding Princeton University October 30, 2016 Esteban Rossi-Hansberg Princeton University Abstract
Johns Hopkins University Fall APPLIED ECONOMICS Regional Economics
 Johns Hopkins University Fall 2017 Applied Economics Sally Kwak APPLIED ECONOMICS 440.666 Regional Economics In this course, we will develop a coherent framework of theories and models in the field of
Aggregate Demand, Idle Time, and Unemployment
 Aggregate Demand, Idle Time, and Unemployment Pascal Michaillat (LSE) & Emmanuel Saez (Berkeley) September 2014 1 / 44 Motivation 11% Unemployment rate 9% 7% 5% 3% 1974 1984 1994 2004 2014 2 / 44 Motivation
Aggregate Demand, Idle Time, and Unemployment
 Aggregate Demand, Idle Time, and Unemployment Pascal Michaillat (LSE) & Emmanuel Saez (Berkeley) July 2014 1 / 46 Motivation 11% Unemployment rate 9% 7% 5% 3% 1974 1984 1994 2004 2014 2 / 46 Motivation
Land Use Modeling at ABAG. Mike Reilly October 3, 2011
 Land Use Modeling at ABAG Mike Reilly michaelr@abag.ca.gov October 3, 2011 Overview What and Why Details Integration Use Visualization Questions What is a Land Use Model? Statistical relationships between
Spatial profile of three South African cities
 Spatial Outcomes Workshop South African Reserve Bank Conference Centre Pretoria September 29-30, 2009 Spatial profile of three South African cities by Alain Bertaud September 29 Email: duatreb@msn.com
On Spatial Dynamics. Klaus Desmet Universidad Carlos III. and. Esteban Rossi-Hansberg Princeton University. April 2009
 On Spatial Dynamics Klaus Desmet Universidad Carlos and Esteban Rossi-Hansberg Princeton University April 2009 Desmet and Rossi-Hansberg () On Spatial Dynamics April 2009 1 / 15 ntroduction Economists
Global Value Chain Participation and Current Account Imbalances
 Global Value Chain Participation and Current Account Imbalances Johannes Brumm University of Zurich Georgios Georgiadis European Central Bank Johannes Gräb European Central Bank Fabian Trottner Princeton
Endogenous Information Choice
 Endogenous Information Choice Lecture 7 February 11, 2015 An optimizing trader will process those prices of most importance to his decision problem most frequently and carefully, those of less importance
VALUATION USING HOUSEHOLD PRODUCTION LECTURE PLAN 15: APRIL 14, 2011 Hunt Allcott
 VALUATION USING HOUSEHOLD PRODUCTION 14.42 LECTURE PLAN 15: APRIL 14, 2011 Hunt Allcott PASTURE 1: ONE SITE Introduce intuition via PowerPoint slides Draw demand curve with nearby and far away towns. Question:
Employment Decentralization and Commuting in U.S. Metropolitan Areas. Symposium on the Work of Leon Moses
 Employment Decentralization and Commuting in U.S. Metropolitan Areas Alex Anas Professor of Economics University at Buffalo Symposium on the Work of Leon Moses February 7, 2014 9:30-11:15am, and 2:30-4:30pm
Wage Inequality, Labor Market Participation and Unemployment
 Wage Inequality, Labor Market Participation and Unemployment Testing the Implications of a Search-Theoretical Model with Regional Data Joachim Möller Alisher Aldashev Universität Regensburg www.wiwi.uni-regensburg.de/moeller/
First-Best Dynamic Assignment of Commuters with Endogenous Heterogeneities in a Corridor Network
 First-Best Dynamic Assignment of Commuters with Endogenous Heterogeneities in a Corridor Network ISTTT 22@Northwestern University Minoru Osawa, Haoran Fu, Takashi Akamatsu Tohoku University July 24, 2017
Quantitative Spatial Economics
 Annual Review of Economics Quantitative Spatial Economics Stephen J. Redding and Esteban Rossi-Hansberg Department of Economics and Woodrow Wilson School of Public and International Affairs, Princeton
ECO 310: Empirical Industrial Organization Lecture 2 - Estimation of Demand and Supply
 ECO 310: Empirical Industrial Organization Lecture 2 - Estimation of Demand and Supply Dimitri Dimitropoulos Fall 2014 UToronto 1 / 55 References RW Section 3. Wooldridge, J. (2008). Introductory Econometrics:
The TransPacific agreement A good thing for VietNam?
 The TransPacific agreement A good thing for VietNam? Jean Louis Brillet, France For presentation at the LINK 2014 Conference New York, 22nd 24th October, 2014 Advertisement!!! The model uses EViews The
Dynamics of Firms and Trade in General Equilibrium. Robert Dekle, Hyeok Jeong and Nobuhiro Kiyotaki USC, Seoul National University and Princeton
 Dynamics of Firms and Trade in General Equilibrium Robert Dekle, Hyeok Jeong and Nobuhiro Kiyotaki USC, Seoul National University and Princeton Figure a. Aggregate exchange rate disconnect (levels) 28.5
Internation1al Trade
 4.58 International Trade Class notes on 4/8/203 The Armington Model. Equilibrium Labor endowments L i for i = ; :::n CES utility ) CES price index P = i= (w i ij ) P j n Bilateral trade ows follow gravity
1. Constant-elasticity-of-substitution (CES) or Dixit-Stiglitz aggregators. Consider the following function J: J(x) = a(j)x(j) ρ dj
 or Dixit-Stiglitz aggregators. Consider the following function J: J(x) = a(j)x(j) ρ dj") Macro II (UC3M, MA/PhD Econ) Professor: Matthias Kredler Problem Set 1 Due: 29 April 216 You are encouraged to work in groups; however, every student has to hand in his/her own version of the solution.
Macro II (UC3M, MA/PhD Econ) Professor: Matthias Kredler Problem Set 1 Due: 29 April 216 You are encouraged to work in groups; however, every student has to hand in his/her own version of the solution.
The effects of public transportation on urban form
 Abstract The effects of public transportation on urban form Leonardo J. Basso Departamento de Ingeniería Civil, Universidad de Chile ljbasso@ing.uchile.cl Matías Navarro Centro de Desarrollo Urbano Sustentable
Decentralisation and its efficiency implications in suburban public transport
 Decentralisation and its efficiency implications in suburban public transport Daniel Hörcher 1, Woubit Seifu 2, Bruno De Borger 2, and Daniel J. Graham 1 1 Imperial College London. South Kensington Campus,
International Trade and Agglomeration in Asymmetric World: Core-Periphery Approach
 Research Motivation Our Results/Contribution International Trade and Agglomeration in Asymmetric World: Core-Periphery Approach Alexander V. Sidorov Sobolev Institute of Mathematics, Novosibirsk, Russia
STATE UNIVERSITY OF NEW YORK AT ALBANY Department of Economics
 STATE UNIVERSITY OF NEW YORK AT ALBANY Department of Economics Ph. D. Comprehensive Examination: Macroeconomics Fall, 202 Answer Key to Section 2 Questions Section. (Suggested Time: 45 Minutes) For 3 of
Granular Comparative Advantage
 Granular Comparative Advantage Cecile Gaubert cecile.gaubert@berkeley.edu Oleg Itskhoki itskhoki@princeton.edu Stanford University March 2018 1 / 26 Exports are Granular Freund and Pierola (2015): Export
Paul Krugman s New Economic Geography: past, present and future. J.-F. Thisse CORE-UCLouvain (Belgium)
") Paul Krugman s New Economic Geography: past, present and future J.-F. Thisse CORE-UCLouvain (Belgium) Economic geography seeks to explain the riddle of unequal spatial development (at different spatial
Paul Krugman s New Economic Geography: past, present and future J.-F. Thisse CORE-UCLouvain (Belgium) Economic geography seeks to explain the riddle of unequal spatial development (at different spatial
The Harris-Todaro model
 Yves Zenou Research Institute of Industrial Economics July 3, 2006 The Harris-Todaro model In two seminal papers, Todaro (1969) and Harris and Todaro (1970) have developed a canonical model of rural-urban
Modeling firms locational choice
 Modeling firms locational choice Giulio Bottazzi DIMETIC School Pécs, 05 July 2010 Agglomeration derive from some form of externality. Drivers of agglomeration can be of two types: pecuniary and non-pecuniary.
Real Business Cycle Model (RBC)
") Real Business Cycle Model (RBC) Seyed Ali Madanizadeh November 2013 RBC Model Lucas 1980: One of the functions of theoretical economics is to provide fully articulated, artificial economic systems that
Real Business Cycle Model (RBC) Seyed Ali Madanizadeh November 2013 RBC Model Lucas 1980: One of the functions of theoretical economics is to provide fully articulated, artificial economic systems that
Welfare in the Eaton-Kortum Model of International Trade
 Welfare in the Eaton-Kortum Model of International Trade Scott French October, 215 Abstract I show that the welfare effects of changes in technologies or trade costs in the workhorse Ricardian model of
General Equilibrium and Welfare
 and Welfare Lectures 2 and 3, ECON 4240 Spring 2017 University of Oslo 24.01.2017 and 31.01.2017 1/37 Outline General equilibrium: look at many markets at the same time. Here all prices determined in the
Rising Wage Inequality and the Effectiveness of Tuition Subsidy Policies:
 Rising Wage Inequality and the Effectiveness of Tuition Subsidy Policies: Explorations with a Dynamic General Equilibrium Model of Labor Earnings based on Heckman, Lochner and Taber, Review of Economic
Assumption 5. The technology is represented by a production function, F : R 3 + R +, F (K t, N t, A t )
") 6. Economic growth Let us recall the main facts on growth examined in the first chapter and add some additional ones. (1) Real output (per-worker) roughly grows at a constant rate (i.e. labor productivity
6. Economic growth Let us recall the main facts on growth examined in the first chapter and add some additional ones. (1) Real output (per-worker) roughly grows at a constant rate (i.e. labor productivity
The structure of cities
 The structure of cities G Université Paris-Dauphine et University of British Columbia Paris, July 6, 2009 (Université Paris-Dauphine The structure et University of cities of British Columbia) Paris, July
Neoclassical Business Cycle Model
 Neoclassical Business Cycle Model Prof. Eric Sims University of Notre Dame Fall 2015 1 / 36 Production Economy Last time: studied equilibrium in an endowment economy Now: study equilibrium in an economy
h Edition Money in Search Equilibrium
 In the Name of God Sharif University of Technology Graduate School of Management and Economics Money in Search Equilibrium Diamond (1984) Navid Raeesi Spring 2014 Page 1 Introduction: Markets with Search
The Basic New Keynesian Model. Jordi Galí. November 2010
 The Basic New Keynesian Model by Jordi Galí November 2 Motivation and Outline Evidence on Money, Output, and Prices: Short Run E ects of Monetary Policy Shocks (i) persistent e ects on real variables (ii)
14.461: Technological Change, Lecture 4 Technology and the Labor Market
 14.461: Technological Change, Lecture 4 Technology and the Labor Market Daron Acemoglu MIT September 20, 2016. Daron Acemoglu (MIT) Technology and the Labor Market September 20, 2016. 1 / 51 Technology
Lecture 5: Labour Economics and Wage-Setting Theory
 Lecture 5: Labour Economics and Wage-Setting Theory Spring 2017 Lars Calmfors Literature: Chapter 7 Cahuc-Carcillo-Zylberberg: 435-445 1 Topics Weakly efficient bargaining Strongly efficient bargaining
International Prices and Exchange Rates Econ 2530b, Gita Gopinath
 International Prices and Exchange Rates Econ 2530b, Gita Gopinath Model variable mark-ups CES demand: Constant mark-ups: ( ) εin µ in = log ε in 1 Given that markups are constant, Γ in = 0. ( ) θ = log.
Endogenous information acquisition
 Endogenous information acquisition ECON 101 Benhabib, Liu, Wang (2008) Endogenous information acquisition Benhabib, Liu, Wang 1 / 55 The Baseline Mode l The economy is populated by a large representative
Quantifying the Losses from International Trade
 Quantifying the Losses from International Trade Spencer Lyon NYU Michael E. Waugh NYU and NBER June 23, 2017 0/23 Big Picture: The Backlash Against Trade Hard to deny that the benefits of globalization
Infill and the microstructure of urban expansion
 Infill and the microstructure of urban expansion Stephen Sheppard Williams College Homer Hoyt Advanced Studies Institute January 12, 2007 Presentations and papers available at http://www.williams.edu/economics/urbangrowth/homepage.htm
Lecture 1: Labour Economics and Wage-Setting Theory
 ecture 1: abour Economics and Wage-Setting Theory Spring 2015 ars Calmfors iterature: Chapter 1 Cahuc-Zylberberg (pp 4-19, 28-29, 35-55) 1 The choice between consumption and leisure U = U(C,) C = consumption
Practice Questions for Mid-Term I. Question 1: Consider the Cobb-Douglas production function in intensive form:
 Practice Questions for Mid-Term I Question 1: Consider the Cobb-Douglas production function in intensive form: y f(k) = k α ; α (0, 1) (1) where y and k are output per worker and capital per worker respectively.
Economic Growth: Lecture 9, Neoclassical Endogenous Growth
 14.452 Economic Growth: Lecture 9, Neoclassical Endogenous Growth Daron Acemoglu MIT November 28, 2017. Daron Acemoglu (MIT) Economic Growth Lecture 9 November 28, 2017. 1 / 41 First-Generation Models
Leveraging Urban Mobility Strategies to Improve Accessibility and Productivity of Cities
 Leveraging Urban Mobility Strategies to Improve Accessibility and Productivity of Cities Aiga Stokenberga World Bank GPSC African Regional Workshop May 15, 2018 Roadmap 1. Africa s urbanization and its
Master 2 Macro I. Lecture notes #9 : the Mortensen-Pissarides matching model
 2012-2013 Master 2 Macro I Lecture notes #9 : the Mortensen-Pissarides matching model Franck Portier (based on Gilles Saint-Paul lecture notes) franck.portier@tse-fr.eu Toulouse School of Economics Version
The Origins of Firm Heterogeneity: A Production Network Approach
 The Origins of Firm Heterogeneity: A Production Network Approach A. Bernard E. Dhyne G. Magerman K. Manova A. Moxnes Tuck@Dartmouth NBB ECARES Oxford Oslo CEPR, NBER UMons NBB CEPR CEPR Princeton, September
Dynamics and Monetary Policy in a Fair Wage Model of the Business Cycle
 Dynamics and Monetary Policy in a Fair Wage Model of the Business Cycle David de la Croix 1,3 Gregory de Walque 2 Rafael Wouters 2,1 1 dept. of economics, Univ. cath. Louvain 2 National Bank of Belgium
Commuting, Migration and Local Employment Elasticities
 Commuting, Migration and Local Employment Elasticities Ferdinando Monte y Georgetown University Stephen J. Redding z Princeton University May 7, 2018 Esteban Rossi-Hansberg x Princeton University Abstract
The Ramsey Model. (Lecture Note, Advanced Macroeconomics, Thomas Steger, SS 2013)
") The Ramsey Model (Lecture Note, Advanced Macroeconomics, Thomas Steger, SS 213) 1 Introduction The Ramsey model (or neoclassical growth model) is one of the prototype models in dynamic macroeconomics.
The Ramsey Model (Lecture Note, Advanced Macroeconomics, Thomas Steger, SS 213) 1 Introduction The Ramsey model (or neoclassical growth model) is one of the prototype models in dynamic macroeconomics.
The Basic New Keynesian Model. Jordi Galí. June 2008
 The Basic New Keynesian Model by Jordi Galí June 28 Motivation and Outline Evidence on Money, Output, and Prices: Short Run E ects of Monetary Policy Shocks (i) persistent e ects on real variables (ii)
Essays in Economic Geography and Development. Dominick Gabriel Bartelme. A dissertation submitted in partial satisfaction of the
 Essays in Economic Geography and Development by Dominick Gabriel Bartelme A dissertation submitted in partial satisfaction of the requirements for the degree of Doctor of Philosophy in Economics in the
Explaining Rising Wage Inequality: Explorations With a Dynamic General Equilibrium Model of Labor Earnings with Heterogeneous Agents
 Explaining Rising Wage Inequality: Explorations With a Dynamic General Equilibrium Model of Labor Earnings with Heterogeneous Agents James J. Heckman, Lance Lochner, and Christopher Taber April 22, 2009
Location Patterns of Manufacturing Industries in Tunisia
 Location Patterns of Manufacturing Industries in Tunisia Wided Mattoussi WIDER development conference: Think development Think WIDER Parallel session Made in Africa Motivation Firms enjoy positive externalities
Field Course Descriptions
 Field Course Descriptions Ph.D. Field Requirements 12 credit hours with 6 credit hours in each of two fields selected from the following fields. Each class can count towards only one field. Course descriptions
Online Appendix The Growth of Low Skill Service Jobs and the Polarization of the U.S. Labor Market. By David H. Autor and David Dorn
 Online Appendix The Growth of Low Skill Service Jobs and the Polarization of the U.S. Labor Market By David H. Autor and David Dorn 1 2 THE AMERICAN ECONOMIC REVIEW MONTH YEAR I. Online Appendix Tables
1 Bewley Economies with Aggregate Uncertainty
 1 Bewley Economies with Aggregate Uncertainty Sofarwehaveassumedawayaggregatefluctuations (i.e., business cycles) in our description of the incomplete-markets economies with uninsurable idiosyncratic risk
Granular Comparative Advantage
 Granular Comparative Advantage Cecile Gaubert cecile.gaubert@berkeley.edu Oleg Itskhoki itskhoki@princeton.edu RASA IX International Conference Washington DC November 218 1 / 28 Exports are Granular Freund
The New Keynesian Model: Introduction
 The New Keynesian Model: Introduction Vivaldo M. Mendes ISCTE Lisbon University Institute 13 November 2017 (Vivaldo M. Mendes) The New Keynesian Model: Introduction 13 November 2013 1 / 39 Summary 1 What
Trade and the political economy of redistribution
 Trade and the political economy of redistribution G. Vannoorenberghe b, E. Janeba b a Tilburg University, Room K 420 PO Box 90153 5000 LE Tilburg, Netherlands. Tel: +31 13 466 2511 b University of Mannheim,
Part A: Answer question A1 (required), plus either question A2 or A3.
, plus either question A2 or A3.") Ph.D. Core Exam -- Macroeconomics 5 January 2015 -- 8:00 am to 3:00 pm Part A: Answer question A1 (required), plus either question A2 or A3. A1 (required): Ending Quantitative Easing Now that the U.S.
Ph.D. Core Exam -- Macroeconomics 5 January 2015 -- 8:00 am to 3:00 pm Part A: Answer question A1 (required), plus either question A2 or A3. A1 (required): Ending Quantitative Easing Now that the U.S.
General Examination in Macroeconomic Theory SPRING 2013
 HARVARD UNIVERSITY DEPARTMENT OF ECONOMICS General Examination in Macroeconomic Theory SPRING 203 You have FOUR hours. Answer all questions Part A (Prof. Laibson): 48 minutes Part B (Prof. Aghion): 48
HCEO WORKING PAPER SERIES
 HCEO WORKING PAPER SERIES Working Paper The University of Chicago 1126 E. 59th Street Box 107 Chicago IL 60637 www.hceconomics.org Commuting, Migration and Local Employment Elasticities Ferdinando Monte