The range of effects of azimuthal isotropy and EDA anisotropy in sedimentary basins
|
|
|
- Darren Dorsey
- 5 years ago
- Views:
Transcription
1 Geophys. J. Znt. (1991) 107, The range of effects of azimuthal isotropy and EDA anisotropy in sedimentary basins Philip Wild and Stuart Crampin Edinburgh Anisotropy Project, British Geological Survey, Murchison House, West Mains Road, Edinburgh EH9 3LA, UK Accepted 1991 June 6. Received 1991 May 2; in original form 1991 January 4 SUMMARY Combinations of bedding- or lithology-induced azimuthal isotropy, with an axis of symmetry perpendicular to the bedding plane, and crack-induced extensivedilatancy anisotropy (EDA), with a horizontal axis of symmetry, are believed to be common in sedimentary basins, and cause the widely observed phenomenon of shear-wave splitting. Combinations of two such transversely isotropic forms of anisotropy with orthogonal axes of cylindrical symmetry lead to orthorhombic symmetry. This has two major effects: (1) the polarizations of the faster split shear waves may no longer be parallel to the strike of the cracks, or fractures, even for near-vertical propagation; and (2) such orthorhombic symmetry systems necessarily have a number of directions, called shear-wave point singularities, where shear waves display disturbed or anomalous behaviour, again possibly in near-vertical directions. Unless these effects are correctly identified, they could be interpreted mistakenly for the effects of structural irregularities or discontinuities. In contrast, recognition of the 3-D geometry of this behaviour places comparatively tight constraints on possible combinations of anisotropy in the rockmass. In order to give some understanding of the geometry of these phenomena, this paper presents 3-D patterns of the behaviour of shear-wave splitting that have been computed for a range of combinations of crack- and bedding-induced anisotropy. Key words: anisotropy, shear waves. exploration seismology, modelling, sedimentary basins, 1 INTRODUCTION Many sedimentary basins are generally assumed azimuthally isotropic having transverse isotropy (hexagonal symmetry), with a vertical axis of cylindrical symmetry, so that P-wave velocities may be substantially greater in horizontal than vertical directions. There appear to be two main causes of such azimuthal isotropy: propagation through fine-layering (Riznichenko 1949; Postma 1955; Backus 1962; and many papers by Leven, Helbig and their colleagues), and the lithologic anisotropy of mineral grains in rocks such as shales (Kaarsberg 1968; Robertson & Corrigan 1983; Peacock & Crampin 1985). Both sources of azimuthal isotropy give rise to very similar 3-D patterns of velocity variations and for convenience we call this phenomenon periodic thin-layer anisotropy, or PTL anisotropy. Since there are algebraic formulations for deriving the elastic constants of fine-layer anisotropy (Postma 1955), we model both forms of azimuthal isotropy with these formulae. The presence of PTL anisotropy, recognized from P-wave velocities, also implies shear-wave splitting (birefringence). Because of the vertical symmetry axis, the shear waves would split strictly into SH- and SV-wave polarizations. Although this shear-wave phenomenon has been recognized occasionally in the past (Jolly 1956), the phenomenon has played little part in exploration seismology. However, the assumption of such azimuthal isotropy is implicit in many determinations of abnormal moveout velocities. Since three-component recording at high digital sampling rates has become more readily available in the last few years, it has been observed that almost all shear waves propagating through the uppermost 10 to 20 km of the Earth s crust (Crampin 1987), including sedimentary basins (Willis et al. 1986), display shear-wave splitting. The observed azimuthal variations in behaviour are diagnostic of some form of azimuthal anisotropy (Crampin 1987). The behaviour of the shear waves suggests that almost all rocks in the Earth s crust are pervaded by distributions of stress-aligned fluid-filled cracks, microcracks, and preferentially oriented pore-space, known as extensive-dilatancy 513
2 514 P. Wild and S. Crampin anisotropy, or EDA (Crampin, Evans & Atkinson 1984; Crampin 1985, 1987). EDA cracks, like hydraulic fractures, are expected to be aligned perpendicular to the minimum compressional stress. Below the near-surface stress anomalies (Crampin 1990), the minimum stress is usually horizontal. This means that EDA cracks can be expected to be aligned vertically, striking parallel to the maximum horizontal compressional stress so that the axis of symmetry is also horizontal (Crampin 1987). In sedimentary basins, the azimuthal isotropy of fine layering and lithology combines with the anisotropy due to the aligned EDA cracks and leads to orthorhombic anisotropic symmetry with three mutually perpendicular symmetry planes [Bush & Crampin 1987, 1991 (this issue); Crampin In a detailed analysis of shear-wave splitting in a multi-offset vertical seismic profile (VSP) study of the Paris Basin (Bush & Crampin 1987, 1991; Bush 1990), it was found that the azimuthal variations of synthetic seismograms and synthetic polarization diagrams could not match observed seismograms and polarization diagrams unless both PTL and EDA anisotropy were included. The prevalence of EDA and PTL anisotropy, identified separately, suggests that combinations of EDA and PTL anisotropy are common in many sedimentary basins. In this paper, we use theoretical models to describe the effects on the 3-D geometry of a range of possible combinations of EDA and PTL anisotropy in order to assist in interpreting the behaviour of shear waves in sedimentary basins. Such combinations lead to complicated shear-wave behaviour in directions near point singularities (Crampin 1991a, this issue), which could lead to misinterpretation unless correctly identified. In contrast, correct identification of the directions of singularities places valuable constraints on the internal structure of the rockmass. This paper is intended to help in recognizing such patterns of behaviour. 2 FORMULATIONS PTL anisotropy is modelled by the formulations of Postma (1955), which are valid for layer thicknesses less than about half a wavelength. The elastic constants of the five PTL structures investigated by this paper are given in Table 1. They are identified by the percentage of differential shear-wave velocity anisotropy. We have used a range from 2 to 36 per cent, which, in the absence of published data, we believe is broad enough to include all likely situations. The effects of PTL anisotropy are similar to those of any azimuthal isotropy, so that the examples in Table 1 cover a Table 1. Elastic constants of PTL anisotropy (in lop9 MPa), where Cij&f for i, j, k, I = 1, 2, 3, are elements of the elastic tensor (see Crampin 1981), and density is 2.6 g cmp3. The labels (a) to (e) in Figs 4 to 11 refer to the particular degree of velocity anisotropy listed below. Percentage anisotropy CII1I C = C2222 = 2233 = Cl313 (a) 2% (h) 6% CC) 12% Cd) 22% (e) 36% wide range of possible lithology- and bedding-induced anisotropy. Uniform distributions of EDA cracks are modelled by the formulations of Hudson (1980,1981), as adapted by Crampin (1984), where the crack density CD and aspect ratio AR are defined as CD = Na3v and AR = d/a, where N is the number of cracks of radius a and thickness d in volume v. A convenient way to visualize this relationship is to note that for thin (low aspect-ratio) cracks, CD x 100 is approximately the percentage of differential shear-wave velocity anisotropy (Crampin 1989). The combinations of EDA and PTL anisotropies are derived by simulating cracks in rocks with PTL anisotropy by the techniques of Hudson (1986). These various formulations are difficult to calibrate physically, and perhaps the best indications that they are approximately correct are the remarkably good match of synthetic to observed particle motions in Bush & Crampin (1991). The Hudson formulations are thought to be good approximations for crack densities less than about CD = 0.1 (Crampin 1984). Here, we use the Hudson formulations for crack densities CD I 0.2. We would expect the true velocity variations for such crack densities to display similar 3-D patterns of behaviour to the modelled values, although the numerical values might be different. These various formulations are valid for calculating the properties of seismic waves with wavelengths greater than the layer thicknesses, and greater than the crack dimensions, along ray paths longer than the seismic wavelengths. 3 SHEAR WAVES IN ANISOTROPIC SOLIDS In anisotropic solids there are three body waves propagating in every direction of phase velocity, a quasi-p-wave, qp, with approximately longitudinal particle motion, and two quasi-shear waves, the faster qs1, and the slower qs2, with approximately transverse polarizations. These three waves, in general, have different velocities and mutually perpendicular polarizations with respect to directions of phase propagation. However, in anisotropic solids, the velocity of the energy along a seismic ray, at the group velocity, deviates from the phase velocity both in magnitude and direction, so that the polarizations of the three body waves propagating along the same ray paths may deviate significantly from being mutually orthogonal (Crampin 1981). It is the difference in velocity and polarization of the two quasi-shear waves that causes the phenomenon of shear-wave splitting, which is the most diagnostic feature of wave propagation in a cracked or anisotropic solid (Crampin 1978, 1981). An incident shear wave propagating through an anisotropic solid, in general, splits into two or more phases with different polarizations and different velocities, which are fixed for the particular ray path through the particular anisotropic symmetry. These fixed parameters insert characteristic signatures into the 3-D particle motion, which vary with the direction and length of the ray path through the solid. Rays of split shear waves generally propagate (at the group velocity) with such regular behaviour that the polarization of the shear wave and the amount of differential

 phase- and (b) group-velocity")


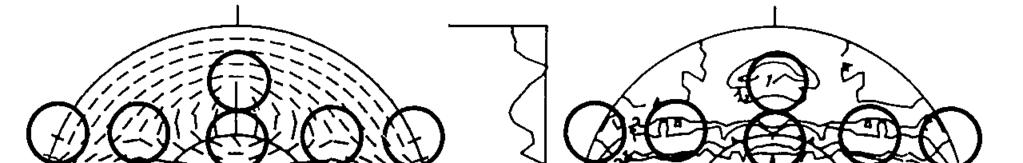
3 a Phase-velocity y Group-velocity x z b Group-velocity Y c 1 z PTL = 3wo Aspect ratio = 0.05 Crack density = 0.05 Figure 3. Projections of (a) phase- and (b) group-velocity surfaces over a quarter of a hemisphere of directions in the material of Fig. 2(c) with the slower (blue) and faster (red) shear-wave surfaces superimposed. Lines of azimuth and incidence angle on all surfaces are drawn for a 2 grid of phase-velocity directions. Point singularities (marked by black dots, and large open circles for phase and group velocity, respectively) occur where the two phase-velocity surfaces touch. Thin sections around the x-z plane, viewed tangentially, show variation of the two group-velocity sheets for PTL anisotropy of: (c) 2 per cent; (d) 12 per cent, as in Fig. 2(a); and (e) 36 per cent, each pervaded by the same EDA cracks as used in Fig. 2(b).
4
 Line singularity, where the two velocity surfaces may be considered as intersecting.")
 Kiss singularity, where the two surfaces touch tangentially. Kiss singularities always occur in directions of symmetry axes in hexagonal symmetry; as illustrated in (a), above.")
5 d Point Singulari e Pull-Apart Remnant of Figure 1. Schematic illustration of the three types of shear-wave singularities, where the two shear-wave phase-velocity surfaces touch. (a) Line singularity, where the two velocity surfaces may be considered as intersecting. This is only possible in systems of hexagonal symmetry (transverse isotropy), where the line singularity is a concentric circle about the symmetry axis. (b) Kiss singularity, where the two surfaces touch tangentially. Kiss singularities always occur in directions of symmetry axes in hexagonal symmetry; as illustrated in (a), above. (c) Point singularity, where the two surfaces touch at the vertices of (usually very shallow) convex and concave projections from the inner and outer surfaces, respectively. (d) Schematic illustration of the intersection of two phase-velocity surfaces in a line singularity in a hexagonal symmetry system. (e) Illustration of the pull-apart remnant of a line singularity when the hexagonal symmetry is perturbed. Point singularities are shown at both ends of the pull-apart remnant of the line singularity. shear-wave anisotropy can often be used to estimate the orientation and degree of anisotropy along the ray path. In anisotropic solids, the phase and group velocities for each body wave generally diverge in both magnitude and direction, so that there are two velocity surfaces for each wave-type. Velocity surfaces, or sheets, are the locus of points reached in a given time by body waves radiating from a point source. It can be demonstrated (Crampin 1981) that the phase-velocity surfaces of the two split shear waves are analytically continuous and must necessarily touch in at least two directions, called singularities. Shear-wave surfaces in most anisotropic solids have many more than two singularities, and there are three distinct types: line, kiss, and point singularity. Although the representation of singularities in phase-velocity surfaces is comparatively simple (Fig. l), singularities may cause anomalous behaviour of waves propagating at the group velocity for a solid angle of directions about the singular direction. 3.1 Shear-wave point singularities EDA and PTL anisotropy in sedimentary basins 515 symmetry axis in hexagonal symmetry [shown in Fig. l(a)], and may occur occasionally in other anisotropic symmetries. Fig. l(c) shows a point singularity, where the two shear-wave surfaces touch in isolated directions at the vertices of convex and concave cones on the shear-wave velocity surfaces. Shear-wave singularities do not cause anomalies in plane wave propagation (at the phase velocity), and kiss and line singularities cause only minor disturbance to rays of shear waves travelling at the group velocity. The deviation of phase and group velocity is usually greatest when the phase-velocity surface has rapid variations of polarization direction and has high curvature. Line and kiss singularities are not associated with rapid variations of polarization, and usually do not cause particular anomalies in the behaviour of group velocities, even though the intersection of the two phase-velocity surfaces and the intersection of the two group-velocity surfaces are in slightly different directions. However, phase-velocity surfaces near point singularities show rapid variations of polarizations and high curvature in sections of the phase-velocity surfaces. Consequently, the group velocities near point singularities may display considerable deviations from the directions and polarizations of the phase velocity. This means that the behaviour of shear waves along seismic rays passing near point singularities is sensitive to very small changes in direction of propagation (Crampin 1991a). This is important, since it implies that point singularities are sensitive to small changes to the internal structure of the rockmass. We shall demonstrate in the following discussion that when there is strong PTL anisotropy combined with weak EDA anisotropy there may be point singularities near to vertical directions. This anomalous behaviour associated with such singularities could be comparatively common in sedimentary basins. The direction of a point singularity in the phase-velocity surface transforms to an approximately elliptical shape in the group-velocity surface, not necessarily flat, and not necessarily centred about the direction of the singularity in the phase velocity surface. This elliptical shape creates a hole in the outer (faster) group-velocity surface, qs1, and the edge of an almost flat lid on the inner (slower) surface, qs2, that fits exactly into the hole (Crampin & Yedlin 1981; Crampin 1981, 1991a). 3.2 Pull-apart remnants of line singularities In sedimentary basins, if significant PTL anisotropy is present, there would be strong line singularities. A schematic illustration of the intersection of the two phase-velocity sheets in a line singularity is shown in Fig. l(d). The appearance of a line singularity in group-velocity sheets would be similar, but is usually in a slightly different direction from the equivalent phase-velocity singularity. Figure 1 is a schematic illustration of two shear-wave phase-velocity surfaces showing the three types of possible singularity (Crampin & Yedlin 1981; Crampin 1989). Fig. Although the behaviour of shear waves near line l(a) shows a line singularity, where the velocity surfaces singularities is regular, any small perturbation due to EDA may be considered as intersecting. Line singularities can anisotropy, for example, leads to the two phase-velocity only occur in systems with hexagonal symmetry, where they surfaces at the line singularity pulling apart, -and touching are circular, concentric with the symmetry axis. Fig. l(b) only a number of point singularities, as in Fig. l(e). There is shows a kiss singularity, where the two surfaces touch high curvature of the phase-velocity surfaces and rapid tangentially. Kiss singularities always occur along the variations of polarizations near such pull-apart remnants of

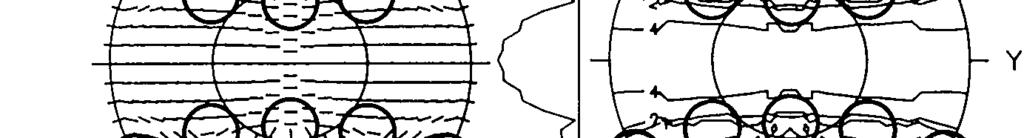
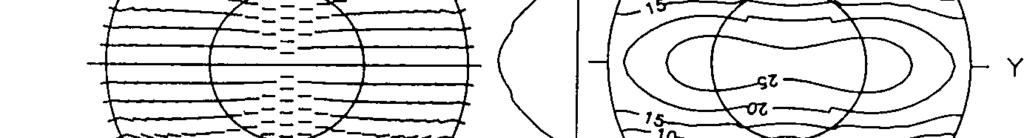
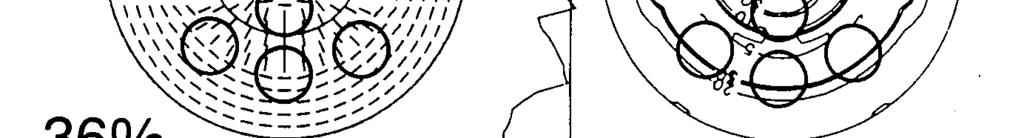
6 516 P. Wild and S. Crampin line singularities, and the behaviour of ray paths may show pronounced irregularities (Crampin 1991a). 3.3 Equal-area projections The behaviour of combinations of PTL and EDA anisotropy is illustrated in Fig. 2. Equal-area projections (polar maps) of the variation of the polarization of the faster split shear wave over hemispheres of directions are presented for (a) 12 per cent PTL anisotropy, (b) 5 per cent EDA anisotropy, and (c) the combination of (a) and (b). Details of the construction of equal-area projections, and the geometrical relationships between the various displays in this paper are given in the Appendix. The projection of PTL anisotropy, with a vertical symmetry axis, has rotational symmetry about the vertical z-axis in the centre of the projection. The line singularity (between the arrowheads) marks a pronounced change of about 90 in the polarizations of the leading split shear wave. For directions of propagation within the solid angle bounded by the line singularity, the leading shear wave has radial polarization (W-wave), whereas outside the line singularity, it has SH polarization. The projection of EDA anisotropy, with a horizontal symmetry axis, has the polarizations of the leading split shear waves parallel to the strike of the cracks (in the y-z plane) in a broad band across the centre of the projection. The broad band is bounded by line singularities (again indicated by arrowheads). The line singularities disappear in the combination of EDA and PTL anisotropy in Fig. 2(c). However, the pull-apart remnants of the line singularities are still marked by changes in shear-wave polarization. There are also a number of point singularities (marked by black dots) along the traces of the pull-apart remnants of line singularities. These will lead to anomalies in the shear-wave amplitudes, a PTL b EDA c EDA+ PTL PTL = 12% AR = 0.05 CD = 0.05 Figure 2. Equal-area projections (polar maps) of the horizontal polarizations of the faster split shear wave over a hemisphere of phase-velocity directions showing the combination of PTL and EDA anisotropy. The projections show: (a) transverse isotropy in sedimentary basins (PTL anisotropy) with a vertical symmetry axis, and with 12 per cent differential shear-wave anisotropy; (b) transverse isotropy caused by aligned inclusions (EDA anisotropy) with a symmetry axis along the x-axis, with crack density 0.05, and aspect ratio 0.05 (l/20), leading to 5 per cent differential shear-wave anisotropy; and (c) combination of PTL and EDA anisotropy, from (a) and (b), above, yielding orthorhombic symmetry. (Velocity surfaces and equal-area projections are illustrated in Figs 3 and 8c, respectively, below.) Open circles mark the directions of kiss singularities, arrows mark the directions of line singularities, and solid circles indicate the directions of point singularities. The inner circle marks the theoretical edge of the shear-wave window, where shear waves are undistorted at the free surface (Evans 1984; Booth & Crampin 1985). polarizations, and time delays (Crampin 1991a). Such anomalies have been identified in multi-offset VSPs in the field (Bush 1990; Bush & Crampin 1987, 1991; Crampin 1988). The inner circle marks the edge of the shear-wave window at the free surface (Evans 1984; Booth & Crampin 1985). Observations of shear waves at the free surface suffer severe distortions if the angle of incidence is greater than the critical angle arcsin (V,/V,). This angle is about 35 for plane waves incident at the surface of a half-space having a Poisson s ratio of 0.25 (V,/V, = 1.73). The effective angle in the field may be considerably larger because of the upward curvature of the rays through near-surface low-velocity layers. 3.4 Phase- and group-velocity point singularities near line and Phase-velocity surfaces may be comparatively simple, but group-velocity surfaces of shear waves in anisotropic solids may show great complexity in amplitude and polarization. It is well known that group-velocity surfaces of shear waves in anisotropic solids may display cusps, in directions where the curvature of the phase-velocity surface is sufficiently large (Musgrave 1970). Less well recognized is that even for comparatively weak anisotropy, shear-wave group-velocity surfaces in directions near point singularities may display great complexity so that rays of shear waves passing close to point singularities may show cuspoidal behaviour of amplitudes and polarizations (Crampin 1981,199la). Quarter hemisphere projections of phase- and groupvelocity surfaces for equal grids of phase-velocity directions for the combined PTL and EDA anisotropy of Fig. 2(c) are shown in Fig. 3. This figure can be compared with schematic phase-velocity surfaces in Fig. 1. The phase-velocity surfaces in Fig. 3(a) of the faster (in red) and slower (in blue) split shear waves vary smoothly. The important features are the very shallow convex and concave cones whose vertices touch in the directions of point singularities (marked by black dots). The lines traced out on the group-velocity surfaces by the regular grid of phase-velocity directions in Fig. 3(b) display much more complexity. The most prominent features are the cuspoidal fins and ridges, following the traces of the pull-apart remnants of line singularities. The direction of the point singularity in the phase-velocity surface transforms to an approximately elliptical hole in the faster (red) split shear-wave surface. This hole fits exactly a thin, almost flat, cuspoidal lid on the slower (blue) split shear-wave surface (Crampin 1981, 1991a). Thus, the isolated direction of a point singularity on the phase-velocity surface transforms to an elliptical solid angle in the group-velocity surface, which is indicated approximately by an open circle. Because of the great sensitivity of the group-velocity deviations to small changes in phase-velocity directions, calculations of the exact outlines of these solid angles in the group-velocity surfaces would take substantial computing time without adding significant geophysical insight. The lines in Fig. 3(b) represent deviations of direction on smooth group-velocity surfaces, not distortions to the topography of the surface. The interlocking of the phaseand group-velocity surfaces is illustrated in Fig. 3(c). It


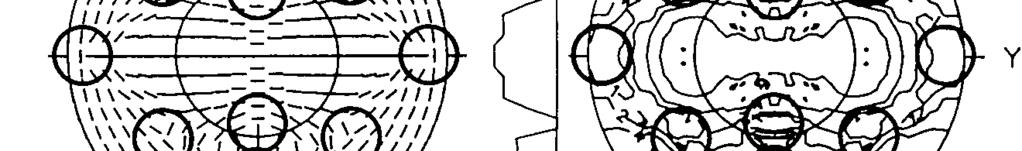
7 Polarization Aspect ratio = Phase-velocitỵ Crack density = 0.01 Polarization Group-velocity e-w_ H-e-_., /_-_-_-.,;,.:---:.~ \\ //, y,---.:\\\\ ///,;;,- 0n 0 I 6 I- 8 0 I / /,, 4 J *?J;, Ii////\ lllll/-,:\ $2 #\\\\I\ IIIIII x. 0 \IIlII lllll lllll III\Il /H' ;'; I\\\\\# '/'$ \\ IIIIII -/Ill// \\\\\\ ~////II \\\\\* I y,,/,/,/, \, \ \ \ g; 0:/Y//,,,\ :-z-z- //,,::.---p/, _.----,;/.=--- / e-e- 0 1 d,:=:zz=:, //,;~/---.y\\\,;,.=sz=-.-::\ ///, I//,,;.- \ -.:,,\\\ II///,\\\\\\ 11//// \\\\\I \\\\\ 1/1/l/- \\ /, -\\I\\\ IIIIII..\ :,' \lliii I I I I I IIIII IIIIII 000 \NN IIIIII II\\\\ //I \I\\\\ 1 \ \ IIIIII \\\\\ :Y,,, \\\\\\I I/////, \, o=::--- --: l//,.--v*, /,, \\ :---e=//, \,. ---,.;/.2--e e Figure 4. Polar equal-area projections over a hemisphere of directions of the behaviour of phase and group velocities in combinations of a fixed EDA anisotropy in the range of PTL structures in Table 1. The EDA cracks have crack density CD = 0.01 and aspect ratio AR = and are aligned parallel to the y-z plane. The first two columns show variations referred to phase-velocity directions: left-hand side-horizontal polarizations of the faster split shear wave; and right-hand side-contoured time delays between the split shear waves normalized to a 1 km path length. The second two columns show similar variations referred to group-velocity (ray path) directions. Scale, in tenths of seconds, marked on cross-sections of the contours to the left of the contour plots.

8 518 P. Wild and S. Crampin Polarization \, _#---_ /:A;; ;;-,\ -. /,5/ //,, / \ \ \\\ j/j/// \>\\\ \\\\ /,, (I \,\\\\\ \-\\ -z-z- --- Aspect ratio = Phase-velocity x Crack density = 0.05 Polarization Group-velocity _a----,;.-=i= mm-.::,,;;--.:---:y,,\ //,,;x,- -x:\\\\\ I////,/ \\\\\\\ II/// \\\\\ \\\\\\ l/iii/ II//II \\\\\\.:: ;:/ lllll/. H/ \IIIII I I I I III1 IllI\\ /r--. /llill \I\\\\ /// \\\ \, \ \ \ \,\ \ I///II 1llll1 I# \\\\\\< I /,,,$$ \\\\,\-,\k>.--,m: ////,:,.:---:,; f -H./j// ::z--:.,/ e -@ 0. w -0n Y Figure 5. Similar projections to those in Fig. 4, but for EDA cracks with crack density CD = 0.05 and aspect ratio AR = Notation as in Fig. 4.


9 Polarization Aspect ratio = Phase-velocity EDA and PTL anisotropy in sedimentary basins 519 Crack density = 0.1 Polarization Group-velocity Figure 6. Similar projections to those in Fig. 4, but for EDA cracks with crack density CD = 0.1 and aspect ratio AR = Notation as in Fig. 4.


10 520 P. Wild and S. Crampin Aspect ratio = Crack density = 0.2 Polarization Phase-velocity Polarization Group-velocity I Figure 7. Similar projections to those in Fig. 4, but for EDA Fie. 4. cracks with crack density CD = 0.2 and aspect ratio AR = Notation as in
11 EDA and PTL anisotropy in sedimentary basins 521 shows a projection from the same view point as the quarter hemispheres in Fig. 3(b) of a f6 cross-section about the x-z plane. The section is smooth, with the highest curvature in the region of the incipient conventional cusp midway between the complications introduced by the point singularities. Fig. 3(d) shows a similar section for the same crack density, but weaker PTL anisotropy. The two surfaces are seen to meet very smoothly. Fig. 3(e) shows a similar section for stronger PTL anisotropy, with a cross-section of a pronounced cuspoidal fin. Since point singularities occur where the two phasevelocity surfaces touch, plane waves propagating at the phase velocity (as in Fig. 3a) display small time delays between the split shear waves when the propagation direction is close to a singularity. In contrast, the group-velocity sections in Figs 3(c), (d), and (e) show that the delay between the group velocities does not tend to zero near singularities, but is always a significant proportion of the maximum difference between the group velocities of the two split shear waves (Crampin 1991a). This means that even for comparatively weak anisotropy, rays of shear waves may still display irregular behaviour with significant time delays when propagating near point singularities. Figures 4 to 11 show the various 3-D patterns of behaviour for several combinations of EDA and PTL. When there is low EDA anisotropy and high PTL anisotropy [diagrams (d) and (e) in Figs 4 to 71, the directions of point singularities may be close to vertical incidence. It is important to recognize that such singularities can exist and to understand their effects on shear waves, so that anomalies in the propagation of shear waves through homogeneous uniform anisotropic rocks are not mistakenly attributed to non-existent structural inhomogeneities. 4 BEHAVIOUR OF COMBINATIONS OF PTL AND EDA ANISOTROPY The following paragraphs discuss the effects of varying PTL anisotropy, EDA crack density, and aspect ratio. These can best be illustrated by the variation in positions of the point singularities. 4.1 Equal-area projections Figures 4 to 7 show equal-area projections of a hemisphere of directions for the polarizations of the leading split shear waves and normalized contoured time delays between the split shear waves for a range of possible combinations of PTL and EDA anisotropies. Each figure shows a particular EDA crack type, specified by crack density and crack aspect ratio for five PTL anisotropies, increasing from the top of the page. The elastic constants for the five PTL anisotropies were computed using the formulations of Postma (1955) leading to differential shear-wave velocity anisotropies of 2, 6, 12, 22 and 36 per cent. These five materials are listed in Table 1. Liquid-filled vertical EDA cracks striking parallel to the y-axis were simulated in the PTL anisotropies using the formulations of Hudson (1980, 1981, 1986), where the z-axis is assumed vertical. The liquid in the fluid-filled inclusions modelled in these diagrams has the elastic properties of water at surface temperatures and pressures. The formulations for calculating elastic constants have been incorporated into an anisotropic modelling package (Taylor 1987). This package was used to compute the elastic constants, to plot the polar projections shown in Figs 4 to 9, and to plot the velocity variations in mutually orthogonal symmetry planes shown in Fig. 11. Point singularities in phase-velocity surfaces are seen to be in isolated directions (again marked by black dots), but in group-velocity surfaces they are cones of directions whose approximate positions are marked by circles. The reason for the irregularities in the contoured group-velocity time delays are explained in the Appendix. Figures 4 to 7 show the five PTL structures pervaded by thin cracks, with aspect ratio AR = (l/1000), and four crack densities of CD = 0.01, 0.05, 0.1, and 0.2. This is equivalent to differential shear-wave anisotropies due to the cracks of 1, 5, 10, and 20 per cent. Figs 8 and 9 show the five PTL anisotropies pervaded by cracks with the (typical) crack density of CD = 0.05 and aspect ratios of AR = 0.05 (l/20), and 0.2 (l/5), respectively. Variations of PTL anisotropy As an illustrative example, we take Fig. 5, which shows EDA cracks with crack density CD = 0.05 (5 per cent differential shear-wave velocity anisotropy) and aspect ratio AZ? = pervading five different PTL anisotropies. In the 36 per cent PTL anisotropy in Fig. 5(e), the characteristic kiss singularities of pure PTL anisotropy, in the direction of the z-axis [representing the vertical direction, as in Fig. 2(41, are seen to become point singularities. These singularities will move away from vertical along the y = 0 plane towards the x-direction progressively for increasing ratios of crack density to PTL anisotropies. Similarly, each line singularity, that would encircle the z-axis in the pure PTL anisotropy (Fig. 2a) is now a pull-apart remnant of a line singularity with eight point singularities in each hemisphere. The 2 per cent PTL anisotropy in Fig. 5(a) shows a similar pattern of point singularities and pull-apart remnants of line singularities, except that instead of encircling the z-axis (vertical direction), they now tend to encircle the x-axis. Similarly the vertical kiss singularity has become two point singularities which are now nearly 30 from vertical. The intermediate PTL values (Fig. 5b-d) show various stages in the progression of point singularities on remnants of pull-apart line singularities moving from encircling the x-axis to encircling the z-axis. As the PTL anisotropy increases, the point singularities in the x-y plane coalesce and then separate and move towards the z-axis in the y-z plane. Other singularities tend to move slowly to take up the characteristic positions of a pure PTL system as shown in Fig. 2(a). Plots of normalized contoured delays indicate that due to the dominance of the PTL anisotropy, as PTL anisotropy increases the time delay between the two split shear waves increases. It is interesting to note that for these comparatively small aspect ratios, the combinations of EDA and PTL anisotropy still preserve the same number of point singularities. The only case where this does not occur is shown in Fig. 9(a). This is almost certainly because the singularities are so close and the separation between the two velocity surfaces is so
12 522 P. Wild and S. Crampin small that the missing singularities have not been computationally resolved. Separating the distinct point singularities would require more detailed investigations, which have not yet been carried out. Certainly, at larger aspect ratios the line singularity moves towards the kiss singularity at the end of the symmetry axis (Crampin 1991b) and the numbers of point singularities decrease. Variations of EDA crack density The effects of variations of EDA crack density at a constant aspect ratio can be seen by comparing Figs 4 to 7. We see that where the EDA anisotropy is weakest in Fig. 4, only a small amount of PTL anisotropy is sufficient to severely distort the characteristic pattern of EDA anisotropy. The general pattern of point singularities is partially controlled by the ratio of PTL to EDA anisotropy. Thus, for the thin EDA cracks in Figs 4 to 7, the point singularity progressively moves away from the y-axis for 2, 6, 12 and 22 per cent PTL anisotropy. The approximate ratios for these figures are 2, 1.2, 1.2, and 1.1, respectively. Similar to the case of increasing PTL anisotropy, increasing EDA anisotropy generally lengthens the time delay between the two split shear waves. Variations of EDA crack aspect ratio The effects of varying the EDA aspect ratio with constant crack density can be seen by comparing Figs 5, 8 and 9, which have the same PTL and EDA anisotropies, but aspect ratios of AR =O.OOl (l/1000), 0.05 (l/20), and 0.2 (l/5), respectively. The largest change in the direction of point singularities between these figures is for singularities that do not fall on symmetry planes. For an aspect ratio of there is a singularity in approximately the x = y = z direction. With increasing aspect ratio, the singularity moves towards the x-axis. Other singularities show only small variations in their positions despite comparatively large changes in aspect ratio. Similar behaviour is evident when comparing changes in aspect ratio at other crack densities (not shown). For PTL anisotropy of less than about 12 per cent, the most prominent effect of the change of aspect ratio is to broaden the width of the band of large time delays in the contour plots-this is most clearly seen in the sections to the left of each contour plot. Such changes alter the time delays selectively in the 3-D pattern of variations. These variations are claimed to have been identified before and after earthquakes (Crampin et al. 1990; Booth et al. 1990), when appropriate recording directions were available to show such changes. The changes in aspect ratio were interpreted as caused by stress-induced bowing of thin EDA cracks [see comments by Aster, Shearer & Berger (1990), and reply by Crampin et al. (1991)]. These earthquakes did not originate in sedimentary basins and there was no PTL anisotropy present. 4.2 Quarter hemisphere grids of velocity surfaces Phase- and group-velocity surfaces in a quarter hemisphere of directions are shown in Fig. 10 for the five PTL structures in Table 1 pervaded by thin parallel vertical cracks with crack density CD = 0.5 and aspect ratio AR = These figures may give a more easily visualized 3-D picture of the phenomena in the equal-area polar projections. For example, note how the point singularities on the phase-velocity surfaces are at the vertices of (shallow) convex cones on the inner (slower) surfaces, qs2, and concave cones on the outer (faster) surfaces, qs1. These diagrams also convey the complex behaviour near point singularities, and near pull-apart remnants of line singularities, when there is strong differential shear-wave anisotropy. Figures covering a wide range of parameters have been calculated. These quarter hemisphere grids are a valuable aid to physical intuition but are difficult to use for quantitative measurements, hence, only a small selection of the calculated structures are shown. The effects of varying PTL anisotropy and EDA crack parameters are discussed in the following paragraphs. Variations of PTL anisotropy The phase-velocity surfaces in Fig. 10 show how the direction of the point singularity on the n-y plane moves first towards the y-axis and then towards the z-axis on the y-z plane as the ratio of PTL to EDA anisotropy increases. The two point singularities on the z-x plane (perpendicular to the crack strike) close together while migrating towards the z-axis. The group-velocity sheets show increasing complexity with the formation of cusps as the PTL: EDA anisotropy ratio increases. The major complexity is near the cuspoidal fin associated with the pull-apart remnant of the line singularity of the PTL anisotropy. This can lead to severe irregularities at higher PTL anisotropies. At the top of Fig. 10 there are also small cuspoidal fins associated with the pull-apart remnant of the line singularity of the EDA anisotropy. Variations of EDA crack density Similar effects can be seen as EDA crack densities increase (not shown). The two singularities on the Z- plane and the off-symmetry singularity near the x = y = z direction move progressively towards the x-axis as the degree of EDA anisotropy increases. At the same time the singularity which is initially located on the y-z plane tends towards the y-axis and onto the x-y plane as the degree of EDA anisotropy increases. The speed of this movement is greatest for low PTL anisotropy. As with an increase in PTL anisotropy, the group-velocity sheets are severely distorted by an increase in the EDA crack density. Variations of EDA crack aspect ratio Calculations (not shown) demonstrate that the effect of changing the crack aspect ratio (at a given EDA and PTL anisotropy) is principally confined to the off-symmetry point singularity which moves towards the Z- plane as the aspect ratio increases. 4.3 Velocity variations in symmetry planes Figure 11 shows the phase- and group-velocity variations for a quadrant of directions of quasi-shear-wave propagation in


 is7;:t x=:x;\, /: //, \.")


;x\ II/l//- \")


13 EDA and PTL anisotropy in sedimentary basins 523 Aspect ratio = 0.05 Crack density = 0.05 Polarization ,;.;; Phase-velocity =- Tjj?i( \ ) is7;:t x=:x;\, /: //, \....M, a.- --* 30 o Polarization Group-velocity Q c ~- 8 0,:=sr,y,,;,.-SZZ-.-,.:.--:.,, \ \\ /<5;;~.- -.;,,\\\ h,/,/, ~; );x\ II/l//- \ IIIII/ -\\\\\\,:\ $5, \\\\\\ IIIII/.-_- \lllll IIll IllI I I I I I\ \\\\\\ //I \\..fiiii \\\\\\- I -/1/111 //IIll,,,,,Y I I :N- \\\:.---.-, //,.A: ///, \:,.:---:,;;/ _.z _. B-0-0, e Figure 8. Similar projections to those in Fig. 4, but for EDA cracks with crack density CD = 0.05 and aspect ratio AR = Notation as in Fig. 4.


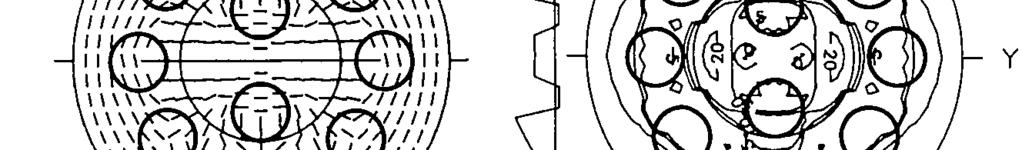
14 524 P. Wild and S. Crampin Polarization Aspect ratio = 0.2 Phase-velocity Crack density = 0.05 Polarization Group-velocity Y 8 '0 achy.:--. ; / : -_.- e 40 0 Figure 9. Similar projections to those in Fig. 4, but for EDA cracks with crack density CD = 0.05 and aspect ratio AR = 0.2. Notation as in Fig. 4.
 and group velocity (second two columns) of the slower, qs2, and faster, qs1, split shear-wave surfaces for a grid of phase-velocity directions over a")
.")
, irrespective of whether they are first (qs1) or second arrivals (qs2).")
 are displayed as rectangular plots so that the cos 28 and cos 48 variations can be easily recognized. Point singularities occurring in the phase-velocity lines are marked with solid circles.")

 phase-velocity variation. Examination of Fig.")
15 EDA and PTL anisotropy in sedimentary basins 525 Aspect ratio = Crack Phase-velocity 62 w density = 0.05 Group-velocity q= w Figure 10. Projections of phase velocity (first two columns) and group velocity (second two columns) of the slower, qs2, and faster, qs1, split shear-wave surfaces for a grid of phase-velocity directions over a quarter of a hemisphere of directions in the PTL structures in Table 1 pervaded by parallel EDA cracks, crack density CD = 0.05 and aspect ratio AR = Notation as in Fig the three mutually orthogonal symmetry planes, x-y, y-z, and z--x, in the range of structures in Fig. 5 (CD = 0.05 and AR = 0.001). A change in notation is necessary because quasi-shear-waves in symmetry planes are polarized either (P)arallel or at (R)ight angles to the plane, so it is convenient to call these waves qsp and qsr, respectively (Crampin 1989), irrespective of whether they are first (qs1) or second arrivals (qs2). The qsp-wave has an approximately cos 48 and the qsr-wave a cos 28 variation with direction in symmetry planes (Crampin 1981). The quadrants (Fig. 11) are displayed as rectangular plots so that the cos 28 and cos 48 variations can be easily recognized. Point singularities occurring in the phase-velocity lines are marked with solid circles. Point singularities in the group-velocity section of the plots have not been marked to prevent masking features of the group-velocity behaviour. For weak PTL and EDA anisotropy, the group-velocity point singularities are centred approximately about the same directions as phase-velocity singularities. As the degree of PTL anisotropy increases, the group-velocity point singularities can be seen to move significantly away from the positions of the phase-velocity point singularities and form part of the characteristic cusp caused by the high curvature of the qsp (cos 49) phase-velocity variation. Examination of Fig. 11 shows that group-velocity behaviour is complex when the PTL anisotropy is strong (22 to 36 per cent). The cusp in the Z- plane of Fig. 11(e), located between 30 and 55, is caused by the curvature of the qsp phase-velocity surface, and overlaps with the cuspoidal lid associated with the point singularity (marked by the nearly horizontal dashed line between 30 and 67 ). Edges of both cuspoidal features nearly coincide at the 30 direction. This figure, like many of the diagrams in Fig. 5, shows that the effects of point singularities may extend for many degrees (in this case about 17 ) around the direction of the point singularity. In a previous study using a much simpler cuspoidal lid (Crampin 1991a), the unexpected behaviour of the synthetic seismograms suggested that shear waves near such features have very irregular behaviour. Individual trends in the behaviour of point singularities in
16 526 P. Wild and S. Crampin Aspect ratio = Crack density = 0.05 (-Y Plane) (Y-Z Plane) (Z- Plane) 2.50 e z 1.75 c 1.50 li.zt 1 ANIShS 1 a &:::I,,,,, j 2.50 ANISkIS ANlSbS b z 1.75 ir 1.50 ti 1.25 c g 1.00 ANISkIS t,,,,, j 6% l---=-l d e 2.50 ANIS IS qj z 1.50 G Ii > 1.00R DEGREES bt I I I I I 4 c I I I DEGREES P DEGREES 36% Figure 11. Velocity variations in the three mutually perpendicular symmetry planes, x-y, y-z and z-x, for the range of structures specified in Fig. 10. The y-z plane is parallel to the strike of the EDA cracks and the z--x plane perpendicular. The solid lines are phase velocity, and the dot-dash lines are the group velocity joined to the appropriate phase-velocity value every 10. The waves are the two quasi-shear waves, qsp and qsr, polarized (P)arallel and at (R)ight angles to the symmetry planes. The point singularities are marked by black dots. (Note that in some planes, the anisotropy is so weak that the phase- and group-velocity lines are almost indistinguishable.) the qsl- and qs2-waves for variations in PTL and EDA anisotropy are not discussed in detail as similar discussions presented for the velocity sheets can also be applied to these plots. However, the variation of qsl- and qs2-waves are discussed below. Variations of PTL anisotropy Increasing PTL anisotropy causes an overall reduction in the velocities of the qsp-, and qsz?-waves, with both waves showing the greatest reduction in velocity in directions towards the vertical z-axis. Separation of the phase- and group-velocity sheets becomes more pronounced with increased PTL anisotropy, and the group velocity develops characteristic high-curvature cusps. These phenomena are partially determined by the particular choice of PTL structures, although the general patterns are probably widely applicable. Variations of EDA crack density Variations of velocities for changing crack densities are not shown, but numerical calculations suggest that the effects of increasing crack density are very similar to those of increasing PTL anisotropy. Variations of EDA crack aspect ratio Numerical calculations (not shown) indicate only subtle differences in the positions of the point singularities. In
17 EDA and PTL anisotropy in sedimentary basins 527 many cases, there is only a slight movement of the singularity in the x-y plane towards the x-axis. This is the phenomenon that is claimed to have been observed by Booth et al. (1990) and Crampin et al. (1990). 5 CONCLUSIONS The wide range of behaviour of shear waves and shear-wave singularities for variations in what are thought to be realistic examples of EDA and PTL anisotropy, demonstrate the sensitivity of shear waves to the internal structure of the rockmass. Although the behaviour of shear waves in orthorhombic symmetry systems can be complicated, a number of conclusions can be drawn. (1) The most important conclusion is that the polarizations of the faster split shear wave in sedimentary basins may not be wholly parallel to the strike of the cracks within the rockmass, even for near-vertical directions of propagation. (2) Another important result is that when the ratio of EDA to PTL anisotropy is sufficiently small, point singularities may occur for rays in directions of propagation very close to vertical. Crampin (1991a) shows that shear-wave seismograms may be severely disturbed for directions of propagation close to point singularities. If singularities near vertical directions were not recognized, these irregularities, which could occur in a homogeneous horizontal plane-layered sedimentary sequence, might be mistakenly interpreted as the result of structural discontinuities. (3) The combinations of EDA and PTL anisotropy which cause the most disturbed near-vertical propagation are those where there is weak EDA and strong PTL anisotropy. These are exactly the combinations which are expected to be most common in sedimentary basins. This suggests that phenomena associated with point singularities may be quite commonly present in shear-wave reflection profiles and VSPs conducted in sedimentary basins. (4) Recognition of the directions of point singularities places strong constraints on the relative proportions of EDA and PTL anisotropy. Since these quantities may be determined independently, this feature could provide important confirmatory information about the parameters of the rockmass. (5) The sensitivity of shear waves is such that any changes in the crack structure, by changes of the pattern of stress, changes of pore shape, or changes of pore fluid velocity and viscosity (not shown), are likely to produce changes in the behaviour of shear-wave splitting. Repeated VSPs, reflection, and cross-hole surveys, should allow such temporal changes to be recognized, and could lead to detailed interpretation of the internal structure of the rockmass. (6) Shear waves appear to be very sensitive to variations of the relative proportions of EDA and PTL anisotropy. The subtleties of shear-wave propagation near point singularities may well be the reason for many of the complications frequently observed in field records of shear waves in sedimentary basins. The final conclusion is that complicated shear-wave behaviour observed in sedimentary basins may not necessarily be caused by complex structure. Understanding the phenomena may enable the complications to be interpreted in terms of a uniform structure. The suggested reason for the importance of such interpretations is that they provide new detailed information about the internal stress, crack, and pore structure of the reservoir. In real rocks, the behaviour can be very different from effects of the uniform models represented in this paper. However, the most significant property of point singularities is that the polarization of the faster split shear wave changes by 90 either side of the singularity. This is a fundamental property of shear-wave propagation in anisotropic solids, and must produce significant anomalies in real structures if there is orthorhombic symmetry. The remarkable match of synthetic to observed shear-wave behaviour reported by Bush & Crampin (1991) for the Paris Basin suggests that in some cases, at least, the geometries reported in this paper may be very close to real data. ACKNOWLEDGMENTS The ANISEIS package of Applied Geophysical Software Inc. and Macroc Ltd was used for modelling several of the figures. We thank David C. Booth and Colin D. MacBeth for their comments on the manuscript and Sue Raikes for a very valuable and detailed review. The work was partially supported by the Edinburgh Anisotropy Project and by the Natural Environment Research Council. It is published with the approval of the Director of the British Geological Survey (NERC). REFERENCES Aster, R. C., Shearer, P. M. & Berger, J., Quantitative measurements of shear-wave polarizations at the Anza seismic network, Southern California-implications for shear-wave splitting and earthquake prediction, J. geophys. Res., 95, Backus, G. E., Long-wave elastic anisotropy produced by horizontal layering, J. geophys. Res., 66, Booth, D. C. & Crampin, S., Shear-wave polarizations on a curved wavefront at an isotropic free-surface, Geophys. J. R. astr. Sot., 83, Booth, D. C., Crampin, S., Lovell, J. H. & Chiu, J.-M., Temporal changes in shear-wave splitting during an earthquake swarm in Arkansas, J. geophys. Res., 95, Bush, I., Modelling shear-wave anisotropy in the Paris Basin, PhD dtisertation, University of Edinburgh. Bush, I. & Crampin, S., Observations of EDA and PTL anisotropy in shear-wave VSPs, 57th Ann. Znt. SEG Mtg, New Orleans, Expanded Abstracts, pp Bush, I. & Crampin, S., Paris Basin VSPs: case history establishing combinations of fine-layer (and matrix) anisotropy and crack anisotropy from modelling shear wavefields near point singularities, Geophys. J. Znt., this issue. Crampin, S., Seismic wave propagation through a cracked solid: polarization as a possible dilatancy diagnostic, Geophys. J. R. astr. Sot., 53, Crampin, S., A review of wave motion in anisotropic and cracked elastic-media, Wave Motion, 3, Crampin, S., Effective elastic constants for wave propagation through cracked solids, Geophys. J. R. astr. Sot., 76, Crampin, S., Evidence for aligned cracks in the Earth s crust, First Break, 3, Crampin, S., Geological and industrial implications of extensive-dilatancy anisotropy, Nature, 328, Crampin, S., Non-parallel shear-wave polarizations in
Effects of point singularities on shear-wave propagation in sedimentary basins
 Geophys. J. Znt. (1991) 107, 531-543 Effects of point singularities on shear-wave propagation in sedimentary basins Stuart Crampin British Geological Survey, Murchkon ouse, West Mains Road, Edinburgh E9
Wave propagation through fluid-filled inclusions of various shapes: interpretation of extensive-dilatancy anisotropy
 Geophys. J. ht. (1991) 104, 611-623 Wave propagation through fluid-filled inclusions of various shapes: interpretation of extensive-dilatancy anisotropy Stuart Crampin Edinburgh Anisotropy Project, British
SUGGESTIONS FOR A CONSISTENT TERMINOLOGY FOR SEISMIC ANISOTROPY
 Geophysical Prospecting 37,753-770, 1989 SUGGESTIONS FOR A CONSISTENT TERMINOLOGY FOR SEISMIC ANISOTROPY STUART CRAMPIN ABSTRACT CRAMPIN, S. 1989. Suggestions for a consistent terminology for seismic anisotropy.
PEAT SEISMOLOGY Lecture 9: Anisotropy, attenuation and anelasticity
 PEAT8002 - SEISMOLOGY Lecture 9: Anisotropy, attenuation and anelasticity Nick Rawlinson Research School of Earth Sciences Australian National University Anisotropy Introduction Most of the theoretical
Observation of shear-wave splitting from microseismicity induced by hydraulic fracturing: A non-vti story
 Observation of shear-wave splitting from microseismicity induced by hydraulic fracturing: A non-vti story Petr Kolinsky 1, Leo Eisner 1, Vladimir Grechka 2, Dana Jurick 3, Peter Duncan 1 Summary Shear
Complex component analysis of shear-wave splitting: theory
 Geophys. J. Int. (1991) 17, 597-64 Complex component analysis of shear-wave splitting: theory Xiang-Yang Li1,2 and Stuart Crampid ' Edinburgh Anisotropy Project, British Geological Survey, Murchison House,
Evaluation Of The Fracture Sizes By Using The Frequency Dependence Of Anisotropy
 Evaluation Of The Fracture Sizes By Using The Frequency Dependence Of Anisotropy Vahid Mahmoudian Ataabadi Arvandan Oil and Gas Company Saeed Sajjadian Hafizollah Kashani Birgani Abstract: Frequency-dependent
Seismic inversion for the parameters of two orthogonal fracture sets in a VTI background medium
 GEOPHYSICS, VOL. 67, NO. 1 (JANUARY-FEBRUARY 2002); P. 292 299, 3 FIGS. 10.1190/1.1451801 Seismic inversion for the parameters of two orthogonal fracture sets in a VTI background medium Andrey Bakulin,
Body-wave radiation patterns and AVO in transversely isotropic media
 GEOPHYSICS, VOL. 60, NO. 5 (SEPTEMBER-OCTOBER 1995); P. 1409-1425, 11 FIGS. Body-wave radiation patterns and AVO in transversely isotropic media llya Tsvankin* ABSTRACT The angular dependence of reflection
P235 Modelling Anisotropy for Improved Velocities, Synthetics and Well Ties
 P235 Modelling Anisotropy for Improved Velocities, Synthetics and Well Ties P.W. Wild* (Ikon Science Ltd), M. Kemper (Ikon Science Ltd), L. Lu (Ikon Science Ltd) & C.D. MacBeth (Heriot Watt University)
Effects of Fracture Parameters in an Anisotropy Model on P-Wave Azimuthal Amplitude Responses
 PROC. ITB Eng. Science Vol. 38 B, No. 2, 2006, 159-170 159 Effects of Fracture Parameters in an Anisotropy Model on P-Wave Azimuthal Amplitude Responses Fatkhan Program Studi Teknik Geofisika FIKTM-ITB
Modeling seismic wave propagation during fluid injection in a fractured network: Effects of pore fluid pressure on time-lapse seismic signatures
 Modeling seismic wave propagation during fluid injection in a fractured network: Effects of pore fluid pressure on time-lapse seismic signatures ENRU LIU, SERAFEIM VLASTOS, and XIANG-YANG LI, Edinburgh
Bulletin of the Seismological Society of America, Vol. 95, No. 1, pp , February 2005, doi: /
 Bulletin of the Seismological Society of America, Vol. 95, No. 1, pp. 354 360, February 2005, doi: 10.1785/0120040092 Comment on Systematic Analysis of Shear-Wave Splitting in the Aftershock Zone of the
Reflection moveout and parameter estimation for horizontal transverse isotropy
 GEOPHYSICS, VOL. 62, NO. 2 (MARCH-APRIL 1997); P. 614 629, 7 FIGS. Reflection moveout and parameter estimation for horizontal transverse isotropy Ilya Tsvankin ABSTRACT Transverse isotropy with a horizontal
Chapter 1. Introduction EARTH MODEL BUILDING
 Chapter 1 Introduction Seismic anisotropy in complex earth subsurface has become increasingly important in seismic imaging due to the increasing offset and azimuth in modern seismic data. To account for
Temporal changes in shear-wave splitting at an isolated swarm of small earthquakes in 1992 near Dongfang, Hainan Island, southern China
 Geophys. J. Int. (1998) 135, 102 112 Temporal changes in shear-wave splitting at an isolated swarm of small earthquakes in 1992 near Dongfang, Hainan Island, southern China Yuan Gao,1,3 Peide Wang,2 Sihua
Comparison of two physical modeling studies of 3D P-wave fracture detection
 Comparison of two physical modeling studies of 3D P-wave fracture detection ZHONGPING QIAN 1,2, XIANG-YANG LI 1 AND SHANGXU WANG 3 1 British Geological Survey, Murchison House, West Mains Road, Edinburgh
Robert W. Vestrum and R. James Brown
 Group versus phase velocity in laboratory measurements on orthorhombic samples Robert W. Vestrum and R. James Brown ABSTRACT In laboratory measurements of traveltimes across anisotropic materials, there
Edinburgh Anisotropy Project, British Geological Survey, Murchison House, West Mains
 Frequency-dependent AVO attribute: theory and example Xiaoyang Wu, 1* Mark Chapman 1,2 and Xiang-Yang Li 1 1 Edinburgh Anisotropy Project, British Geological Survey, Murchison House, West Mains Road, Edinburgh
6298 Stress induced azimuthally anisotropic reservoir - AVO modeling
 6298 Stress induced azimuthally anisotropic reservoir - AVO modeling M. Brajanovski* (Curtin University of Technology), B. Gurevich (Curtin University of Technology), D. Nadri (CSIRO) & M. Urosevic (Curtin
7.2.1 Seismic waves. Waves in a mass- spring system
 7..1 Seismic waves Waves in a mass- spring system Acoustic waves in a liquid or gas Seismic waves in a solid Surface waves Wavefronts, rays and geometrical attenuation Amplitude and energy Waves in a mass-
An efficient wave extrapolation method for tilted orthorhombic media using effective ellipsoidal models
 An efficient wave extrapolation method for tilted orthorhombic media using effective ellipsoidal models Item Type Conference Paper Authors Waheed Umair bin; Alkhalifah Tariq Ali Eprint version Pre-print
Acoustic Anisotropy Measurements and Interpretation in Deviated Wells
 Acoustic Anisotropy Measurements and Interpretation in Deviated Wells X. M. Tang, and D. Patterson, Houston Technology Center, Baker Atlas, Houston, Texas, USA ABSTRACT Many acoustic anisotropy measurements
Seismic Waves in Complex 3 D Structures, 26 (2016), (ISSN , online at
, (ISSN , online at") Kirchhoff prestack depth migration in simple orthorhombic and triclinic models with differently rotated elasticity tensor: comparison with zero-offset travel-time perturbations Václav Bucha Department
Kirchhoff prestack depth migration in simple orthorhombic and triclinic models with differently rotated elasticity tensor: comparison with zero-offset travel-time perturbations Václav Bucha Department
P314 Anisotropic Elastic Modelling for Organic Shales
 P314 Anisotropic Elastic Modelling for Organic Shales X. Wu* (British Geological Survey), M. Chapman (British Geological Survey), X.Y. Li (British Geological Survey) & H. Dai (British Geological Survey)
Radiation pattern in homogeneous and transversely isotropic attenuating media
 Radiation pattern in homogeneous and transversely isotropic attenuating media Satish Sinha*, Sergey Abaseyev** and Evgeni Chesnokov** *Rajiv Gandhi Institute of Petroleum Technology, Rae Bareli, UP 229010
Phase-shift modelling for HTI media
 HTI-Modelling Phase-shift modelling for HTI media R. K. Sharma and R. J. Ferguson ABSTRACT Fractures play an important role in hydrocarbon production as they determine the pathways and volume of crustal
The Deconvolution of Multicomponent Trace Vectors
 The Deconvolution of Multicomponent Trace Vectors Xinxiang Li, Peter Cary and Rodney Couzens Sensor Geophysical Ltd., Calgary, Canada xinxiang_li@sensorgeo.com Summary Deconvolution of the horizontal components
Prevailing-frequency approximation of the coupling ray theory for S waves
 Prevailing-frequency approximation of the coupling ray theory for S waves Petr Bulant & Luděk Klimeš Department of Geophysics Faculty of Mathematics and Physics Charles University in Prague S EI S MIC
Introduction to Seismology Spring 2008
 MIT OpenCourseWare http://ocw.mit.edu 1.510 Introduction to Seismology Spring 008 For information about citing these materials or our Terms of Use, visit: http://ocw.mit.edu/terms. 1.510 Introduction to
Moveout approximation for P waves in a homogeneous VTI medium
 Moveout approximation for P waves in a homogeneous VTI medium Véronique Farra 1 and Ivan Pšenčík 2 1 Institut de Physique du Globe de Paris, Sorbonne Paris Cité, Université Paris Diderot, UMR 7154 CNRS,
Shear-wave anisotropy and the stress field from borehole recordings at 2.5 km depth at Cajon Pass
 Geophys. J. Int. (1997) 129,439-449 Shear-wave anisotropy and the stress field from borehole recordings at 2.5 km depth at Cajon Pass Yun Liu,132 Stuart Crampin' and Rachael E. Abercrombie3'* 'Department
Nonhyperbolic Reflection Moveout for Orthorhombic Media
 Nonhyperbolic Reflection Moveout for Orthorhombic Media AbdulFattah Al-Dajani and M. Nafi Toksöz Earth Resources Laboratory Dept. of Earth, Atmospheric, and Planetary Sciences Massachusetts Institute of
Numerical Modeling for Different Types of Fractures
 umerical Modeling for Different Types of Fractures Xiaoqin Cui* CREWES Department of Geoscience University of Calgary Canada xicui@ucalgary.ca and Laurence R. Lines Edward S. Krebes Department of Geoscience
Seismic fracture detection in the Second White Speckled Shale: Anisotropic perspectives on an isotropic workflow
 Fracture detection in the SWS Seismic fracture detection in the Second White Speckled Shale: Anisotropic perspectives on an isotropic workflow David Cho, Craig Coulombe, Scott McLaren, Kevin Johnson and
Seismic anisotropy in coal beds David Gray Veritas, Calgary, Canada
 Seismic anisotropy in coal beds David Gray Veritas, Calgary, Canada Dave_Gray@veritasdgc.com Summary Methods of measuring seismic azimuthal anisotropy are being used increasingly to detect fractures in
An empirical method for estimation of anisotropic parameters in clastic rocks
 An empirical method for estimation of anisotropic parameters in clastic rocks YONGYI LI, Paradigm Geophysical, Calgary, Alberta, Canada Clastic sediments, particularly shale, exhibit transverse isotropic
Cross-well seismic modelling for coal seam delineation
 P-134 Sanjeev Rajput, CSIRO, P. Prasada Rao*, N. K. Thakur, NGRI Summary Finite-difference analyses is attempted to simulate a multi layered complex coal seam model in order to differentiate top and bottom
The scatter of time-delays in shear-wave splitting above small earthquakes
 Geophys. J. Int. (2004) 156, 39 44 doi: 10.1111/j.1365-246X.2004.02040.x FAST TRACK PAPER The scatter of time-delays in shear-wave splitting above small earthquakes Stuart Crampin, 1, Sheila Peacock, 2
Effect of fracture scale length and aperture on seismic wave propagation: An experimental study
 University of Petroleum /CNPC Key Lab 12iwsa-wei.doc Mar 2007 Effect of fracture scale length and aperture on seismic wave propagation: An experimental study Jianxin Wei 1, Bangrang Di 1 and Xiang-Yang
Summary. Simple model for kerogen maturity (Carcione, 2000)
") Malleswar Yenugu* and De-hua Han, University of Houston, USA Summary The conversion of kerogen to oil/gas will build up overpressure. Overpressure is caused by conversion of solid kerogen to fluid hydrocarbons
Malleswar Yenugu* and De-hua Han, University of Houston, USA Summary The conversion of kerogen to oil/gas will build up overpressure. Overpressure is caused by conversion of solid kerogen to fluid hydrocarbons
SHEAR-WAVE ANISOTROPY IN THE AUSTIN CHALK, TEXAS, FROM MULTIOFFSET VSP DATA: CASE STUDIES
 CANADAN JOURNAL OF EPLORATON GEOPHYSCS VOL 29, NO (JUNE 993), P 63-76 SHEAR-WAVE ANSOTROPY N THE AUSTN CHALK, TEAS, FROM MULTOFFSET VSP DATA: CASE STUDES GARETH S YARDLEY AND STUART CRAMPN The Austin Chalk
Correspondence between the low- and high-frequency limits for anisotropic parameters in a layered medium
 GEOPHYSICS VOL. 74 NO. MARCH-APRIL 009 ; P. WA5 WA33 7 FIGS. 10.1190/1.3075143 Correspondence between the low- and high-frequency limits for anisotropic parameters in a layered medium Mercia Betania Costa
Focal mechanisms produced by shear faulting in weakly transversely isotropic crustal rocks
 GEOPHYSICS, VOL. 71, NO. 5 SEPTEMBER-OCTOBER 2006 ; P. D145 D151, 6 FIGS., 2 TABLES. 10.1190/1.2236378 Focal mechanisms produced by shear faulting in weakly transversely isotropic crustal rocks Václav
Receiver. Johana Brokešová Charles University in Prague
 Propagation of seismic waves - theoretical background Receiver Johana Brokešová Charles University in Prague Seismic waves = waves in elastic continuum a model of the medium through which the waves propagate
Brittle Deformation. Earth Structure (2 nd Edition), 2004 W.W. Norton & Co, New York Slide show by Ben van der Pluijm
, 2004 W.W. Norton & Co, New York Slide show by Ben van der Pluijm") Lecture 6 Brittle Deformation Earth Structure (2 nd Edition), 2004 W.W. Norton & Co, New York Slide show by Ben van der Pluijm WW Norton, unless noted otherwise Brittle deformation EarthStructure (2 nd
Lecture 6 Brittle Deformation Earth Structure (2 nd Edition), 2004 W.W. Norton & Co, New York Slide show by Ben van der Pluijm WW Norton, unless noted otherwise Brittle deformation EarthStructure (2 nd
ERTH2020 Introduction to Geophysics The Seismic Method. 1. Basic Concepts in Seismology. 1.1 Seismic Wave Types
 ERTH2020 Introduction to Geophysics The Seismic Method 1. Basic Concepts in Seismology 1.1 Seismic Wave Types Existence of different wave types The existence of different seismic wave types can be understood
Scientific Drilling 0 Springer-Veriag 1989
 Scientific Drilling (1989) 1: 21-26 Scientific Drilling 0 Springer-Veriag 1989 Shear-wave splitting showing hydraulic dilation of pre-existing joints in granite Stuart Crampin and David C. Booth Edinburgh
Body-wave radiation patterns and AVO in transversely isotropic media
 GEOPHYSICS, VOL. 60, NO. 5 (SEPTEMBER-OCTOBER 1995); P. 1409-1425, 11 FIGS. Downloaded 10/31/13 to 138.67.12.93. Redistribution subject to SEG license or copyright; see Terms of Use at http://library.seg.org/
Exact elastic impedance in orthorhombic media
 Exact elastic impedance in orthorhombic media F. Zhang (hina University of Petroleum), X.Y. Li (hina University of Petroleum, British Geological Survey) SUMMARY onventional elastic/ray impedance approximations
A review of the effects of anisotropic layering on the propagation of seismic waves
 GeophysJ. R. QStr. SOC. (1977) 49,9-27 A review of the effects of anisotropic layering on the propagation of seismic waves Stuart Crampin Institute of Geological Sciences, Murchison House, West Mains Road,
A Case Study on Simulation of Seismic Reflections for 4C Ocean Bottom Seismometer Data in Anisotropic Media Using Gas Hydrate Model
 A Case Study on Simulation of Seismic Reflections for 4C Ocean Bottom Seismometer Data in Anisotropic Media Using Gas Hydrate Model Summary P. Prasada Rao*, N. K. Thakur 1, Sanjeev Rajput 2 National Geophysical
Use of spectral decomposition to detect dispersion anomalies associated with gas saturation. M. Chapman, J. Zhang, E. Odebeatu, E. Liu and X.Y. Li.
 Use of spectral decomposition to detect dispersion anomalies associated with gas saturation. M. Chapman, J. Zhang, E. Odebeatu, E. Liu and X.Y. Li. Summary Significant evidence suggests that hydrocarbon
P-wave reflection coefficients for transversely isotropic models with vertical and horizontal axis of symmetry
 GEOPHYSICS, VOL. 62, NO. 3 (MAY-JUNE 1997); P. 713 722, 7 FIGS., 1 TABLE. P-wave reflection coefficients for transversely isotropic models with vertical and horizontal axis of symmetry Andreas Rüger ABSTRACT
Understanding hydraulic fracture variability through a penny shaped crack model for pre-rupture faults
 Penny shaped crack model for pre-rupture faults Understanding hydraulic fracture variability through a penny shaped crack model for pre-rupture faults David Cho, Gary F. Margrave, Shawn Maxwell and Mark
AVAZ and VVAZ practical analysis to estimate anisotropic properties
 AVAZ and VVAZ practical analysis to estimate anisotropic properties Yexin Liu*, SoftMirrors Ltd., Calgary, Alberta, Canada yexinliu@softmirrors.com Summary Seismic anisotropic properties, such as orientation
Elastic wavefield separation for VTI media
 CWP-598 Elastic wavefield separation for VTI media Jia Yan and Paul Sava Center for Wave Phenomena, Colorado School of Mines ABSTRACT The separation of wave modes from isotropic elastic wavefields is typically
SHEAR-WAVE REFLECTION MOVEOUT FOR AZIMUTHALLY ANISOTROPIC MEDIA
 SHEAR-WAVE REFLECTION MOVEOUT FOR AZIMUTHALLY ANISOTROPIC MEDIA AbdulFattah AI-Dajani and M. Nafi Toksoz Earth Resources Laboratory Department of Earth, Atmospheric, and Planetary Sciences Massachusetts
Maximize the potential of seismic data in shale exploration and production Examples from the Barnett shale and the Eagle Ford shale
 Maximize the potential of seismic data in shale exploration and production Examples from the Barnett shale and the Eagle Ford shale Joanne Wang, Paradigm Duane Dopkin, Paradigm Summary To improve the success
LECTURE 5 - Wave Equation Hrvoje Tkalčić " 2 # & 2 #
 LECTURE 5 - Wave Equation Hrvoje Tkalčić " 2 # "t = ( $ + 2µ ) & 2 # 2 % " 2 (& ' u r ) = µ "t 2 % & 2 (& ' u r ) *** N.B. The material presented in these lectures is from the principal textbooks, other
Václav Bucha. Department of Geophysics Faculty of Mathematics and Physics Charles University in Prague. SW3D meeting June 6-7, 2016 C OM S TR 3 D
 Kirchhoff prestack depth migration in simple orthorhombic and triclinic models with differently rotated elasticity tensor: comparison with zero-offset travel-time perturbations Václav Bucha Department
F-K Characteristics of the Seismic Response to a Set of Parallel Discrete Fractures
 F-K Characteristics of the Seismic Response to a Set of Parallel Discrete Fractures Yang Zhang 1, Xander Campman 1, Samantha Grandi 1, Shihong Chi 1, M. Nafi Toksöz 1, Mark E. Willis 1, Daniel R. Burns
An integrated study of fracture detection using P-wave seismic data
 An integrated study of fracture detection using P-wave seismic data Yungui Xu 1, 2, An Yong 3, Xiang-Yang Li 1,2,3, Cao Zhenglin 4 1 British Geological Survey, Murchison House, West Mains Road, Edinburgh
Properties of S waves near a kiss singularity: a comparison of exact and ray solutions
 Geophys. J. Int. (1999) 138, 581 589 Properties of S waves near a kiss singularity: a comparison of exact and ray solutions Václav Vavryčuk Geophysical Institute, Academy of Sciences of the Czech Republic,
Kirchhoff prestack depth migration in simple models of various anisotropy
 Kirchhoff prestack depth migration in simple models of various anisotropy Václav Bucha Department of Geophysics, Faculty of Mathematics and Physics, Charles University, Ke Karlovu, 6 Praha, Czech Republic,
Elastic wave-mode separation for VTI media
 GEOPHYSICS, VOL. 74, NO. 5 SEPTEMBER-OCTOBER 2009 ; P. WB19 WB32, 19 FIGS. 10.1190/1.3184014 Elastic wave-mode separation for VTI media Jia Yan 1 and Paul Sava 1 ABSTRACT Elastic wave propagation in anisotropic
DISPLACEMENTS AND STRESSES IN AN ANISOTROPIC MEDIUM DUE TO NON-UNIFORM SLIP ALONG A VERY LONG STRIKE-SLIP FAULT
 ISET Journal of Earthquake Technology, Paper No. 45, Vol. 4, No. 1, March 005, pp. 1-11 DISPLACEMENTS AND STRESSES IN AN ANISOTROPIC MEDIUM DUE TO NON-UNIFORM SLIP ALONG A VERY LONG STRIKE-SLIP FAULT Dinesh
P306 Seismic Velocity Anisotropy in the Illizi Basin of Eastern Algeria
 P306 Seismic Velocity Anisotropy in the Illizi Basin of Eastern Algeria M. Wallace* (GX Technology), J. Maher (GX Technology), S. Schapper (GX Technology), B. Taylor (BP) & S.R. Tod (BP) SUMMARY The Tiguentourine
Relationships between the velocities and the elastic constants of an anisotropic solid possessing orthorhombic symmetry
 Relationships between the velocities and the elastic constants of an anisotropic solid possessing orthorhombic symmetry R. James Brown ABSTRACT This paper reviews the equations of body-wave propagation
Salt anisotropy: Ultrasonic lab experiments and traveltime ramifications Jingjing Zong *, Robert Stewart and Nikolay Dyaur University of Houston
 Jingjing ong *, Robert Stewart and Nikolay Dyaur University of Houston Summary Salt plays an important role in the Gulf of Mexico and other areas of the world. In the previous laboratory measurements,
Workflows for Sweet Spots Identification in Shale Plays Using Seismic Inversion and Well Logs
 Workflows for Sweet Spots Identification in Shale Plays Using Seismic Inversion and Well Logs Yexin Liu*, SoftMirrors Ltd., Calgary, Alberta, Canada yexinliu@softmirrors.com Summary Worldwide interest
AVAZ inversion for fracture orientation and intensity: a physical modeling study
 AVAZ inversion for fracture orientation and intensity: a physical modeling study Faranak Mahmoudian*, Gary F. Margrave, and Joe Wong, University of Calgary. CREWES fmahmoud@ucalgary.ca Summary We present
of other regional earthquakes (e.g. Zoback and Zoback, 1980). I also want to find out
. I also want to find out") 4. Focal Mechanism Solutions A way to investigate source properties of the 2001 sequence is to attempt finding well-constrained focal mechanism solutions to determine if they are consistent with those
4. Focal Mechanism Solutions A way to investigate source properties of the 2001 sequence is to attempt finding well-constrained focal mechanism solutions to determine if they are consistent with those
A review of the current understanding of seismic shear-wave splitting in the Earth s crust and common fallacies in interpretation
 Available online at www.sciencedirect.com Wave Motion 45 (2008) 675 722 www.elsevier.com/locate/wavemoti A review of the current understanding of seismic shear-wave splitting in the Earth s crust and common
Prevailing-frequency approximation of the coupling ray theory for electromagnetic waves or elastic S waves
 Prevailing-frequency approximation of the coupling ray theory for electromagnetic waves or elastic S waves Luděk Klimeš and Petr Bulant Department of Geophysics, Faculty of Mathematics and Physics, Charles
Reflection shear-wave data collected near the principal axes of azimuthal anisotropy
 GEOPHYSICS, VOL. 55, NO. 2 (FEBRUARY 1990): P. 147-IX. 13 FIGS. Reflection shear-wave data collected near the principal axes of azimuthal anisotropy H. B. Lynn* and L. A. Thornsen* ABSTRACT The presence
NMO ellipse for a stratified medium with laterally varying velocity
 CWP-685 NMO ellipse for a stratified medium with laterally varying velocity Mamoru Takanashi 1, 2 & Ilya Tsvankin 1 1 Center for Wave Phenomena, Geophysics Department, Colorado School of Mines, Golden,
Synthetic Seismogram A Tool to Calibrate PP & PS Seismic Data
 P-475 Summary Synthetic Seismogram A Tool to Calibrate PP & PS Seismic P. Sugadha*, M. K. Jain, M. Singh, ONGC Conventional P wave technology will not meet all the requirements of the industry. Hence,
Feasibility and design study of a multicomponent seismic survey: Upper Assam Basin
 P-276 Summary Feasibility and design study of a multicomponent seismic survey: Upper Assam Basin K.L.Mandal*, R.K.Srivastava, S.Saha, Oil India Limited M.K.Sukla, Indian Institute of Technology, Kharagpur
Observations of stress relaxation before earthquakes
 Geophys. J. Int. (2004) 157, 578 582 doi: 10.1111/j.1365-246X.2004.02207.x FAST TRACK PAPER Observations of stress relaxation before earthquakes Yuan Gao 1,2 and Stuart Crampin 2,3 1 Centre for Analysis
The failure of the sounding assumption in electroseismic investigations
 The failure of the sounding assumption in electroseismic investigations F.D. Fourie, J.F. Botha Institute for Groundwater Studies, University of the Free State, PO Box 339, Bloemfontein, 9300, South Africa
Conversion coefficients at a liquid/solid interface
 Conversion coefficients at a liquid/solid interface P.F. aley Conversion coefficients ABSTACT When upward-propagating rays transporting seismic energy are recorded at the earth s surface, the vertical
Detecting fractures using time-lapse 3C-3D seismic data
 data Zimin Zhang, Don C. Lawton and Robert R. Stewart ABSTRACT This report presents the interpretation of time-lapse 3C-3D seismic data for fracture detection in a Saskatchewan potash mine. Seismic interpretation
Seismic techniques for imaging fractures, cracks and faults in the Earth. Michael Kendall
 Seismic techniques for imaging fractures, cracks and faults in the Earth Michael Kendall Issues and Challanges Geometry (aspect ratio, size, orientation, density) Non-uniqueness (e.g., single set of aligned
Stress-induced transverse isotropy in rocks
 Stanford Exploration Project, Report 80, May 15, 2001, pages 1 318 Stress-induced transverse isotropy in rocks Lawrence M. Schwartz, 1 William F. Murphy, III, 1 and James G. Berryman 1 ABSTRACT The application
SENSITIVITY ANALYSIS OF AMPLITUDE VARIATION WITH OFFSET (AVO) IN FRACTURED MEDIA
 IN FRACTURED MEDIA") SENSITIVITY ANALYSIS OF AMPLITUDE VARIATION WITH OFFSET AVO) IN FRACTURED MEDIA Mary L. Krasovec, William L. Rodi, and M. Nafi Toksoz Earth Resources Laboratory Department of Earth, Atmospheric, and Planetary
SENSITIVITY ANALYSIS OF AMPLITUDE VARIATION WITH OFFSET AVO) IN FRACTURED MEDIA Mary L. Krasovec, William L. Rodi, and M. Nafi Toksoz Earth Resources Laboratory Department of Earth, Atmospheric, and Planetary
P137 Our Experiences of 3D Synthetic Seismic Modeling with Tip-wave Superposition Method and Effective Coefficients
 P137 Our Experiences of 3D Synthetic Seismic Modeling with Tip-wave Superposition Method and Effective Coefficients M. Ayzenberg (StatoilHydro), A. Aizenberg (Institute of Petroleum Geology and Geophysics),
PEAT SEISMOLOGY Lecture 12: Earthquake source mechanisms and radiation patterns II
 PEAT8002 - SEISMOLOGY Lecture 12: Earthquake source mechanisms and radiation patterns II Nick Rawlinson Research School of Earth Sciences Australian National University Waveform modelling P-wave first-motions
We Challenges in shale-reservoir characterization by means of AVA and AVAZ
 We-06-15 Challenges in shale-reservoir characterization by means of AVA and AVAZ N.C. Banik* (WesternGeco), M. Egan (WesternGeco), A. Koesoemadinata (WesternGeco) & A. Padhi (WesternGeco) SUMMARY In most
Finite difference elastic modeling of the topography and the weathering layer
 Finite difference elastic modeling of the topography and the weathering layer Saul E. Guevara and Gary F. Margrave ABSTRACT Finite difference 2D elastic modeling is used to study characteristics of the
Exact Seismic Velocities for VTI and HTI Media and Extended Thomsen Formulas for Stronger Anisotropies. Abstract
 Submitted to : Geophysics Exact Seismic Velocities for VTI and HTI Media and Extended Thomsen Formulas for Stronger Anisotropies James G. Berryman 1, 1 University of California, Lawrence Berkeley National
The New Geophysics: stress-forecasting as an alternative to earthquake prediction - a paradigm shift
 24/09.09 - Crampin&Gao(2009b) TITLE PAGE The New Geophysics: stress-forecasting as an alternative to earthquake prediction - a paradigm shift Stuart Crampin 1,2,* and Yuan Gao 3 1 School of GeoSciences,
Stuart Crampin and David C. Booth British Geoiogica/Survey, Murchison House, West Mains Road, Edinburgh EH93LA, Scotland
 Geophys. J. R. astr. SOC. (1986) 84,401-412 Shear-wave polarizations in the Peter the First Range indicating crack-induced anisotropy in a thrust-fault regime Stuart Crampin and David C. Booth British
COMPARISON OF OPTICAL AND ELASTIC BREWSTER S ANGLES TO PROVIDE INVUITIVE INSIGHT INTO PROPAGATION OF P- AND S-WAVES. Robert H.
 COMPARISON OF OPTICAL AND ELASTIC BREWSTER S ANGLES TO PROVIDE INVUITIVE INSIGHT INTO PROPAGATION OF P- AND S-WAVES Robert H. Tatham Department of Geological Sciences The University of Texas at Austin
3-D description of normal moveout in anisotropic inhomogeneous media
 GEOPHYSICS, VOL. 63, NO. 3 (MAY-JUNE 1998); P. 1079-1092,10 FIGS. 3-D description of normal moveout in anisotropic inhomogeneous media Vladimir Grechka* and Ilya Tsvankin* ABSTRACT We present a new equation
Estimation and Modelling of Anisotropy in Vertical and Walkaway Seismic Profiles at Two North Caucasus Oil Fields
 Estimation and Modelling of Anisotropy in ertical and Walkaway Seismic Profiles at Two North Caucasus Oil Fields by Cohn P. Slater (B.Sc., University of Edinburgh) Thesis submitted for the degree of Doctor
A review of the current understanding of seismic shear-wave splitting in the Earth s crust and common fallacies in interpretation
 Available online at www.sciencedirect.com Wave Motion 45 (2008) 675 722 www.elsevier.com/locate/wavemoti A review of the current understanding of seismic shear-wave splitting in the Earth s crust and common
Basic principles of the seismic method
 Chapter 2 Basic principles of the seismic method In this chapter we introduce the basic notion of seismic waves. In the earth, seismic waves can propagate as longitudinal (P) or as shear (S) waves. For
Exercise: concepts from chapter 8
 Reading: Fundamentals of Structural Geology, Ch 8 1) The following exercises explore elementary concepts associated with a linear elastic material that is isotropic and homogeneous with respect to elastic
Stress induced seismic velocity anisotropy study Bin Qiu, Mita Sengupta, Jorg Herwanger, WesternGeco/Schlumberger
 anisotropy study Bin Qiu, Mita Sengupta, Jorg Herwanger, WesternGeco/Schlumberger Summary A method of calculating stress induced seismic velocity anisotropy is presented and studied. In a first step an