Scalable Joint Modeling of Longitudinal and Point Process Data:
|
|
|
- Allyson Ball
- 5 years ago
- Views:
Transcription


1 Scalable Joint Modeling of Longitudinal and Point Process Data: Disease Trajectory Prediction and Improving Management of Chronic Kidney Disease Joe Futoma UAI Bayesian Applications Workshop, 2016 June 29,
2 Outline Motivation Working with EHR Data Proposed Joint Model Experiments & Results In Clinical Practice 2
 PCP Visit ED Visit Hospital Admission Acute MI Age")
3 egfr 1 st Nephrology Visit Kidney Nephrology Visit Function (GFR) PCP Visit ED Visit Hospital Admission Acute MI Age Death
4 Untreated diabetes & high blood pressure. Normal kidney function, but with evidence of kidney damage. egfr 1 st Nephrology Visit Nephrology Visit PCP Visit No regular medical care. ED Visit Hospital Admission Acute MI Death
5 egfr Age 48 A few more ER trips Kidney function falling 1 st Nephrology Visit Nephrology Visit PCP Visit ED Visit Hospital Admission Acute MI Death
6 egfr 1 st Nephrology Visit Nephrology Visit PCP Visit ED Visit Age 49 Kidney function now 50% Hospital Admission Acute MI Death
7 egfr 1 st Nephrology Visit Nephrology Visit PCP Visit ED Visit Hospital Admission Acute MI Death Age 50 Gets a Duke Primary Care doc Kidney function 30%
8 egfr 1 st Nephrology Visit Nephrology Visit PCP Visit ED Visit Hospital Admission Acute MI Death Age 51 CKD first noted on problem list
9 egfr 1 st Nephrology Visit Nephrology Visit PCP Visit ED Visit Hospital Admission Acute MI Death Referred to Nephrology
10 egfr 1 st Nephrology Visit Dialysis Begins Nephrology Visit PCP Visit ED Visit Hospital Admission Acute MI Death Three months later presents to ER with kidney failure symptoms and crash starts dialysis
11 egfr 1 st Nephrology Visit Dialysis Begins Nephrology Visit PCP Visit ED Visit Hospital Admission Acute MI Death
12 egfr Missed Opportunities: 1 st Nephrology Visit Nephrology Visit To prevent or delay kidney failure PCP Visit ED Visit Hospital Admission To prepare for kidney failure Acute MI Death
13 42% starting dialysis have no prior nephrology care 13
14 <10% with moderate CKD <50% with severe CKD even aware of illness! 14
15 Chronic Kidney Disease (CKD) Progressive loss of kidney function with significant morbidity, mortality, health system utilization, economic costs 15
16 Chronic Kidney Disease (CKD) Heart disease Progressive loss of kidney function with significant morbidity, mortality, health system utilization, economic costs 15


17 Chronic Kidney Disease (CKD) Heart disease Diabetes Progressive loss of kidney function with significant morbidity, mortality, health system utilization, economic costs 15
18 Outline Motivation Working with EHR Data Proposed Joint Model Experiments & Results In Clinical Practice 16
19 Data Expertise Statistical Expertise Clinical Expertise 17


20 Real EHR data poses many challenges! 18


21 Chronicles Extract, Transform, and Load Demographics Encounters Diagnoses (13,000 ICD9) Procedures (10,000 CPT) Medications Lab Results Decision Support Repository Physician Orders Culture Radiation/Oncology Notes Results Vitals Social History Problem Lists Allergies Nursing notes Geography 19 Extract, Transform, and Load Clarity
22 Data acquisition from DEDUCE 630,000 patients pulled, one encounter in previous year (winter 2015) 393,000 with at least 1 serum creatinine lab 115,000 with 10+ labs 30,000 patients age 65+ and meet criteria for moderate stage CKD 20


23 Transforming Data
24 22
25 Quantifying CKD Progression Estimated glomerular filtration rate (egfr) is an extremely noisy estimate of kidney function. Most common validated equation: egf R = 141 min(s cr /apple, 1) max(s cr /apple, 1) Age I(female) I(black) S cr : Serum creatinine (mg/dl) apple :0.7 (female), 0.9 (male) : (female), (male) 23
 max(s cr /apple, 1) 1.209 0.993 Age 1.018 I(female) 1.159 I(black) S cr : Serum creatinine (mg/dl) apple :0.")
26 Quantifying CKD Progression Estimated glomerular filtration rate (egfr) is an extremely noisy estimate of kidney function. Most common validated equation: egf R = 141 min(s cr /apple, 1) max(s cr /apple, 1) Age I(female) I(black) S cr : Serum creatinine (mg/dl) apple :0.7 (female), 0.9 (male) : (female), (male) 23
27 Outline Motivation Working with EHR Data Proposed Joint Model Experiments & Results In Clinical Practice 24
28 Proposed Joint Model Goal: jointly model risks of future loss of kidney function, cardiac events Heart attacks (AMI), Stroke (CVA) Hierarchical latent variable model: captures dependencies between disease trajectory and event risk Submodels for longitudinal, event data with shared latent variables ~y i ~t i ~u i x i : egfrs at times ; : event times (may be none); covariates Conditional independence in joint likelihood: p(~y i,~u i z i,b i,f i,v i ; x i )=p(~y i z i,b i,f i ; x i )p( ~u i z i,b i,f i,v i ; x i ) 25
29 Longitudinal Submodel 26
30 Longitudinal Submodel Longitudinal values conditionally independent: p(~y i z i,b i,f i )= YN i j=1 p(y ij z i,b i,f i ) 26
31 Longitudinal Submodel Longitudinal values conditionally independent: p(~y i z i,b i,f i )= Values normally distributed, with mean a sum of 4 terms YN i j=1 p(y ij z i,b i,f i ) Can also view as GP with highly structured mean 26
32 Longitudinal Submodel Longitudinal values conditionally independent: p(~y i z i,b i,f i )= Values normally distributed, with mean a sum of 4 terms YN i j=1 p(y ij z i,b i,f i ) Can also view as GP with highly structured mean y i (t) =m i (t)+ i (t), i (t) iid N(0, m i (t) = p (t) > x ip + z (t) > z i + l (t) > b i + f i (t). 2 ) 26
33 Longitudinal Submodel Longitudinal values conditionally independent: p(~y i z i,b i,f i )= Values normally distributed, with mean a sum of 4 terms YN i j=1 p(y ij z i,b i,f i ) Can also view as GP with highly structured mean iid random noise y i (t) =m i (t)+ i (t), i (t) iid N(0, m i (t) = p (t) > x ip + z (t) > z i + l (t) > b i + f i (t). 2 ) 26
34 Longitudinal Submodel Longitudinal values conditionally independent: p(~y i z i,b i,f i )= Values normally distributed, with mean a sum of 4 terms YN i j=1 p(y ij z i,b i,f i ) Can also view as GP with highly structured mean y i (t) =m i (t)+ i (t), i (t) iid N(0, m i (t) = p (t) > x ip + z (t) > z i + l (t) > b i + f i (t). 2 ) 26
35 Longitudinal Submodel Longitudinal values conditionally independent: p(~y i z i,b i,f i )= Values normally distributed, with mean a sum of 4 terms YN i j=1 p(y ij z i,b i,f i ) Can also view as GP with highly structured mean y i (t) =m i (t)+ i (t), i (t) iid N(0, m i (t) = p (t) > x ip + z (t) > z i + l (t) > b i + f i (t). 2 ) Population component (fixed intercept and slope) 26
36 Longitudinal Submodel Longitudinal values conditionally independent: p(~y i z i,b i,f i )= Values normally distributed, with mean a sum of 4 terms YN i j=1 p(y ij z i,b i,f i ) Can also view as GP with highly structured mean y i (t) =m i (t)+ i (t), i (t) iid N(0, m i (t) = p (t) > x ip + z (t) > z i + l (t) > b i + f i (t). basis expansion, in practice [1,t] coefficient matrix baseline covariates Population component (fixed intercept and slope) 26 2 )
37 Longitudinal Submodel Longitudinal values conditionally independent: p(~y i z i,b i,f i )= Values normally distributed, with mean a sum of 4 terms YN i j=1 p(y ij z i,b i,f i ) Can also view as GP with highly structured mean y i (t) =m i (t)+ i (t), i (t) iid N(0, m i (t) = p (t) > x ip + z (t) > z i + l (t) > b i + f i (t). 2 ) 26
38 Longitudinal Submodel Longitudinal values conditionally independent: p(~y i z i,b i,f i )= Values normally distributed, with mean a sum of 4 terms YN i j=1 p(y ij z i,b i,f i ) Can also view as GP with highly structured mean y i (t) =m i (t)+ i (t), i (t) iid N(0, m i (t) = p (t) > x ip + z (t) > z i + l (t) > b i + f i (t). 2 ) Subpopulation component (unique disease trajectory with splines) 26
39 Longitudinal Submodel Longitudinal values conditionally independent: p(~y i z i,b i,f i )= Values normally distributed, with mean a sum of 4 terms YN i j=1 p(y ij z i,b i,f i ) Can also view as GP with highly structured mean y i (t) =m i (t)+ i (t), i (t) iid N(0, m i (t) = p (t) > x ip + z (t) > z i + l (t) > b i + f i (t). fixed B-spline expansion of time 2 ) coefficient subpopulation vector assignment (1-G), p(z i = g) / exp{w g > x iz } Subpopulation component (unique disease trajectory with splines) 26
40 Longitudinal Submodel Longitudinal values conditionally independent: p(~y i z i,b i,f i )= Values normally distributed, with mean a sum of 4 terms YN i j=1 p(y ij z i,b i,f i ) Can also view as GP with highly structured mean y i (t) =m i (t)+ i (t), i (t) iid N(0, m i (t) = p (t) > x ip + z (t) > z i + l (t) > b i + f i (t). 2 ) 26
41 Longitudinal Submodel Longitudinal values conditionally independent: p(~y i z i,b i,f i )= Values normally distributed, with mean a sum of 4 terms YN i j=1 p(y ij z i,b i,f i ) Can also view as GP with highly structured mean y i (t) =m i (t)+ i (t), i (t) iid N(0, m i (t) = p (t) > x ip + z (t) > z i + l (t) > b i + f i (t). 2 ) Individual component (random intercept and slope) 26
42 Longitudinal Submodel Longitudinal values conditionally independent: p(~y i z i,b i,f i )= Values normally distributed, with mean a sum of 4 terms YN i j=1 p(y ij z i,b i,f i ) Can also view as GP with highly structured mean y i (t) =m i (t)+ i (t), i (t) iid N(0, m i (t) = p (t) > x ip + z (t) > z i + l (t) > b i + f i (t). 2 ) basis expansion, in practice [1,t] random effect, b i N(0, b ) Individual component (random intercept and slope) 26
43 Longitudinal Submodel Longitudinal values conditionally independent: p(~y i z i,b i,f i )= Values normally distributed, with mean a sum of 4 terms YN i j=1 p(y ij z i,b i,f i ) Can also view as GP with highly structured mean y i (t) =m i (t)+ i (t), i (t) iid N(0, m i (t) = p (t) > x ip + z (t) > z i + l (t) > b i + f i (t). 2 ) 26
44 Longitudinal Submodel Longitudinal values conditionally independent: p(~y i z i,b i,f i )= Values normally distributed, with mean a sum of 4 terms YN i j=1 p(y ij z i,b i,f i ) Can also view as GP with highly structured mean y i (t) =m i (t)+ i (t), i (t) iid N(0, m i (t) = p (t) > x ip + z (t) > z i + l (t) > b i + f i (t). 2 ) Structured noise process (GP noise, transient trends) 26
45 Longitudinal Submodel Longitudinal values conditionally independent: p(~y i z i,b i,f i )= Values normally distributed, with mean a sum of 4 terms YN i j=1 p(y ij z i,b i,f i ) Can also view as GP with highly structured mean y i (t) =m i (t)+ i (t), i (t) iid N(0, m i (t) = p (t) > x ip + z (t) > z i + l (t) > b i + f i (t). 2 ) Structured noise process (GP noise, transient trends) 26 zero mean GP, OU kernel: K OU (t 1,t 2 )= f 2 exp{ t 1 t 2 } l
46 Longitudinal Submodel Longitudinal values conditionally independent: p(~y i z i,b i,f i )= Values normally distributed, with mean a sum of 4 terms YN i j=1 p(y ij z i,b i,f i ) Can also view as GP with highly structured mean y i (t) =m i (t)+ i (t), i (t) iid N(0, m i (t) = p (t) > x ip + z (t) > z i + l (t) > b i + f i (t). 2 ) 26
47 Point Process Submodel 27
48 Point Process Submodel Poisson Process model, conditional likelihood on [T i,t + i ], events at {u ik } K i k=1: 27
49 Point Process Submodel Poisson Process model, conditional likelihood on [T i,t + i ], events at {u ik } K i k=1: YK i Z T + i p( ~u i z i,b i,f i,v i )= r i (u ik )exp{ r i (t)dt} k=1 T i 27
50 Point Process Submodel Poisson Process model, conditional likelihood on [T i,t + i ], events at {u ik } K i k=1: YK i Z T + i p( ~u i z i,b i,f i,v i )= r i (u ik )exp{ r i (t)dt} k=1 Rate function: hazard function from Cox proportional hazards model T i Common choice in survival analysis 27
51 Point Process Submodel Poisson Process model, conditional likelihood on [T i,t + i ], events at {u ik } K i k=1: YK i Z T + i p( ~u i z i,b i,f i,v i )= r i (u ik )exp{ r i (t)dt} k=1 Rate function: hazard function from Cox proportional hazards model T i Common choice in survival analysis r i (t) =r 0 (t) exp{ > x ir + m i (t)+ m 0 i(t)+v i } 27
52 Point Process Submodel Poisson Process model, conditional likelihood on [T i,t + i ], events at {u ik } K i k=1: YK i Z T + i p( ~u i z i,b i,f i,v i )= r i (u ik )exp{ r i (t)dt} k=1 Rate function: hazard function from Cox proportional hazards model T i Common choice in survival analysis r i (t) =r 0 (t) exp{ > x ir + m i (t)+ m 0 i(t)+v i } piecewise constant baseline rate 27
53 Point Process Submodel Poisson Process model, conditional likelihood on [T i,t + i ], events at {u ik } K i k=1: YK i Z T + i p( ~u i z i,b i,f i,v i )= r i (u ik )exp{ r i (t)dt} k=1 Rate function: hazard function from Cox proportional hazards model T i Common choice in survival analysis r i (t) =r 0 (t) exp{ > x ir + m i (t)+ m 0 i(t)+v i } piecewise constant baseline rate coefficient vector 27
54 Point Process Submodel Poisson Process model, conditional likelihood on [T i,t + i ], events at {u ik } K i k=1: YK i Z T + i p( ~u i z i,b i,f i,v i )= r i (u ik )exp{ r i (t)dt} k=1 Rate function: hazard function from Cox proportional hazards model T i Common choice in survival analysis r i (t) =r 0 (t) exp{ > x ir + m i (t)+ m 0 i(t)+v i } piecewise constant baseline rate coefficient vector baseline covariates 27
55 Point Process Submodel Poisson Process model, conditional likelihood on [T i,t + i ], events at {u ik } K i k=1: YK i Z T + i p( ~u i z i,b i,f i,v i )= r i (u ik )exp{ r i (t)dt} k=1 Rate function: hazard function from Cox proportional hazards model T i Common choice in survival analysis r i (t) =r 0 (t) exp{ > x ir + m i (t)+ m 0 i(t)+v i } piecewise constant baseline rate coefficient vector baseline covariates association between event risk and expected mean/slope of egfr 27
56 Point Process Submodel Poisson Process model, conditional likelihood on [T i,t + i ], events at {u ik } K i k=1: YK i Z T + i p( ~u i z i,b i,f i,v i )= r i (u ik )exp{ r i (t)dt} k=1 Rate function: hazard function from Cox proportional hazards model T i Common choice in survival analysis r i (t) =r 0 (t) exp{ > x ir + m i (t)+ m 0 i(t)+v i } piecewise constant baseline rate coefficient vector baseline covariates association between event risk and expected mean/slope of egfr 27 random effect (frailty term): v i N(0, 2 v)
57 Inference Variational inference: find distribution q in approx. family close in KL to true posterior Equivalently, maximize a lower bound on marginal likelihood: p(y, u) L(q) E q [log p(y, u, z, b, f, v, ) log q(z,b,f,v, )] Mean-field assumption, fully factorized variational family: NY q(z,b,f,v, ) = q( ) q i (z i zi )q i (b i µ bi, bi )q i (v i µ vi, i=1 2 v i )q i (f i ) Variational distributions have same form as prior (multinomial, MVN, N) For f, adapt ideas from sparse GPs, use observation times as pseudo-inputs [Lloyd et al, 2014] Goal: learn optimal var. params. 2, pt. est. i = { zi,µ bi, bi,µ vi, v i,µ fi, fi } ˆ ELBO has closed form, exact gradients with automatic differentiation Stochastic optimization, subsample observations for noisy unbiased gradients wrt 28
58 Related Work Longitudinal model from [Schulam & Saria, 2015] Joint models in biostatistics: [Rizopoulos, 2012], [Proust- Lima et al., 2014] for introductions Typically fit via EM for MLE or MCMC for Bayesian setting In medicine: cross-sectional, data from single time point E.g. [Tangri et al. 2011]; no dynamic predictions, limits clinical utility 29
59 Outline Motivation Working with EHR Data Proposed Joint Model Experiments & Results In Clinical Practice 30
60 Dataset 23,450 patients with moderate stage CKD and 10+ egfr readings CKD definition: 2 egfr readings < 60mL/min, separated by 90+ days Preprocessing: mean in monthly bins egfr only valid estimate of kidney function at steady state 22.9 readings on average (std. dev. 13.6, median 19.0) Alignment: set t=0 to be first egfr reading < 60mL/min Adverse events: AMI, CVA identified using ICD9 codes. Max 1 event / month 13.4% had 1+ AMI code (mean w/ 1+: 4.1, std dev: 7.1, median: 2.0) 17.4% had 1+ AMI code (mean w/ 1+: 6.4, std dev: 13.3, median: 3.0) Baseline covariates: baseline age, race, gender; hypertension, diabetes 31
61 Experimental Setup Use first 60% of egfr trajectory/events to predict last 40% Evaluation metrics: MSE and MAE for held-out egfr values AUROC, AUPR for predicting any event in [T,T+c] as binary classification Longitudinal baseline: [Schulam & Saria, 2015] Point process baselines: Cox regression; rate: r i (t) =r 0 (t) exp{ > x ir } Time-varying Cox using observed egfr; rate: r i (t) =r 0 (t) exp{ > x ir + y i (t)} 32
62 Quantitative Results Longitudinal Submodels MSE MAE [Schulam & Saria, 2015] Joint Model (CVA) Joint Model (AMI) CVA: AUROCs 1 yr. 2 yr. 3 yr. 4 yr. 5 yr. Joint Model Cox Time-varying Cox AMI: AUROCs Joint Model Cox Time-varying Cox CVA: AUPRs Joint Model Cox Time-varying Cox AMI: AUPRs Joint Model Cox Time-varying Cox
63 Joint Model Results 34
64 Outline Motivation Working with EHR Data Proposed Joint Model Experiments & Results In Clinical Practice 35
65 In clinical practice Implementation underway: at Duke Connected Care, an Accountable Care Organization responsible for cost and quality of care of 45,000 Medicare patients 12,000 patients with at least moderate CKD, 1,000 end-stage kidney disease Cost of end-stage disease >$60k per year vs <$10k for average patient Goal: incorporate risk stratification and joint model predictions into dashboard application Identify, better manage care of high-risk patients 36
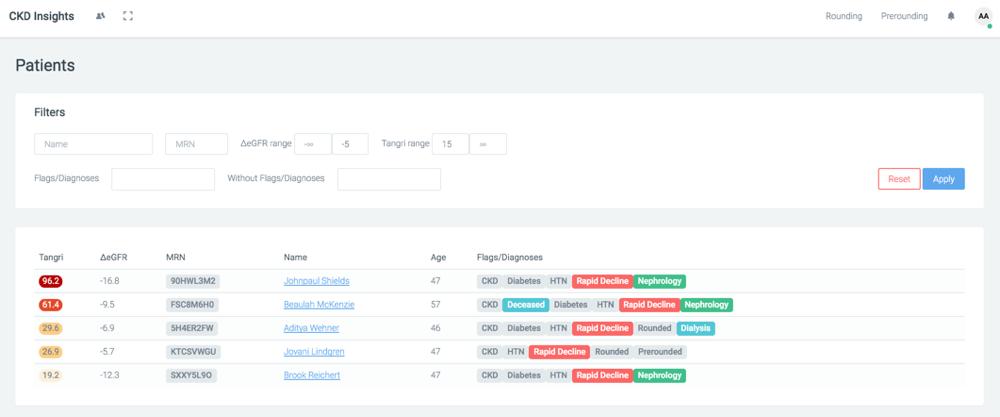

66 37
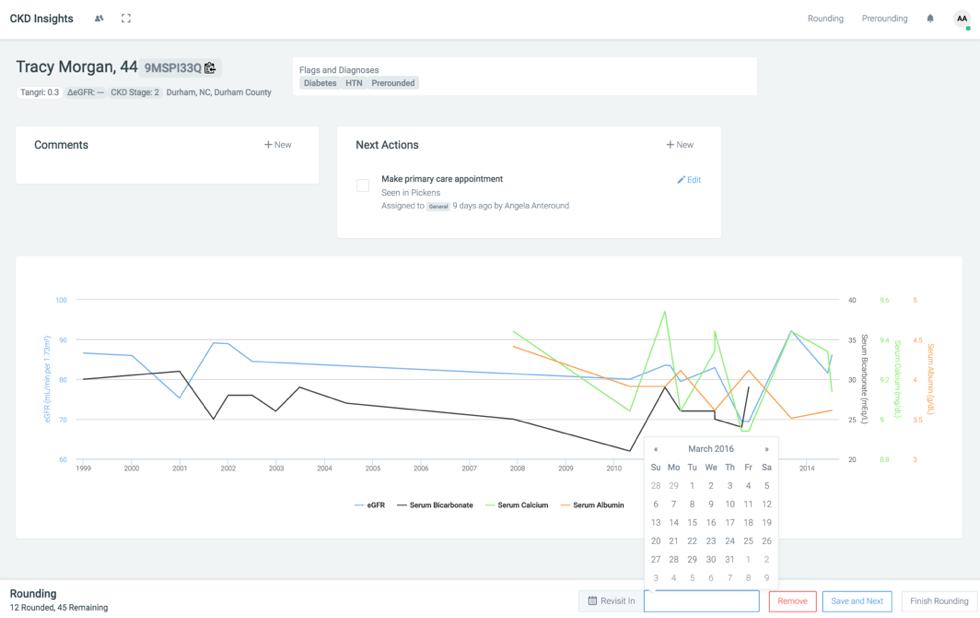

67 38
68 Conclusion Novel joint model for longitudinal, point process data First stochastic variational inference algorithm for joint models Actionable implementation in use for CKD patients! Future work: Multivariate in both longitudinal variables and events More flexible models (e.g. beyond Cox assumption) More clinically actionable metrics to evaluate models 39
69 Thank you! 40


70 Acknowledgments Contact: Joint work with: Mark Sendak, M.P.P./M.D. Candidate C. Blake Cameron, M.D. Katherine Heller, Ph.D. 41
71 References C. Lloyd, T. Gunter, M. A. Osborne, and S. J. Roberts. Variational inference for Gaussian process modulated Poisson proceses. ICML, A. Perotte, R. Ranganath, J. S. Hirsch, D. Blei, and N. Elhadad. Risk prediction for chronic kidney disease progression using heterogeneous electronic health record data and time series analysis. Journal of the American Medical Informatics Association, C. Proust-Lima, M. Sene, J. Taylor, H. Jacqmin-Gadda. Joint latent class models for longitudinal and timeto-event data: A review. Statistical Methods in Medical Research 23(1):74-90, D. Rizopoulos. Joint Models for Longitudinal and Time-to-Event Data: With Applications in R. Chapman and Hall / CRC Biostatistics Series, P. Schulam and S. Saria. A Framework for Individualizing Predictions of Disease Trajectories by Exploiting Multi-Resolution Structure. NIPS, N. Tangri, L. A. Stevens, et al. A Predictive Model for Progression of Chronic Kidney Disease to Kidney Failure. JAMA 305(15): ,
72 More Inference Details Sparse GP / pseudo-inputs: full MVN variational distribution at egfr times, true conditional p for rest 43
73 More Inference Details Sparse GP / pseudo-inputs: full MVN variational distribution at egfr times, true conditional p for rest q i (f i (~t i ),f i ( ~u i ),f i (t grid i )) = p(f i ( ~u i ),f i (t grid i ) f i (~t i ))q(f i (~t i ) µ fi, fi ) 43
[Part 2] Model Development for the Prediction of Survival Times using Longitudinal Measurements
![[Part 2] Model Development for the Prediction of Survival Times using Longitudinal Measurements](/thumbs/89/99255856.jpg "[Part 2] Model Development for the Prediction of Survival Times using Longitudinal Measurements") [Part 2] Model Development for the Prediction of Survival Times using Longitudinal Measurements Aasthaa Bansal PhD Pharmaceutical Outcomes Research & Policy Program University of Washington 69 Biomarkers
[Part 2] Model Development for the Prediction of Survival Times using Longitudinal Measurements Aasthaa Bansal PhD Pharmaceutical Outcomes Research & Policy Program University of Washington 69 Biomarkers
FACTORIZATION MACHINES AS A TOOL FOR HEALTHCARE CASE STUDY ON TYPE 2 DIABETES DETECTION
 SunLab Enlighten the World FACTORIZATION MACHINES AS A TOOL FOR HEALTHCARE CASE STUDY ON TYPE 2 DIABETES DETECTION Ioakeim (Kimis) Perros and Jimeng Sun perros@gatech.edu, jsun@cc.gatech.edu COMPUTATIONAL
Log Gaussian Cox Processes. Chi Group Meeting February 23, 2016
 Log Gaussian Cox Processes Chi Group Meeting February 23, 2016 Outline Typical motivating application Introduction to LGCP model Brief overview of inference Applications in my work just getting started
arxiv: v1 [stat.ap] 6 Apr 2018
![arxiv: v1 [stat.ap] 6 Apr 2018](/thumbs/85/92280589.jpg "arxiv: v1 [stat.ap] 6 Apr 2018") Individualized Dynamic Prediction of Survival under Time-Varying Treatment Strategies Grigorios Papageorgiou 1, 2, Mostafa M. Mokhles 2, Johanna J. M. Takkenberg 2, arxiv:1804.02334v1 [stat.ap] 6 Apr 2018
Individualized Dynamic Prediction of Survival under Time-Varying Treatment Strategies Grigorios Papageorgiou 1, 2, Mostafa M. Mokhles 2, Johanna J. M. Takkenberg 2, arxiv:1804.02334v1 [stat.ap] 6 Apr 2018
WE are motivated by the problem of predicting events
 IEEE TRANSACTIONS ON PATTERN ANALYSIS AND MACHINE INTELLIGENCE 1 Scalable Joint Models for Reliable Uncertainty-Aware Event Prediction Hossein Soleimani, James Hensman, and Suchi Saria is obtained given
Lecture: Gaussian Process Regression. STAT 6474 Instructor: Hongxiao Zhu
 Lecture: Gaussian Process Regression STAT 6474 Instructor: Hongxiao Zhu Motivation Reference: Marc Deisenroth s tutorial on Robot Learning. 2 Fast Learning for Autonomous Robots with Gaussian Processes
Measurement Error in Spatial Modeling of Environmental Exposures
 Measurement Error in Spatial Modeling of Environmental Exposures Chris Paciorek, Alexandros Gryparis, and Brent Coull August 9, 2005 Department of Biostatistics Harvard School of Public Health www.biostat.harvard.edu/~paciorek
Biost 518 Applied Biostatistics II. Purpose of Statistics. First Stage of Scientific Investigation. Further Stages of Scientific Investigation
 Biost 58 Applied Biostatistics II Scott S. Emerson, M.D., Ph.D. Professor of Biostatistics University of Washington Lecture 5: Review Purpose of Statistics Statistics is about science (Science in the broadest
ECE521 week 3: 23/26 January 2017
 ECE521 week 3: 23/26 January 2017 Outline Probabilistic interpretation of linear regression - Maximum likelihood estimation (MLE) - Maximum a posteriori (MAP) estimation Bias-variance trade-off Linear
Individualized Treatment Effects with Censored Data via Nonparametric Accelerated Failure Time Models
 Individualized Treatment Effects with Censored Data via Nonparametric Accelerated Failure Time Models Nicholas C. Henderson Thomas A. Louis Gary Rosner Ravi Varadhan Johns Hopkins University July 31, 2018
Introduction to lnmle: An R Package for Marginally Specified Logistic-Normal Models for Longitudinal Binary Data
 Introduction to lnmle: An R Package for Marginally Specified Logistic-Normal Models for Longitudinal Binary Data Bryan A. Comstock and Patrick J. Heagerty Department of Biostatistics University of Washington
Joint longitudinal and time-to-event models via Stan
 Joint longitudinal and time-to-event models via Stan Sam Brilleman 1,2, Michael J. Crowther 3, Margarita Moreno-Betancur 2,4,5, Jacqueline Buros Novik 6, Rory Wolfe 1,2 StanCon 2018 Pacific Grove, California,
Longitudinal + Reliability = Joint Modeling
 Longitudinal + Reliability = Joint Modeling Carles Serrat Institute of Statistics and Mathematics Applied to Building CYTED-HAROSA International Workshop November 21-22, 2013 Barcelona Mainly from Rizopoulos,
DEPARTMENT OF COMPUTER SCIENCE Autumn Semester MACHINE LEARNING AND ADAPTIVE INTELLIGENCE
 Data Provided: None DEPARTMENT OF COMPUTER SCIENCE Autumn Semester 203 204 MACHINE LEARNING AND ADAPTIVE INTELLIGENCE 2 hours Answer THREE of the four questions. All questions carry equal weight. Figures
BIOSTATISTICAL METHODS
 BIOSTATISTICAL METHODS FOR TRANSLATIONAL & CLINICAL RESEARCH Cross-over Designs #: DESIGNING CLINICAL RESEARCH The subtraction of measurements from the same subject will mostly cancel or minimize effects
Statistics in medicine
 Statistics in medicine Lecture 4: and multivariable regression Fatma Shebl, MD, MS, MPH, PhD Assistant Professor Chronic Disease Epidemiology Department Yale School of Public Health Fatma.shebl@yale.edu
Multivariate Survival Analysis
 Multivariate Survival Analysis Previously we have assumed that either (X i, δ i ) or (X i, δ i, Z i ), i = 1,..., n, are i.i.d.. This may not always be the case. Multivariate survival data can arise in
Fitting Multidimensional Latent Variable Models using an Efficient Laplace Approximation
 Fitting Multidimensional Latent Variable Models using an Efficient Laplace Approximation Dimitris Rizopoulos Department of Biostatistics, Erasmus University Medical Center, the Netherlands d.rizopoulos@erasmusmc.nl
Frailty Modeling for clustered survival data: a simulation study
 Frailty Modeling for clustered survival data: a simulation study IAA Oslo 2015 Souad ROMDHANE LaREMFiQ - IHEC University of Sousse (Tunisia) souad_romdhane@yahoo.fr Lotfi BELKACEM LaREMFiQ - IHEC University
Model Selection for Gaussian Processes
 Institute for Adaptive and Neural Computation School of Informatics,, UK December 26 Outline GP basics Model selection: covariance functions and parameterizations Criteria for model selection Marginal
Multi-state Models: An Overview
 Multi-state Models: An Overview Andrew Titman Lancaster University 14 April 2016 Overview Introduction to multi-state modelling Examples of applications Continuously observed processes Intermittently observed
Causal Hazard Ratio Estimation By Instrumental Variables or Principal Stratification. Todd MacKenzie, PhD
 Causal Hazard Ratio Estimation By Instrumental Variables or Principal Stratification Todd MacKenzie, PhD Collaborators A. James O Malley Tor Tosteson Therese Stukel 2 Overview 1. Instrumental variable
Part 8: GLMs and Hierarchical LMs and GLMs
 Part 8: GLMs and Hierarchical LMs and GLMs 1 Example: Song sparrow reproductive success Arcese et al., (1992) provide data on a sample from a population of 52 female song sparrows studied over the course
Deep Temporal Generative Models of. Rahul Krishnan, Uri Shalit, David Sontag
 Deep Temporal Generative Models of Rahul Krishnan, Uri Shalit, David Sontag Patient timeline Jan 1 Feb 12 May 15 Blood pressure = 130 WBC count = 6*10 9 /L Temperature = 98 F A1c = 6.6% Precancerous cells
Regularization in Cox Frailty Models
 Regularization in Cox Frailty Models Andreas Groll 1, Trevor Hastie 2, Gerhard Tutz 3 1 Ludwig-Maximilians-Universität Munich, Department of Mathematics, Theresienstraße 39, 80333 Munich, Germany 2 University
Spatio-Temporal Threshold Models for Relating UV Exposures and Skin Cancer in the Central United States
 Spatio-Temporal Threshold Models for Relating UV Exposures and Skin Cancer in the Central United States Laura A. Hatfield and Bradley P. Carlin Division of Biostatistics School of Public Health University
ICML Scalable Bayesian Inference on Point processes. with Gaussian Processes. Yves-Laurent Kom Samo & Stephen Roberts
 ICML 2015 Scalable Nonparametric Bayesian Inference on Point Processes with Gaussian Processes Machine Learning Research Group and Oxford-Man Institute University of Oxford July 8, 2015 Point Processes
Support Vector Hazard Regression (SVHR) for Predicting Survival Outcomes. Donglin Zeng, Department of Biostatistics, University of North Carolina
 for Predicting Survival Outcomes. Donglin Zeng, Department of Biostatistics, University of North Carolina") Support Vector Hazard Regression (SVHR) for Predicting Survival Outcomes Introduction Method Theoretical Results Simulation Studies Application Conclusions Introduction Introduction For survival data,
Support Vector Hazard Regression (SVHR) for Predicting Survival Outcomes Introduction Method Theoretical Results Simulation Studies Application Conclusions Introduction Introduction For survival data,
Dynamic Prediction of Disease Progression Using Longitudinal Biomarker Data
 Dynamic Prediction of Disease Progression Using Longitudinal Biomarker Data Xuelin Huang Department of Biostatistics M. D. Anderson Cancer Center The University of Texas Joint Work with Jing Ning, Sangbum
Probabilistic classification CE-717: Machine Learning Sharif University of Technology. M. Soleymani Fall 2016
 Probabilistic classification CE-717: Machine Learning Sharif University of Technology M. Soleymani Fall 2016 Topics Probabilistic approach Bayes decision theory Generative models Gaussian Bayes classifier
BIOS 312: Precision of Statistical Inference
 and Power/Sample Size and Standard Errors BIOS 312: of Statistical Inference Chris Slaughter Department of Biostatistics, Vanderbilt University School of Medicine January 3, 2013 Outline Overview and Power/Sample
Gaussian Process Regression Model in Spatial Logistic Regression
 Journal of Physics: Conference Series PAPER OPEN ACCESS Gaussian Process Regression Model in Spatial Logistic Regression To cite this article: A Sofro and A Oktaviarina 018 J. Phys.: Conf. Ser. 947 01005
A multi-state model for the prognosis of non-mild acute pancreatitis
 A multi-state model for the prognosis of non-mild acute pancreatitis Lore Zumeta Olaskoaga 1, Felix Zubia Olaskoaga 2, Guadalupe Gómez Melis 1 1 Universitat Politècnica de Catalunya 2 Intensive Care Unit,
Modelling geoadditive survival data
 Modelling geoadditive survival data Thomas Kneib & Ludwig Fahrmeir Department of Statistics, Ludwig-Maximilians-University Munich 1. Leukemia survival data 2. Structured hazard regression 3. Mixed model
Fractional Imputation in Survey Sampling: A Comparative Review
 Fractional Imputation in Survey Sampling: A Comparative Review Shu Yang Jae-Kwang Kim Iowa State University Joint Statistical Meetings, August 2015 Outline Introduction Fractional imputation Features Numerical
Bayesian Inference on Joint Mixture Models for Survival-Longitudinal Data with Multiple Features. Yangxin Huang
 Bayesian Inference on Joint Mixture Models for Survival-Longitudinal Data with Multiple Features Yangxin Huang Department of Epidemiology and Biostatistics, COPH, USF, Tampa, FL yhuang@health.usf.edu January
REGRESSION ANALYSIS FOR TIME-TO-EVENT DATA THE PROPORTIONAL HAZARDS (COX) MODEL ST520
 MODEL ST520") REGRESSION ANALYSIS FOR TIME-TO-EVENT DATA THE PROPORTIONAL HAZARDS (COX) MODEL ST520 Department of Statistics North Carolina State University Presented by: Butch Tsiatis, Department of Statistics, NCSU
REGRESSION ANALYSIS FOR TIME-TO-EVENT DATA THE PROPORTIONAL HAZARDS (COX) MODEL ST520 Department of Statistics North Carolina State University Presented by: Butch Tsiatis, Department of Statistics, NCSU
CTDL-Positive Stable Frailty Model
 CTDL-Positive Stable Frailty Model M. Blagojevic 1, G. MacKenzie 2 1 Department of Mathematics, Keele University, Staffordshire ST5 5BG,UK and 2 Centre of Biostatistics, University of Limerick, Ireland
Compare Predicted Counts between Groups of Zero Truncated Poisson Regression Model based on Recycled Predictions Method
 Compare Predicted Counts between Groups of Zero Truncated Poisson Regression Model based on Recycled Predictions Method Yan Wang 1, Michael Ong 2, Honghu Liu 1,2,3 1 Department of Biostatistics, UCLA School
Bayesian Nonparametric Accelerated Failure Time Models for Analyzing Heterogeneous Treatment Effects
 Bayesian Nonparametric Accelerated Failure Time Models for Analyzing Heterogeneous Treatment Effects Nicholas C. Henderson Thomas A. Louis Gary Rosner Ravi Varadhan Johns Hopkins University September 28,
CSci 8980: Advanced Topics in Graphical Models Gaussian Processes
 CSci 8980: Advanced Topics in Graphical Models Gaussian Processes Instructor: Arindam Banerjee November 15, 2007 Gaussian Processes Outline Gaussian Processes Outline Parametric Bayesian Regression Gaussian
PART I INTRODUCTION The meaning of probability Basic definitions for frequentist statistics and Bayesian inference Bayesian inference Combinatorics
 Table of Preface page xi PART I INTRODUCTION 1 1 The meaning of probability 3 1.1 Classical definition of probability 3 1.2 Statistical definition of probability 9 1.3 Bayesian understanding of probability
Department of Statistical Science FIRST YEAR EXAM - SPRING 2017
 Department of Statistical Science Duke University FIRST YEAR EXAM - SPRING 017 Monday May 8th 017, 9:00 AM 1:00 PM NOTES: PLEASE READ CAREFULLY BEFORE BEGINNING EXAM! 1. Do not write solutions on the exam;
Measures of Association and Variance Estimation
 Measures of Association and Variance Estimation Dipankar Bandyopadhyay, Ph.D. Department of Biostatistics, Virginia Commonwealth University D. Bandyopadhyay (VCU) BIOS 625: Categorical Data & GLM 1 / 35
General Regression Model
 Scott S. Emerson, M.D., Ph.D. Department of Biostatistics, University of Washington, Seattle, WA 98195, USA January 5, 2015 Abstract Regression analysis can be viewed as an extension of two sample statistical
Nonparametric Bayesian Methods (Gaussian Processes)
") [70240413 Statistical Machine Learning, Spring, 2015] Nonparametric Bayesian Methods (Gaussian Processes) Jun Zhu dcszj@mail.tsinghua.edu.cn http://bigml.cs.tsinghua.edu.cn/~jun State Key Lab of Intelligent
[70240413 Statistical Machine Learning, Spring, 2015] Nonparametric Bayesian Methods (Gaussian Processes) Jun Zhu dcszj@mail.tsinghua.edu.cn http://bigml.cs.tsinghua.edu.cn/~jun State Key Lab of Intelligent
Section IX. Introduction to Logistic Regression for binary outcomes. Poisson regression
 Section IX Introduction to Logistic Regression for binary outcomes Poisson regression 0 Sec 9 - Logistic regression In linear regression, we studied models where Y is a continuous variable. What about
Computer Vision Group Prof. Daniel Cremers. 9. Gaussian Processes - Regression
 Group Prof. Daniel Cremers 9. Gaussian Processes - Regression Repetition: Regularized Regression Before, we solved for w using the pseudoinverse. But: we can kernelize this problem as well! First step:
Part 6: Multivariate Normal and Linear Models
 Part 6: Multivariate Normal and Linear Models 1 Multiple measurements Up until now all of our statistical models have been univariate models models for a single measurement on each member of a sample of
David Hughes. Flexible Discriminant Analysis Using. Multivariate Mixed Models. D. Hughes. Motivation MGLMM. Discriminant. Analysis.
 Using Using David Hughes 2015 Outline Using 1. 2. Multivariate Generalized Linear Mixed () 3. Longitudinal 4. 5. Using Complex data. Using Complex data. Longitudinal Using Complex data. Longitudinal Multivariate
Analysing geoadditive regression data: a mixed model approach
 Analysing geoadditive regression data: a mixed model approach Institut für Statistik, Ludwig-Maximilians-Universität München Joint work with Ludwig Fahrmeir & Stefan Lang 25.11.2005 Spatio-temporal regression
Gaussian processes for inference in stochastic differential equations
 Gaussian processes for inference in stochastic differential equations Manfred Opper, AI group, TU Berlin November 6, 2017 Manfred Opper, AI group, TU Berlin (TU Berlin) inference in SDE November 6, 2017
Joint Modeling of Longitudinal Item Response Data and Survival
 Joint Modeling of Longitudinal Item Response Data and Survival Jean-Paul Fox University of Twente Department of Research Methodology, Measurement and Data Analysis Faculty of Behavioural Sciences Enschede,
Reliability Monitoring Using Log Gaussian Process Regression
 COPYRIGHT 013, M. Modarres Reliability Monitoring Using Log Gaussian Process Regression Martin Wayne Mohammad Modarres PSA 013 Center for Risk and Reliability University of Maryland Department of Mechanical
Probabilistic numerics for deep learning
 Presenter: Shijia Wang Department of Engineering Science, University of Oxford rning (RLSS) Summer School, Montreal 2017 Outline 1 Introduction Probabilistic Numerics 2 Components Probabilistic modeling
GAUSSIAN PROCESS REGRESSION
 GAUSSIAN PROCESS REGRESSION CSE 515T Spring 2015 1. BACKGROUND The kernel trick again... The Kernel Trick Consider again the linear regression model: y(x) = φ(x) w + ε, with prior p(w) = N (w; 0, Σ). The
Building a Prognostic Biomarker
 Building a Prognostic Biomarker Noah Simon and Richard Simon July 2016 1 / 44 Prognostic Biomarker for a Continuous Measure On each of n patients measure y i - single continuous outcome (eg. blood pressure,
Robust Bayesian Variable Selection for Modeling Mean Medical Costs
 Robust Bayesian Variable Selection for Modeling Mean Medical Costs Grace Yoon 1,, Wenxin Jiang 2, Lei Liu 3 and Ya-Chen T. Shih 4 1 Department of Statistics, Texas A&M University 2 Department of Statistics,
Lecture 13 : Variational Inference: Mean Field Approximation
 10-708: Probabilistic Graphical Models 10-708, Spring 2017 Lecture 13 : Variational Inference: Mean Field Approximation Lecturer: Willie Neiswanger Scribes: Xupeng Tong, Minxing Liu 1 Problem Setup 1.1
ECLT 5810 Linear Regression and Logistic Regression for Classification. Prof. Wai Lam
 ECLT 5810 Linear Regression and Logistic Regression for Classification Prof. Wai Lam Linear Regression Models Least Squares Input vectors is an attribute / feature / predictor (independent variable) The
Evaluating the Implementation of a Kidney Supportive Care program Queensland Experience
 Evaluating the Implementation of a Kidney Supportive Care program Queensland Experience Prof Ann Bonner PhD, RN School of Nursing, Kidney Health Service, Metro North Hospital and Health Service NHMRC Chronic
Introduction to mtm: An R Package for Marginalized Transition Models
 Introduction to mtm: An R Package for Marginalized Transition Models Bryan A. Comstock and Patrick J. Heagerty Department of Biostatistics University of Washington 1 Introduction Marginalized transition
Probabilistic Models for Learning Data Representations. Andreas Damianou
 Probabilistic Models for Learning Data Representations Andreas Damianou Department of Computer Science, University of Sheffield, UK IBM Research, Nairobi, Kenya, 23/06/2015 Sheffield SITraN Outline Part
PQL Estimation Biases in Generalized Linear Mixed Models
 PQL Estimation Biases in Generalized Linear Mixed Models Woncheol Jang Johan Lim March 18, 2006 Abstract The penalized quasi-likelihood (PQL) approach is the most common estimation procedure for the generalized
Computer Vision Group Prof. Daniel Cremers. 4. Gaussian Processes - Regression
 Group Prof. Daniel Cremers 4. Gaussian Processes - Regression Definition (Rep.) Definition: A Gaussian process is a collection of random variables, any finite number of which have a joint Gaussian distribution.
Faster Stochastic Variational Inference using Proximal-Gradient Methods with General Divergence Functions
 Faster Stochastic Variational Inference using Proximal-Gradient Methods with General Divergence Functions Mohammad Emtiyaz Khan, Reza Babanezhad, Wu Lin, Mark Schmidt, Masashi Sugiyama Conference on Uncertainty
Hybrid Dirichlet processes for functional data
 Hybrid Dirichlet processes for functional data Sonia Petrone Università Bocconi, Milano Joint work with Michele Guindani - U.T. MD Anderson Cancer Center, Houston and Alan Gelfand - Duke University, USA
A.I. in health informatics lecture 2 clinical reasoning & probabilistic inference, I. kevin small & byron wallace
 A.I. in health informatics lecture 2 clinical reasoning & probabilistic inference, I kevin small & byron wallace today a review of probability random variables, maximum likelihood, etc. crucial for clinical
Lecture 4 Multiple linear regression
 Lecture 4 Multiple linear regression BIOST 515 January 15, 2004 Outline 1 Motivation for the multiple regression model Multiple regression in matrix notation Least squares estimation of model parameters
Instrumental variables estimation in the Cox Proportional Hazard regression model
 Instrumental variables estimation in the Cox Proportional Hazard regression model James O Malley, Ph.D. Department of Biomedical Data Science The Dartmouth Institute for Health Policy and Clinical Practice
Classification. Chapter Introduction. 6.2 The Bayes classifier
 Chapter 6 Classification 6.1 Introduction Often encountered in applications is the situation where the response variable Y takes values in a finite set of labels. For example, the response Y could encode
Dependence structures with applications to actuarial science
 with applications to actuarial science Department of Statistics, ITAM, Mexico Recent Advances in Actuarial Mathematics, OAX, MEX October 26, 2015 Contents Order-1 process Application in survival analysis
On Measurement Error Problems with Predictors Derived from Stationary Stochastic Processes and Application to Cocaine Dependence Treatment Data
 On Measurement Error Problems with Predictors Derived from Stationary Stochastic Processes and Application to Cocaine Dependence Treatment Data Yehua Li Department of Statistics University of Georgia Yongtao
BAYESIAN MODEL FOR SPATIAL DEPENDANCE AND PREDICTION OF TUBERCULOSIS
 BAYESIAN MODEL FOR SPATIAL DEPENDANCE AND PREDICTION OF TUBERCULOSIS Srinivasan R and Venkatesan P Dept. of Statistics, National Institute for Research Tuberculosis, (Indian Council of Medical Research),
Default Priors and Effcient Posterior Computation in Bayesian
 Default Priors and Effcient Posterior Computation in Bayesian Factor Analysis January 16, 2010 Presented by Eric Wang, Duke University Background and Motivation A Brief Review of Parameter Expansion Literature
Semi-Nonparametric Inferences for Massive Data
 Semi-Nonparametric Inferences for Massive Data Guang Cheng 1 Department of Statistics Purdue University Statistics Seminar at NCSU October, 2015 1 Acknowledge NSF, Simons Foundation and ONR. A Joint Work
Beyond GLM and likelihood
 Stat 6620: Applied Linear Models Department of Statistics Western Michigan University Statistics curriculum Core knowledge (modeling and estimation) Math stat 1 (probability, distributions, convergence
STAT 5500/6500 Conditional Logistic Regression for Matched Pairs
 STAT 5500/6500 Conditional Logistic Regression for Matched Pairs Motivating Example: The data we will be using comes from a subset of data taken from the Los Angeles Study of the Endometrial Cancer Data
Bayesian SAE using Complex Survey Data Lecture 4A: Hierarchical Spatial Bayes Modeling
 Bayesian SAE using Complex Survey Data Lecture 4A: Hierarchical Spatial Bayes Modeling Jon Wakefield Departments of Statistics and Biostatistics University of Washington 1 / 37 Lecture Content Motivation
Nonparameteric Regression:
 Nonparameteric Regression: Nadaraya-Watson Kernel Regression & Gaussian Process Regression Seungjin Choi Department of Computer Science and Engineering Pohang University of Science and Technology 77 Cheongam-ro,
A Fully Nonparametric Modeling Approach to. BNP Binary Regression
 A Fully Nonparametric Modeling Approach to Binary Regression Maria Department of Applied Mathematics and Statistics University of California, Santa Cruz SBIES, April 27-28, 2012 Outline 1 2 3 Simulation
Comparison of multiple imputation methods for systematically and sporadically missing multilevel data
 Comparison of multiple imputation methods for systematically and sporadically missing multilevel data V. Audigier, I. White, S. Jolani, T. Debray, M. Quartagno, J. Carpenter, S. van Buuren, M. Resche-Rigon
Semiparametric Bayesian commensurate survival model for post-market. medical device surveillance with non-exchangeable historical data
 Biometrics 99, 1 18 March 2013 DOI: xx.xxxx/x.xxxx-xxxx.xxxx.xxxxx.x Semiparametric Bayesian commensurate survival model for post-market medical device surveillance with non-exchangeable historical data
Missing Data Issues in the Studies of Neurodegenerative Disorders: the Methodology
 Missing Data Issues in the Studies of Neurodegenerative Disorders: the Methodology Sheng Luo, PhD Associate Professor Department of Biostatistics & Bioinformatics Duke University Medical Center sheng.luo@duke.edu
Longitudinal breast density as a marker of breast cancer risk
 Longitudinal breast density as a marker of breast cancer risk C. Armero (1), M. Rué (2), A. Forte (1), C. Forné (2), H. Perpiñán (1), M. Baré (3), and G. Gómez (4) (1) BIOstatnet and Universitat de València,
Estimating Optimal Dynamic Treatment Regimes from Clustered Data
 Estimating Optimal Dynamic Treatment Regimes from Clustered Data Bibhas Chakraborty Department of Biostatistics, Columbia University bc2425@columbia.edu Society for Clinical Trials Annual Meetings Boston,
BIAS OF MAXIMUM-LIKELIHOOD ESTIMATES IN LOGISTIC AND COX REGRESSION MODELS: A COMPARATIVE SIMULATION STUDY
 BIAS OF MAXIMUM-LIKELIHOOD ESTIMATES IN LOGISTIC AND COX REGRESSION MODELS: A COMPARATIVE SIMULATION STUDY Ingo Langner 1, Ralf Bender 2, Rebecca Lenz-Tönjes 1, Helmut Küchenhoff 2, Maria Blettner 2 1
An R # Statistic for Fixed Effects in the Linear Mixed Model and Extension to the GLMM
 An R Statistic for Fixed Effects in the Linear Mixed Model and Extension to the GLMM Lloyd J. Edwards, Ph.D. UNC-CH Department of Biostatistics email: Lloyd_Edwards@unc.edu Presented to the Department
Analysis of Longitudinal Data. Patrick J. Heagerty PhD Department of Biostatistics University of Washington
 Analysis of Longitudinal Data Patrick J Heagerty PhD Department of Biostatistics University of Washington Auckland 8 Session One Outline Examples of longitudinal data Scientific motivation Opportunities
A Regression Model For Recurrent Events With Distribution Free Correlation Structure
 A Regression Model For Recurrent Events With Distribution Free Correlation Structure J. Pénichoux(1), A. Latouche(2), T. Moreau(1) (1) INSERM U780 (2) Université de Versailles, EA2506 ISCB - 2009 - Prague
Bayesian Hierarchical Models
 Bayesian Hierarchical Models Gavin Shaddick, Millie Green, Matthew Thomas University of Bath 6 th - 9 th December 2016 1/ 34 APPLICATIONS OF BAYESIAN HIERARCHICAL MODELS 2/ 34 OUTLINE Spatial epidemiology
Discrete Multivariate Statistics
 Discrete Multivariate Statistics Univariate Discrete Random variables Let X be a discrete random variable which, in this module, will be assumed to take a finite number of t different values which are
Generalized logit models for nominal multinomial responses. Local odds ratios
 Generalized logit models for nominal multinomial responses Categorical Data Analysis, Summer 2015 1/17 Local odds ratios Y 1 2 3 4 1 π 11 π 12 π 13 π 14 π 1+ X 2 π 21 π 22 π 23 π 24 π 2+ 3 π 31 π 32 π
Non-Gaussian likelihoods for Gaussian Processes
 Non-Gaussian likelihoods for Gaussian Processes Alan Saul University of Sheffield Outline Motivation Laplace approximation KL method Expectation Propagation Comparing approximations GP regression Model
ASSESSING PROGNOSIS FOR CHRONIC KIDNEY DISEASE USING NEURAL NETWORKS. by Michael R. Zeleny B.S. Biology, Juniata College, 2012
 ASSESSING PROGNOSIS FOR CHRONIC KIDNEY DISEASE USING NEURAL NETWORKS by Michael R. Zeleny B.S. Biology, Juniata College, 2012 Submitted to the Graduate Faculty of the Graduate School of Public Health in
Frailty Modeling for Spatially Correlated Survival Data, with Application to Infant Mortality in Minnesota By: Sudipto Banerjee, Mela. P.
 Frailty Modeling for Spatially Correlated Survival Data, with Application to Infant Mortality in Minnesota By: Sudipto Banerjee, Melanie M. Wall, Bradley P. Carlin November 24, 2014 Outlines of the talk
Bayesian dynamic modeling for large space-time weather datasets using Gaussian predictive processes
 Bayesian dynamic modeling for large space-time weather datasets using Gaussian predictive processes Sudipto Banerjee 1 and Andrew O. Finley 2 1 Biostatistics, School of Public Health, University of Minnesota,
Approximate Bayesian inference
 Approximate Bayesian inference Variational and Monte Carlo methods Christian A. Naesseth 1 Exchange rate data 0 20 40 60 80 100 120 Month Image data 2 1 Bayesian inference 2 Variational inference 3 Stochastic
COMS 4721: Machine Learning for Data Science Lecture 10, 2/21/2017
 COMS 4721: Machine Learning for Data Science Lecture 10, 2/21/2017 Prof. John Paisley Department of Electrical Engineering & Data Science Institute Columbia University FEATURE EXPANSIONS FEATURE EXPANSIONS
BIOL 51A - Biostatistics 1 1. Lecture 1: Intro to Biostatistics. Smoking: hazardous? FEV (l) Smoke
 Smoke") BIOL 51A - Biostatistics 1 1 Lecture 1: Intro to Biostatistics Smoking: hazardous? FEV (l) 1 2 3 4 5 No Yes Smoke BIOL 51A - Biostatistics 1 2 Box Plot a.k.a box-and-whisker diagram or candlestick chart
BIOL 51A - Biostatistics 1 1 Lecture 1: Intro to Biostatistics Smoking: hazardous? FEV (l) 1 2 3 4 5 No Yes Smoke BIOL 51A - Biostatistics 1 2 Box Plot a.k.a box-and-whisker diagram or candlestick chart