Sound velocities in highly-oriented pyrolytic graphite shocked to 18. GPa: orientational order dependence and elastic instability
|
|
|
- Baldwin Bishop
- 5 years ago
- Views:
Transcription
1 Sound velocities in highly-oriented pyrolytic graphite shocked to 18 GPa: orientational order dependence and elastic instability Marcel Lucas, J. M. Winey, and Y. M. Gupta Institute for Shock Physics and Department of Physics, Washington State University, Pullman, Washington 99164, USA ABSTRACT Previous reports of rapid phase transformation above 18 GPa [Erskine and Nellis, Nature 349, 317 (1991)] and large elastic waves below 18 GPa [Lucas et al., J. Appl. Phys. 114, (2013)] for shock-compressed ZYB-grade highly-oriented pyrolytic graphite (HOPG), but not for less oriented ZYH-grade HOPG, indicated a link between the orientational order dependence of the HOPG response above and below the phase transformation stress. To gain insight into this link and into the mechanical response of HOPG shocked to peak stresses approaching the phase transformation onset, the compressibility of ZYB- and ZYH-grade HOPG in the shocked state was examined using front surface impact experiments. Particle velocity histories and sound velocities were measured for peak stresses reaching 18 GPa. Although the locus of the measured peak stress-particle velocity states is indistinguishable for the two grades of HOPG, the measured sound velocities in the peak state reveal significant differences between the two grades. Specifically, 1) The measured sound velocities are somewhat higher for ZYH-grade HOPG, compared to ZYB-grade HOPG. 2) The measured sound velocities for ZYH-grade HOPG increase smoothly with compression, whereas those for ZYB- 1
2 grade HOPG exhibit a significant reduction in the compression dependence from 12 GPa to 17 GPa and an abrupt increase from 17 GPa to 18 GPa. 3) The longitudinal moduli, determined from the measured sound velocities, are smaller than the calculated bulk moduli for ZYB-grade HOPG shocked to peak stresses above 15 GPa, indicating the onset of an elastic instability. The present findings demonstrate that the softening of the longitudinal modulus (or elastic instability) presented here is linked to the large elastic waves and the rapid phase transformation reported previously all observed only for shocked ZYB-grade HOPG. The elastic instability in shocked ZYB-grade HOPG is likely a precursor to the rapid phase transformation observed above 18 GPa for this HOPG grade. 2
3 I. INTRODUCTION In the early 1990s, Erskine and Nellis reported time-resolved particle velocity measurements on highly oriented pyrolytic graphite (HOPG) samples shockcompressed to GPa peak stresses. 1,2 Their measurements revealed significant differences in the shock wave response of two HOPG grades that differed in their orientational order. Wave profiles for the more highly oriented ZYB-grade HOPG exhibited clean two-wave structures, indicating a rapid phase transformation with reported onset stresses as low as 18.6 GPa. In contrast, the lone wave profile reported for the less oriented ZYH-grade HOPG exhibited only a single wave and significant particle velocity fluctuations in the peak state. These results showed that the response of HOPG shocked to stresses above 18 GPa, including the onset of a rapid phase transformation, depends strongly on the HOPG orientational order. However, this strong orientational order dependence was not well understood, in part, due to the lack of corresponding time-resolved measurements on HOPG shocked below 18 GPa. Subsequently, time-resolved particle velocity measurements for ZYB- and ZYHgrade HOPG shock-compressed to stresses below 18 GPa revealed significant differences in their mechanical response. 3 Measured wave profiles for shocked ZYBgrade HOPG revealed two-wave structures (elastic-inelastic response) having large elastic wave amplitudes; the elastic wave amplitudes increased with increasing peak stress, reaching 16 GPa for a peak stress of 18 GPa. In contrast, wave profiles for shocked ZYH-grade HOPG exhibited single overdriven waves, indicating a negligible elastic wave amplitude. These results showed that the elastic-inelastic response of 3
4 HOPG shocked below 18 GPa also depends strongly on the HOPG orientational order. Because ZYB-grade HOPG was the only pyrolytic graphite that displayed large elastic compression below 18 GPa and a rapid phase transformation above 18 GPa, these results demonstrated a link between the orientational order dependence of the HOPG shock response for peak stresses below and above 18 GPa. Based on this link, the following physical picture was suggested for the rapid phase transformation onset in shocked ZYB-grade HOPG: 3 due to the large elastic compression, the strain energy accumulated in shocked ZYB-grade HOPG leads to an elastic instability that initiates the rapid (displacive) phase transformation. Despite the strong orientation dependence observed in the previous wave profile measurements for ZYB- and ZYH-grade HOPG shocked below 18 GPa, the locus of peak stress-density compression states determined for the two HOPG grades was indistinguishable within experimental precision. 3 This finding, together with the physical picture proposed previously 3 for the rapid phase transformation onset in shocked ZYBgrade HOPG, raises the following questions: (1) Does the orientational order have a discernable effect on the peak state of shocked HOPG? (2) If so, is there a link between the orientational order dependence of the peak state of HOPG shocked below 18 GPa and the rapid phase transformation in ZYB-grade HOPG shocked above 18 GPa? (3) Does the peak state of ZYB-grade HOPG shocked to stresses approaching 18 GPa show evidence of an elastic instability? In a recent study on shocked aluminum single crystals, 4 peak stress-density states and sound velocities in the peak states were measured in crystals shocked along different orientations. The results showed that the sound velocity measurements, a 4
5 measure of the longitudinal compressibility in the shocked state, provided better insight into the mechanical state of the shocked Al single crystals than the stress-density results. Therefore, to address the above stated questions regarding the response of HOPG shocked to stresses below 18 GPa, we examined the peak state compressibility of both HOPG grades using front surface impact experiments. Particle velocity histories were measured at the sample impact surface to determine the stress-particle velocity states, the sound velocities, and the longitudinal elastic moduli in the peak state for both HOPG grades shocked to stresses ranging from 9-18 GPa. The remainder of the paper is organized as follows: The experimental methods are summarized in Sec. II and the measured wave profiles are presented in Sec. III. In Sec. IV, an analysis of the measured data is presented, together with calculated results from numerical simulations and a discussion of the results. A summary of the main findings and the overall conclusions of this study are presented in Sec. V. II. EXPERIMENTAL METHODS A. Sample characterization The ZYH- and ZYB-grade HOPG samples (Momentive, Columbus, OH) used in this study were the same two HOPG grades that were examined in previous shock wave transmission experiments. 1-3 Because details regarding the HOPG samples were published previously, 3 only a brief summary is presented here. Although the HOPG samples were not single crystals, the average normal to the sample surface was along the c-axis (normal to the basal planes). The manufacturer s specification for the mosaic 5
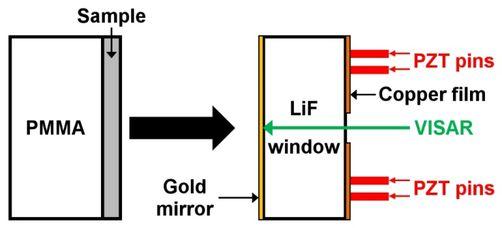
6 spread, which characterizes the orientational order of pyrolytic graphite, was 3.5 ±1.5 for the less ordered ZYH-grade HOPG, and 0.8 ±0.2 for the more ordered ZYB-grade HOPG. The initial density of each sample used in the shock experiments was measured using the Archimedean method and the results are listed in Table 1. The average initial sample density for both HOPG grades was 2.26 ± 0.01 g/cc, which is comparable to the single crystal density. As discussed previously, 3 attempts to determine ambient longitudinal and shear sound velocities for these two grades of HOPG did not produce reliable results due to the considerable attenuation and distortion of the measured acoustic waves. B. Front surface impact experiments Plate impact experiments were performed using the front surface impact configuration shown schematically in Fig. 1. Using a powder gun, an impactor consisting of an HOPG sample, backed by a thick polymethyl methacrylate (PMMA) plate, was launched against a [100] lithium fluoride (LiF) window. Upon impact, shock waves propagated in the HOPG sample and the LiF window. The HOPG sample was oriented such that the shock wave compression was along the average c axis. Both sides of the HOPG sample were freshly cleaved prior to the impactor assembly. Experimental parameters for each experiment are listed in Table I. For the range of peak stresses examined here, shock waves propagated as single overdriven waves in the ZYH-grade HOPG, 3 reaching State A in Fig. 2; and as distinct elastic and inelastic waves (two-wave profile) in the ZYB-grade HOPG, 3 reaching States A and B in Fig. 3. When the shock wave (elastic wave for the ZYB- 6
7 grade HOPG) reaches the back of the HOPG sample, it reflects from the PMMA-HOPG interface as a release wave and unloads the peak stress in the HOPG. Because the leading edge of a release wave travels at the longitudinal sound speed in the shocked material, 4,5 its arrival at the impact surface enables a determination of the sound velocity in the shocked HOPG. Further details are provided in Sec. IV. To determine the peak state in the HOPG sample and the release wave arrival time at the impact surface, the particle velocity history at the center of the LiF window was measured using a velocity interferometer system (VISAR) 6 operating at a laser wavelength of 532 nm (Fig. 1). A gold film was vapor-deposited on the impact surface of the LiF window to reflect the laser light. To minimize the loss of reflected light upon impact, the impact surface of the LiF window was roughened (by lapping) prior to the deposition of the gold film. 7 In all the experiments, particle velocity histories were measured using a dual velocity-per-fringe configuration to minimize uncertainties in the peak particle velocity. The measured apparent velocities were corrected for the presence of the LiF window using the procedure reported by Wise and Chhabildas. 8 Four piezoelectric (PZT) pins (Dynasen Inc., Goleta, CA) were mounted concentrically on the back of the LiF window, as shown in Fig. 1, to determine the impact (and shock wave) tilt. This information is used to accurately determine the wave velocities. 3 III. RESULTS A total of 15 front surface impact experiments were conducted on ZYH- and ZYBgrade HOPG samples. The impact velocities for these experiments were chosen so that the peak stresses in the HOPG samples corresponded to those reached in the previous 7
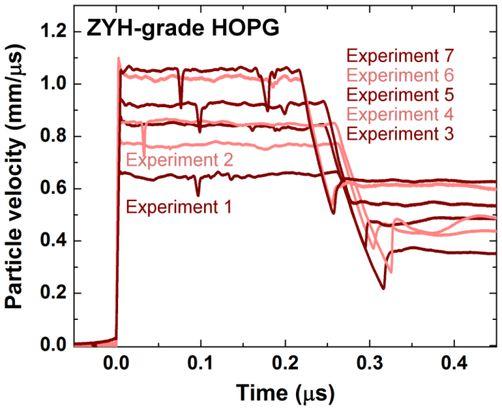
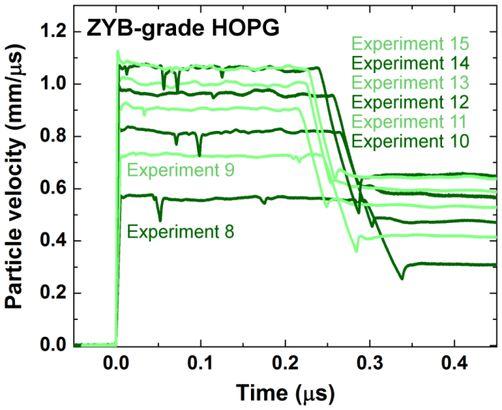
8 wave transmission experiments (9-18 GPa). 3 Thus, the peak stresses were less than the lowest phase transformation stress reported for shocked HOPG (18.6 GPa). 2 Particle velocity profiles for each experiment, measured at the HOPG sample-lif window interface (impact surface), are shown in Figs. 4 and 5. Figure 4 shows the measured profiles for shocked ZYH-grade HOPG (experiments 1-7). All the profiles exhibit an initial jump upon impact, followed by a constant (peak) state, and, subsequently, a featureless decrease from the peak particle velocity, marking the arrival of the release wave from the back of the impactor (see Fig. 2). Comparison of the results from experiments 3 and 4, which had similar impact velocities, demonstrates good experimental reproducibility. The measured peak particle velocities for the profiles in Fig. 4 are shown in Table II. Figure 5 shows the measured wave profiles for shocked ZYB-grade HOPG (experiments 8-15). Similar to the results for ZYH-grade HOPG (Fig. 4), all the profiles in Fig. 5 exhibit an initial jump in particle velocity at impact, followed by a constant (peak) state, and, subsequently, the arrival of a featureless release wave (see Fig. 3). Good experimental reproducibility for shocked ZYB-grade HOPG is demonstrated by comparing the results from experiments 14 and 15, which had similar impact velocities. The measured peak particle velocities for the profiles in Fig. 5 are shown in Table II. In Figs. 4 and 5, many of the measured wave profiles exhibit sharp dips that occur in the peak state and/or at the trailing edge of the unloading wave. Although the cause of the dips is not known with certainty, those appearing in the peak state are likely due to the interaction of the shock wave with small delaminations in the interior of the HOPG samples. Similarly, the dips at the trailing edge of the unloading wave likely 8
9 result from debonding, prior to impact, of the HOPG sample from the PMMA backing plate. In our analysis of the measured wave profiles, presented next, no correlation was found between the presence (or absence) of the dips and the detailed features of the analyzed results. Therefore, the dips are ignored in all subsequent discussion. IV. ANALYSIS AND DISCUSSION The experimentally measured wave profiles in Figs. 4 and 5 were analyzed to provide the peak or shocked states, the sound velocities, and the longitudinal moduli in the shocked states. A. Peak states Because of the continuity of longitudinal stresses and particle velocities across the HOPG-LiF interface (impact surface), particle velocity histories at the impact surface and published LiF Hugoniot data 9 provide a direct determination of the peak stresses attained in the shocked HOPG samples. The Hugoniot relationship used here for LiF is U u, 9 where U s and u p are the shock velocity and particle velocity, s p respectively. From the measured peak stress, the density compression in the peak state was determined using the peak stress-compression curve for shocked HOPG obtained previously from wave transmission experiments. 3 The peak longitudinal stresses and peak density compressions determined here for shocked HOPG are shown in Table II. In Fig. 6, the measured peak stress-particle velocity states for shocked ZYH- and ZYB-grade HOPG (solid symbols) from the present work are shown, together with the peak states determined from the previous wave transmission experiments (open 9
10 symbols). 3 Within experimental precision (1-2%), the locus of measured peak states for shocked ZYH-grade HOPG is the same as that for shocked ZYB-grade HOPG. In addition, the peak states for shocked ZYH- and ZYB-grade HOPG measured in the front surface impact experiments are well matched to the peak states obtained in the previous wave transmission experiments. 3 This good agreement demonstrates the consistency between the two sets of experiments. B. Sound velocities For both grades of HOPG, the Lagrangian sound velocity in shocked HOPG in the peak state was determined from the measured arrival time of the release wave at the sample-window interface. For ZYH-grade HOPG (experiments 1-7), a single overdriven shock wave propagates in the HOPG samples. 3 Therefore, the Lagrangian sound velocity c L in the peak state was determined using the following expression for the measured arrival time t 2 of the release wave (see Fig. 2): t 2 hs hs U c, (1) s L where h s is the initial sample thickness (taking into account corrections for the effect of impact tilt), and U s is the velocity of the overdriven wave, determined from the measured peak particle velocity and peak stress using the Rankine-Hugoniot jump conditions. 10 The release wave arrival time t 2 was determined from the intersection of two straight lines that were fit to the measured wave profiles: one line was fit to the peak state particle velocity and the other was fit to the early portions of the unloading wave. For ZYB-grade HOPG (experiments 8-15), a two-wave structure (elastic and inelastic waves) arises in the HOPG samples. 3 Therefore, the Lagrangian sound 10
11 velocity c L in the peak state was determined using the following expression for the arrival time t 2 of the release wave, which corresponds to the wave propagation details shown in Fig. 3: t 2 sa RA L hs h1 hs h1. (2) U U c In equation (2), h s is the initial sample thickness (taking into account corrections for the effect of impact tilt), and h 1 is the Lagrangian position in the HOPG sample where the reflected elastic release wave (from the HOPG/PMMA interface) interacts with the oncoming inelastic wave (see Fig. 3a). The velocity of the elastic wave (U sa ) was determined from the measured peak stress using the elastic wave amplitude (σ xa ) peak stress (σ xb ) relationship determined previously for ZYB-grade HOPG (see Fig. 8 from Ref. 3), , (3) xa xb together with the elastic Hugoniot curve for ZYB-grade HOPG 3 and the Rankine- Hugoniot jump conditions. 10 The Lagrangian elastic release wave velocity (U RA ) was determined by assuming that ZYB-grade HOPG released from the elasticallycompressed state (State A in Fig. 3) along the elastic Hugoniot curve. The position h 1 was determined by solving the equation (see Fig. 3a): sa RA sb hs h1 hs h1, (4) U U U where the Lagrangian inelastic wave velocity U sb was determined from the stress and density compression in the elastically-compressed state (A) and in the peak state (B) using the Rankine-Hugoniot jump conditions. 10 The release wave arrival time t 2 was 11
12 determined from the intersection of two straight lines that were fit to the measured wave profiles using the same approach as that used for ZYH-grade HOPG. Table II lists the Lagrangian sound velocities c L determined for ZYH- and ZYBgrade HOPG in the shocked state. The uncertainties shown in Table II were determined from the individual sources, including initial sample thickness and density, impact velocity, peak particle velocity, and arrival time of the release wave. The uncertainties from the different sources were combined using standard methods of uncertainty propagation. 11 Compression-corrected (or Eulerian) sound velocities account for changes in sample thickness due to shock wave compression and correspond to the material stiffness in the peak state. For shocked ZYH- and ZYB-grade HOPG, the Eulerian sound velocities were obtained by dividing the Lagrangian sound velocities by the density change ( / 0 ) and are listed in Table II. Figure 7 shows the Eulerian sound velocities as a function of density compression and longitudinal stress (solid symbols). These results show that the measured sound velocities for shocked ZYH-grade HOPG are somewhat larger than those for shocked ZYB-grade HOPG. More importantly, the compression dependence of the sound velocity for shocked ZYH-grade HOPG differs significantly from that for ZYB-grade HOPG. For ZYH-grade HOPG, the sound velocities increase smoothly over the GPa stress range. In contrast, for shocked ZYB-grade HOPG, the sound velocity increases rapidly between 9 GPa and 12 GPa. However, between 12 GPa and 15 GPa, the sound velocity increases slowly, reaching a constant value (within 12
13 experimental precision) between 15 GPa and 17 GPa, before increasing abruptly between 17 GPa and 18 GPa. C. Numerical simulations In our previous wave transmission experiments on shocked ZYH- and ZYB-grade HOPG, 3 the measured wave profiles were analyzed using two approaches: an idealized approach to determine the shocked states and the use of numerical simulations. For the numerical simulations, phenomenological material models were developed for shocked ZYH- and ZYB-grade HOPG that provided good agreement between the calculated and the measured wave profiles for both HOPG grades. 3 To supplement the idealized analysis presented in Sec. IV.B, and to provide an important link to our previous results, 3 we carried out numerical simulations of the present front surface impact experiments using the same phenomenological material models used previously. A brief summary of the material models and the simulation methods is provided in the Appendix. The calculated wave profiles (not shown) for shocked ZYH- and ZYB-grade HOPG provide a good overall match to the measured profiles shown in Figs. 4 and 5, including the featureless release waves. The calculated results indicate a complete loss of strength (zero stress deviators in the peak state) for both HOPG grades, in agreement with our previous calculations. 3 The calculated particle velocities, stresses, and density compressions in the peak state, presented in Table II, are in good agreement with those determined from the measured wave profiles. The good agreement between the calculated and the measured results for the front surface 13
14 impact experiments presented here, together with that for the previous wave transmission experiments, 3 demonstrates that the material models provide a reliable phenomenological description of the response of ZYH- and ZYB-grade HOPG shocked to stresses reaching 18 GPa. Calculated sound velocities for shocked ZYH- and ZYB-grade HOPG were determined from the numerical simulations by tracking the propagation of the simulated release wave through the shocked sample (see Figs. 2 and 3). Because the calculations indicate complete loss of strength in the peak state for both HOPG grades, the calculated sound velocities correspond to the mean stress (or bulk) response. The calculated Lagrangian sound velocities, together with the corresponding Eulerian sound velocities are presented in Table II. Because the same mean stress-density curve was incorporated in the material models for both HOPG grades, the calculated bulk sound velocities for the two HOPG grades were fitted well by a single curve, shown by the dashed line in Fig. 7. As shown in the figure, the calculated bulk sound velocity increases smoothly with increasing density compression (or stress). To determine sound velocities that correspond to the calculated longitudinal response, the material models for ZYH- and ZYB-grade HOPG were modified slightly so that small, but non-zero, stress deviators were obtained in the calculated peak state (see Appendix). Because the same mean stress-density curve and the same shear modulus were used in the material models for both HOPG grades, the calculated longitudinal sound velocities for the two HOPG grades were again fitted well by a single curve, shown as the solid line in Fig. 7. The calculated longitudinal sound velocity increases smoothly with increasing density compression (or stress), similar to the 14
15 calculated bulk values. The calculated longitudinal and bulk sound velocities are compared next with the measured results. D. Discussion The direct measurements of peak stress and peak particle velocity presented here (Fig. 6) show that, within experimental uncertainties, the peak stress-particle velocity states for the two HOPG grades are indistinguishable, consistent with previous results from the transmission experiments. 3 In contrast, the measured sound velocities (Figs. 7) reveal significant differences in the peak state compressibility for ZYH- and ZYB-grade HOPG, showing that the peak state of HOPG shocked below 18 GPa depends strongly on the HOPG orientational order. The sound velocity (or compressibility) results are a better indicator of the mechanical state of shocked ZYHand ZYB-grade HOPG, compared to stress-particle velocity or stress-compression results. For ZYH-grade HOPG, the measured sound velocities in Fig. 7 are intermediate between the calculated longitudinal and bulk velocities; the measured velocities increase smoothly with compression, similar to the calculated velocities. For ZYB-grade HOPG beyond 12 GPa, the measured sound velocities do not increase smoothly with compression. Instead, a number of interesting features are observed with increasing compression: beyond ~18 percent compression, the measured sound speed is first nearly identical to the bulk sound speed and then drops below the bulk sound speed; around 21 percent compression, the measured sound speed increases and reaches the bulk sound speed at the highest compression (~22 percent). 15
16 Longitudinal moduli for shocked ZYH- and ZYB-grade HOPG were determined from the measured Eulerian sound velocities and peak densities and are listed in Table II. For comparison, longitudinal and bulk moduli were also determined from the calculated sound velocities. Figure 8 shows the measured longitudinal moduli (solid symbols) and the calculated longitudinal and bulk moduli (solid and dashed lines, respectively) as a function of density compression and longitudinal stress. As shown in Fig. 8, the compression-dependence of the measured longitudinal modulus for shocked ZYB-grade HOPG is significantly reduced between 12 and 18 GPa, indicating a softening of the longitudinal modulus. To better understand the observed softening, we examined the shear modulus G for shocked HOPG, 10 3 G L B, (5) 4 where L and B are the measured longitudinal modulus and the calculated bulk modulus, respectively. Although equation (5) is strictly applicable only for isotropic solids, its use here is consistent with the material description for shocked HOPG presented in the Appendix and in Ref. 3. Because the measured longitudinal modulus for shocked ZYBgrade HOPG is less than the calculated bulk modulus for peak stresses between 15 GPa and 18 GPa (see Fig. 8), the shear modulus from equation (5) is negative over the same range of peak stresses. A negative shear modulus violates the well-known criteria for elastic stability, 12,13 and the measured results in Fig. 8 show that an elastic instability occurs in ZYB-grade HOPG shocked to peak stresses between 15 GPa and 18 GPa. The strong orientational order dependence of the shocked state, shown in Figs. 7 and 8, is consistent with other types of orientation dependence reported previously
17 for HOPG shocked to stresses below and above 18 GPa. We list these linkages: the softening of the longitudinal modulus for ZYB-grade HOPG shocked between 12 and 18 GPa (Fig. 8), the large amplitude elastic waves observed for ZYB-grade HOPG shocked below 18 GPa, 3 and the rapid phase transformation for ZYB-grade HOPG shocked above 18 GPa. 1,2 The present results and the large elastic wave amplitudes reported previously 3 suggest that the longitudinal modulus softening, and the associated elastic instability, in ZYB-grade HOPG may be the result of large elastic compressions. Because the elastic instability occurs at stresses well below the onset of rapid phase transformation, 1-2 the elastic instability is likely a precursor to the rapid phase transformation in shocked ZYB-grade HOPG. The findings presented here are consistent with the following physical picture proposed for the onset of a rapid phase transformation in shocked ZYB-grade HOPG: 3 the large strain energy in the compressed state is a consequence of the large elastic compression and results in an elastic instability, which leads to the onset of a displacive phase transformation. Real-time, in situ, microscopic measurements 14,15 are needed to provide direct confirmation of this picture. V. SUMMARY AND CONCLUSIONS To gain insight into the orientational order dependence of shocked HOPG observed 1-3 at stresses below and above the phase transformation onset (18.6 GPa), we examined the compressibility of shocked ZYH- and ZYB- grade HOPG at stresses approaching 18 GPa. Particle velocity histories were measured in front surface impact experiments for peak stresses between 9 and 18 GPa. The results showed that, within 17
18 experimental precision, the locus of measured peak stress-particle velocity states for ZYH- and ZYB-grade HOPG is indistinguishable. In contrast, the measured sound velocities and the corresponding longitudinal moduli in the peak state revealed key differences between ZYH- and ZYB-grade HOPG: 1. For the ZYH-grade, the sound velocities increase smoothly over the range of peak stresses examined here. In contrast, the compression-dependence of the sound velocities for ZYB-grade HOPG exhibits a significant reduction between 12 and 17 GPa, indicating an increase in compressibility (or softening of the longitudinal modulus), and an abrupt increase in sound velocity between 17 and 18 GPa. 2. For ZYH-grade HOPG, the longitudinal moduli determined from the measured sound velocities are larger than the calculated bulk moduli over the range of peak stresses examined here. In contrast, the longitudinal moduli for ZYB-grade HOPG are smaller than the calculated bulk moduli for stresses between 15 and 18 GPa, implying the onset of an elastic instability. These findings show that sound velocity measurements are a better indicator of differences in the peak state of shocked ZYH- and ZYB-grade HOPG than stressparticle velocity (Fig. 6) or stress-density compression 3 measurements. The measured sound velocities (Fig. 7) and the corresponding longitudinal moduli (Fig. 8) for the two grades of HOPG depend strongly on the HOPG orientational order for peak stresses below the phase transition onset. 18
19 Our findings establish a link between the following phenomena, observed only for shocked ZYB-grade HOPG: softening of the longitudinal modulus for peak stresses below 18 GPa (Fig. 8), large amplitude elastic waves for stresses below 18 GPa, 3 and rapid phase transformation for stresses above 18 GPa. 1,2 The large amplitude elastic waves observed previously 3 and the observed longitudinal modulus softening (elastic instability) for shocked ZYB-grade HOPG suggest that the elastic instability is likely a consequence of the large elastic compression for this HOPG grade. Furthermore, the elastic instability below the phase transition stress and the rapid phase transformation reported for stresses above 18.6 GPa 1,2 suggest that the elastic instability is likely a precursor to the phase transformation in shocked ZYB-grade HOPG. Overall, the present findings are consistent with the physical picture suggested previously 3 for the rapid phase transformation in shocked ZYB-grade HOPG: Large elastic compressions result in an elastic instability, which leads to the onset of a displacive phase transformation. However, microscopic measurements 14,15 are needed to confirm this hypothesis and to gain further insight into the peak state structure of shocked ZYB-grade HOPG. ACKNOWLEDGMENTS Nate Arganbright, Paul Ruggiero, Brendan Williams and Kurt Zimmerman are thanked for their expert assistance with the experiments. This work was supported by the Department of Energy/NNSA through Cooperative Agreement DE-NA
20 APPENDIX: NUMERICAL SIMULATIONS The phenomenological material models used in the numerical simulations presented in Sec. IV.C are the same as those used previously to simulate transmitted wave profiles in shocked ZYH- and ZYB-grade HOPG. 3 Summarized briefly, our modeling approach incorporated the usual separation 16 of the mechanical response into the mean stress response and the deviatoric stress response. The mean stress curves for ZYH- and ZYB-grade HOPG were assumed to be identical and were fit to the combined peak stress-density compression data for the two HOPG grades. 3 For ZYHgrade HOPG, which exhibited single or overdriven wave profiles, 3 the stress deviators were assumed to be zero. For ZYB-grade HOPG, which exhibited two-wave elasticinelastic profiles, 3 the stress deviators were determined using a time-dependent overstress model, 17 in which the shear modulus and yield stress depend on longitudinal stress, and the yield stress decreases with accumulated inelastic strain (loss of strength). 3 For some of the calculations presented in Sec. IV.C, the models for ZYH- and ZYB-grade HOPG were modified slightly so that a small, but non-zero, yield stress was retained in the calculated peak states. For the modified ZYH-grade HOPG model, the shear modulus was assumed to be the same as that used for ZYB-grade HOPG. The numerical simulations were carried out using a one-dimensional wave propagation code, 18 which utilizes the typical finite-difference, artificial viscosity approach 16 to solve the governing equations for large amplitude wave propagation. The responses of the [100] LiF window and the PMMA backing plate on the impactor were described using fits to published shock wave data. 9,19,20 20
21 REFERENCES D. J. Erskine and W. J. Nellis, Nature 349, 317 (1991). D. J. Erskine and W. J. Nellis, J. Appl. Phys. 71, 4882 (1992). M. Lucas, J. M. Winey, and Y. M. Gupta, J. Appl. Phys. 114, (2013). D. Choudhuri and Y. M. Gupta, J. Appl. Phys. 114, (2013). B. J. Jensen, F. J. Cherne, J. C. Cooley, M. V. Zhernokletov, and A. E. Kovalev, Phys. Rev. B 81, (2010) L. M. Barker and R. E. Hollenbach, J. Appl. Phys. 43, 4669 (1972). J. R. Asay and L. M. Barker, J. Appl. Phys. 45, 2540 (1974). J. L. Wise and L. C. Chhabildas, in Shock Waves in Condensed Matter 1985, edited by Y. M. Gupta (Plenum, New York, 1986), p W. J. Carter, High Temp. - High Press. 5, 313 (1973). R. G. McQueen, S. P. Marsh, and J. N. Fritz, J. Geophys. Res. 72, 4999 (1967). J. R. Taylor, An Introduction to Error Analysis (University Science Books, Mill Valley, CA, 1982). 12 M. Born and K. Huang, Dynamical Theory of Crystal Lattices (Oxford University Press, Oxford, 1962), p R. Hill and F. Milstein, Phys. Rev. B 15, 3087 (1977). S. J. Turneaure and Y. M. Gupta, J. Appl. Phys. 105, (2009). S. J. Turneaure and Y. M. Gupta, J. Appl. Phys. 106, (2009). M. L. Wilkins, in Methods in Computational Physics, edited by B. Alder, S. Fernbach, and M. Rotenberg (Academic, New York, 1964), Vol. 3, p
22 17 18 G. Yuan, R. Feng, Y. M. Gupta, and K. Zimmerman, J. Appl. Phys. 88, 2371 (2000). Y. M. Gupta, COPS Wave Propagation Code (SRI International, Menlo Park, CA, 1976) L. M. Barker and R. E. Hollenbach, J. Appl. Phys. 41, 4208 (1970). K. W. Schuler and J. W. Nunziato, Rheol. Acta 13, 265 (1974). 22
23 Table I. Summary of experimental parameters. Experiment number Sample Sample density a (g/cc) Sample thickness b (mm) Impact velocity c (mm/μs) 1 (13-617) ZYH HOPG (13-627) ZYH HOPG (14-611) ZYH HOPG (14-607) ZYH HOPG (13-613) ZYH HOPG (13-616) ZYH HOPG (13-619) ZYH HOPG (13-611) ZYB HOPG (13-628) ZYB HOPG (14-605) ZYB HOPG (13-608) ZYB HOPG (13-626) ZYB HOPG (13-609) ZYB HOPG (13-621) ZYB HOPG (13-620) ZYB HOPG a Measurement uncertainties are 0.2% or better. b Measurement uncertainties are 0.3% or better. c Measurement uncertainties are 0.5% or better. 23
24 Table II. Experimental results for shocked highly-oriented pyrolytic graphite. a Experiment number 1 (13-617) 2 (13-627) Sample ZYH HOPG ZYH HOPG 3 (14-611) ZYH HOPG 4 (14-607) ZYH HOPG 5 (13-613) 6 (13-616) 7 (13-619) 8 (13-611) 9 (13-628) ZYH HOPG ZYH HOPG ZYH HOPG ZYB HOPG ZYB HOPG 10 (14-605) ZYB HOPG 11 (13-608) 12 (13-626) 13 (13-609) 14 (13-621) 15 (13-620) ZYB HOPG ZYB HOPG ZYB HOPG ZYB HOPG ZYB HOPG Particle velocity b (mm/μs) 0.649±0.008 (0.651) 0.768±0.006 (0.768) 0.840±0.007 (0.838) 0.851±0.007 (0.841) 0.924±0.006 (0.928) 1.024±0.007 (1.031) 1.055±0.004 (1.059) 0.564±0.004 (0.560) 0.727±0.006 (0.726) 0.820±0.004 (0.819) 0.908±0.003 (0.908) 0.963±0.007 (0.970) 1.002±0.006 (1.010) 1.059±0.006 (1.076) 1.063±0.005 (1.073) Peak stress (GPa) 10.33±0.14 (10.36) 12.54±0.11 (12.54) 13.94±0.13 (13.90) 14.15±0.14 (13.96) 15.61±0.13 (15.68) 17.66±0.16 (17.80) 18.31±0.08 (18.39) 8.80±0.07 (8.73) 11.76±0.11 (11.75) 13.55±0.07 (13.53) 15.28±0.07 (15.29) 16.41±0.14 (16.54) 17.20±0.13 (17.37) 18.40±0.13 (18.75) 18.48±0.11 (18.70) Density compression μ=ρ/ρ O ±0.001 (0.157) 0.175±0.001 (0.176) 0.186±0.001 (0.186) 0.187±0.001 (0.187) 0.198±0.001 (0.199) 0.211±0.001 (0.212) 0.215±0.001 (0.216) 0.141±0.001 (0.141) 0.169±0.001 (0.169) 0.183±0.001 (0.183) 0.195±0.001 (0.196) 0.204±0.001 (0.204) 0.208±0.001 (0.210) 0.216±0.001 (0.218) 0.216±0.001 (0.218) Lagrangian sound velocity (mm/μs) 8.97±0.28 (8.01) 9.27±0.18 (8.73) 9.60±0.21 (9.11) 9.63±0.19 (9.12) 10.01±0.20 (9.61) 10.64±0.22 (10.23) 10.67±0.14 (10.38) 7.59±0.22 (7.53) 8.90±0.11 (8.48) 9.09±0.10 (9.10) 9.41±0.11 (9.53) 9.47±0.10 (9.84) 9.68±0.10 (10.10) 10.13±0.09 (10.50) 10.31±0.09 (10.43) Eulerian sound velocity (mm/μs) 7.76±0.25 (6.93) 7.89±0.16 (7.42) 8.10±0.18 (7.69) 8.11±0.17 (7.68) 8.35±0.17 (8.02) 8.78±0.18 (8.44) 8.78±0.11 (8.54) 6.65±0.19 (6.60) 7.61±0.09 (7.25) 7.68±0.08 (7.69) 7.87±0.10 (7.96) 7.87±0.08 (8.17) 8.01±0.08 (8.35) 8.33±0.08 (8.62) 8.47±0.07 (8.56) Longitudinal modulus c (GPa) 157±10 (125) 165±7 (146) 175±8 (158) 177±7 (158) 189±8 (174) 211±9 (195) 212±6 (200) 114±7 (112) 152±4 (139) 158±3 (158) 168±4 (171) 168±4 (182) 175±4 (191) 190±4 (205) 198±4 a The numbers in parentheses are from numerical simulations using the material models presented in Ref. 3. b Indicates the peak particle velocities measured at the impact surface. The uncertainties shown account for the precision of the interferometry measurements and for fluctuations in the measured velocity histories (Figs. 4 and 5). c Calculated moduli (in parentheses) reflect the mean stress (or bulk) response. (202) 24
25 FIGURE CAPTIONS FIG. 1. Schematic view of the front surface impact experiments to measure particle velocity histories and sound velocities in shocked HOPG. FIG. 2. (a) Time position diagram and (b) longitudinal stress particle velocity diagram for shocked ZYH-grade HOPG. State A is the peak state reached in the HOPG sample by the single overdriven shock wave. In (a), U s is the velocity of the shock wave in the HOPG sample. The dotted line indicates the release wave due to the reflection of the shock wave from the PMMA-HOPG interface. The leading edge of the release wave propagates at the sound velocity (c L ) in the shocked state and reaches the impact surface at time t 2. In (b), the solid lines are the Hugoniot curves for the HOPG sample and the LiF window. FIG. 3. (a) Time position diagram and (b) longitudinal stress particle velocity diagram for shocked ZYB-grade HOPG. A and B denote the states in the HOPG sample reached by the elastic and inelastic waves, respectively. In (a), U sa and U sb are the velocities of the elastic and inelastic waves in the HOPG sample, respectively. The dotted line indicates the release wave due to the reflection of the elastic wave from the PMMA- HOPG interface. The leading edge of the release wave propagates at a velocity U RA over a distance h 1, until it interacts with the oncoming inelastic wave. The leading edge of the release wave then propagates at the sound velocity (c L ) in the shocked state and 25
26 reaches the impact surface at time t 2. In (b), the solids lines are the Hugoniot curves for the HOPG sample and the LiF window. FIG. 4. Impact surface particle velocity histories for ZYH-grade HOPG. The experiment numbers correspond to those listed in Tables I and II. Dark red lines correspond to experiments 1, 3, 5 and 7, and light red lines correspond to experiments 2, 4 and 6. The peak stresses range from 10.3 to 18.3 GPa. Time zero corresponds to the moment of impact. FIG. 5. Impact surface particle velocity histories for ZYB-grade HOPG. The experiment numbers correspond to those listed in Tables I and II. Dark green lines correspond to experiments 8, 10, 12, and 14 and light green lines correspond to experiments 9, 11, 13 and 15. The peak stresses range from 8.8 to 18.5 GPa. Time zero corresponds to the moment of impact. FIG. 6. Measured peak longitudinal stress particle velocity states for shocked HOPG. The solid symbols are results from the present experiments. The remaining symbols and curves are from previous wave transmission experiments (Ref. 3). The crossed symbols are the elastic wave states in ZYB-grade HOPG; the open symbols are the peak states in ZYH- and ZYB-grade HOPG. The solid line is a fit to the elastic wave states in the ZYB-grade, and the dashed line is a fit to the combined peak states for both ZYH- and ZYB-grades. The experimental uncertainties for the measured states are small compared to the size of the symbols. 26
27 FIG. 7. Eulerian sound velocity versus density compression and longitudinal stress for shocked HOPG. The solid symbols are measured values. The solid and dashed lines are fits to longitudinal and bulk sound velocities, respectively, calculated using wave propagation simulations. FIG. 8. Longitudinal modulus versus density compression and longitudinal stress for shocked HOPG. The solid symbols are longitudinal moduli determined from the measured sound velocities. The solid and dashed lines are fits to calculated longitudinal and bulk moduli, respectively, determined from the calculated sound velocities. 27
28
29
30
31
32
33
34
35
A METHODOLOGY TO VALIDATE 3D ARBITRARY LAGRANGIAN EULERIAN CODES WITH APPLICATIONS TO ALEGRA
 A METHODOLOGY TO VALIDATE 3D ARBITRARY LAGRANGIAN EULERIAN CODES WITH APPLICATIONS TO ALEGRA L. C. CHHABILDAS, C. H. KONRAD, D. A. MOSHER, W. D. REINHART, B. D. DUGGINS, T. G. TRUCANO, R. M. SUMMERS, J.
Shock Response of Polymethylmethacrylate
 J. dynamic behavior mater. (6) :37 378 DOI.7/s487-6-7-5 Shock Response of Polymethylmethacrylate Jennifer L. Jordan Daniel Casem Michael Zellner Received: April 6 / Accepted: 4 May 6 / Published online:
The Hugoniot and Strength of Ultem 1000 Polyetherimide
 J. dynamic behavior mater. (5) :5 36 DOI.7/s487-5-9-z The Hugoniot and Strength of Ultem Polyetherimide Christopher Neel Lalit Chhabildas Received: July 5 / Accepted: July 5 / Published online: 7 August
Longitudinal and lateral stress measurements in shock-loaded gabbro and granite
 JOURNAL OF APPLIED PHYSICS VOLUME 87, NUMBER 8 15 APRIL 2000 Longitudinal and lateral stress measurements in shock-loaded gabbro and granite J. C. F. Millett a) and K. Tsembelis Physics and Chemistry of
Strength effects in diamond under shock compression from 0.1 to 1 TPa
 Strength effects in diamond under shock compression from 0.1 to 1 TPa R. S. McWilliams, 1,2, * J. H. Eggert, 2 D. G. Hicks, 2 D. K. Bradley, 2 P. M. Celliers, 2 D. K. Spaulding, 1 T. R. Boehly, 3 G. W.
EFFECT OF LOADING RATE AND PEAK STRESS ON THE ELASTIC LIMIT OF DYNAMICALLY COMPRESSED BRITTLE SINGLE CRYSTALS BRANDON MICHAEL LALONE
 EFFECT OF LOADING RATE AND PEAK STRESS ON THE ELASTIC LIMIT OF DYNAMICALLY COMPRESSED BRITTLE SINGLE CRYSTALS By BRANDON MICHAEL LALONE A dissertation submitted in partial fulfillment of the requirements
Nonlinear surface acoustic wave pulses in solids: Laser excitation, propagation, interactions invited
 REVIEW OF SCIENTIFIC INSTRUMENTS VOLUME 74, NUMBER 1 JANUARY 2003 Nonlinear surface acoustic wave pulses in solids: Laser excitation, propagation, interactions invited Al. A. Kolomenskii, a) V. A. Lioubimov,
Band Gap Shift of GaN under Uniaxial Strain Compression
 Mat. Res. Soc. Symp. Proc. ol. 693 2002 Materials Research Society Band Gap Shift of GaN under Uniaxial Strain Compression H. Y. Peng, M. D. McCluskey, Y. M. Gupta, M. Kneissl 1, and N. M. Johnson 1 Institute
Extension of the Planar Noh Problem to Aluminum, Iron, Copper, and Tungsten
 Extension of the Planar Noh Problem to Aluminum, Iron, Copper, and Tungsten Chloe E. Yorke, April D. Howard, Sarah C. Burnett, Kevin G. Honnell a), Scott D. Ramsey, and Robert L. Singleton, Jr. Computational
NATURE OF SHORT HIGH AMPLITUDE PULSES IN A PERIODIC DISSIPATIVE LAMINATE METAMATERIAL. Jolla CA USA USA USA
 NATURE OF SHORT HIGH AMPLITUDE PULSES IN A PERIODIC DISSIPATIVE LAMINATE METAMATERIAL Pedro Franco Navarro 1, David J. Benson 2, Vitali F. Nesterenko 1, 3 1 Department of Mechanical and Aerospace Engineering,
arxiv: v2 [cond-mat.mtrl-sci] 24 Nov 2009
![arxiv: v2 [cond-mat.mtrl-sci] 24 Nov 2009](/thumbs/93/111672093.jpg "arxiv: v2 [cond-mat.mtrl-sci] 24 Nov 2009") An Equation of State for Anisotropic Solids under Shock Loading arxiv:09.477v2 [cond-mat.mtrl-sci] 24 Nov 2009 Alexander A. Lukyanov Abingdon Technology Centre, Schlumberger, Abingdon, OX4 UJ, UK (Dated:
An Equation of State for Anisotropic Solids under Shock Loading arxiv:09.477v2 [cond-mat.mtrl-sci] 24 Nov 2009 Alexander A. Lukyanov Abingdon Technology Centre, Schlumberger, Abingdon, OX4 UJ, UK (Dated:
Rayleigh Taylor Instability in Strong Media, Experimental Study
 Originally published in Proceedings of the Fifth International Workshop on Compressible Turbulent Mixing, ed. R. Young, J. Glimm & B. Boston. ISBN 9810229100, World Scientific (1996). Reproduced with the
Shock compression of precompressed deuterium
 LLNL-PROC-491811 Shock compression of precompressed deuterium M. R. Armstrong, J. C. Crowhurst, J. M. Zaug, S. Bastea, A. F. Goncharov, B. Militzer August 3, 2011 Shock compression of precompressed deuterium
INFLUENCE OF INITIAL DENSITY ON THE REACTION ZONE FOR STEADY-STATE DETONATION OF HIGH EXPLOSIVES
 INFLUENCE OF INITIAL DENSITY ON THE REACTION ZONE FOR STEADY-STATE DETONATION OF HIGH EXPLOSIVES Alexander V. Utkin, Sergey A. Kolesnikov, Sergey V. Pershin, and Vladimir E. Fortov Institute of Problems
ELASTICITY AND CONSTITUTION OF THE EARTH'S INTERIOR*
 JOURNAL OF GEOPHYSICAL RESEARCH VOLUME 57, NO. 2 JUNE, 1952 ELASTICITY AND CONSTITUTION OF THE EARTH'S INTERIOR* BY FRANCIS BIRCtt Harvard University, Cambridge, Massachusetts (Received January 18, 1952)
Shock Wave Experiments Using PDV: Window Characterization at 1550 nm
 Shock Wave Experiments Using PDV: Window Characterization at 1550 nm B. J. Jensen (DE-9), D. Holtkamp (P-22), D. H. Dolan (Sandia) Los Alamos National Laboratory Acknowlegements: Tim Pierce (DE-9), Mark
Supporting Online Material for
 www.sciencemag.org/cgi/content/full/313/5794/1765/dc1 Supporting Online Material for Self-Healing Pulse-Like Shear Ruptures in the Laboratory George Lykotrafitis, Ares J. Rosakis,* Guruswami Ravichandran
High pressure Hugoniot measurements using converging shocks
 JOURNAL OF APPLIED PHYSICS 109, 093520 (2011) High pressure Hugoniot measurements using converging shocks J. L. Brown, 1,a) G. Ravichandran, 1 W. D. Reinhart, 2 and W. M. Trott 2 1 California Institute
Borehole Geophysics. Acoustic logging measurements
 Acoustic logging measurements - Review of basic physics background - Concept of P- and S-wave measurements and logging tools - Tube waves - Seismic imaging - Synthetic seismograms - Field application examples
Nature Protocols: doi: /nprot Supplementary Figure 1
 Supplementary Figure 1 Photographs of the 3D-MTC device and the confocal fluorescence microscopy. I: The system consists of a Leica SP8-Confocal microscope (with an option of STED), a confocal PC, a 3D-MTC
Application of a Computational Glass Model to the Shock Response of Soda-Lime Glass
 J. dynamic behavior mater. (216) 2:283 35 DOI 1.17/s487-16-66-2 Application of a Computational Glass Model to the Shock Response of Soda-Lime Glass Joshua E. Gorfain 1 Christopher T. Key 2 C. Scott Alexander
Simulation of sympathetic detonation by a CIP Eulerian code
 Computational Ballistics II 107 Simulation of sympathetic detonation by a CIP Eulerian code S. Kubota 1, Z. Liu 2, T. Saburi 1, Y. Ogata 1 & M. Yoshida 1 1 Research Center for Explosion Safety, National
6th NDT in Progress Lamb waves in an anisotropic plate of a single crystal silicon wafer
 6th NDT in Progress 2011 International Workshop of NDT Experts, Prague, 10-12 Oct 2011 Lamb waves in an anisotropic plate of a single crystal silicon wafer Young-Kyu PARK 1, Young H. KIM 1 1 Applied Acoustics
 LA-UR-01-3491 Approved for public release; distribution is unlimited. Title: APPLYING MICRO-MECHANICS TO FINITE ELEMENT SIMULATIONS OF SPLIT HOPKINSON PRESSURE BAR EXPERIMENTS ON HIGH EXPLOSIVES Author(s):
SURFACE WAVE MODELLING USING SEISMIC GROUND RESPONSE ANALYSIS
 43 SURFACE WAVE MODELLING USING SEISMIC GROUND RESPONSE ANALYSIS E John MARSH And Tam J LARKIN SUMMARY This paper presents a study of surface wave characteristics using a two dimensional nonlinear seismic
Chapter 2 Surface Acoustic Wave Motor Modeling and Motion Control
 Chapter 2 Surface Acoustic Wave Motor Modeling and Motion Control 1 Abstract For miniaturization of ultrasonic transducers, a surface acoustic wave device has an advantage in rigid mounting and high-power-density
Mechanical characterization of single crystal BaTiO 3 film and insitu. XRD observation of microstructure change due to
 76 Chapter 4 Mechanical characterization of single crystal BaTiO 3 film and insitu XRD observation of microstructure change due to mechanical loading 4.1 Introduction Ferroelectric materials have many
Sound Propagation through Media. Nachiketa Tiwari Indian Institute of Technology Kanpur
 Sound Propagation through Media Nachiketa Tiwari Indian Institute of Technology Kanpur LECTURE-13 WAVE PROPAGATION IN SOLIDS Longitudinal Vibrations In Thin Plates Unlike 3-D solids, thin plates have surfaces
SPEED OF SOUND MEASUREMENT IN SOLIDS USING POLYVINYLIDENE FLUORIDE (PVDF) SENSORS
 SENSORS") Proceedings of the ASME 2013 Conference on Smart Materials, Adaptive Structures and Intelligent Systems SMASIS2013 September 16-18, 2013, Snowbird, Utah, USA SMASIS2013-3206 SPEED OF SOUND MEASUREMENT
Proceedings of the ASME 2013 Conference on Smart Materials, Adaptive Structures and Intelligent Systems SMASIS2013 September 16-18, 2013, Snowbird, Utah, USA SMASIS2013-3206 SPEED OF SOUND MEASUREMENT
Los Alamos NATIONAL LABORATORY LA-UR Double Shock Initiation of the HMX Based Explosive EDC-37
 LA-UR- 01-3383 Approved for public release; distribution is unlimited. Title: Double Shock Initiation of the HMX Based Explosive EDC-37 Author(s): R. L. Gustavsen, S. A. Sheffield, and R. R. Alcon Los
Longitudinal Waves. waves in which the particle or oscillator motion is in the same direction as the wave propagation
 Longitudinal Waves waves in which the particle or oscillator motion is in the same direction as the wave propagation Longitudinal waves propagate as sound waves in all phases of matter, plasmas, gases,
RECEIVED SEQ
 SHOCK HUGONOT AND RELEASE STATES N CONCRETE MXTURES WTH DFFERENT AGGREGATE SZES FROM Y 3 TO 23 GPA C. A. Hall, L. C. Chhabildas, and W. D. Reinhart Sandia National Laboratories, Albuquerque, NM 87185-1
The Effects of Transverse Shear on the Delamination of Edge-Notch Flexure and 3-Point Bend Geometries
 The Effects of Transverse Shear on the Delamination of Edge-Notch Flexure and 3-Point Bend Geometries M. D. Thouless Department of Mechanical Engineering Department of Materials Science & Engineering University
height trace of a 2L BN mechanically exfoliated on SiO 2 /Si with pre-fabricated micro-wells. Scale bar 2 µm.
 Supplementary Figure 1. Few-layer BN nanosheets. AFM image and the corresponding height trace of a 2L BN mechanically exfoliated on SiO 2 /Si with pre-fabricated micro-wells. Scale bar 2 µm. Supplementary
Effect of phase change on shock wave attenuation in GeO 2
 JOURNAL OF APPLIED PHYSICS VOLUME 91, NUMBER 11 1 JUNE 2002 Effect of phase change on shock wave attenuation in GeO 2 C. Liu a) and T. J. Ahrens Seismological Laboratory 252-21, California Institute of
Stress-Strain Behavior
 Stress-Strain Behavior 6.3 A specimen of aluminum having a rectangular cross section 10 mm 1.7 mm (0.4 in. 0.5 in.) is pulled in tension with 35,500 N (8000 lb f ) force, producing only elastic deformation.
Refractive-Index Measurements of LiF Ramp Compressed to 800 GPa
 Refractive-Index Measurements of LiF Ramp Compressed to 8 GPa Pressure (GPa) 1 4 68 1.6 1.55 Refractive index D. E. Fratanduono Lawrence Livermore National Laboratory 1.5 1.45 1.4 1.35 Weighted mean Wise
Nanoscale Energy Conversion and Information Processing Devices - NanoNice - Photoacoustic response in mesoscopic systems
 Nanoscale Energy Conversion and Information Processing Devices - NanoNice - Photoacoustic response in mesoscopic systems Photonics group W. Claeys, S. Dilhair, S. Grauby, JM. Rampnoux, L. Patino Lopez,
NDE of wood-based composites with longitudinal stress waves
 NDE of wood-based composites with longitudinal stress waves Robert J. Ross Roy F. Pellerin Abstract The research presented in this paper reveals that stress wave nondestructive testing techniques can be
A BURN MODEL BASED ON HEATING DUE TO SHEAR FLOW: PROOF OF PRINCIPLE CALCULATIONS. F. J. Zerilli, R. H. Guirguis, and C. S. Coffey
 A BURN MODEL BASED ON HEATING DUE TO SHEAR FLOW: PROOF OF PRINCIPLE CALCULATIONS F. J. Zerilli, R. H. Guirguis, and C. S. Coffey Indian Head Division Naval Surface Warfare Center Indian Head, MD 20640
DYNAMIC ROTARY TORQUE MEASUREMENT USING SURFACE ACOUSTIC WAVES
 DYNAMIC ROTARY TORQUE MEASUREMENT USING SURFACE ACOUSTIC WAVES Abstract A. Lonsdale Technical Director Sensor Technology Ltd The subject of torque measurement has previously been addressed extensively.
Methane hydrate rock physics models for the Blake Outer Ridge
 Stanford Exploration Project, Report 80, May 15, 2001, pages 1 307 Methane hydrate rock physics models for the Blake Outer Ridge Christine Ecker 1 ABSTRACT Seismic analyses of methane hydrate data from
Unit I - Properties of Matter
 Unit I - Properties of Matter Elasticity: Elastic and plastic materials Hooke s law elastic behavior of a material stress - strain diagram factors affecting elasticity. Three moduli of elasticity Poisson
INTRODUCTION Strained Silicon Monochromator Magnesium Housing Windows for Monochromator Shutter and Collimator Fission Detector HOPG Monochromator
 Design for a Four-Blade Neutron Interferometer INTRODUCTION Strained Silicon Monochromator The neutron beam used for this interferometer is separated from the NIST reactor's main beam using a strained
Note that W is the skin surface weight density in units of psf. An equivalent graph in terms of metric units is given in Appendix A.
 VIBRATION RESPONSE OF A CYLINDRICAL SKIN TO ACOUSTIC PRESSURE VIA THE FRANKEN METHOD Revision H By Tom Irvine Email: tomirvine@aol.com September 16, 2008 Introduction The front end of a typical rocket
ELASTOPLASTICITY THEORY by V. A. Lubarda
 ELASTOPLASTICITY THEORY by V. A. Lubarda Contents Preface xiii Part 1. ELEMENTS OF CONTINUUM MECHANICS 1 Chapter 1. TENSOR PRELIMINARIES 3 1.1. Vectors 3 1.2. Second-Order Tensors 4 1.3. Eigenvalues and
Fig. 1. Circular fiber and interphase between the fiber and the matrix.
 Finite element unit cell model based on ABAQUS for fiber reinforced composites Tian Tang Composites Manufacturing & Simulation Center, Purdue University West Lafayette, IN 47906 1. Problem Statement In
Use of the Z Accelerator for Isentropic and Shock Compression Studies
 1 Use of the Z Accelerator for Isentropic and Shock Compression Studies Marcus D. Knudson 1.1 Introduction The high-pressure equation of state (EOS) of materials is usually determined by shock compression
Mechanics of wafer bonding: Effect of clamping
 JOURNAL OF APPLIED PHYSICS VOLUME 95, NUMBER 1 1 JANUARY 2004 Mechanics of wafer bonding: Effect of clamping K. T. Turner a) Massachusetts Institute of Technology, Cambridge, Massachusetts 0219 M. D. Thouless
MODULE C: COMPRESSION MEMBERS
 MODULE C: COMPRESSION MEMBERS This module of CIE 428 covers the following subjects Column theory Column design per AISC Effective length Torsional and flexural-torsional buckling Built-up members READING:
Numerical modelling of induced tensile stresses in rock in response to impact loading
 Numerical modelling of induced tensile stresses in rock in response to impact loading M.T. Mnisi, D.P. Roberts and J.S. Kuijpers Council for Scientific and Industrial Research (CSIR): Natural Resources
Pressure and Compaction in the Rock Physics Space. Jack Dvorkin
 Pressure and Compaction in the Rock Physics Space Jack Dvorkin June 2002 0 200 Compaction of Shales Freshly deposited shales and clays may have enormous porosity of ~ 80%. The speed of sound is close to
Doppler echocardiography & Magnetic Resonance Imaging. Doppler echocardiography. History: - Langevin developed sonar.
 1 Doppler echocardiography & Magnetic Resonance Imaging History: - Langevin developed sonar. - 1940s development of pulse-echo. - 1950s development of mode A and B. - 1957 development of continuous wave
PES Institute of Technology
 PES Institute of Technology Bangalore south campus, Bangalore-5460100 Department of Mechanical Engineering Faculty name : Madhu M Date: 29/06/2012 SEM : 3 rd A SEC Subject : MECHANICS OF MATERIALS Subject
International Journal of Pure and Applied Sciences and Technology
 Int. J. Pure Appl. Sci. Technol., 3() (0), pp. 7-39 International Journal of Pure and Applied Sciences and Technology ISSN 9-607 Available online at www.ijopaasat.in Research Paper Reflection of Quasi
Non-Destructive Testing of Concrete Based on Analysis of Velocity Dispersion of Laser Ultrasonics
 ECNDT 26 - Poster 223 Non-Destructive Testing of Concrete Based on Analysis of Velocity Dispersion of Laser Ultrasonics Kenichiro TSUYUKI, Ryuta KATAMURA, Satoru MIURA, Kajima Technical Research Institute,
Tensile stress strain curves for different materials. Shows in figure below
 Tensile stress strain curves for different materials. Shows in figure below Furthermore, the modulus of elasticity of several materials effected by increasing temperature, as is shown in Figure Asst. Lecturer
Members Subjected to Torsional Loads
 Members Subjected to Torsional Loads Torsion of circular shafts Definition of Torsion: Consider a shaft rigidly clamped at one end and twisted at the other end by a torque T = F.d applied in a plane perpendicular
Supplementary Figures
 Supplementary Figures Supplementary Figure S1. The effect of window size. The phonon MFP spectrum of intrinsic c-si (T=300 K) is shown for 7-point, 13-point, and 19-point windows. Increasing the window
ULTRASONIC INVESTIGATION OF THE STIFFNESS OF GRAPHITE-
 ULTRASONIC INVESTIGATION OF THE STIFFNESS OF GRAPHITE- GRAPHITE INTERFACES A. M. Robinson, B. W. Drinkwater Department of Mechanical Engineering, Queen's Building, University Walk, University of Bristol,
CO 2 Rock Physics: A Laboratory Study
 CO 2 Rock Physics: A Laboratory Study Helen Yam* University of Alberta, Edmonton, Alberta, Canada hyam@ualberta.ca and Douglas R. Schmitt University of Alberta, Edmonton, Alberta, Canada Summary It is
TABLE OF CONTENTS. Mechanics of Composite Materials, Second Edition Autar K Kaw University of South Florida, Tampa, USA
 Mechanics of Composite Materials, Second Edition Autar K Kaw University of South Florida, Tampa, USA TABLE OF CONTENTS 1. INTRODUCTION TO COMPOSITE MATERIALS 1.1 Introduction... 1.2 Classification... 1.2.1
Lecture contents. Stress and strain Deformation potential. NNSE 618 Lecture #23
 1 Lecture contents Stress and strain Deformation potential Few concepts from linear elasticity theory : Stress and Strain 6 independent components 2 Stress = force/area ( 3x3 symmetric tensor! ) ij ji
SIMULATION OF NONLINEAR VISCO-ELASTICITY
 SIMULATION OF NONLINEAR VISCO-ELASTICITY Kazuyoshi Miyamoto*, Hiroshi Yoshinaga*, Masaki Shiraishi*, Masahiko Ueda* *Sumitomo Rubber Industries,LTD. 1-1,2,Tsutsui-cho,Chuo-ku,Kobe 651-0071,Japan Key words;
DYNAMICS OF INTER-FACIAL CRACK FRONT PROPAGATION. Fysisk Institutt, Universitetet i Oslo, P. O. Boks 1048 Blindern, N-0316 Oslo 3, Norway
 ORAL REFERENCE: ICF100833OR DYNAMICS OF INTER-FACIAL CRACK FRONT PROPAGATION Knut Jfirgen Mνalfiy 1, Jean Schmittbuhl 2, Arnaud Delaplace 3, and Jose Javier Ramasco 1;4 1 Fysisk Institutt, Universitetet
Dynamic Analysis Contents - 1
 Dynamic Analysis Contents - 1 TABLE OF CONTENTS 1 DYNAMIC ANALYSIS 1.1 Overview... 1-1 1.2 Relation to Equivalent-Linear Methods... 1-2 1.2.1 Characteristics of the Equivalent-Linear Method... 1-2 1.2.2
7.2.1 Seismic waves. Waves in a mass- spring system
 7..1 Seismic waves Waves in a mass- spring system Acoustic waves in a liquid or gas Seismic waves in a solid Surface waves Wavefronts, rays and geometrical attenuation Amplitude and energy Waves in a mass-
WINTER 16 EXAMINATION
 Model ject Code: Important Instructions to examiners: ) The answers should be examined by key words and not as word-to-word as given in the model answer scheme. ) The model answer and the answer written
STRONG CONFIGURATIONAL DEPENDENCE OF ELASTIC PROPERTIES OF A CU-ZR BINARY MODEL METALLIC GLASS
 Chapter 3 STRONG CONFIGURATIONAL DEPENDENCE OF ELASTIC PROPERTIES OF A CU-ZR BINARY MODEL METALLIC GLASS We report the strong dependence of elastic properties on configurational changes in a Cu-Zr binary
ACOUSTIC EMISSION SOURCE DETECTION USING THE TIME REVERSAL PRINCIPLE ON DISPERSIVE WAVES IN BEAMS
 ACOUSTIC EMISSION SOURCE DETECTION USING THE TIME REVERSAL PRINCIPLE ON DISPERSIVE WAVES IN BEAMS ERNST ROBERT 1,DUAL JURG 1 1 Institute of Mechanical Systems, Swiss Federal Institute of Technology, ETH
Soil Behaviour in Earthquake Geotechnics
 Soil Behaviour in Earthquake Geotechnics KENJI ISHIHARA Department of Civil Engineering Science University of Tokyo This publication was supported by a generous donation from the Daido Life Foundation
Two-dimensional ternary locally resonant phononic crystals with a comblike coating
 Two-dimensional ternary locally resonant phononic crystals with a comblike coating Yan-Feng Wang, Yue-Sheng Wang,*, and Litian Wang Institute of Engineering Mechanics, Beijing Jiaotong University, Beijing,
On the study of elastic wave scattering and Rayleigh wave velocity measurement of concrete with steel bar
 NDT&E International 33 (2000) 401 407 www.elsevier.com/locate/ndteint On the study of elastic wave scattering and Rayleigh wave velocity measurement of concrete with steel bar T.-T. Wu*, J.-H. Sun, J.-H.
Theory at a Glance (for IES, GATE, PSU)
") 1. Stress and Strain Theory at a Glance (for IES, GATE, PSU) 1.1 Stress () When a material is subjected to an external force, a resisting force is set up within the component. The internal resistance force
1. Stress and Strain Theory at a Glance (for IES, GATE, PSU) 1.1 Stress () When a material is subjected to an external force, a resisting force is set up within the component. The internal resistance force
Supplementary Figures
 Fracture Strength (GPa) Supplementary Figures a b 10 R=0.88 mm 1 0.1 Gordon et al Zhu et al Tang et al im et al 5 7 6 4 This work 5 50 500 Si Nanowire Diameter (nm) Supplementary Figure 1: (a) TEM image
Intensity (a.u.) Intensity (a.u.) Raman Shift (cm -1 ) Oxygen plasma. 6 cm. 9 cm. 1mm. Single-layer graphene sheet. 10mm. 14 cm
 Intensity (a.u.) Raman Shift (cm -1 ) Oxygen plasma. 6 cm. 9 cm. 1mm. Single-layer graphene sheet. 10mm. 14 cm") Intensity (a.u.) Intensity (a.u.) a Oxygen plasma b 6 cm 1mm 10mm Single-layer graphene sheet 14 cm 9 cm Flipped Si/SiO 2 Patterned chip Plasma-cleaned glass slides c d After 1 sec normal Oxygen plasma
Intensity (a.u.) Intensity (a.u.) a Oxygen plasma b 6 cm 1mm 10mm Single-layer graphene sheet 14 cm 9 cm Flipped Si/SiO 2 Patterned chip Plasma-cleaned glass slides c d After 1 sec normal Oxygen plasma
Elastic and Inelastic Shock Compression of Diamond and Other Minerals. Ryan Stewart McWilliams. B.S. (University of Massachusetts, Amherst) 2001
 2001") Elastic and Inelastic Shock Compression of Diamond and Other Minerals by Ryan Stewart McWilliams B.S. (University of Massachusetts, Amherst) A dissertation submitted in partial satisfaction of the requirements
Elastic and Inelastic Shock Compression of Diamond and Other Minerals by Ryan Stewart McWilliams B.S. (University of Massachusetts, Amherst) A dissertation submitted in partial satisfaction of the requirements
Supporting Information
 Electronic Supplementary Material (ESI) for Nanoscale. This journal is The Royal Society of Chemistry 2015 Supporting Information Single Layer Lead Iodide: Computational Exploration of Structural, Electronic
NDT&E Methods: UT. VJ Technologies CAVITY INSPECTION. Nondestructive Testing & Evaluation TPU Lecture Course 2015/16.
 CAVITY INSPECTION NDT&E Methods: UT VJ Technologies NDT&E Methods: UT 6. NDT&E: Introduction to Methods 6.1. Ultrasonic Testing: Basics of Elasto-Dynamics 6.2. Principles of Measurement 6.3. The Pulse-Echo
COMPARISON OF OPTICAL AND ELASTIC BREWSTER S ANGLES TO PROVIDE INVUITIVE INSIGHT INTO PROPAGATION OF P- AND S-WAVES. Robert H.
 COMPARISON OF OPTICAL AND ELASTIC BREWSTER S ANGLES TO PROVIDE INVUITIVE INSIGHT INTO PROPAGATION OF P- AND S-WAVES Robert H. Tatham Department of Geological Sciences The University of Texas at Austin
Horizontally Mounted Bender Elements for Measuring Shear Modulus in Soaked Sand Specimen
 Advanced Materials Research Vols. 931-932 (2014) pp 496-500 (2014) Trans Tech Publications, Switzerland doi:10.4028/www.scientific.net/amr.931-932.496 Horizontally Mounted Bender Elements for Measuring
Characterization of discretely graded materials using acoustic wave propagation
 Computational Materials Science 37 (006) 0 8 www.elsevier.com/locate/commatsci Characterization of discretely graded materials using acoustic wave propagation Ritesh Samadhiya a, Abhijit Mukherjee a, *,
LECTURE 5 - Wave Equation Hrvoje Tkalčić " 2 # & 2 #
 LECTURE 5 - Wave Equation Hrvoje Tkalčić " 2 # "t = ( $ + 2µ ) & 2 # 2 % " 2 (& ' u r ) = µ "t 2 % & 2 (& ' u r ) *** N.B. The material presented in these lectures is from the principal textbooks, other
6.730 Physics for Solid State Applications
 6.730 Physics for Solid State Applications Lecture 29: Electron-phonon Scattering Outline Bloch Electron Scattering Deformation Potential Scattering LCAO Estimation of Deformation Potential Matrix Element
Strain Measurement. Prof. Yu Qiao. Department of Structural Engineering, UCSD. Strain Measurement
 Strain Measurement Prof. Yu Qiao Department of Structural Engineering, UCSD Strain Measurement The design of load-carrying components for machines and structures requires information about the distribution
Post Graduate Diploma in Mechanical Engineering Computational mechanics using finite element method
 9210-220 Post Graduate Diploma in Mechanical Engineering Computational mechanics using finite element method You should have the following for this examination one answer book scientific calculator No
Phononic Crystals. J.H. Page
 Phononic Crystals J.H. Page University of Manitoba with Suxia Yang and M.L. Cowan at U of M, Ping Sheng and C.T. Chan at HKUST, & Zhengyou Liu at Wuhan University. We study ultrasonic waves in complex
Numerical analysis of ultrasonic guided waves propagation in highly. attenuative viscoelastic material. Li Hong, Wang Qingfeng
 Proceedings of the 8th International Conference on Sensing Technology, Sep. -4, 4, Liverpool, UK Numerical analysis of ultrasonic guided waves propagation in highly attenuative viscoelastic material Li
DETERMINING THE STRESS PATTERN IN THE HH RAILROAD TIES DUE TO DYNAMIC LOADS 1
 PERIODICA POLYTECHNICA SER. CIV. ENG. VOL. 46, NO. 1, PP. 125 148 (2002) DETERMINING THE STRESS PATTERN IN THE HH RAILROAD TIES DUE TO DYNAMIC LOADS 1 Nándor LIEGNER Department of Highway and Railway Engineering
Effect of interfacial dislocations on ferroelectric phase stability and domain morphology in a thin film a phase-field model
 JOURNAL OF APPLIED PHYSICS VOLUME 94, NUMBER 4 15 AUGUST 2003 Effect of interfacial dislocations on ferroelectric phase stability and domain morphology in a thin film a phase-field model S. Y. Hu, Y. L.
Cornu s method for the determination of elastic constants of a Perspex beam Surjeet Singh
 Cornu s method for the determination of elastic constants of a Perspex beam Surjeet Singh Indian Institute of Science Education and Research Pune surjeet.singh@iiserpune.ac.in Objective: Using Cornu s
ULTRASONIC INSPECTION, MATERIAL NOISE AND. Mehmet Bilgen and James H. Center for NDE Iowa State University Ames, IA 50011
 ULTRASONIC INSPECTION, MATERIAL NOISE AND SURFACE ROUGHNESS Mehmet Bilgen and James H. Center for NDE Iowa State University Ames, IA 511 Rose Peter B. Nagy Department of Welding Engineering Ohio State
13th International Symposium on Nondestructive Characterization of Materials (NDCM-XIII), May 2013, Le Mans, France
, May 2013, Le Mans, France") 3th International Symposium on Nondestructive Characterization of Materials (NDCM-XIII), 2-24 May 23, Le Mans, France www.ndt.net/?id=5532 Biot waves in porous ceramic plates : influence of boundary conditions
3th International Symposium on Nondestructive Characterization of Materials (NDCM-XIII), 2-24 May 23, Le Mans, France www.ndt.net/?id=5532 Biot waves in porous ceramic plates : influence of boundary conditions
Supplementary Information. Text S1:
 Supplementary Information Text S1: In order to characterize the change in visco-elastic response in the course of a shear thickening transition in a controlled shear stress flow, on a fresh sample of for
Measurements of Strain-Induced Refractive-Index Changes in LiF Using Direct-Drive Ramp Compression
 Measurements of Strain-Induced Refractive-Index Changes in LiF Using Direct-Drive Ramp Compression Apparent particle velocity (nm/ns) 16 12 8 4 1 GPa 8 GPa 2 4 6 8 1 12 14 True particle velocity (nm/ns)
Study of thermal effects on stress wave propagation in polymeric material of plate-like shape
 Study of thermal effects on stress wave propagation in polymeric material of plate-like shape 39 Study of thermal effects on stress wave propagation in polymeric material of plate-like shape R. Hayasi(
Module 3 : Equilibrium of rods and plates Lecture 15 : Torsion of rods. The Lecture Contains: Torsion of Rods. Torsional Energy
 The Lecture Contains: Torsion of Rods Torsional Energy This lecture is adopted from the following book 1. Theory of Elasticity, 3 rd edition by Landau and Lifshitz. Course of Theoretical Physics, vol-7
EQUATION OF STATE FOR MODELING THE DETONATION REACTION ZONE
 EQUATION OF STATE FOR MODELING THE DETONATION REACTION ZONE D. Scott Stewart and Sunhee Yoo Department of Theoretical and Applied Mechanics University of Illinois, Urbana, IL 61801, USA William C. Davis
LECTURE NO. 4-5 INTRODUCTION ULTRASONIC * PULSE VELOCITY METHODS
 LECTURE NO. 4-5 ULTRASONIC * PULSE VELOCITY METHODS Objectives: To introduce the UPV methods To briefly explain the theory of pulse propagation through concrete To explain equipments, procedures, calibrations,
Lamb Wave Behavior in Bridge Girder Geometries
 Lamb Wave Behavior in Bridge Girder Geometries I. J. Oppenheim a*, D. W. Greve b, N. L. Tyson a a Dept. of Civil and Environmental Engineering, Carnegie Mellon University, Pittsburgh, PA 15213 b Dept.