Basic Error Analysis. Physics 401 Spring 2015 Eugene V Colla
|
|
|
- Bethanie Collins
- 5 years ago
- Views:
Transcription


1 Basic Error Analysis Physics 401 Spring 2015 Eugene V Colla


2 Errors and uncertainties The Reading Error Accuracy and precession Systematic and statistical errors Fitting errors Appendix. Working with oil drop data physics 401 2


3 T = 63 ±? Best guess T~0. 5 Wind speed 4mph±? Best guess ±0. 5mph physics 401 3


4 Clearance fit physics 401 4

5 Measurement of the speed of the light 1675 Ole Roemer: 220,000 Km/sec Does it make sense? What is missing? Ole Christensen Rømer NIST Bolder Colorado c = 299,792,456.2±1.1 m/s. physics 401 5


6 L 0. 5mm L=53mm±ΔL(?) Acrylic rod L 0. 03mm How far we have to go in reducing the reading error? We do not care about accuracy better than 1mm If ruler is not okay, we need to use digital caliper Probably the natural limit of accuracy can be due to length uncertainty because of temperature expansion. For 53mm L mm/K Reading Error = ± 1 2 (least count or minimum gradation). physics 401 6


7 Fluke 8845A multimeter Example Vdc (reading)=0.85v V = = 22μV physics 401 7


8 The accuracy of an experiment is a measure of how close the result of the experiment comes to the true value Precision refers to how closely individual measurements agree with each other physics 401 8

9 physics 401 9
10 Systematic Error: reproducible inaccuracy introduced by faulty equipment, calibration or technique. Random errors: Indefiniteness of results due to finite precision of experiment. Measure of fluctuation in result after repeatable experimentation. Philip R. Bevington Data Reduction and Error Analysis for the Physical sciences, McGraw-Hill, 1969 physics
11 Sources of systematic errors: poor calibration of the equipment, changes of environmental conditions, imperfect method of observation, drift and some offset in readings etc. Example #1: measuring of the DC voltage R in Current source I R U E off E off =f(time,temperature) expectation U=R*I U = actual result R I R R in 1 + R E off physics 401 R in 11


12 Example #3: poor calibration Measuring of the speed of the second sound in superfluid He4 20 Published data T l =2.17K 15 LHe Resonator U 2 (m/s) 10 P403 results T l =2.1K 10mA 5 HP34401A DMM T (K) Temperature sensor physics

13 Result of measurement Systematic error X meas = X true + e s + e r Correct value Random error 0.35 B 0.35 e s B e s = P 0.15 P X true X i X X i true physics
![) rt ) rt Pn t e n n! n 0,1,2,... r: decay rate [counts/s] t: time interval [s] P n (rt) : Probability to have n decays in time interval t Siméon Denis Poisson (1781-1840) P 0.3 0.2 0.1 0.](/docs-images/84/89099503/images/14-1.jpg "0 rt=1 rt=4 rt=10 0 5 10 15 20 number of counts A statistical process is described through a Poisson Distribution if: o random process for a given nucleus probability for a decay to occur is the same")
14 ) rt ) rt Pn t e n n! n 0,1,2,... r: decay rate [counts/s] t: time interval [s] P n (rt) : Probability to have n decays in time interval t Siméon Denis Poisson ( ) P rt=1 rt=4 rt= number of counts A statistical process is described through a Poisson Distribution if: o random process for a given nucleus probability for a decay to occur is the same in each time interval. o universal probability the probability to decay in a given time interval is same for all nuclei. o no correlation between two instances (the decay of on nucleus does not change the probability for a second nucleus to decay. physics
15 ) rt ) rt Pn t e n n! n 0,1,2,... r: decay rate [counts/s] t: time interval [s] P n (rt) : Probability to have n decays in time interval t Properties of the Poisson distribution: rt=10 < n >= rt σ = rt n n0 P ( rt) 1, probabilities sum to 1 P 0.1 n n P ( rt) rt, the mean n0 n number of counts ( ) 2 n n P ( ), n0 n rt rt standard deviation physics
 number of counts 1 Pn ( x) e 2 ( xx) 2 2 2 Gaussian")
16 ) rt ) rt Pn t e n n! n 0,1,2,... Poisson and Gaussian distributions 0.1 probability of occurence "Poisson distribution" "Gaussian distribution" Carl Friedrich Gauss ( ) number of counts 1 Pn ( x) e 2 ( xx) Gaussian distribution: continuous physics

17 2 x 1 Pn ( x) e 2 ( xx) Error in the mean is given as σ N physics


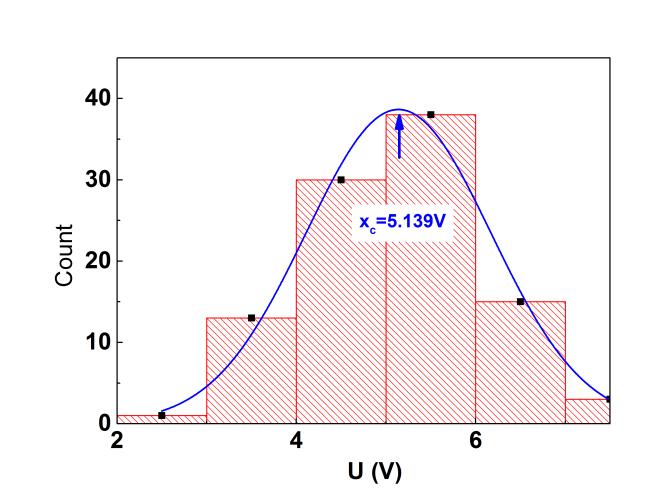
18 Source of noisy signal Expected value 5V Actual measured values physics

19
20 Result U x c N - standard deviation N number of samples For N=10 6 U=4.999± % accuracy
21 Ag b decay Model 108 Ag t 1/2 =157s 110 Ag t 1/2 =24.6s ExpDec2 Equation y = A1*exp(-x/t1) + A2*exp(-x/t2) + y0 Residuals 0 Count Reduced Chi-Sqr Adj. R-Square Value Standard Error C y C A C t C A C t time (s) time (s) Count 20 Model Gauss Equation y=y0 + (A/(w*sq rt(pi/2)))*exp(-2 *((x-xc)/w)^2) Reduced Chi-S qr Adj. R-Square Value Standard Error Counts y Counts xc Counts w Counts A Counts sigma Counts FWHM Counts Height t t y A1 exp A2 exp y t t Residuals physics
22 40 Ag b decay Test 1. Fourier analysis 20 Residuals time (s) Count 20 Model Gauss Equation y=y0 + (A/(w*sq rt(pi/2)))*exp(-2 *((x-xc)/w)^2) Reduced Chi-S qr Adj. R-Square Value Standard Error Counts y Counts xc Counts w Counts A Counts sigma Counts FWHM Counts Height No pronounced frequencies found Residuals physics
23 40 20 Ag b decay Test 1. Autocorrelation function Residuals time (s) Count 20 Model Gauss Equation y=y0 + (A/(w*sq rt(pi/2)))*exp(-2 *((x-xc)/w)^2) Reduced Chi-S qr Adj. R-Square Value Standard Error Counts y Counts xc Counts w Counts A Counts sigma Counts FWHM Counts Height Correlation function M 1 y( m) f ( n) g( n m) n Residuals autocorrelation function M 1 y( m) f ( n) f ( n m) n0 physics
24 Ag b decay Clear experiment Data + noise t 1 (s) t 2 (s) physics

25 Ag b decay Histogram does not follow the normal distribution and there is frequency of is present in spectrum physics
26 Ag b decay Autocorrelation function Conclusion: fitting function should be modified by adding an additional term: t t y( t) y A exp A exp A3 sin( t ) t t physics
27 FFT autocorrelation Clear experiment Data + noise Modified fitting t 1 (s) t 2 (s) physics
28 y = f(x1, x2... xn) 2 n f 2 i i i i1 xi f ( x, x ) x 1.15 f(x i ) f±fx 1.10 x i ± x i x i physics
29 Derive resonance frequency f from measured inductance L± L and capacitance C± C L 1 1 f ( L, C) 2 LC 10 1mH, C 10 2μF f f f ( L, C, L, C) L C L C 2 2 f L f C 1 C L 1 L C ; Results: f(l 1,C 1 )= Hz f= hz f(l 1,C 1 )=503.3±56.3Hz physics
30 time In general we could expect both components of errors Q meas = Q true + e s + e r e s - systematic error comes from uncertainties of plates separation distance, applied DC voltage, ambient temperature etc. V =V DC ±V, d=d 0 ±d e r - random errors are related to uncertainty of the knowledge of the actual t g and t rise. Uncertainty of time of crossing the marker line. It is random. physics
31 d 2 x Q F S T 32 fc V g t t g g t rise ) ) ) Q S T F F T S F S T T t t g g t rise T t t t t t t t g rise g g rise g rise physics

32 Step 1. Collect your data + parameters of the experiment in: \\Phyaplportal\PHYCS401\Common\Origin templates\oil drop experiment\section L1.opj Use different columns for each student or team. This Origin project is for data collecting only but not for data analysis. For data analysis you have to copy these data and experiment parameters obtained by different students/team and paste it in one in your personal Origin project. Setup and environmental parameters physics 401 Raw data 32

.")
33 Step 2. Working on personal Origin project Make a copy of the Millikan1 project to your personal folder and open it Prepare equations calculations of data in next columns (Set column values ). Switch Recalculate in Auto mode Paste these 5 parameters and raw data from Section L1-L4.opj projects Calculate manually the actual air viscosity physics

34 Millikan oil drop experiment Step 3. Histogram graph First use the data from the column with drop charges and plot the histogram physics

35 Step 4. Histogram. Bin size Millikan oil drop experiment Origin will automatically but not optimally adjust the bin size h. In tis page figure h=0.5. There are several theoretical approaches how to find the optimal bin size. 3. 5σ h = n 1/3 Is the sample standard deviation and n is total number of observation. For presented in Fig.1 results good value of h ~0.1 physics


36 Step 4. Histogram. Bin size Millikan oil drop experiment To change the bin size click on graph and unplug the Automatic Binning option Bin size in this histogram is 0.1 physics

37 Step 4. Multipeak Gaussian fitting Millikan oil drop experiment To do this you have to add an extra plot to the graph Counts vs. Bin Center physics

38 Step 4. Multipeak Gaussian fitting Millikan oil drop experiment This plot can be used for peak fitting. physics

39 Step 4. Multipeak Gaussian fitting Millikan oil drop experiment This plot can be used for peak fitting. Final result for first two peaks: Q/e=0.93±0.01 Q/e=1.87±0.02 This pretty close to e and 2e Here w = 2 and error of the mean = σ N physics
Basic Error Analysis. Physics 401 Fall 2017 Eugene V Colla
 Basic Error Analysis Physics 401 Fall 2017 Eugene V Colla Errors and uncertainties The Reading Error Accuracy and precession Systematic and statistical errors Fitting errors Appendix. Working with oil
Basic Error Analysis. Physics 401 Fall 2018 Eugene V Colla
 Basic Error Analysis Physics 401 Fall 2018 Eugene V Colla Errors and uncertainties The Reading Error Accuracy and precession Systematic and statistical errors Fitting errors Appendix. Working with oil
Physics 401. Fall 2018 Eugene V. Colla. 10/8/2018 Physics 401 1
 Physics 41. Fall 18 Eugene V. Colla 1/8/18 Physics 41 1 Electrical RLC circuits Torsional Oscillator Damping Data Analysis 1/8/18 Physics 41 V R +V L +V C =V(t) If V(t)= R d d q(t) q(t) dt dt C C L q(t)
Physics 401. Fall 2017 Eugene V. Colla. 10/9/2017 Physics 401 1
 Physics 41. Fall 17 Eugene V. Colla 1/9/17 Physics 41 1 Electrical RLC circuits Torsional Oscillator Damping Data Analysis 1/9/17 Physics 41 V R +V L +V C =V(t) If V(t)= R d d q(t) q(t) dt dt C C L q(t)
; F- Faraday constant, N A - Avagadro constant. Best. uncertainty ~1.6 ppm. 4. From Josephson (K J = 2e. constants. ) and von Klitzing R h
 and von Klitzing R h") 1. Measuring of the charge of electron. 2. Robert Millikan and his oil drop experiment 3. Theory of the experiment 4. Laboratory setup 5. Data analysis 2/15/2016 2 1. Oil drop experiment. Robert A. Millikan..
1. Measuring of the charge of electron. 2. Robert Millikan and his oil drop experiment 3. Theory of the experiment 4. Laboratory setup 5. Data analysis 2/15/2016 2 1. Oil drop experiment. Robert A. Millikan..
Physics 401, Spring 2016 Eugene V. Colla
 Physics 41, Spring 16 Eugene V. Colla.8 (rad). -.8 1 3 4 5 6 7 8 time (s) 1.Driven torsional oscillator. Equations.Setup. Kinematics 3.Resonance 4.Beats 5.Nonlinear effects 6.Comments 3/7/16 3/7/16 3 Tacoma
; F- Faraday constant, N A - Avagadro constant. Best. uncertainty ~1.6 ppm. 4. From Josephson (K J = 2e. constants. ) and von Klitzing R h
 and von Klitzing R h") 1. Measuring of the charge of electron. 2. Robert Millikan and his oil drop experiment 3. Theory of the experiment 4. Laboratory setup 5. Data analysis 9/25/2017 2 1. Oil drop experiment. Robert A. Millikan..
1. Measuring of the charge of electron. 2. Robert Millikan and his oil drop experiment 3. Theory of the experiment 4. Laboratory setup 5. Data analysis 9/25/2017 2 1. Oil drop experiment. Robert A. Millikan..
BRIDGE CIRCUITS EXPERIMENT 5: DC AND AC BRIDGE CIRCUITS 10/2/13
 EXPERIMENT 5: DC AND AC BRIDGE CIRCUITS 0//3 This experiment demonstrates the use of the Wheatstone Bridge for precise resistance measurements and the use of error propagation to determine the uncertainty
Pulses in transmission lines
 Pulses in transmission lines Physics 401, Fall 013 Eugene V. Colla Definition Distributed parameters networ Pulses in transmission line Wave equation and wave propagation eflections. esistive load Thévenin's
Pulses in transmission lines
 Pulses in transmission lines Physics 401, Fall 2018 Eugene V. Colla Definition Distributed parameters network Pulses in transmission line Wave equation and wave propagation Reflections. Resistive load
Error? Relative error = Theory: g = 9.8 m/sec 2 Measured: g = 9.7 m/sec 2
 Error? Theory: g = 9.8 m/sec 2 Measured: g = 9.7 m/sec 2 Relative error = Measurement Error? (how well do you know your measurement of g = 9.7 m/sec 2. Do you know it exactly 9.7 m/sec 2? ) 3 Accuracy
Application Note AN37. Noise Histogram Analysis. by John Lis
 AN37 Application Note Noise Histogram Analysis by John Lis NOISELESS, IDEAL CONVERTER OFFSET ERROR σ RMS NOISE HISTOGRAM OF SAMPLES PROBABILITY DISTRIBUTION FUNCTION X PEAK-TO-PEAK NOISE Crystal Semiconductor
Some Statistics. V. Lindberg. May 16, 2007
 Some Statistics V. Lindberg May 16, 2007 1 Go here for full details An excellent reference written by physicists with sample programs available is Data Reduction and Error Analysis for the Physical Sciences,
Topic 1.2 Measurement and Uncertainties Uncertainty and error in measurement. Random Errors
 Uncertainty and error in measurement Random Errors Definition of Random Error Random errors are sources of uncertainties in the measurement, whose effect can be reduced by a repeated experiment, and taking
Fundamentals of data, graphical, and error analysis
 Fundamentals of data, graphical, and error analysis. Data measurement and Significant Figures UTC - Physics 030L/040L Whenever we take a measurement, there are limitations to the data and how well we can
Experiment P43: RC Circuit (Power Amplifier, Voltage Sensor)
") PASCO scientific Vol. 2 Physics Lab Manual: P43-1 Experiment P43: (Power Amplifier, Voltage Sensor) Concept Time SW Interface Macintosh file Windows file circuits 30 m 700 P43 P43_RCCI.SWS EQUIPMENT NEEDED
PASCO scientific Vol. 2 Physics Lab Manual: P43-1 Experiment P43: (Power Amplifier, Voltage Sensor) Concept Time SW Interface Macintosh file Windows file circuits 30 m 700 P43 P43_RCCI.SWS EQUIPMENT NEEDED
Uncertainty in Measurements
 Uncertainty in Measurements Joshua Russell January 4, 010 1 Introduction Error analysis is an important part of laboratory work and research in general. We will be using probability density functions PDF)
The Treatment of Numerical Experimental Results
 Memorial University of Newfoundl Department of Physics Physical Oceanography The Treatment of Numerical Experimental Results The purpose of these notes is to introduce you to some techniques of error analysis
Coupled Electrical Oscillators Physics Advanced Physics Lab - Summer 2018 Don Heiman, Northeastern University, 5/24/2018
 Coupled Electrical Oscillators Physics 3600 - Advanced Physics Lab - Summer 08 Don Heiman, Northeastern University, 5/4/08 I. INTRODUCTION The objectives of this experiment are: () explore the properties
PARADISE VALLEY COMMUNITY COLLEGE PHYSICS COLLEGE PHYSICS I LABORATORY
 PARADISE VALLEY COMMUNITY COLLEGE PHYSICS 111 - COLLEGE PHYSICS I LABORATORY PURPOSE OF THE LABORATORY: The laboratory exercises are designed to accomplish two objectives. First, the exercises will illustrate
Uncertainty in Physical Measurements: Module 5 Data with Two Variables
 : Often data have two variables, such as the magnitude of the force F exerted on an object and the object s acceleration a. In this Module we will examine some ways to determine how one of the variables,
To investigate further the series LCR circuit, especially around the point of minimum impedance. 1 Electricity & Electronics Constructor EEC470
 Series esonance OBJECTIE To investigate further the series LC circuit, especially around the point of minimum impedance. EQUIPMENT EQUIED Qty Apparatus Electricity & Electronics Constructor EEC470 Basic
Introduction to Statistics and Error Analysis
 Introduction to Statistics and Error Analysis Physics116C, 4/3/06 D. Pellett References: Data Reduction and Error Analysis for the Physical Sciences by Bevington and Robinson Particle Data Group notes
MASSACHUSETTS INSTITUTE OF TECHNOLOGY PHYSICS DEPARTMENT
 G. Clark 7oct96 1 MASSACHUSETTS INSTITUTE OF TECHNOLOGY PHYSICS DEPARTMENT 8.13/8.14 Junior Laboratory STATISTICS AND ERROR ESTIMATION The purpose of this note is to explain the application of statistics
Notes Errors and Noise PHYS 3600, Northeastern University, Don Heiman, 6/9/ Accuracy versus Precision. 2. Errors
 Notes Errors and Noise PHYS 3600, Northeastern University, Don Heiman, 6/9/2011 1. Accuracy versus Precision 1.1 Precision how exact is a measurement, or how fine is the scale (# of significant figures).
Experimental Competition May 7, :30-13:30 hours Marking Scheme
 page 1 of 17 Experimental Competition May 7, 015 08:30-13:30 hours Marking Scheme page of 17 Experiment A A.1 Choose a PZT plate and use the Vernier caliper to measure its length l, width w, and thickness
RLC Circuits. 1 Introduction. 1.1 Undriven Systems. 1.2 Driven Systems
 RLC Circuits Equipment: Capstone, 850 interface, RLC circuit board, 4 leads (91 cm), 3 voltage sensors, Fluke mulitmeter, and BNC connector on one end and banana plugs on the other Reading: Review AC circuits
Junior Laboratory. PHYC 307L, Spring Webpage:
 Lectures: Mondays, 13:00-13:50 am, P&A room 184 Lab Sessions: Room 133 Junior Laboratory PHYC 307L, Spring 2016 Webpage: http://physics.unm.edu/courses/becerra/phys307lsp16/ Monday 14:00-16:50 (Group 1)
Radioactivity: Experimental Uncertainty
 Lab 5 Radioactivity: Experimental Uncertainty In this lab you will learn about statistical distributions of random processes such as radioactive counts. You will also further analyze the gamma-ray absorption
EE 242 EXPERIMENT 8: CHARACTERISTIC OF PARALLEL RLC CIRCUIT BY USING PULSE EXCITATION 1
 EE 242 EXPERIMENT 8: CHARACTERISTIC OF PARALLEL RLC CIRCUIT BY USING PULSE EXCITATION 1 PURPOSE: To experimentally study the behavior of a parallel RLC circuit by using pulse excitation and to verify that
by A.Tonina*, R.Iuzzolino*, M.Bierzychudek* and M.Real* S. Solve + R. Chayramy + and M. Stock +
 Bilateral Comparison of 1.018 V and 10 V Standards between the INTI (Argentina) and the BIPM, August to October 2009 (part of the ongoing BIPM key comparison BIPM.EM-K11.a and b) by A.Tonina*, R.Iuzzolino*,
LAB 3: Capacitors & RC Circuits
 LAB 3: Capacitors & C Circuits Name: Circuits Experiment Board Wire leads Capacitors, esistors EQUIPMENT NEEDED: Two D-cell Batteries Multimeter Logger Pro Software, ULI Purpose The purpose of this lab
Probability & Statistics: Introduction. Robert Leishman Mark Colton ME 363 Spring 2011
 Probability & Statistics: Introduction Robert Leishman Mark Colton ME 363 Spring 2011 Why do we care? Why do we care about probability and statistics in an instrumentation class? Example Measure the strength
Lab 10: DC RC circuits
 Name: Lab 10: DC RC circuits Group Members: Date: TA s Name: Objectives: 1. To understand current and voltage characteristics of a DC RC circuit 2. To understand the effect of the RC time constant Apparatus:
Uncertainty in Physical Measurements: Module 5 Data with Two Variables
 : Module 5 Data with Two Variables Often data have two variables, such as the magnitude of the force F exerted on an object and the object s acceleration a. In this Module we will examine some ways to
SUPPLEMENTARY INFORMATION
 Systematic shift caused by trap asymmetry The major systematic correction in the reported cyclotron frequency ratio comparison of an antiproton at ν c, p and a negatively charged hydrogen ion (H ) at ν
by S. Solve +, R. Chayramy +, M. Stock +, D. Vlad*
 Bilateral Comparison of 1 V and 10 V Standards between the SMD (Belgium) and the BIPM, October to November 2014 (part of the ongoing BIPM key comparison BIPM.EM-K11.a and b) by S. Solve +, R. Chayramy
Magnetic Fields. Experiment 1. Magnetic Field of a Straight Current-Carrying Conductor
 General Physics Lab Department of PHYSICS YONSEI University Lab Manual (Lite) Magnetic Fields Ver.20181029 NOTICE This LITE version of manual includes only experimental procedures for easier reading on
Hall Coefficient of Germanium
 Sridhar Chandramouli 1 Hall Coefficient of Germanium Physics Department, The College of Wooster, Wooster, Ohio 691 April 9, 1999 This experiment experimentally measures the Hall coefficient of a Germanium
EIE 240 Electrical and Electronic Measurements Class 2: January 16, 2015 Werapon Chiracharit. Measurement
 EIE 240 Electrical and Electronic Measurements Class 2: January 16, 2015 Werapon Chiracharit Measurement Measurement is to determine the value or size of some quantity, e.g. a voltage or a current. Analogue
Elementary charge and Millikan experiment Students worksheet
 Tasks This experiment deals with the observation of charged oil droplets, which are accelerated between two capacitor plates.. Measure some rise and fall times of oil droplets at different voltages. Determine
Introduction to Error Analysis
 Introduction to Error Analysis Part 1: the Basics Andrei Gritsan based on lectures by Petar Maksimović February 1, 2010 Overview Definitions Reporting results and rounding Accuracy vs precision systematic
MASSACHUSETTS INSTITUTE OF TECHNOLOGY Department of Physics 8.02 Spring 2003 Experiment 17: RLC Circuit (modified 4/15/2003) OBJECTIVES
 OBJECTIVES") MASSACHUSETTS INSTITUTE OF TECHNOLOGY Department of Physics 8. Spring 3 Experiment 7: R Circuit (modified 4/5/3) OBJECTIVES. To observe electrical oscillations, measure their frequencies, and verify energy
MASSACHUSETTS INSTITUTE OF TECHNOLOGY Department of Physics 8. Spring 3 Experiment 7: R Circuit (modified 4/5/3) OBJECTIVES. To observe electrical oscillations, measure their frequencies, and verify energy
Protean Instrument Dutchtown Road, Knoxville, TN TEL/FAX:
 Application Note AN-0210-1 Tracking Instrument Behavior A frequently asked question is How can I be sure that my instrument is performing normally? Before we can answer this question, we must define what
Counting Statistics and Error Propagation!
 Counting Statistics and Error Propagation Nuclear Medicine Physics Lectures 10/4/11 Lawrence MacDonald, PhD macdon@uw.edu Imaging Research Laboratory, Radiology Dept. 1 Statistics Type of analysis which
Properties of Capacitors and its DC Behavior
 LABORATORY Experiment 2 Properties of Capacitors and its DC Behavior 1. Objectives To investigate the /V characteristics of capacitor. To calculate the equivalent capacitance of capacitors connected in
Error Analysis. V. Lorenz L. Yang, M. Grosse Perdekamp, D. Hertzog, R. Clegg PHYS403 Spring 2016
 Error Analysis V. Lorenz L. Yang, M. Grosse Perdekamp, D. Hertzog, R. Clegg PHYS403 Spring 2016 Reporting measurement results Always include uncertainty estimates in your results Have the correct number
EXPERIMENT 2 Reaction Time Objectives Theory
 EXPERIMENT Reaction Time Objectives to make a series of measurements of your reaction time to make a histogram, or distribution curve, of your measured reaction times to calculate the "average" or mean
Computer 3. Lifetime Measurement
 Lifetime Measurement Computer 3 The activity (in decays per second) of some radioactive samples varies in time in a particularly simple way. If the activity (R) in decays per second of a sample is proportional
Modern Experimental Physics Introduction for Physics 401 students. Eugene V. Colla
 Modern Experimental Physics Introduction for Physics 401 students Eugene V. Colla Outline Goals of the course Experiments Teamwork Schedule and assignments Your working mode 3/26/2012 2 Physics 403. The
AC Circuits Homework Set
 Problem 1. In an oscillating LC circuit in which C=4.0 μf, the maximum potential difference across the capacitor during the oscillations is 1.50 V and the maximum current through the inductor is 50.0 ma.
ECE-340, Spring 2015 Review Questions
 ECE-340, Spring 2015 Review Questions 1. Suppose that there are two categories of eggs: large eggs and small eggs, occurring with probabilities 0.7 and 0.3, respectively. For a large egg, the probabilities
dn(t) dt where λ is the constant decay probability per unit time. The solution is N(t) = N 0 exp( λt)
 dt where λ is the constant decay probability per unit time. The solution is N(t) = N 0 exp( λt)") (Aug. 2011 revision) Physics 307 Laboratory Experiment #3 Probability Distributions and the Decay of Excited Quantum States Motivation: The purpose of this experiment is to introduce the student to counting
(Aug. 2011 revision) Physics 307 Laboratory Experiment #3 Probability Distributions and the Decay of Excited Quantum States Motivation: The purpose of this experiment is to introduce the student to counting
POWER QUALITY MEASUREMENT PROCEDURE. Version 4 October Power-Quality-Oct-2009-Version-4.doc Page 1 / 12
 POWER QUALITY MEASUREMENT PROCEDURE Version 4 October 2009 Power-Quality-Oct-2009-Version-4.doc Page 1 / 12 MEASNET 2009 Copyright all rights reserved This publication may not be reproduced or utilized
Data Analysis for University Physics
 Data Analysis for University Physics by John Filaseta orthern Kentucky University Last updated on ovember 9, 004 Four Steps to a Meaningful Experimental Result Most undergraduate physics experiments have
Data Analysis: phy122-bennett -1-8/26/02
 Data Analysis: 1. Introduction. Scientists need very precise and accurate measurements for many reasons. We may need to test (distinguish) rival theories which make almost the same prediction (e.g for
Physics 2B Spring 2010: Final Version A 1 COMMENTS AND REMINDERS:
 Physics 2B Spring 2010: Final Version A 1 COMMENTS AND REMINDERS: Closed book. No work needs to be shown for multiple-choice questions. 1. A charge of +4.0 C is placed at the origin. A charge of 3.0 C
Alternating Current Circuits
 Alternating Current Circuits AC Circuit An AC circuit consists of a combination of circuit elements and an AC generator or source. The output of an AC generator is sinusoidal and varies with time according
Lab 4 CAPACITORS & RC CIRCUITS
 67 Name Date Partners Lab 4 CAPACITORS & RC CIRCUITS OBJECTIVES OVERVIEW To define capacitance and to learn to measure it with a digital multimeter. To explore how the capacitance of conducting parallel
Modern Experimental Physics Introduction for Physics 401 students. Fall 2017 Eugene V. Colla
 Modern Experimental Physics Introduction for Physics 401 students Fall 2017 Eugene V. Colla Goals of the course Experiments Teamwork Schedule and assignments Your working mode 2 Primary: Learn how to do
University of TN Chattanooga Physics 1040L 8/18/2012 PHYSICS 1040L LAB LAB 4: R.C. TIME CONSTANT LAB
 PHYSICS 1040L LAB LAB 4: R.C. TIME CONSTANT LAB OBJECT: To study the discharging of a capacitor and determine the time constant for a simple circuit. APPARATUS: Capacitor (about 24 μf), two resistors (about
Lab 4 RC Circuits. Name. Partner s Name. I. Introduction/Theory
 Lab 4 RC Circuits Name Partner s Name I. Introduction/Theory Consider a circuit such as that in Figure 1, in which a potential difference is applied to the series combination of a resistor and a capacitor.
Experiment 3: Resonance in LRC Circuits Driven by Alternating Current
 Experiment 3: Resonance in LRC Circuits Driven by Alternating Current Introduction In last week s laboratory you examined the LRC circuit when constant voltage was applied to it. During this laboratory
RLC Series Circuit. We can define effective resistances for capacitors and inductors: 1 = Capacitive reactance:
 RLC Series Circuit In this exercise you will investigate the effects of changing inductance, capacitance, resistance, and frequency on an RLC series AC circuit. We can define effective resistances for
Introduction to Statistics and Error Analysis II
 Introduction to Statistics and Error Analysis II Physics116C, 4/14/06 D. Pellett References: Data Reduction and Error Analysis for the Physical Sciences by Bevington and Robinson Particle Data Group notes
Computer simulation of radioactive decay
 Computer simulation of radioactive decay y now you should have worked your way through the introduction to Maple, as well as the introduction to data analysis using Excel Now we will explore radioactive
AE2160 Introduction to Experimental Methods in Aerospace
 AE160 Introduction to Experimental Methods in Aerospace Uncertainty Analysis C.V. Di Leo (Adapted from slides by J.M. Seitzman, J.J. Rimoli) 1 Accuracy and Precision Accuracy is defined as the difference
Introduction to Data Analysis
 Introduction to Data Analysis Analysis of Experimental Errors How to Report and Use Experimental Errors Statistical Analysis of Data Simple statistics of data Plotting and displaying the data Summary Errors
RC Circuit (Power amplifier, Voltage Sensor)
") Object: RC Circuit (Power amplifier, Voltage Sensor) To investigate how the voltage across a capacitor varies as it charges and to find its capacitive time constant. Apparatus: Science Workshop, Power
Object: RC Circuit (Power amplifier, Voltage Sensor) To investigate how the voltage across a capacitor varies as it charges and to find its capacitive time constant. Apparatus: Science Workshop, Power
STATISTICS OF OBSERVATIONS & SAMPLING THEORY. Parent Distributions
 ASTR 511/O Connell Lec 6 1 STATISTICS OF OBSERVATIONS & SAMPLING THEORY References: Bevington Data Reduction & Error Analysis for the Physical Sciences LLM: Appendix B Warning: the introductory literature
Effective Lab Oral Report Spring 2018
 Effective Lab Oral Report Spring 2018 David Hertzog, Eugene V Colla, Virginia Lorenz University of Illinois at Urbana-Champaign DKDP We will present some of my slides and many Phys 403 student slides as
5 Error Propagation We start from eq , which shows the explicit dependence of g on the measured variables t and h. Thus.
 5 Error Propagation We start from eq..4., which shows the explicit dependence of g on the measured variables t and h. Thus g(t,h) = h/t eq..5. The simplest way to get the error in g from the error in t
Chapter 1 - Basic Concepts. Measurement System Components. Sensor - Transducer. Signal-conditioning. Output. Feedback-control
 Chapter 1 - Basic Concepts Measurement System Components Sensor - Transducer Signal-conditioning Output Feedback-control MeasurementSystemConcepts.doc 8/27/2008 12:03 PM Page 1 Example: Sensor/ Transducer
Physics Labs with Computers, Vol. 1 P23: Conservation of Angular Momentum A
 Activity P23: Conservation of Angular Momentum (Rotary Motion Sensor) Concept DataStudio ScienceWorkshop (Mac) ScienceWorkshop (Win) Rotational motion P23 Angular Momentum.DS (See end of activity) (See
Discrete Simulation of Power Law Noise
 Discrete Simulation of Power Law Noise Neil Ashby 1,2 1 University of Colorado, Boulder, CO 80309-0390 USA 2 National Institute of Standards and Technology, Boulder, CO 80305 USA ashby@boulder.nist.gov
Measurements of a Table
 Measurements of a Table OBJECTIVES to practice the concepts of significant figures, the mean value, the standard deviation of the mean and the normal distribution by making multiple measurements of length
PROBLEMS FOR EXPERIMENT ES: ESTIMATING A SECOND Solutions
 Massachusetts Institute of Technology Physics Department 801X Fall 2002 PROBLEMS FOR EXPERIMENT ES: ESTIMATING A SECOND Solutions Problem 1: Use your calculator or your favorite software program to compute
MASSACHUSETTS INSTITUTE OF TECHNOLOGY Physics Department
 MASSACHUSETTS INSTITUTE OF TECHNOLOGY Physics Department Physics 8.01T Fall Term 2004 Experiment 06: Work, Energy and the Harmonic Oscillator Purpose of the Experiment: In this experiment you allow a cart
( ) ( ) = q o. T 12 = τ ln 2. RC Circuits. 1 e t τ. q t
 ( ) = q o. T 12 = τ ln 2. RC Circuits. 1 e t τ. q t") Objectives: To explore the charging and discharging cycles of RC circuits with differing amounts of resistance and/or capacitance.. Reading: Resnick, Halliday & Walker, 8th Ed. Section. 27-9 Apparatus:
Objectives: To explore the charging and discharging cycles of RC circuits with differing amounts of resistance and/or capacitance.. Reading: Resnick, Halliday & Walker, 8th Ed. Section. 27-9 Apparatus:
Experimental Uncertainty (Error) and Data Analysis
 and Data Analysis") Experimental Uncertainty (Error) and Data Analysis Advance Study Assignment Please contact Dr. Reuven at yreuven@mhrd.org if you have any questions Read the Theory part of the experiment (pages 2-14) and
Experimental Uncertainty (Error) and Data Analysis Advance Study Assignment Please contact Dr. Reuven at yreuven@mhrd.org if you have any questions Read the Theory part of the experiment (pages 2-14) and
Simple circuits - 3 hr
 Simple circuits - 3 hr Resistances in circuits Analogy of water flow and electric current An electrical circuit consists of a closed loop with a number of different elements through which electric current
Activity P60: Inverse Square Law Nuclear (Nuclear Sensor, Rotary Motion Sensor)
") Name Class Date Activity P60: Inverse Square Law Nuclear (Nuclear Sensor, Rotary Motion Sensor) Concept DataStudio ScienceWorkshop (Mac) ScienceWorkshop (Win) Radioactivity P60 Nuclear Inv Sqr Law.DS P60
Name Class Date Activity P60: Inverse Square Law Nuclear (Nuclear Sensor, Rotary Motion Sensor) Concept DataStudio ScienceWorkshop (Mac) ScienceWorkshop (Win) Radioactivity P60 Nuclear Inv Sqr Law.DS P60
Lifetime Measurement
 Lifetime Measurement Calculator 3 The activity (in decays per second) of some radioactive samples varies in time in a particularly simple way. If the activity (R) in decays per second of a sample is proportional
Capacitor ESR Measurement with Bode 100 and B-WIC
 Page 1 of 9 Capacitor ESR Measurement with Bode 100 and B-WIC by Florian Hämmerle 2010 Omicron Lab V1.0 Visit www.omicron-lab.com for more information. Contact support@omicron-lab.com for technical support.
PHYSICS 122 Lab EXPERIMENT NO. 6 AC CIRCUITS
 PHYSICS 122 Lab EXPERIMENT NO. 6 AC CIRCUITS The first purpose of this laboratory is to observe voltages as a function of time in an RC circuit and compare it to its expected time behavior. In the second
Old Dominion University Physics 112N/227N/232N Lab Manual, 13 th Edition
 RC Circuits Experiment PH06_Todd OBJECTIVE To investigate how the voltage across a capacitor varies as it charges. To find the capacitive time constant. EQUIPMENT NEEDED Computer: Personal Computer with
0 for all other times. Suppose further that we sample the signal with a sampling frequency f ;. We can write x # n =
 PSD, Autocorrelation, and Noise in MATLAB Aaron Scher Energy and power of a signal Consider a continuous time deterministic signal x t. We are specifically interested in analyzing the characteristics of
Uncertainty and Bias UIUC, 403 Advanced Physics Laboratory, Fall 2014
 Uncertainty and Bias UIUC, 403 Advanced Physics Laboratory, Fall 2014 Liang Yang* There are three kinds of lies: lies, damned lies and statistics. Benjamin Disraeli If your experiment needs statistics,
The Photon Counting Histogram: Statistical Analysis of Single Molecule Populations
 The Photon Counting Histogram: Statistical Analysis of Single Molecule Populations E. Gratton Laboratory for Fluorescence Dynamics University of California, Irvine Transition from FCS The Autocorrelation
First Results from the Mesa Beam Profile Cavity Prototype
 First Results from the Mesa Beam Profile Cavity Prototype Marco Tarallo 26 July 2005 Caltech LIGO Laboratory LIGO-G050348-00-D LIGO Scientific Collaboration 1 Contents Environment setup: description and
Capacitance Measurement
 Overview The goal of this two-week laboratory is to develop a procedure to accurately measure a capacitance. In the first lab session, you will explore methods to measure capacitance, and their uncertainties.
Experiment 1 Simple Measurements and Error Estimation
 Experiment 1 Simple Measurements and Error Estimation Reading and problems (1 point for each problem): Read Taylor sections 3.6-3.10 Do problems 3.18, 3.22, 3.23, 3.28 Experiment 1 Goals 1. To perform
FINAL EXAM - Physics Patel SPRING 1998 FORM CODE - A
 FINAL EXAM - Physics 202 - Patel SPRING 1998 FORM CODE - A Be sure to fill in your student number and FORM letter (A, B, C, D, E) on your answer sheet. If you forget to include this information, your Exam
Physics 1050 Experiment 3. Force and Acceleration
 Force and Acceleration Prelab uestions! These questions need to be completed before entering the lab. Please show all workings. Prelab 1: Draw the free body diagram for the cart on an inclined plane. Break
Errors: What they are, and how to deal with them
 Errors: What they are, and how to deal with them A series of three lectures plus exercises, by Alan Usher Room 111, a.usher@ex.ac.uk Synopsis 1) Introduction ) Rules for quoting errors 3) Combining errors
Figure 1: Capacitor circuit
 Capacitors INTRODUCTION The basic function of a capacitor 1 is to store charge and thereby electrical energy. This energy can be retrieved at a later time for a variety of uses. Often, multiple capacitors
July 11, Capacitor CBL 23. Name Date: Partners: CAPACITORS. TI-83 calculator with unit-tounit. Resistor (about 100 kω) Wavetek multimeter
 Wavetek multimeter") July 11, 2008 - CBL 23 Name Date: Partners: CAPACITORS Materials: CBL unit TI-83 calculator with unit-tounit link cable Resistor (about 100 kω) Connecting wires Wavetek multimeter TI voltage probe Assorted
July 11, 2008 - CBL 23 Name Date: Partners: CAPACITORS Materials: CBL unit TI-83 calculator with unit-tounit link cable Resistor (about 100 kω) Connecting wires Wavetek multimeter TI voltage probe Assorted
Compressible Gas Flow
 Compressible Gas Flow by Elizabeth Adolph Submitted to Dr. C. Grant Willson CHE53M Department of Chemical Engineering The University of Texas at Austin Fall 008 Compressible Gas Flow Abstract In this lab,
Mostly Review. Phy 123L
 Name: Significant Digits, Unit Conversions, Graphing and Uncertainties in Measurements =========================================================== Choose the best answer. (30 pts total) 1. Do the following
OBJECTIVE: To understand the relation between electric fields and electric potential, and how conducting objects can influence electric fields.
 Name Section Question Sheet for Laboratory 4: EC-2: Electric Fields and Potentials OBJECTIVE: To understand the relation between electric fields and electric potential, and how conducting objects can influence