Basic Error Analysis. Physics 401 Fall 2018 Eugene V Colla
|
|
|
- Gilbert Eustace Stewart
- 5 years ago
- Views:
Transcription

1 Basic Error Analysis Physics 401 Fall 2018 Eugene V Colla


2 Errors and uncertainties The Reading Error Accuracy and precession Systematic and statistical errors Fitting errors Appendix. Working with oil drop data Nonlinear fitting physics 401 2


3 T = 63 ±? Best guess T~0. 5 Wind speed 4mph±? Best guess ±0. 5mph physics 401 3


4 Clearance fit physics 401 4

5 Measurement of the speed of the light 1675 Ole Roemer: 220,000 Km/sec Does it make sense? What is missing? Ole Christensen Rømer NIST Bolder Colorado c = 299,792,456.2±1.1 m/s. physics 401 5


6 L 0. 5mm L=53mm±ΔL(?) Acrylic rod L 0. 03mm How far we have to go in reducing the reading error? We do not care about accuracy better than 1mm If ruler is not okay, we need to use digital caliper Probably the natural limit of accuracy can be due to length uncertainty because of temperature expansion. For 53mm L mm/K Reading Error = ± 1 2 (least count or minimum gradation). physics 401 6
=0.")

7 Fluke 8845A multimeter Example Vdc (reading)=0.85v V = = 22μV physics 401 7

8 The accuracy of an experiment is a measure of how close the result of the experiment comes to the true value Precision refers to how closely individual measurements agree with each other physics 401 8

9 physics 401 9
10 Systematic Error: reproducible inaccuracy introduced by faulty equipment, calibration or technique. Random errors: Indefiniteness of results due to finite precision of experiment. Measure of fluctuation in result after repeatable experimentation. Philip R. Bevington Data Reduction and Error Analysis for the Physical sciences, McGraw-Hill, 1969 physics
11 Sources of systematic errors: poor calibration of the equipment, changes of environmental conditions, imperfect method of observation, drift and some offset in readings etc. Example #1: measuring of the DC voltage R in Current source I R U E off E off =f(time,temperature) expectation U=R*I U = actual result R I R R in 1 + R E off physics 401R in 11


12 Example #3: poor calibration Measuring of the speed of the second sound in superfluid He4 20 Published data T l =2.17K 15 LHe Resonator U 2 (m/s) 10 P403 results T l =2.1K 10mA 5 HP34401A DMM T (K) Temperature sensor physics

13 Result of measurement Systematic error X meas = X true + e s + e r Correct value Random error 0.35 B 0.35 e s B e s = P 0.15 P X true X i X X i true physics
 : Probability to have n decays in time interval t Siméon Denis Poisson (1781-1840) A statistical process")

14 Pn t ) rt ) n! n e rt n 0,1,2,... r: decay rate [counts/s] t: time interval [s] Pn(rt) : Probability to have n decays in time interval t Siméon Denis Poisson ( ) A statistical process is described through a Poisson Distribution if: rt=1 0.3 rt=4 0.2 P rt= random process for a given nucleus probability for a decay to occur is the same in each time interval. o universal probability the probability to decay in a given time interval is same for all nuclei. o no correlation between two instances (the decay of on nucleus does not change the probability for a second nucleus tophysics decay o number of counts 20
15 ) rt ) rt Pn t e n n! n 0,1,2,... r: decay rate [counts/s] t: time interval [s] P n (rt) : Probability to have n decays in time interval t Properties of the Poisson distribution: rt=10 < n >= rt σ = rt n n0 P ( rt) 1, probabilities sum to 1 P 0.1 n n P ( rt) rt, the mean n0 n number of counts ( ) 2 n n P ( ), n0 n rt rt standard deviation physics

 number of counts 1 Pn ( x) e 2 ( xx) 2 2 2")
16 ) rt ) rt Pn t e n n! n 0,1,2,... Poisson and Gaussian distributions 0.1 probability of occurence "Poisson distribution" "Gaussian distribution" Carl Friedrich Gauss ( ) number of counts 1 Pn ( x) e 2 ( xx) Gaussian distribution: continuous physics

17 2 x 1 Pn ( x) e 2 ( xx) Error in the mean is given as N number od events σ N, physics


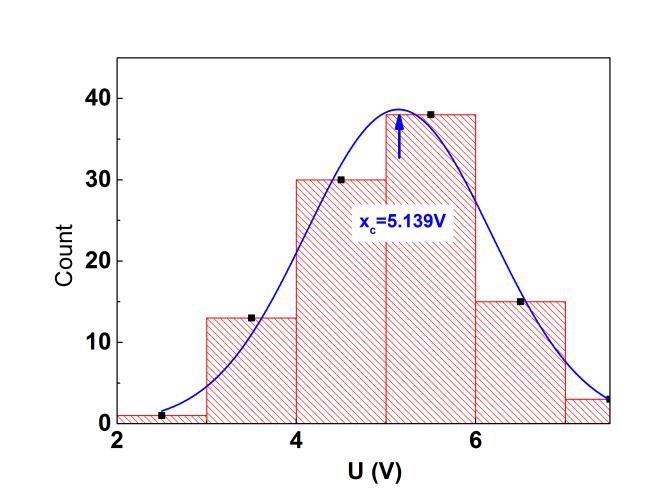
18 Source of noisy signal Expected value 5V Actual measured values physics

19
20 Result U x c N - standard deviation N number of samples For N=10 6 U=4.999± % accuracy


21 Ag b decay Model 108 Ag t 1/2 =157s 110 Ag t 1/2 =24.6s ExpDec2 Equation y = A1*exp(-x/t1) + A2*exp(-x/t2) + y0 Residuals 0 Count Reduced Chi-Sqr Adj. R-Square Value Standard Error C y C A C t C A C t time (s) time (s) Count 20 Model Gauss Equation y=y0 + (A/(w*sq rt(pi/2)))*exp(-2 *((x-xc)/w)^2) Reduced Chi-S qr Adj. R-Square Value Standard Error Counts y Counts xc Counts w Counts A Counts sigma Counts FWHM Counts Height t t y A1 exp A2 exp y t t Residuals physics
22 40 Ag b decay Test 1. Fourier analysis 20 Residuals time (s) Count 20 Model Gauss Equation y=y0 + (A/(w*sq rt(pi/2)))*exp(-2 *((x-xc)/w)^2) Reduced Chi-S qr Adj. R-Square Value Standard Error Counts y Counts xc Counts w Counts A Counts sigma Counts FWHM Counts Height No pronounced frequencies found Residuals physics
23 40 20 Ag b decay Test 1. Autocorrelation function Residuals time (s) Count 20 Model Gauss Equation y=y0 + (A/(w*sq rt(pi/2)))*exp(-2 *((x-xc)/w)^2) Reduced Chi-S qr Adj. R-Square Value Standard Error Counts y Counts xc Counts w Counts A Counts sigma Counts FWHM Counts Height Correlation function M 1 y( m) f ( n) g( n m) n Residuals autocorrelation function M 1 y( m) f ( n) f ( n m) n0 physics
24 Ag b decay Clear experiment Data + noise t 1 (s) t 2 (s) physics
25 Ag b decay Histogram does not follow the normal distribution and there is frequency of is present in spectrum physics
26 Ag b decay Autocorrelation function Conclusion: fitting function should be modified by adding an additional term: t t y( t) y A exp A exp A3 sin( t ) t t physics
27 FFT autocorrelation Clear experiment Data + noise Modified fitting t 1 (s) t 2 (s) physics
28 time In general we could expect both components of errors Q meas = Q true + e s + e r e s - systematic error comes from uncertainties of plates separation distance, applied DC voltage, ambient temperature etc. V =V DC ±DV, d=d 0 ±Dd e r - random errors are related to uncertainty of the knowledge of the actual t g and t rise. Uncertainty of time of crossing the marker line. It is random. physics
29 Q F S T 1 9d Systematic error 3 2 x 3 2 fc V g t t g g t rise F 1 t g 1 32 f c g 1 2 S 3 3 9d 2 x T V g t t g g t rise dq dq dq dq dq DQ F S T S T df D D D D D ds dt ds dt ) ) ) ) ) DS DT FT ) DS ) FS ) DT ) Q S T 10/1/2018 Physics
30 Systematic error 2 2 DS DT DQ Q S T DS Dd DV 3 Dx 3 D 1 D 1 Dg Dd 3 Dx S d V 2 x g d 2 x DT Dt Dt t t t t t g rise g g rise g rise 10/1/2018 Physics
31 Step 1. Origin Project For Raw Data : \\engr-file-03\phyinst\apl Courses\PHYCS401\Students\2. Millikan Raw Data All these projects with raw data should be stored in: \\engr-file-03\phyinst\apl Courses\PHYCS401\Students\ 2. Millikan Raw Data Here should only the files with raw data but not other files which you using for calculations. All other files you can save in your personal folder physics


.")

32 Step 2. Working on personal Origin project Make a copy of the Millikan1 project to your personal folder and open it Prepare equations calculations of data in next columns (Set column values ). Switch Recalculate in Auto mode Paste these 5 parameters and raw data from Section L1-L4.opj projects Calculate manually the actual air viscosity physics

33 Millikan oil drop experiment Step 3. Histogram graph First use the data from the column with drop charges and plot the histogram physics

34 Step 4. Histogram. Bin size Origin will automatically but not optimally adjust the bin size h. In tis page figure h=0.5. There are several theoretical approaches how to find the optimal bin size. 3. 5σ h = n 1/3 Is the sample standard deviation and n is total number of observation. For presented in Fig.1 results good value of h ~0.1 Millikan oil drop experiment h=5 physics

35 Step 4. Histogram. Bin size Millikan oil drop experiment To change the bin size click on graph and unplug the Automatic Binning option Bin size in this histogram is 0.1 physics

36 Step 4. Find the bin Worksheet Millikan oil drop experiment Right click on histogram and choose Go to Bin Worksheet. physics

37 Step 5. Add Counts vs bin plot physics


38 Step 5. Multipeak Gaussian fitting Millikan oil drop experiment This plot can be used for peak fitting. physics

39 Step 5. Multipeak Gaussian Fitting For 1 st peak x c ~0.882±0.007 physics
40 (x i,y i ) is an experimental data array. x i is an independent variable and y i - dependent f(x,b) is a model function and b is the vector of fitting (adjustable) parameters The goal of the fitting procedure is to find the set of parameters which will generate the function f closest to the experimental points. To reach this goal we will try to minimize the sum of squared deviation function (S): m i1 b 2 S( b) y f ( x, ) i i physics
41 The goal of fitting is not only to find the curve best matching the experimental data but also to find the corresponding parameters which in majority cases are the important physical parameters There are several known mathematical algorithms for optimizing these parameters but in general the fitting procedure could have not only unique solution and the choice of initial parameters is very important issue m i1 b 2 S( b) y f ( x, ) i i physics
42 b i 1 40 b i 2 S(bi) 20 0 Local minimum Main minimum bi Let we have the S function dependent on parameter b i as shown on this graph physics
Basic Error Analysis. Physics 401 Fall 2017 Eugene V Colla
 Basic Error Analysis Physics 401 Fall 2017 Eugene V Colla Errors and uncertainties The Reading Error Accuracy and precession Systematic and statistical errors Fitting errors Appendix. Working with oil
Basic Error Analysis. Physics 401 Spring 2015 Eugene V Colla
 Basic Error Analysis Physics 401 Spring 2015 Eugene V Colla Errors and uncertainties The Reading Error Accuracy and precession Systematic and statistical errors Fitting errors Appendix. Working with oil
Physics 401. Fall 2018 Eugene V. Colla. 10/8/2018 Physics 401 1
 Physics 41. Fall 18 Eugene V. Colla 1/8/18 Physics 41 1 Electrical RLC circuits Torsional Oscillator Damping Data Analysis 1/8/18 Physics 41 V R +V L +V C =V(t) If V(t)= R d d q(t) q(t) dt dt C C L q(t)
Physics 401. Fall 2017 Eugene V. Colla. 10/9/2017 Physics 401 1
 Physics 41. Fall 17 Eugene V. Colla 1/9/17 Physics 41 1 Electrical RLC circuits Torsional Oscillator Damping Data Analysis 1/9/17 Physics 41 V R +V L +V C =V(t) If V(t)= R d d q(t) q(t) dt dt C C L q(t)
; F- Faraday constant, N A - Avagadro constant. Best. uncertainty ~1.6 ppm. 4. From Josephson (K J = 2e. constants. ) and von Klitzing R h
 and von Klitzing R h") 1. Measuring of the charge of electron. 2. Robert Millikan and his oil drop experiment 3. Theory of the experiment 4. Laboratory setup 5. Data analysis 2/15/2016 2 1. Oil drop experiment. Robert A. Millikan..
1. Measuring of the charge of electron. 2. Robert Millikan and his oil drop experiment 3. Theory of the experiment 4. Laboratory setup 5. Data analysis 2/15/2016 2 1. Oil drop experiment. Robert A. Millikan..
; F- Faraday constant, N A - Avagadro constant. Best. uncertainty ~1.6 ppm. 4. From Josephson (K J = 2e. constants. ) and von Klitzing R h
 and von Klitzing R h") 1. Measuring of the charge of electron. 2. Robert Millikan and his oil drop experiment 3. Theory of the experiment 4. Laboratory setup 5. Data analysis 9/25/2017 2 1. Oil drop experiment. Robert A. Millikan..
1. Measuring of the charge of electron. 2. Robert Millikan and his oil drop experiment 3. Theory of the experiment 4. Laboratory setup 5. Data analysis 9/25/2017 2 1. Oil drop experiment. Robert A. Millikan..
Physics 401, Spring 2016 Eugene V. Colla
 Physics 41, Spring 16 Eugene V. Colla.8 (rad). -.8 1 3 4 5 6 7 8 time (s) 1.Driven torsional oscillator. Equations.Setup. Kinematics 3.Resonance 4.Beats 5.Nonlinear effects 6.Comments 3/7/16 3/7/16 3 Tacoma
Computer simulation of radioactive decay
 Computer simulation of radioactive decay y now you should have worked your way through the introduction to Maple, as well as the introduction to data analysis using Excel Now we will explore radioactive
Pulses in transmission lines
 Pulses in transmission lines Physics 401, Fall 2018 Eugene V. Colla Definition Distributed parameters network Pulses in transmission line Wave equation and wave propagation Reflections. Resistive load
EAS 535 Laboratory Exercise Weather Station Setup and Verification
 EAS 535 Laboratory Exercise Weather Station Setup and Verification Lab Objectives: In this lab exercise, you are going to examine and describe the error characteristics of several instruments, all purportedly
Error propagation. Alexander Khanov. October 4, PHYS6260: Experimental Methods is HEP Oklahoma State University
 Error propagation Alexander Khanov PHYS660: Experimental Methods is HEP Oklahoma State University October 4, 017 Why error propagation? In many cases we measure one thing and want to know something else
Signal types. Signal characteristics: RMS, power, db Probability Density Function (PDF). Analogue-to-Digital Conversion (ADC).
. Analogue-to-Digital Conversion (ADC).") Signal types. Signal characteristics:, power, db Probability Density Function (PDF). Analogue-to-Digital Conversion (ADC). Signal types Stationary (average properties don t vary with time) Deterministic
Signal types. Signal characteristics:, power, db Probability Density Function (PDF). Analogue-to-Digital Conversion (ADC). Signal types Stationary (average properties don t vary with time) Deterministic
Error? Relative error = Theory: g = 9.8 m/sec 2 Measured: g = 9.7 m/sec 2
 Error? Theory: g = 9.8 m/sec 2 Measured: g = 9.7 m/sec 2 Relative error = Measurement Error? (how well do you know your measurement of g = 9.7 m/sec 2. Do you know it exactly 9.7 m/sec 2? ) 3 Accuracy
by A.Tonina*, R.Iuzzolino*, M.Bierzychudek* and M.Real* S. Solve + R. Chayramy + and M. Stock +
 Bilateral Comparison of 1.018 V and 10 V Standards between the INTI (Argentina) and the BIPM, August to October 2009 (part of the ongoing BIPM key comparison BIPM.EM-K11.a and b) by A.Tonina*, R.Iuzzolino*,
Electric Field Mapping
 PC1143 Physics III Electric Field Mapping 1 Objectives Map the electric fields and potentials resulting from three different configurations of charged electrodes rectangular, concentric, and circular.
Uncertainty in Measurements
 Uncertainty in Measurements Joshua Russell January 4, 010 1 Introduction Error analysis is an important part of laboratory work and research in general. We will be using probability density functions PDF)
Application Note AN37. Noise Histogram Analysis. by John Lis
 AN37 Application Note Noise Histogram Analysis by John Lis NOISELESS, IDEAL CONVERTER OFFSET ERROR σ RMS NOISE HISTOGRAM OF SAMPLES PROBABILITY DISTRIBUTION FUNCTION X PEAK-TO-PEAK NOISE Crystal Semiconductor
EIE 240 Electrical and Electronic Measurements Class 2: January 16, 2015 Werapon Chiracharit. Measurement
 EIE 240 Electrical and Electronic Measurements Class 2: January 16, 2015 Werapon Chiracharit Measurement Measurement is to determine the value or size of some quantity, e.g. a voltage or a current. Analogue
Notes Errors and Noise PHYS 3600, Northeastern University, Don Heiman, 6/9/ Accuracy versus Precision. 2. Errors
 Notes Errors and Noise PHYS 3600, Northeastern University, Don Heiman, 6/9/2011 1. Accuracy versus Precision 1.1 Precision how exact is a measurement, or how fine is the scale (# of significant figures).
Uncertainties and Error Propagation Part I of a manual on Uncertainties, Graphing, and the Vernier Caliper
 Contents Uncertainties and Error Propagation Part I of a manual on Uncertainties, Graphing, and the Vernier Caliper Copyright July 1, 2000 Vern Lindberg 1. Systematic versus Random Errors 2. Determining
Some Statistics. V. Lindberg. May 16, 2007
 Some Statistics V. Lindberg May 16, 2007 1 Go here for full details An excellent reference written by physicists with sample programs available is Data Reduction and Error Analysis for the Physical Sciences,
BRIDGE CIRCUITS EXPERIMENT 5: DC AND AC BRIDGE CIRCUITS 10/2/13
 EXPERIMENT 5: DC AND AC BRIDGE CIRCUITS 0//3 This experiment demonstrates the use of the Wheatstone Bridge for precise resistance measurements and the use of error propagation to determine the uncertainty
Switch. R 5 V Capacitor. ower upply. Voltmete. Goals. Introduction
 Switch Lab 6. Circuits ower upply Goals + + R 5 V Capacitor V To appreciate the capacitor as a charge storage device. To measure the voltage across a capacitor as it discharges through a resistor, and
Fundamentals of data, graphical, and error analysis
 Fundamentals of data, graphical, and error analysis. Data measurement and Significant Figures UTC - Physics 030L/040L Whenever we take a measurement, there are limitations to the data and how well we can
Switch. R 5 V Capacitor. ower upply. Voltmete. Goals. Introduction
 Switch Lab 6. Circuits ower upply Goals + + R 5 V Capacitor V To appreciate the capacitor as a charge storage device. To measure the voltage across a capacitor as it discharges through a resistor, and
EXPERIMENT 4 ONE DIMENSIONAL MOTION
 EXPERIMENT 4 ONE DIMENSIONAL MOTION INTRODUCTION This experiment explores the meaning of displacement; velocity, acceleration and the relationship that exist between them. An understanding of these concepts
Physics 401. Classical Physics Laboratory.
 Physics 401. Classical Physics Laboratory. Spring 2018 Eugene V Colla Course Objective Organization: Times and locations Physics 401 staff Semester Schedule Laboratory routine Grading scheme Section assignments
Experiment 2. F r e e F a l l
 Suggested Reading for this Lab Experiment F r e e F a l l Taylor, Section.6, and standard deviation rule in Taylor handout. Review Chapters 3 & 4, Read Sections 8.1-8.6. You will also need some procedures
Error Analysis. V. Lorenz L. Yang, M. Grosse Perdekamp, D. Hertzog, R. Clegg PHYS403 Spring 2016
 Error Analysis V. Lorenz L. Yang, M. Grosse Perdekamp, D. Hertzog, R. Clegg PHYS403 Spring 2016 Reporting measurement results Always include uncertainty estimates in your results Have the correct number
MASSACHUSETTS INSTITUTE OF TECHNOLOGY PHYSICS DEPARTMENT
 G. Clark 7oct96 1 MASSACHUSETTS INSTITUTE OF TECHNOLOGY PHYSICS DEPARTMENT 8.13/8.14 Junior Laboratory STATISTICS AND ERROR ESTIMATION The purpose of this note is to explain the application of statistics
dn(t) dt where λ is the constant decay probability per unit time. The solution is N(t) = N 0 exp( λt)
 dt where λ is the constant decay probability per unit time. The solution is N(t) = N 0 exp( λt)") (Aug. 2011 revision) Physics 307 Laboratory Experiment #3 Probability Distributions and the Decay of Excited Quantum States Motivation: The purpose of this experiment is to introduce the student to counting
(Aug. 2011 revision) Physics 307 Laboratory Experiment #3 Probability Distributions and the Decay of Excited Quantum States Motivation: The purpose of this experiment is to introduce the student to counting
by S. Solve +, R. Chayramy +, M. Stock +, D. Vlad*
 Bilateral Comparison of 1 V and 10 V Standards between the SMD (Belgium) and the BIPM, October to November 2014 (part of the ongoing BIPM key comparison BIPM.EM-K11.a and b) by S. Solve +, R. Chayramy
Coupled Electrical Oscillators Physics Advanced Physics Lab - Summer 2018 Don Heiman, Northeastern University, 5/24/2018
 Coupled Electrical Oscillators Physics 3600 - Advanced Physics Lab - Summer 08 Don Heiman, Northeastern University, 5/4/08 I. INTRODUCTION The objectives of this experiment are: () explore the properties
AE2160 Introduction to Experimental Methods in Aerospace
 AE160 Introduction to Experimental Methods in Aerospace Uncertainty Analysis C.V. Di Leo (Adapted from slides by J.M. Seitzman, J.J. Rimoli) 1 Accuracy and Precision Accuracy is defined as the difference
Measurements of a Table
 Measurements of a Table OBJECTIVES to practice the concepts of significant figures, the mean value, the standard deviation of the mean and the normal distribution by making multiple measurements of length
PROBLEMS FOR EXPERIMENT ES: ESTIMATING A SECOND Solutions
 Massachusetts Institute of Technology Physics Department 801X Fall 2002 PROBLEMS FOR EXPERIMENT ES: ESTIMATING A SECOND Solutions Problem 1: Use your calculator or your favorite software program to compute
Correlation, discrete Fourier transforms and the power spectral density
 Correlation, discrete Fourier transforms and the power spectral density visuals to accompany lectures, notes and m-files by Tak Igusa tigusa@jhu.edu Department of Civil Engineering Johns Hopkins University
Computer 3. Lifetime Measurement
 Lifetime Measurement Computer 3 The activity (in decays per second) of some radioactive samples varies in time in a particularly simple way. If the activity (R) in decays per second of a sample is proportional
Switch. R 5 V Capacitor. ower upply. Voltmete. Goals. Introduction
 Switch Lab 9. Circuits ower upply Goals + + R 5 V Capacitor V To appreciate the capacitor as a charge storage device. To measure the voltage across a capacitor as it discharges through a resistor, and
Part I. Experimental Error
 Part I. Experimental Error 1 Types of Experimental Error. There are always blunders, mistakes, and screwups; such as: using the wrong material or concentration, transposing digits in recording scale readings,
Some hints for the Radioactive Decay lab
 Some hints for the Radioactive Decay lab Edward Stokan, March 7, 2011 Plotting a histogram using Microsoft Excel The way I make histograms in Excel is to put the bounds of the bin on the top row beside
Technical Procedure for Glass Refractive Index Measurement System 3 (GRIM 3)
") Technical Procedure for Glass Refractive Index Measurement System 3 (GRIM 3) 1.0 Purpose - This technical procedure shall be followed for the operation of the GRIM 3. 2.0 Scope - This procedure applies
Technical Procedure for Glass Refractive Index Measurement System 3 (GRIM 3) 1.0 Purpose - This technical procedure shall be followed for the operation of the GRIM 3. 2.0 Scope - This procedure applies
University of TN Chattanooga Physics 1040L 8/18/2012 PHYSICS 1040L LAB LAB 4: R.C. TIME CONSTANT LAB
 PHYSICS 1040L LAB LAB 4: R.C. TIME CONSTANT LAB OBJECT: To study the discharging of a capacitor and determine the time constant for a simple circuit. APPARATUS: Capacitor (about 24 μf), two resistors (about
Lab 5 CAPACITORS & RC CIRCUITS
 L051 Name Date Partners Lab 5 CAPACITORS & RC CIRCUITS OBJECTIVES OVERVIEW To define capacitance and to learn to measure it with a digital multimeter. To explore how the capacitance of conducting parallel
Radioactivity: Experimental Uncertainty
 Lab 5 Radioactivity: Experimental Uncertainty In this lab you will learn about statistical distributions of random processes such as radioactive counts. You will also further analyze the gamma-ray absorption
ES205 Analysis and Design of Engineering Systems: Lab 1: An Introductory Tutorial: Getting Started with SIMULINK
 ES205 Analysis and Design of Engineering Systems: Lab 1: An Introductory Tutorial: Getting Started with SIMULINK What is SIMULINK? SIMULINK is a software package for modeling, simulating, and analyzing
The Treatment of Numerical Experimental Results
 Memorial University of Newfoundl Department of Physics Physical Oceanography The Treatment of Numerical Experimental Results The purpose of these notes is to introduce you to some techniques of error analysis
Discrete Simulation of Power Law Noise
 Discrete Simulation of Power Law Noise Neil Ashby 1,2 1 University of Colorado, Boulder, CO 80309-0390 USA 2 National Institute of Standards and Technology, Boulder, CO 80305 USA ashby@boulder.nist.gov
Magnetic Fields. Experiment 1. Magnetic Field of a Straight Current-Carrying Conductor
 General Physics Lab Department of PHYSICS YONSEI University Lab Manual (Lite) Magnetic Fields Ver.20181029 NOTICE This LITE version of manual includes only experimental procedures for easier reading on
THE GEIGER-MULLER TUBE AND THE STATISTICS OF RADIOACTIVITY
 GMstats. THE GEIGER-MULLER TUBE AN THE STATISTICS OF RAIOACTIVITY This experiment examines the Geiger-Muller counter, a device commonly used for detecting and counting ionizing radiation. Various properties
Lab 1 Uniform Motion - Graphing and Analyzing Motion
 Lab 1 Uniform Motion - Graphing and Analyzing Motion Objectives: < To observe the distance-time relation for motion at constant velocity. < To make a straight line fit to the distance-time data. < To interpret
Protean Instrument Dutchtown Road, Knoxville, TN TEL/FAX:
 Application Note AN-0210-1 Tracking Instrument Behavior A frequently asked question is How can I be sure that my instrument is performing normally? Before we can answer this question, we must define what
MASSACHUSETTS INSTITUTE OF TECHNOLOGY Department of Physics 8.02 Spring 2003 Experiment 17: RLC Circuit (modified 4/15/2003) OBJECTIVES
 OBJECTIVES") MASSACHUSETTS INSTITUTE OF TECHNOLOGY Department of Physics 8. Spring 3 Experiment 7: R Circuit (modified 4/5/3) OBJECTIVES. To observe electrical oscillations, measure their frequencies, and verify energy
MASSACHUSETTS INSTITUTE OF TECHNOLOGY Department of Physics 8. Spring 3 Experiment 7: R Circuit (modified 4/5/3) OBJECTIVES. To observe electrical oscillations, measure their frequencies, and verify energy
Elementary charge and Millikan experiment Students worksheet
 Tasks This experiment deals with the observation of charged oil droplets, which are accelerated between two capacitor plates.. Measure some rise and fall times of oil droplets at different voltages. Determine
Basic Procedures for Common Problems
 Basic Procedures for Common Problems ECHE 550, Fall 2002 Steady State Multivariable Modeling and Control 1 Determine what variables are available to manipulate (inputs, u) and what variables are available
Rutherford Scattering
 Rutherford Scattering Today's understanding of the atom, as a structure whose positive charge and majority of mass are concentrated in a minute nucleus, is due to the α particle scattering experiments
Introduction to Statistics and Error Analysis
 Introduction to Statistics and Error Analysis Physics116C, 4/3/06 D. Pellett References: Data Reduction and Error Analysis for the Physical Sciences by Bevington and Robinson Particle Data Group notes
Section 5.6 Integration by Parts
 .. 98 Section.6 Integration by Parts Integration by parts is another technique that we can use to integrate problems. Typically, we save integration by parts as a last resort when substitution will not
NE01 - Centripetal Force. Laboratory Manual Experiment NE01 - Centripetal Force Department of Physics The University of Hong Kong
 Background Introduction Laboratory Manual Experiment Department of Physics The University of Hong Kong Circular Motion is one of the simplest forms of 2-dimensional motion in which the locus of the object
MASSACHUSETTS INSTITUTE OF TECHNOLOGY Physics Department. Experiment 03: Work and Energy
 MASSACHUSETTS INSTITUTE OF TECHNOLOGY Physics Department Physics 8.01 Fall Term 2010 Experiment 03: Work and Energy Purpose of the Experiment: In this experiment you allow a cart to roll down an inclined
Introduction to Error Analysis
 Introduction to Error Analysis Part 1: the Basics Andrei Gritsan based on lectures by Petar Maksimović February 1, 2010 Overview Definitions Reporting results and rounding Accuracy vs precision systematic
Probability & Statistics: Introduction. Robert Leishman Mark Colton ME 363 Spring 2011
 Probability & Statistics: Introduction Robert Leishman Mark Colton ME 363 Spring 2011 Why do we care? Why do we care about probability and statistics in an instrumentation class? Example Measure the strength
Pulses in transmission lines
 Pulses in transmission lines Physics 401, Fall 013 Eugene V. Colla Definition Distributed parameters networ Pulses in transmission line Wave equation and wave propagation eflections. esistive load Thévenin's
Experiment 1: The Same or Not The Same?
 Experiment 1: The Same or Not The Same? Learning Goals After you finish this lab, you will be able to: 1. Use Logger Pro to collect data and calculate statistics (mean and standard deviation). 2. Explain
Experiment A12 Monte Carlo Night! Procedure
 Experiment A12 Monte Carlo Night! Procedure Deliverables: checked lab notebook, printed plots with captions Overview In the real world, you will never measure the exact same number every single time. Rather,
A Statistical Study of PITCHf/x Pitched Baseball Trajectories
 A Statistical Study of PITCHf/x Pitched Baseball Trajectories Alan M. Nathan Department of Physics, University of Illinois, Urbana, IL 6181 February 8, 28 A statistical study of PITCHf/x trajectories is
EXPERIMENT 2 Reaction Time Objectives Theory
 EXPERIMENT Reaction Time Objectives to make a series of measurements of your reaction time to make a histogram, or distribution curve, of your measured reaction times to calculate the "average" or mean
Counting Statistics and Error Propagation!
 Counting Statistics and Error Propagation Nuclear Medicine Physics Lectures 10/4/11 Lawrence MacDonald, PhD macdon@uw.edu Imaging Research Laboratory, Radiology Dept. 1 Statistics Type of analysis which
Experiment 1 Simple Measurements and Error Estimation
 Experiment 1 Simple Measurements and Error Estimation Reading and problems (1 point for each problem): Read Taylor sections 3.6-3.10 Do problems 3.18, 3.22, 3.23, 3.28 Experiment 1 Goals 1. To perform
Exercise 4 Modeling transient currents and voltages
 Exercise 4 Modeling transient currents and voltages Basic A circuit elements In a D circuit, the electro-motive forces push the electrons along the circuit and resistors remove that energy by conversion
Experiment P43: RC Circuit (Power Amplifier, Voltage Sensor)
") PASCO scientific Vol. 2 Physics Lab Manual: P43-1 Experiment P43: (Power Amplifier, Voltage Sensor) Concept Time SW Interface Macintosh file Windows file circuits 30 m 700 P43 P43_RCCI.SWS EQUIPMENT NEEDED
PASCO scientific Vol. 2 Physics Lab Manual: P43-1 Experiment P43: (Power Amplifier, Voltage Sensor) Concept Time SW Interface Macintosh file Windows file circuits 30 m 700 P43 P43_RCCI.SWS EQUIPMENT NEEDED
Lecture 23. Lidar Error and Sensitivity Analysis (2)
") Lecture 3. Lidar Error and Sensitivity Analysis ) q Derivation of Errors q Background vs. Noise q Sensitivity Analysis q Summary 1 Accuracy vs. Precision in Lidar Measurements q The precision errors caused
Lecture 3. Lidar Error and Sensitivity Analysis ) q Derivation of Errors q Background vs. Noise q Sensitivity Analysis q Summary 1 Accuracy vs. Precision in Lidar Measurements q The precision errors caused
OBJECTIVE: To understand the relation between electric fields and electric potential, and how conducting objects can influence electric fields.
 Name Section Question Sheet for Laboratory 4: EC-2: Electric Fields and Potentials OBJECTIVE: To understand the relation between electric fields and electric potential, and how conducting objects can influence
SHM Simple Harmonic Motion revised May 23, 2017
 SHM Simple Harmonic Motion revised May 3, 017 Learning Objectives: During this lab, you will 1. communicate scientific results in writing.. estimate the uncertainty in a quantity that is calculated from
Lab 1g: Horizontally Forced Pendulum & Chaotic Motion
 58:080 Experimental Engineering OBJECTIVE Lab 1g: Horizontally Forced Pendulum & Chaotic Motion The objective of this lab is to study horizontally forced oscillations of a pendulum. This will be done trough
STATISTICS OF OBSERVATIONS & SAMPLING THEORY. Parent Distributions
 ASTR 511/O Connell Lec 6 1 STATISTICS OF OBSERVATIONS & SAMPLING THEORY References: Bevington Data Reduction & Error Analysis for the Physical Sciences LLM: Appendix B Warning: the introductory literature
Review for the First Midterm Exam
 Review for the First Midterm Exam Thomas Morrell 5 pm, Sunday, 4 April 9 B9 Van Vleck Hall For the purpose of creating questions for this review session, I did not make an effort to make any of the numbers
ELEG 3143 Probability & Stochastic Process Ch. 6 Stochastic Process
 Department of Electrical Engineering University of Arkansas ELEG 3143 Probability & Stochastic Process Ch. 6 Stochastic Process Dr. Jingxian Wu wuj@uark.edu OUTLINE 2 Definition of stochastic process (random
Appendix A: Math Review
 Appendix A: Math Review A great deal of information can be obtained by first considering the type of equation being investigated. Is one variable squared? If yes it is a quadratic equation. Are there trigonometric
NCSS Statistical Software. Harmonic Regression. This section provides the technical details of the model that is fit by this procedure.
 Chapter 460 Introduction This program calculates the harmonic regression of a time series. That is, it fits designated harmonics (sinusoidal terms of different wavelengths) using our nonlinear regression
Treatment of Error in Experimental Measurements
 in Experimental Measurements All measurements contain error. An experiment is truly incomplete without an evaluation of the amount of error in the results. In this course, you will learn to use some common
Lab 4: Gauss Gun Conservation of Energy
 Lab 4: Gauss Gun Conservation of Energy Before coming to Lab Read the lab handout Complete the pre-lab assignment and hand in at the beginning of your lab section. The pre-lab is written into this weeks
Lab 4: Introduction to Signal Processing: Fourier Transform
 Lab 4: Introduction to Signal Processing: Fourier Transform This laboratory requires the following equipment: Matlab The laboratory duration is approximately 3 hours. Although this laboratory is not graded,
Lab 4 CAPACITORS & RC CIRCUITS
 67 Name Date Partners Lab 4 CAPACITORS & RC CIRCUITS OBJECTIVES OVERVIEW To define capacitance and to learn to measure it with a digital multimeter. To explore how the capacitance of conducting parallel
August 7, 2007 NUMERICAL SOLUTION OF LAPLACE'S EQUATION
 August 7, 007 NUMERICAL SOLUTION OF LAPLACE'S EQUATION PURPOSE: This experiment illustrates the numerical solution of Laplace's Equation using a relaxation method. The results of the relaxation method
Physics 6720 Introduction to Statistics April 4, 2017
 Physics 6720 Introduction to Statistics April 4, 2017 1 Statistics of Counting Often an experiment yields a result that can be classified according to a set of discrete events, giving rise to an integer
Measurements & Instrumentation
 Measurements & Instrumentation Module 1: Measurements & Error Analysis PREPARED BY Academic Services Unit August 2013 Applied Technology High Schools, 2013 ATE314 Measurements & Instrumentation Module
Foundations of Modern Physics by Tipler, Theory: The dierential equation which describes the population N(t) is. dn(t) dt.
 is. dn(t) dt.") (Sept. 2007 revision) Physics 307 Laboratory Experiment #3 Probability Distributions and the Decay of Excited Quantum States Motivation: The purpose of this experiment is to introduce the student to counting
(Sept. 2007 revision) Physics 307 Laboratory Experiment #3 Probability Distributions and the Decay of Excited Quantum States Motivation: The purpose of this experiment is to introduce the student to counting
SUPPLEMENTARY INFORMATION
 Systematic shift caused by trap asymmetry The major systematic correction in the reported cyclotron frequency ratio comparison of an antiproton at ν c, p and a negatively charged hydrogen ion (H ) at ν
Data Analysis: phy122-bennett -1-8/26/02
 Data Analysis: 1. Introduction. Scientists need very precise and accurate measurements for many reasons. We may need to test (distinguish) rival theories which make almost the same prediction (e.g for
Measurements and Errors
 1 Measurements and Errors If you are asked to measure the same object two different times, there is always a possibility that the two measurements may not be exactly the same. Then the difference between
Hall Coefficient of Germanium
 Sridhar Chandramouli 1 Hall Coefficient of Germanium Physics Department, The College of Wooster, Wooster, Ohio 691 April 9, 1999 This experiment experimentally measures the Hall coefficient of a Germanium
Lab 10: DC RC circuits
 Name: Lab 10: DC RC circuits Group Members: Date: TA s Name: Objectives: 1. To understand current and voltage characteristics of a DC RC circuit 2. To understand the effect of the RC time constant Apparatus:
B THE CAPACITOR. Theory
 8. THE CAPACITOR You will study several aspects of a capacitor, how the voltage across it changes with time as it is being charged and discharged and how it stores energy. The most well known device for
Junior Laboratory. PHYC 307L, Spring Webpage:
 Lectures: Mondays, 13:00-13:50 am, P&A room 184 Lab Sessions: Room 133 Junior Laboratory PHYC 307L, Spring 2016 Webpage: http://physics.unm.edu/courses/becerra/phys307lsp16/ Monday 14:00-16:50 (Group 1)
ECE-340, Spring 2015 Review Questions
 ECE-340, Spring 2015 Review Questions 1. Suppose that there are two categories of eggs: large eggs and small eggs, occurring with probabilities 0.7 and 0.3, respectively. For a large egg, the probabilities
Data Analysis for University Physics
 Data Analysis for University Physics by John Filaseta orthern Kentucky University Last updated on ovember 9, 004 Four Steps to a Meaningful Experimental Result Most undergraduate physics experiments have
Life Cycle of Stars. Photometry of star clusters with SalsaJ. Authors: Daniel Duggan & Sarah Roberts
 Photometry of star clusters with SalsaJ Authors: Daniel Duggan & Sarah Roberts Photometry of star clusters with SalsaJ Introduction Photometry is the measurement of the intensity or brightness of an astronomical
Uncertainty in Physical Measurements: Module 5 Data with Two Variables
 : Often data have two variables, such as the magnitude of the force F exerted on an object and the object s acceleration a. In this Module we will examine some ways to determine how one of the variables,
MASSACHUSETTS INSTITUTE OF TECHNOLOGY Physics Department
 MASSACHUSETTS INSTITUTE OF TECHNOLOGY Physics Department Physics 8.01T Fall Term 2004 Experiment 06: Work, Energy and the Harmonic Oscillator Purpose of the Experiment: In this experiment you allow a cart