A Clinical Trial Simulation System, Its Applications, and Future Challenges. Peter Westfall, Texas Tech University Kuenhi Tsai, Merck Research Lab
|
|
|
- Crystal Shelton
- 5 years ago
- Views:
Transcription
1 A Clinical Trial Simulation System, Its Applications, and Future Challenges Peter Westfall, Texas Tech University Kuenhi Tsai, Merck Research Lab
2 Acknowledgement Major collaborators Stephan Ogenstand, Statogen Consulting Miles Dunn, Amgen Pharmaceuticals Alin Tomoiaga, Texas Tech University Other contributors Vertex colleagues Merck colleagues and reviewers PK/PD M&S Nick Holford (Univ. of Auckland, New Zealand) Ken Kowalski (A2PG)
3 Outline A CTS system CTS System overview Statistics in the system Examples of its applications Future challenges Based on Westfall et al. (2008; CTS: A statistical approach, J Biopharma Stat)
4 Out of Scope The interface system Grid computation Details about PK/PD M&S Comparison to other CTS software
5 Why a CTS System? (I) CTS on critical path Toward a better effectiveness toolkit Perform advanced clinical trial design and execution
6 Why a CTS System? (II) Complicated clinical trial issues Biomarkers and surrogate endpoints Multiple correlated endpoints Combination therapies Subgroups Uncertain dose response relationship Dropouts Noncompliance Multiple treatment arms and patient allocation Approximate statistical methods (asymptotic not valid) How long to run the study? Which statistical test(s) to use?
7 Our Goal of a CTS System To simulate realistic data sets Multiple timepoints/endpoints with flexible covariance structures Flexible mean structures and flexible distributions Complex compliance issues Informative dropout mechanisms
8 General Approach to CTS Define model and model parameters Define decision outcomes Simulate success criteria Iterate, choose optimal design/analysis criteria
9 Our Approach Input: Historical/a priori inputs, specific on PD models, multiple endpoints Applications: emphasis on phase II/III design with noncompliance and dropout mechanisms, but can be for certain Phase I designs Statistical resolutions for complicated CTS Flexible covariance structures Flexible mean structures, including natural history and placebo effects, and filter Statistical emphasis
10
11 Overview of CTS System N(0,1) variables having Kronecker correlation structure for all endpoints timepoints (latent patient data) Distribution filter: (normal, lognormal, mixture, binary, ordinal) + (means, SDs, mixing values, response rates) Simulated ideal data set with specified distribution forms Simulated observable data set Adjusted mean profile by compliance and add dropout and missing mechanism Data processing: Transformation, imputation, modeling, statistical evaluation of success criteria Simulation, optimization
12 CTS System N(0,1) variables having Kronecker correlation structure for all endpoints timepoints (latent patient data) Distribution filter: (normal, lognormal, mixture, binary, ordinal) + (means, SDs, mixing values, response rates) Simulated ideal data set with specified distribution forms Simulated observable data set Adjusted mean profile by compliance and add dropout and missing mechanism Data processing: Transformation, imputation, modeling, statistical evaluation of success criteria Simulation, optimization
13 First Simulation Process Simulate repeated measures data for patient*endpoint data Simulate correlated data with AR(1) as a carrying over effect for a patient endpoint data Construct correlations between endpoints Construct correlation for patient*endpoints Construct correlations for all patient data Efficiently simulate data with Kronecker covariance structure
14 CTS System N(0,1) variables having Kronecker correlation structure for all endpoints timepoints (latent patient data) Distribution filter: (normal, lognormal, mixture, binary, ordinal) + (means, SDs, mixing values, response rates) Simulated ideal data set with specified distribution forms Simulated observable data set Adjusted mean profile by compliance and add dropout and missing mechanism Data processing: Transformation, imputation, modeling, statistical evaluation of success criteria Simulation, optimization
15 Mean Structure M (g) Specification Inputs come from PD models Early phase data Studies on similar compounds To simplify input specify a small number of x coordinates (time points) specify means for each group, use piecewise linear interpolation
16
17 Distribution Filters All random variables are constructed from the correlated N(0,1) W s: Normal Mixture Lognormal Binary Ordinal Survival The W s are latent patient values Specific input issues for these variables
18 Mixture Distribution For each endpoint i, input contamination fraction p i, and ratio r i of contaminated to normal stddevs. 1 W igt I(U p i )W igt /(1-p i +p i r i2 ) ½ +I(U<p i )r i W igt /(1-p i +p i r i2 ) ½ Good Data 5% Contaminant Otherwise same as for normal Correlations maintained among contaminated variables with common fractions, otherwise attenuated; means and stddevs identical
19 Binary Distribution Input probabilities p igt ; thresholds are t igt =Φ -1 (1- p igt ) 0.5 W igt I( W igt >t igt ) Correlations refer to tetrachoric correlations W igt = 0 W igt = 1 0 Φ -1 (1-p igt ) -3 3
20 CTS System N(0,1) variables having Kronecker correlation structure for all endpoints timepoints (latent patient data) Distribution filter: (normal, lognormal, mixture, binary, ordinal) + (means, SDs, mixing values, response rates) Simulated ideal data set with specified distribution forms Simulated observable data set Adjusted mean profile by compliance and add dropout and missing mechanism Data processing: Transformation, imputation, modeling, statistical evaluation of success criteria Simulation, optimization
21 Dropout Mechanism 3 Safety 0 Stay in study Misery Index Drop out of study -3 Efficacy
22 Misery Indices for Dropout Local Misery indices from t-1 to t: Safety Misery Index S t = average of safety endpoints at time t Efficacy Misery Index E t = average of efficacy endpoints at time t Combined Index I t = (Safety weight)*s t + (1 Safety weight)*e t
23 Cumulative Misery Index and Dropout Cumulative misery index is determined by an exponential smoothing parameter (recency) Dropout rate is control by the threshold determined by each group Also allow non-informative dropout
24 Noncompliance A continuous measurement on the [0,1] scale Subject-specific and carryover effects Group specific Specified by median and 10 th percentile of compliance
25 Noncompliance Effect Noncompliance regresses the patient response toward natural history or placebo Allow local and global effects via an exponential smooth Allow local compliance values related to the misery index
26 CTS System N(0,1) variables having Kronecker correlation structure for all endpoints timepoints (latent patient data) Distribution filter: (normal, lognormal, mixture, binary, ordinal) + (means, SDs, mixing values, response rates) Simulated ideal data set with specified distribution forms Simulated observable data set and some outputs Adjusted mean profile by compliance and add dropout and missing mechanism Data processing: Transformation, imputation, modeling, statistical evaluation of success criteria Simulation, optimization
27 The Simulated Data Endpoints-> 1 2 p Timepoints-> 1 2 t 1 2 t 1 2 t PAT Dose 0001 Pbo Pbo High
28 Outputs Analysis Jonckheere-Terpstra trend analysis Chi-square Cochran-Armitage Cox proportional hazard analysis ANOVA or ANCOVA followed by LS means pair-wise comparison with different multiple comparison adjustments Logistics regression Display Summary of rejecting and accepting the null hypotheses Graph of power function using a series of sample sizes Summary of basic statistics Summary of simulation conditions
29 Example 1: Non-Compliance Effect Investigate the non-compliance impact on treatment effect on 3 different diseases based on published PD models or data Definition: failure of patients to take medicines in their prescribed manner
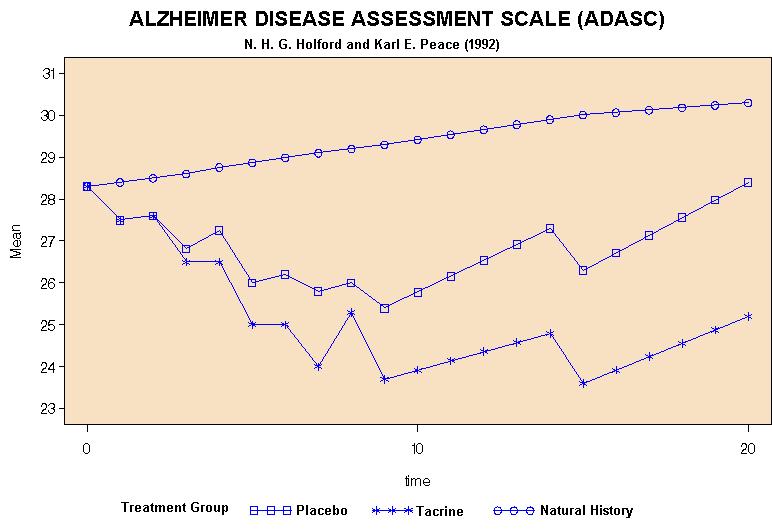
30 Characteristics and Simulation Designs of 3 Diseases Alzheimer: fast progressing disease; 2 groups (placebo and treatment), regress to natural disease, same compliance rates Rheumatoid Arthritis: slow progressing disease and strong placebo effect; 2 groups (placebo and treatment), regress to placebo, same compliance rates HIV: fast progressing and possible resistance to drug; 2 groups (QD and BID), regress to natural disease, different compliance rates
31 Results Non-compliance affects the power, but in different levels depending upon the disease progress and sample size When two groups with the same non-compliance rates, the power is reduced. Analyzing these data with the compliance as a covariate cannot reach the same power When two groups with different compliance rates and the same response rates, analyzing the data with the compliance as a covariate can reach the same power
32 Example 2: Choice of Test (O Brien or ACR20) O Brien s Test: Average-like composite of 1. Tender Joint Count 2. Swollen Joint Count 3. Patient Global Assessment 4. Investigator Global Assessment 5. Grip Strength 6. Pain 7. Erythrocyte Sedimentation Rate ACR20 = 1 if 20% improvement in (1. and 2.) and 20% improvement in 3 of (3.-7.) = 0 otherwise
33 Power Comparison Parameter settings from historical arthritis studies reported in Anderson, Bolognese, and Felson (2003), Comparison of Rheumatoid Arthritis Clinical Trial Outcome Measures, Arthritis and Rheumatism 48, Design O Brien ACR20 50, , ,
34 Example 3: Dose-Response Arthritis Study Primary Endpoint: ACR20 Control, low, mid, and high doses Expectations (control high): ACR20 Response rates: 30%, 50%, 60%, 70% Dropout rates: 5%, 10%, 15%, 20% Dose/placebo tests Chi-Square Fixed-sequence (H M L) Total number of patients = 200; how to allocate?
35 Fixed Sequence Power Design (High to control) High Dose Med Dose Low Dose 50,50,50, ,33,33, ,30,35, ,40,40, ,35,40, ,42,42,
36 Example 4: Choice of Design, Test, and Duration of Study Outlier-prone mixture distributions Want to select the appropriate test Want to select the sample size allocation Want to investigate the length of study

37 Input Response Curves
38 Power Results Type of Analysis AOV ANCOVA ANCOVA Difference Difference K-W K-W Diff Design Mean Median Mean Median Mean Median 12 wks/ 30, wks/ 50, wks/ 100, wks/ 30, wks/ 50, wks/ 100, K-W Diff
39 Clinical Trial Simulations? Peter Bonate (2007; Clinical trial simulation: theory. Phamacometrics. Edited by Ette and Williams) To think that you can simulate a process as complicated as a clinical trial simply sound crazy Simulation is nothing more than applied modeling. The principals: A model is needed Sources of variability in the model must be understood as does how those parameters are correlated Once the system is defined, an input design must be defined
40 Future Challenges Needs additional inputs from clinicians project managers, and pharmacokineticists Test misery index Incorporate complex noncompliance issues Limited by piece wise linear models Increase segments for continuous models
41 Future Challenges Constrained by PD empirical inputs Required good PD models Early stage trial simulations may rely on PK/PD models May use confirmed covariates and its associated variation from PopPK to construct the input model Hu and Zhou (2008; J Clin Pharmacol ) Constant standard deviation input may not be held

42 Fast plasma glucose vs time (Winter et al 2006; J PK PD)
43 Future Challenges Input information has to be well estimated before entering the simulations May be hard to get good estimations for all the correlations
44 Conclusions Illustrate complex statistical considerations and their resolutions in CTS Demonstrate wide applications with a CTS system Face future challenges
Generalizing the MCPMod methodology beyond normal, independent data
 Generalizing the MCPMod methodology beyond normal, independent data José Pinheiro Joint work with Frank Bretz and Björn Bornkamp Novartis AG Trends and Innovations in Clinical Trial Statistics Conference
Sample Size Determination
 Sample Size Determination 018 The number of subjects in a clinical study should always be large enough to provide a reliable answer to the question(s addressed. The sample size is usually determined by
Dose-response modeling with bivariate binary data under model uncertainty
 Dose-response modeling with bivariate binary data under model uncertainty Bernhard Klingenberg 1 1 Department of Mathematics and Statistics, Williams College, Williamstown, MA, 01267 and Institute of Statistics,
The Design of a Survival Study
 The Design of a Survival Study The design of survival studies are usually based on the logrank test, and sometimes assumes the exponential distribution. As in standard designs, the power depends on The
APPENDIX B Sample-Size Calculation Methods: Classical Design
 APPENDIX B Sample-Size Calculation Methods: Classical Design One/Paired - Sample Hypothesis Test for the Mean Sign test for median difference for a paired sample Wilcoxon signed - rank test for one or
Generalizing the MCPMod methodology beyond normal, independent data
 Generalizing the MCPMod methodology beyond normal, independent data José Pinheiro Joint work with Frank Bretz and Björn Bornkamp Novartis AG ASA NJ Chapter 35 th Annual Spring Symposium June 06, 2014 Outline
Interim Monitoring of Clinical Trials: Decision Theory, Dynamic Programming. and Optimal Stopping
 Interim Monitoring of Clinical Trials: Decision Theory, Dynamic Programming and Optimal Stopping Christopher Jennison Department of Mathematical Sciences, University of Bath, UK http://people.bath.ac.uk/mascj
Modeling & Simulation to Improve the Design of Clinical Trials
 Modeling & Simulation to Improve the Design of Clinical Trials Gary L. Rosner Oncology Biostatistics and Bioinformatics The Sidney Kimmel Comprehensive Cancer Center at Johns Hopkins Joint work with Lorenzo
Two-stage Adaptive Randomization for Delayed Response in Clinical Trials
 Two-stage Adaptive Randomization for Delayed Response in Clinical Trials Guosheng Yin Department of Statistics and Actuarial Science The University of Hong Kong Joint work with J. Xu PSI and RSS Journal
Prerequisite: STATS 7 or STATS 8 or AP90 or (STATS 120A and STATS 120B and STATS 120C). AP90 with a minimum score of 3
. AP90 with a minimum score of 3") University of California, Irvine 2017-2018 1 Statistics (STATS) Courses STATS 5. Seminar in Data Science. 1 Unit. An introduction to the field of Data Science; intended for entering freshman and transfers.
University of California, Irvine 2017-2018 1 Statistics (STATS) Courses STATS 5. Seminar in Data Science. 1 Unit. An introduction to the field of Data Science; intended for entering freshman and transfers.
Optimising Group Sequential Designs. Decision Theory, Dynamic Programming. and Optimal Stopping
 : Decision Theory, Dynamic Programming and Optimal Stopping Christopher Jennison Department of Mathematical Sciences, University of Bath, UK http://people.bath.ac.uk/mascj InSPiRe Conference on Methodology
An Overview of Methods for Applying Semi-Markov Processes in Biostatistics.
 An Overview of Methods for Applying Semi-Markov Processes in Biostatistics. Charles J. Mode Department of Mathematics and Computer Science Drexel University Philadelphia, PA 19104 Overview of Topics. I.
Type I error rate control in adaptive designs for confirmatory clinical trials with treatment selection at interim
 Type I error rate control in adaptive designs for confirmatory clinical trials with treatment selection at interim Frank Bretz Statistical Methodology, Novartis Joint work with Martin Posch (Medical University
Causal Hazard Ratio Estimation By Instrumental Variables or Principal Stratification. Todd MacKenzie, PhD
 Causal Hazard Ratio Estimation By Instrumental Variables or Principal Stratification Todd MacKenzie, PhD Collaborators A. James O Malley Tor Tosteson Therese Stukel 2 Overview 1. Instrumental variable
Use of frequentist and Bayesian approaches for extrapolating from adult efficacy data to design and interpret confirmatory trials in children
 Use of frequentist and Bayesian approaches for extrapolating from adult efficacy data to design and interpret confirmatory trials in children Lisa Hampson, Franz Koenig and Martin Posch Department of Mathematics
Application of Time-to-Event Methods in the Assessment of Safety in Clinical Trials
 Application of Time-to-Event Methods in the Assessment of Safety in Clinical Trials Progress, Updates, Problems William Jen Hoe Koh May 9, 2013 Overview Marginal vs Conditional What is TMLE? Key Estimation
PubH 7470: STATISTICS FOR TRANSLATIONAL & CLINICAL RESEARCH
 PubH 7470: STATISTICS FOR TRANSLATIONAL & CLINICAL RESEARCH The First Step: SAMPLE SIZE DETERMINATION THE ULTIMATE GOAL The most important, ultimate step of any of clinical research is to do draw inferences;
Individualized Treatment Effects with Censored Data via Nonparametric Accelerated Failure Time Models
 Individualized Treatment Effects with Censored Data via Nonparametric Accelerated Failure Time Models Nicholas C. Henderson Thomas A. Louis Gary Rosner Ravi Varadhan Johns Hopkins University July 31, 2018
Lecture 7 Time-dependent Covariates in Cox Regression
 Lecture 7 Time-dependent Covariates in Cox Regression So far, we ve been considering the following Cox PH model: λ(t Z) = λ 0 (t) exp(β Z) = λ 0 (t) exp( β j Z j ) where β j is the parameter for the the
Case Study in the Use of Bayesian Hierarchical Modeling and Simulation for Design and Analysis of a Clinical Trial
 Case Study in the Use of Bayesian Hierarchical Modeling and Simulation for Design and Analysis of a Clinical Trial William R. Gillespie Pharsight Corporation Cary, North Carolina, USA PAGE 2003 Verona,
Power and Sample Size Calculations with the Additive Hazards Model
 Journal of Data Science 10(2012), 143-155 Power and Sample Size Calculations with the Additive Hazards Model Ling Chen, Chengjie Xiong, J. Philip Miller and Feng Gao Washington University School of Medicine
Practical issues related to the use of biomarkers in a seamless Phase II/III design
 Practical issues related to the use of biomarkers in a seamless Phase II/III design Tomasz Burzykowski International Drug Development Institute Louvain-la-Neuve, Belgium tomasz.burzykowski@iddi.be www.iddi.com
A Bayesian Nonparametric Approach to Monotone Missing Data in Longitudinal Studies with Informative Missingness
 A Bayesian Nonparametric Approach to Monotone Missing Data in Longitudinal Studies with Informative Missingness A. Linero and M. Daniels UF, UT-Austin SRC 2014, Galveston, TX 1 Background 2 Working model
Statistical Methods for Alzheimer s Disease Studies
 Statistical Methods for Alzheimer s Disease Studies Rebecca A. Betensky, Ph.D. Department of Biostatistics, Harvard T.H. Chan School of Public Health July 19, 2016 1/37 OUTLINE 1 Statistical collaborations
Turning a research question into a statistical question.
 Turning a research question into a statistical question. IGINAL QUESTION: Concept Concept Concept ABOUT ONE CONCEPT ABOUT RELATIONSHIPS BETWEEN CONCEPTS TYPE OF QUESTION: DESCRIBE what s going on? DECIDE
DEALING WITH MULTIVARIATE OUTCOMES IN STUDIES FOR CAUSAL EFFECTS
 DEALING WITH MULTIVARIATE OUTCOMES IN STUDIES FOR CAUSAL EFFECTS Donald B. Rubin Harvard University 1 Oxford Street, 7th Floor Cambridge, MA 02138 USA Tel: 617-495-5496; Fax: 617-496-8057 email: rubin@stat.harvard.edu
BMA-Mod : A Bayesian Model Averaging Strategy for Determining Dose-Response Relationships in the Presence of Model Uncertainty
 BMA-Mod : A Bayesian Model Averaging Strategy for Determining -Response Relationships in the Presence of Model Uncertainty A. Lawrence Gould KOL 20 October, 2017 Overview and Motivation -Response Trials
Approximation of Survival Function by Taylor Series for General Partly Interval Censored Data
 Malaysian Journal of Mathematical Sciences 11(3): 33 315 (217) MALAYSIAN JOURNAL OF MATHEMATICAL SCIENCES Journal homepage: http://einspem.upm.edu.my/journal Approximation of Survival Function by Taylor
Global Sensitivity Analysis for Repeated Measures Studies with Informative Drop-out: A Semi-Parametric Approach
 Global for Repeated Measures Studies with Informative Drop-out: A Semi-Parametric Approach Daniel Aidan McDermott Ivan Diaz Johns Hopkins University Ibrahim Turkoz Janssen Research and Development September
Hierarchical expectation propagation for Bayesian aggregation of average data
 Hierarchical expectation propagation for Bayesian aggregation of average data Andrew Gelman, Columbia University Sebastian Weber, Novartis also Bob Carpenter, Daniel Lee, Frédéric Bois, Aki Vehtari, and
An extrapolation framework to specify requirements for drug development in children
 An framework to specify requirements for drug development in children Martin Posch joint work with Gerald Hlavin Franz König Christoph Male Peter Bauer Medical University of Vienna Clinical Trials in Small
Biost 518 Applied Biostatistics II. Purpose of Statistics. First Stage of Scientific Investigation. Further Stages of Scientific Investigation
 Biost 58 Applied Biostatistics II Scott S. Emerson, M.D., Ph.D. Professor of Biostatistics University of Washington Lecture 5: Review Purpose of Statistics Statistics is about science (Science in the broadest
Comparison of several analysis methods for recurrent event data for dierent estimands
 Comparison of several analysis methods for recurrent event data for dierent estimands Master Thesis presented to the Department of Economics at the Georg-August-University Göttingen with a working time
Two-stage k-sample designs for the ordered alternative problem
 Two-stage k-sample designs for the ordered alternative problem Guogen Shan, Alan D. Hutson, and Gregory E. Wilding Department of Biostatistics,University at Buffalo, Buffalo, NY 14214, USA July 18, 2011
Correction of the likelihood function as an alternative for imputing missing covariates. Wojciech Krzyzanski and An Vermeulen PAGE 2017 Budapest
 Correction of the likelihood function as an alternative for imputing missing covariates Wojciech Krzyzanski and An Vermeulen PAGE 2017 Budapest 1 Covariates in Population PKPD Analysis Covariates are defined
Results of a simulation of modeling and nonparametric methodology for count data (from patient diary) in drug studies
 in drug studies") Results of a simulation of modeling and nonparametric methodology for count data (from patient diary) in drug studies Erhard Quebe-Fehling Workshop Stat. Methoden für korrelierte Daten Bochum 24-Nov-06
Results of a simulation of modeling and nonparametric methodology for count data (from patient diary) in drug studies Erhard Quebe-Fehling Workshop Stat. Methoden für korrelierte Daten Bochum 24-Nov-06
Bayesian Nonparametric Accelerated Failure Time Models for Analyzing Heterogeneous Treatment Effects
 Bayesian Nonparametric Accelerated Failure Time Models for Analyzing Heterogeneous Treatment Effects Nicholas C. Henderson Thomas A. Louis Gary Rosner Ravi Varadhan Johns Hopkins University September 28,
Multiple Imputation of Missing Composite Outcomes in Longitudinal Data
 Stat Biosci (2016) 8:310 332 DOI 10.1007/s12561-016-9146-z Multiple Imputation of Missing Composite Outcomes in Longitudinal Data Aidan G. O Keeffe 1 Daniel M. Farewell 2 Brian D. M. Tom 3 Vernon T. Farewell
Statistics in medicine
 Statistics in medicine Lecture 4: and multivariable regression Fatma Shebl, MD, MS, MPH, PhD Assistant Professor Chronic Disease Epidemiology Department Yale School of Public Health Fatma.shebl@yale.edu
Valida&on of Predic&ve Classifiers
 Valida&on of Predic&ve Classifiers 1! Predic&ve Biomarker Classifiers In most posi&ve clinical trials, only a small propor&on of the eligible popula&on benefits from the new rx Many chronic diseases are
Technical Manual. 1 Introduction. 1.1 Version. 1.2 Developer
 Technical Manual 1 Introduction 1 2 TraditionalSampleSize module: Analytical calculations in fixed-sample trials 3 3 TraditionalSimulations module: Simulation-based calculations in fixed-sample trials
Analysis of Incomplete Non-Normal Longitudinal Lipid Data
 Analysis of Incomplete Non-Normal Longitudinal Lipid Data Jiajun Liu*, Devan V. Mehrotra, Xiaoming Li, and Kaifeng Lu 2 Merck Research Laboratories, PA/NJ 2 Forrest Laboratories, NY *jiajun_liu@merck.com
Practice of SAS Logistic Regression on Binary Pharmacodynamic Data Problems and Solutions. Alan J Xiao, Cognigen Corporation, Buffalo NY
 Practice of SAS Logistic Regression on Binary Pharmacodynamic Data Problems and Solutions Alan J Xiao, Cognigen Corporation, Buffalo NY ABSTRACT Logistic regression has been widely applied to population
Sample Size Calculations
 Sample Size Calculations Analyses rely on means rather than individual values Means are more precise Precision measured by σ n So precision depends on n This can be used, directly or indirectly, as a basis
Group Sequential Designs: Theory, Computation and Optimisation
 Group Sequential Designs: Theory, Computation and Optimisation Christopher Jennison Department of Mathematical Sciences, University of Bath, UK http://people.bath.ac.uk/mascj 8th International Conference
Bios 6649: Clinical Trials - Statistical Design and Monitoring
 Bios 6649: Clinical Trials - Statistical Design and Monitoring Spring Semester 2015 John M. Kittelson Department of Biostatistics & Informatics Colorado School of Public Health University of Colorado Denver
Group Sequential Trial with a Biomarker Subpopulation
 Group Sequential Trial with a Biomarker Subpopulation Ting-Yu (Jeff) Chen, Jing Zhao, Linda Sun and Keaven Anderson ASA Biopharm Workshop, Sep 13th. 2018 1 Outline Motivation: Phase III PD-L1/PD-1 Monotherapy
Consider Table 1 (Note connection to start-stop process).
.") Discrete-Time Data and Models Discretized duration data are still duration data! Consider Table 1 (Note connection to start-stop process). Table 1: Example of Discrete-Time Event History Data Case Event
Discrete-Time Data and Models Discretized duration data are still duration data! Consider Table 1 (Note connection to start-stop process). Table 1: Example of Discrete-Time Event History Data Case Event
Improving Efficiency of Inferences in Randomized Clinical Trials Using Auxiliary Covariates
 Improving Efficiency of Inferences in Randomized Clinical Trials Using Auxiliary Covariates Anastasios (Butch) Tsiatis Department of Statistics North Carolina State University http://www.stat.ncsu.edu/
Variable selection and machine learning methods in causal inference
 Variable selection and machine learning methods in causal inference Debashis Ghosh Department of Biostatistics and Informatics Colorado School of Public Health Joint work with Yeying Zhu, University of
Superchain Procedures in Clinical Trials. George Kordzakhia FDA, CDER, Office of Biostatistics Alex Dmitrienko Quintiles Innovation
 August 01, 2012 Disclaimer: This presentation reflects the views of the author and should not be construed to represent the views or policies of the U.S. Food and Drug Administration Introduction We describe
Statistics Boot Camp. Dr. Stephanie Lane Institute for Defense Analyses DATAWorks 2018
 Statistics Boot Camp Dr. Stephanie Lane Institute for Defense Analyses DATAWorks 2018 March 21, 2018 Outline of boot camp Summarizing and simplifying data Point and interval estimation Foundations of statistical
Survival Analysis. Lu Tian and Richard Olshen Stanford University
 1 Survival Analysis Lu Tian and Richard Olshen Stanford University 2 Survival Time/ Failure Time/Event Time We will introduce various statistical methods for analyzing survival outcomes What is the survival
Estimating the Mean Response of Treatment Duration Regimes in an Observational Study. Anastasios A. Tsiatis.
 Estimating the Mean Response of Treatment Duration Regimes in an Observational Study Anastasios A. Tsiatis http://www.stat.ncsu.edu/ tsiatis/ Introduction to Dynamic Treatment Regimes 1 Outline Description
Tests for the Odds Ratio of Two Proportions in a 2x2 Cross-Over Design
 Chapter 170 Tests for the Odds Ratio of Two Proportions in a 2x2 Cross-Over Design Introduction Senn (2002) defines a cross-over design as one in which each subject receives all treatments and the objective
Introduction to Empirical Processes and Semiparametric Inference Lecture 01: Introduction and Overview
 Introduction to Empirical Processes and Semiparametric Inference Lecture 01: Introduction and Overview Michael R. Kosorok, Ph.D. Professor and Chair of Biostatistics Professor of Statistics and Operations
Sample Size and Power I: Binary Outcomes. James Ware, PhD Harvard School of Public Health Boston, MA
 Sample Size and Power I: Binary Outcomes James Ware, PhD Harvard School of Public Health Boston, MA Sample Size and Power Principles: Sample size calculations are an essential part of study design Consider
Adaptive clinical trials with subgroup selection
 Adaptive clinical trials with subgroup selection Nigel Stallard 1, Tim Friede 2, Nick Parsons 1 1 Warwick Medical School, University of Warwick, Coventry, UK 2 University Medical Center Göttingen, Göttingen,
Pubh 8482: Sequential Analysis
 Pubh 8482: Sequential Analysis Joseph S. Koopmeiners Division of Biostatistics University of Minnesota Week 10 Class Summary Last time... We began our discussion of adaptive clinical trials Specifically,
The SEQDESIGN Procedure
 SAS/STAT 9.2 User s Guide, Second Edition The SEQDESIGN Procedure (Book Excerpt) This document is an individual chapter from the SAS/STAT 9.2 User s Guide, Second Edition. The correct bibliographic citation
Discussion of Identifiability and Estimation of Causal Effects in Randomized. Trials with Noncompliance and Completely Non-ignorable Missing Data
 Biometrics 000, 000 000 DOI: 000 000 0000 Discussion of Identifiability and Estimation of Causal Effects in Randomized Trials with Noncompliance and Completely Non-ignorable Missing Data Dylan S. Small
Adaptive Treatment Selection with Survival Endpoints
 Adaptive Treatment Selection with Survival Endpoints Gernot Wassmer Institut für Medizinische Statisti, Informati und Epidemiologie Universität zu Köln Joint wor with Marus Roters, Omnicare Clinical Research,
Analysis of Categorical Data. Nick Jackson University of Southern California Department of Psychology 10/11/2013
 Analysis of Categorical Data Nick Jackson University of Southern California Department of Psychology 10/11/2013 1 Overview Data Types Contingency Tables Logit Models Binomial Ordinal Nominal 2 Things not
Subgroup analysis using regression modeling multiple regression. Aeilko H Zwinderman
 Subgroup analysis using regression modeling multiple regression Aeilko H Zwinderman who has unusual large response? Is such occurrence associated with subgroups of patients? such question is hypothesis-generating:
Robustifying Trial-Derived Treatment Rules to a Target Population
 1/ 39 Robustifying Trial-Derived Treatment Rules to a Target Population Yingqi Zhao Public Health Sciences Division Fred Hutchinson Cancer Research Center Workshop on Perspectives and Analysis for Personalized
Bios 6649: Clinical Trials - Statistical Design and Monitoring
 Bios 6649: Clinical Trials - Statistical Design and Monitoring Spring Semester 2015 John M. Kittelson Department of Biostatistics & Informatics Colorado School of Public Health University of Colorado Denver
Test Strategies for Experiments with a Binary Response and Single Stress Factor Best Practice
 Test Strategies for Experiments with a Binary Response and Single Stress Factor Best Practice Authored by: Sarah Burke, PhD Lenny Truett, PhD 15 June 2017 The goal of the STAT COE is to assist in developing
Course Introduction and Overview Descriptive Statistics Conceptualizations of Variance Review of the General Linear Model
 Course Introduction and Overview Descriptive Statistics Conceptualizations of Variance Review of the General Linear Model EPSY 905: Multivariate Analysis Lecture 1 20 January 2016 EPSY 905: Lecture 1 -
Robust design in model-based analysis of longitudinal clinical data
 Robust design in model-based analysis of longitudinal clinical data Giulia Lestini, Sebastian Ueckert, France Mentré IAME UMR 1137, INSERM, University Paris Diderot, France PODE, June 0 016 Context Optimal
Estimation in Flexible Adaptive Designs
 Estimation in Flexible Adaptive Designs Werner Brannath Section of Medical Statistics Core Unit for Medical Statistics and Informatics Medical University of Vienna BBS and EFSPI Scientific Seminar on Adaptive
Bayesian concept for combined Phase 2a/b trials
 Bayesian concept for combined Phase 2a/b trials /////////// Stefan Klein 07/12/2018 Agenda Phase 2a: PoC studies Phase 2b: dose finding studies Simulation Results / Discussion 2 /// Bayer /// Bayesian
Adaptive designs beyond p-value combination methods. Ekkehard Glimm, Novartis Pharma EAST user group meeting Basel, 31 May 2013
 Adaptive designs beyond p-value combination methods Ekkehard Glimm, Novartis Pharma EAST user group meeting Basel, 31 May 2013 Outline Introduction Combination-p-value method and conditional error function
BIOL 51A - Biostatistics 1 1. Lecture 1: Intro to Biostatistics. Smoking: hazardous? FEV (l) Smoke
 Smoke") BIOL 51A - Biostatistics 1 1 Lecture 1: Intro to Biostatistics Smoking: hazardous? FEV (l) 1 2 3 4 5 No Yes Smoke BIOL 51A - Biostatistics 1 2 Box Plot a.k.a box-and-whisker diagram or candlestick chart
BIOL 51A - Biostatistics 1 1 Lecture 1: Intro to Biostatistics Smoking: hazardous? FEV (l) 1 2 3 4 5 No Yes Smoke BIOL 51A - Biostatistics 1 2 Box Plot a.k.a box-and-whisker diagram or candlestick chart
Course Introduction and Overview Descriptive Statistics Conceptualizations of Variance Review of the General Linear Model
 Course Introduction and Overview Descriptive Statistics Conceptualizations of Variance Review of the General Linear Model PSYC 943 (930): Fundamentals of Multivariate Modeling Lecture 1: August 22, 2012
Course Review. Kin 304W Week 14: April 9, 2013
 Course Review Kin 304W Week 14: April 9, 2013 1 Today s Outline Format of Kin 304W Final Exam Course Review Hand back marked Project Part II 2 Kin 304W Final Exam Saturday, Thursday, April 18, 3:30-6:30
Adaptive Designs: Why, How and When?
 Adaptive Designs: Why, How and When? Christopher Jennison Department of Mathematical Sciences, University of Bath, UK http://people.bath.ac.uk/mascj ISBS Conference Shanghai, July 2008 1 Adaptive designs:
Compare Predicted Counts between Groups of Zero Truncated Poisson Regression Model based on Recycled Predictions Method
 Compare Predicted Counts between Groups of Zero Truncated Poisson Regression Model based on Recycled Predictions Method Yan Wang 1, Michael Ong 2, Honghu Liu 1,2,3 1 Department of Biostatistics, UCLA School
Implementing Response-Adaptive Randomization in Multi-Armed Survival Trials
 Implementing Response-Adaptive Randomization in Multi-Armed Survival Trials BASS Conference 2009 Alex Sverdlov, Bristol-Myers Squibb A.Sverdlov (B-MS) Response-Adaptive Randomization 1 / 35 Joint work
An Alternative Algorithm for Classification Based on Robust Mahalanobis Distance
 Dhaka Univ. J. Sci. 61(1): 81-85, 2013 (January) An Alternative Algorithm for Classification Based on Robust Mahalanobis Distance A. H. Sajib, A. Z. M. Shafiullah 1 and A. H. Sumon Department of Statistics,
Binomial Model. Lecture 10: Introduction to Logistic Regression. Logistic Regression. Binomial Distribution. n independent trials
 Lecture : Introduction to Logistic Regression Ani Manichaikul amanicha@jhsph.edu 2 May 27 Binomial Model n independent trials (e.g., coin tosses) p = probability of success on each trial (e.g., p =! =
Guideline on adjustment for baseline covariates in clinical trials
 26 February 2015 EMA/CHMP/295050/2013 Committee for Medicinal Products for Human Use (CHMP) Guideline on adjustment for baseline covariates in clinical trials Draft Agreed by Biostatistics Working Party
Probabilistic Index Models
 Probabilistic Index Models Jan De Neve Department of Data Analysis Ghent University M3 Storrs, Conneticut, USA May 23, 2017 Jan.DeNeve@UGent.be 1 / 37 Introduction 2 / 37 Introduction to Probabilistic
6 Sample Size Calculations
 6 Sample Size Calculations A major responsibility of a statistician: sample size calculation. Hypothesis Testing: compare treatment 1 (new treatment) to treatment 2 (standard treatment); Assume continuous
Lecture 10: Introduction to Logistic Regression
 Lecture 10: Introduction to Logistic Regression Ani Manichaikul amanicha@jhsph.edu 2 May 2007 Logistic Regression Regression for a response variable that follows a binomial distribution Recall the binomial
Statistics in medicine
 Statistics in medicine Lecture 3: Bivariate association : Categorical variables Proportion in one group One group is measured one time: z test Use the z distribution as an approximation to the binomial
10 Introduction to Reliability
 0 Introduction to Reliability 10 Introduction to Reliability The following notes are based on Volume 6: How to Analyze Reliability Data, by Wayne Nelson (1993), ASQC Press. When considering the reliability
Effect of investigator bias on the significance level of the Wilcoxon rank-sum test
 Biostatistics 000, 1, 1,pp. 107 111 Printed in Great Britain Effect of investigator bias on the significance level of the Wilcoxon rank-sum test PAUL DELUCCA Biometrician, Merck & Co., Inc., 1 Walnut Grove
Prentice Hall Stats: Modeling the World 2004 (Bock) Correlated to: National Advanced Placement (AP) Statistics Course Outline (Grades 9-12)
 Correlated to: National Advanced Placement (AP) Statistics Course Outline (Grades 9-12)") National Advanced Placement (AP) Statistics Course Outline (Grades 9-12) Following is an outline of the major topics covered by the AP Statistics Examination. The ordering here is intended to define the
National Advanced Placement (AP) Statistics Course Outline (Grades 9-12) Following is an outline of the major topics covered by the AP Statistics Examination. The ordering here is intended to define the
Multivariate Survival Analysis
 Multivariate Survival Analysis Previously we have assumed that either (X i, δ i ) or (X i, δ i, Z i ), i = 1,..., n, are i.i.d.. This may not always be the case. Multivariate survival data can arise in
CHL 5225H Advanced Statistical Methods for Clinical Trials: Multiplicity
 CHL 5225H Advanced Statistical Methods for Clinical Trials: Multiplicity Prof. Kevin E. Thorpe Dept. of Public Health Sciences University of Toronto Objectives 1. Be able to distinguish among the various
McGill University. Faculty of Science MATH 204 PRINCIPLES OF STATISTICS II. Final Examination
 McGill University Faculty of Science MATH 204 PRINCIPLES OF STATISTICS II Final Examination Date: 20th April 2009 Time: 9am-2pm Examiner: Dr David A Stephens Associate Examiner: Dr Russell Steele Please
Personalized Treatment Selection Based on Randomized Clinical Trials. Tianxi Cai Department of Biostatistics Harvard School of Public Health
 Personalized Treatment Selection Based on Randomized Clinical Trials Tianxi Cai Department of Biostatistics Harvard School of Public Health Outline Motivation A systematic approach to separating subpopulations
Data Analysis as a Decision Making Process
 Data Analysis as a Decision Making Process I. Levels of Measurement A. NOIR - Nominal Categories with names - Ordinal Categories with names and a logical order - Intervals Numerical Scale with logically
Extending causal inferences from a randomized trial to a target population
 Extending causal inferences from a randomized trial to a target population Issa Dahabreh Center for Evidence Synthesis in Health, Brown University issa dahabreh@brown.edu January 16, 2019 Issa Dahabreh
9/12/17. Types of learning. Modeling data. Supervised learning: Classification. Supervised learning: Regression. Unsupervised learning: Clustering
 Types of learning Modeling data Supervised: we know input and targets Goal is to learn a model that, given input data, accurately predicts target data Unsupervised: we know the input only and want to make
Fundamentals to Biostatistics. Prof. Chandan Chakraborty Associate Professor School of Medical Science & Technology IIT Kharagpur
 Fundamentals to Biostatistics Prof. Chandan Chakraborty Associate Professor School of Medical Science & Technology IIT Kharagpur Statistics collection, analysis, interpretation of data development of new
BIOS 312: Precision of Statistical Inference
 and Power/Sample Size and Standard Errors BIOS 312: of Statistical Inference Chris Slaughter Department of Biostatistics, Vanderbilt University School of Medicine January 3, 2013 Outline Overview and Power/Sample
Statistical Methods in Clinical Trials Categorical Data
 Statistical Methods in Clinical Trials Categorical Data Types of Data quantitative Continuous Blood pressure Time to event Categorical sex qualitative Discrete No of relapses Ordered Categorical Pain level
Experimental Design and Data Analysis for Biologists
 Experimental Design and Data Analysis for Biologists Gerry P. Quinn Monash University Michael J. Keough University of Melbourne CAMBRIDGE UNIVERSITY PRESS Contents Preface page xv I I Introduction 1 1.1
Understanding the Individual Contributions to Multivariate Outliers in Assessments of Data Quality
 Understanding the Individual Contributions to Multivariate Outliers in Assessments of Data Quality Richard C. Zink, Ph.D. Senior Director, Data Management and Statistics TARGET PharmaSolutions Inc. rzink@targetpharmasolutions.com