Course Introduction and Overview Descriptive Statistics Conceptualizations of Variance Review of the General Linear Model
|
|
|
- Dorthy Hodges
- 6 years ago
- Views:
Transcription
1 Course Introduction and Overview Descriptive Statistics Conceptualizations of Variance Review of the General Linear Model PSYC 943 (930): Fundamentals of Multivariate Modeling Lecture 1: August 22, 2012 PSYC 943: Lecture 1
2 Today s Class Course Introduction and Overview Descriptive Statistics Conceptualizations of Variance and Covariance Review of the General Linear Model PSYC 943: Lecture 1 2
3 COURSE OVERVIEW PSYC 943: Lecture 1 3


4 Guiding Principles for PSYC 943 #1 of 3: Blocks #1. If you understand the building blocks of a model, you can build anything! PSYC 943: Lecture 1 4
5 4 (or 5*) Model Building Blocks 1. Linear models (for effects of predictors) 2. Link functions (for anything not normal) 3a*. Random effects (for describing dependency = 944) 3b*. Latent variables (for measurement models = 948) 4. Estimation (e.g., Maximum Likelihood, Bayesian) * These are really the same thing. PSYC 943: Lecture 1 5
")

6 Principles #2 of 3 The Journey is Part of the Destination Not just blocks; Not just a journey in 943 you will learn: Generalized models (ANOVA with non normal outcomes) Missing data (impute ) Path models Mediation and moderation Testing complex hypotheses involving observed variables Bayesian Likelihood based methods PSYC 943: Lecture 1 6


7 Guiding Principles for PSYC 943 the Bridge: #3 of 3 A bridge between what you know now and advanced statistical methods PSYC 943: Lecture 1 7
8 Motivation for Course Content The goal of this course is to provide you with a fundamental understanding of the underpinnings of the most commonly used contemporary statistical models The course is a combination of topics, picked to make your experience more extendable beyond coursework Some topics are math/statistics heavy Mathematical statistics for the social sciences Upon completion of the course, you will be able to understand the communalities that link methods PSYC 943: Lecture 1 8
9 Course Structure (from the syllabus) Course format is all lecture based No dedicated lab days; Office hours held in labs Ten homework assignments (8 points each; 80 points) About one week to complete (Thursday Tuesday, usually) Online format ( Questions: data analysis, interpretation (mad libs), some question and answer Late penalty: 3 points regardless of time Take home final exam (20 points) Administered in mid November Optional first draft submitted for comments two weeks later Final draft due last week of finals PSYC 943: Lecture 1 9
10 Lecture Format Mix of theory and examples with data and syntax Software: mainly SAS to start; Mplus later in the semester Maybe some SPSS where applicable Last 10 minutes of class time: homework questions and general discussion Topical questions are welcomed and encouraged during class PSYC 943: Lecture 1 10
11 REVIEW: BASIC STATISTICAL TOPICS PSYC 943: Lecture 1 11
12 Data for Today s Lecture To help demonstrate the concepts of today s lecture, we will be using a data set with three variables Female (Gender): Male (=0) or Female (=1) Height in inches Weight in pounds The end point of our lecture will be to build a linear model that predicts a person s weight Linear model: a statistical model for an outcome that uses a linear combination (a weighted sum; weighted by a slope) of one or more predictor variables PSYC 943: Lecture 1 12
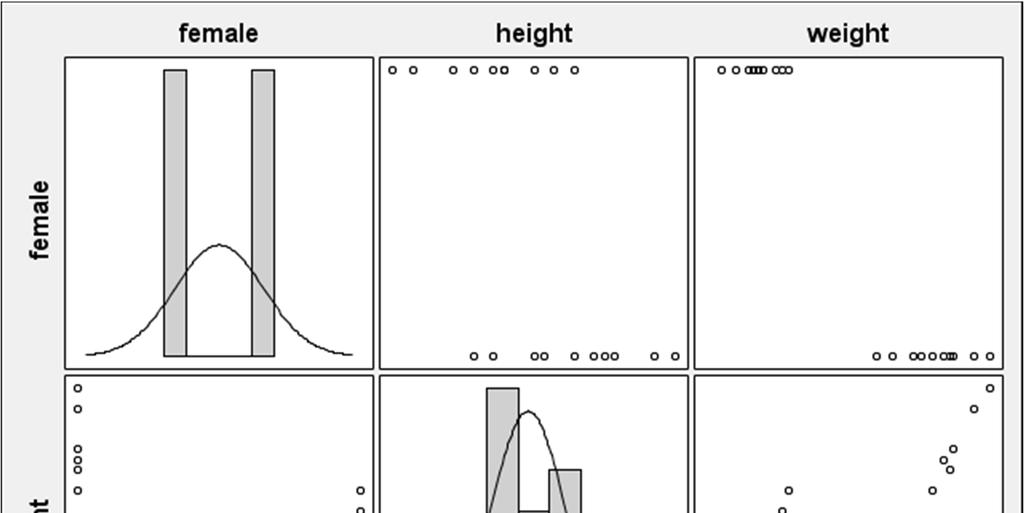

13 Visualizing the Data PSYC 943: Lecture 1 13

 PSYC 943:")
14 Upon Further Inspection: Weight The weight variable seems to be bimodal should that bother you? (hint: it shouldn t yet) PSYC 943: Lecture 1 14
15 Descriptive Statistics We can summarize each variable marginally through a set of descriptive statistics Marginal: one variable by itself Common marginal descriptive statistics: Central tendency: Mean, Median, Mode Variability: Standard deviation (variance), range We can also summarize the joint (bivariate) distribution of two variables through a set of descriptive statistics: Joint distribution: more than one variable simultaneously Common bivariate descriptive statistics: Correlation and covariance PSYC 943: Lecture 1 15
16 Descriptive Statistics for Height/Weight Data Variable Mean SD Variance Height Weight , Female Diagonal: Variance Above Diagonal: Covariance Correlation /Covariance Height Weight Female Height Weight.798 3, Female Below Diagonal: Correlation PSYC 943: Lecture 1 16
17 Re examining the Concept of Variance Variability is a central concept in advanced statistics In multivariate statistics, covariance is also central Two formulas for the variance (about the same when N is large): Here: = person; 1 = variable number one Unbiased or sample Biased/ML or population PSYC 943: Lecture 1 17
18 Interpretation of Variance The variance describes the spread of a variable in squared units (which come from the term in the equation) Variance: the average squared distance of an observation from the mean Variance of Height: inches squared Variance of Weight: 3, inches squared Variance of Female not applicable in the same way! Because squared units are difficult to work with, we typically use the standard deviation which is reported in units Standard deviation: the average distance of an observation from the mean SD of Height: 7.44 inches SD of Weight: inches PSYC 943: Lecture 1 18
19 Variance/SD as a More General Statistical Concept Variance (and the standard deviation) is a concept that is applied across statistics not just for data Statistical parameters have variance e.g. The sample mean has a standard error (SE) of The standard error is another name for standard deviation So standard error of the mean is equivalent to standard deviation of the mean Usually error refers to parameters; deviation refers to data Variance of the mean would be More generally, variance = error You can think about the SE of the mean as telling you how far off the mean is for describing the data PSYC 943: Lecture 1 19
20 Correlation of Variables Moving from marginal summaries of each variable to joint (bivariate) summaries, the Pearson correlation is often used to describe the association between a pair of variables:, The correlation is unitless as it ranges from 1 to 1 for continuous variables, regardless of their variances Pearson correlation of binary/categorical variables with continuous variables is called a point biserial (same formula) Pearson correlation of binary/categorical variables with other binary/categorical variables has bounds within 1 and 1 PSYC 943: Lecture 1 20
21 More on the Correlation Coefficient The Pearson correlation is a biased estimator Biased estimator: the expected value differs from the true value for a statistic Other biased estimators: Variance/SD when is used The unbiased correlation estimate would be:,,, As N gets large bias goes away; Bias is largest when, 0 Pearson is an underestimate of true correlation If it is biased, then why does everyone use it anyway? Answer: forthcoming when we talk about (ML) estimation PSYC 943: Lecture 1 21
22 Covariance of Variables: Association with Units The numerator of the correlation coefficient is the covariance of a pair of variables:, 1 1, 1 The covariance uses the units of the original variables (but now they are multiples): Covariance of height and weight: inch pounds The covariance of a variable with itself is the variance Unbiased or sample Biased/ML or population The covariance is often used in multivariate analyses because it ties directly into multivariate distributions But covariance and correlation are easy to switch between PSYC 943: Lecture 1 22
23 Going from Covariance to Correlation If you have the covariance matrix (variances and covariances):,, If you have the correlation matrix and the standard deviations:,, PSYC 943: Lecture 1 23
24 THE GENERAL LINEAR MODEL PSYC 943: Lecture 1 24
25 The General Linear Model The general linear model incorporates many different labels of analyses under one unifying umbrella: Categorical X s Continuous X s Both Types of X s Univariate Y ANOVA Regression ANCOVA Multivariate Y s MANOVA Multivariate Regression MANCOVA The typical assumption is that error is normally distributed meaning that the data are conditionally normally distributed Models for non normal outcomes (e.g., dichotomous, categorical, count) fall under the Generalized Linear Model, of which the GLM is a special case (i.e., for when model residuals can be assumed to be normally distributed) PSYC 943: Lecture 1 25
26 General Linear Models: Conditional Normality Model for the Means (Predicted Values): Each person s expected (predicted) outcome is a function of his/her values on x and z (and their interaction) y, x, and z are each measured only once per person (p subscript) Model for the Variance: 0, ONE residual (unexplained) deviation has a mean of 0 with some estimated constant variance, is normally distributed, is unrelated to x and z, and is unrelated across people (across all observations, just people here) We will return to the normal distribution in a few weeks but for now know that it is described by two terms: a mean and a variance PSYC 943: Lecture 1 26
27 Building a Linear Model for Predicting a Person s Weight We will now build a linear model for predicting a person s weight, using height and gender as predictors Several models we will build are done for didactic reasons to show how regression and ANOVA work under the GLM You wouldn t necessarily run these models in this sequence Our beginning model is that of an empty model no predictors for weight (an unconditional model) Our ending model is one with both predictors and their interaction (a conditional model) PSYC 943: Lecture 1 27
28 Model 1: The Empty Model Linear model: where Estimated Parameters: [ESTIMATE (STANDARD ERROR)] Overall intercept the grand mean of weight across all people Just the mean of weight SE for is standard error of the mean for weight 3, (SE not given) The (unbiased) variance of weight: 1 N1 From Mean Square Error of F table PSYC 943: Lecture 1 28
29 Model 2: Predicting Weight from Height ( Regression ) Linear model: where Estimated Parameters: [ESTIMATE (STANDARD ERROR)] Predicted value of Weight for a person with Height = 0 Nonsensical but we could have centered Height Change in predicted value of Weight for every one unit increase in height (weight goes up pounds per inch) 1, (SE not given) The residual variance of weight Height explains,.,.,. 61.7%of variance of weight PSYC 943: Lecture 1 29
30 Model 2a: Predicting Weight from Mean Centered Height Linear model: where Estimated Parameters: [ESTIMATE (STANDARD ERROR)] Predicted value of Weight for a person with Height = Mean Height Is the Mean Weight (regression line goes through means) Change in predicted value of Weight for every one unit increase in height (weight goes up pounds per inch) Same as previous 1, (SE not given) The residual variance of weight Height explains,.,.,. Same as previous 61.7%of variance of weight PSYC 943: Lecture 1 30


31 Plotting Model 2a PSYC 943: Lecture 1 31
32 Hypothesis Tests for Parameters To determine if the regression slope is significantly different from zero, we must use a hypothesis test: We have two options for this test (both are same in this case) Use ANOVA table: sums of squares F test Use Wald test for parameter: Here Wald test:.. Conclusion: reject null ; slope is significant PSYC 943: Lecture 1 32
33 Model 3: Predicting Weight from Gender ( ANOVA ) Linear Model: where 0, Note: because gender is a categorical predictor, we must first code it into a number before entering it into the model (typically done automatically in software) Here we use Female = 1 for females; Female = 0 for males Estimated Parameters: [ESTIMATE (STANDARD ERROR)] Predicted value of Weight for a person with Female=0 (males) Mean weight of males ;.001 Change in predicted value of Weight for every one unit increase in female In this case, the difference between the mean for males and the mean for females (SE not given) The residual variance of weight Gender explains,..,. 90.8% of variance of weight PSYC 943: Lecture 1 33
34 Model 3: More on Categorical Predictors Gender was coded using what is called reference or dummy coding: Intercept becomes mean of the reference group (the 0 group) Slopes become the difference in the means between reference and non reference groups For C categories, C 1 predictors are created All coding choices can be recovered from the model: Predicted Weight for Females (mean weight for females): Predicted Weight for Males: What would and be if we coded Male = 1? Super cool idea: what if you could do this in software all at once? PSYC 943: Lecture 1 34


35 Model 3: Predictions and Plots PSYC 943: Lecture 1 35
36 Model 4: Predicting Weight from Height and Gender (w/o Interaction); ( ANCOVA ) Linear Model: where Estimated Parameters: [ESTIMATE (STANDARD ERROR)] Predicted value of Weight for a person with Female=0 (males) and has Height = Mean Height ;.001 Change in predicted value of Weight for every one unit increase in height (holding gender constant) ;.001 Change in predicted value of Weight for every one unit increase in female (holding height constant) In this case, the difference between the mean for males and the mean for females holding height constant (SE not given) The residual variance of weight PSYC 943: Lecture 1 36
37 Model 4: By Gender Regression Lines Model 4 assumes identical regression slopes for both genders but has different intercepts This assumption is tested statistically by model 5 Predicted Weight for Females: Predicted Weight for Males: PSYC 943: Lecture 1 37
38 Model 4: Predicted Value Regression Lines PSYC 943: Lecture 1 38
39 Model 5: Predicting Weight from Height and Gender (with Interaction); ( ANCOVAish ) Linear Model: where Estimated Parameters: [ESTIMATE (STANDARD ERROR)] Predicted value of Weight for a person with Female=0 (males) and has Height = Mean Height ;.001 Simple main effect of height: Change in predicted value of Weight for every one unit increase in height (for males only) A conditional main effect: when interacting variable (gender) = 0 PSYC 943: Lecture 1 39
40 Model 5: Estimated Parameters Estimated Parameters: ;.001. Simple main effect of gender: Change in predicted value of Weight for every one unit increase in female, for height = mean height Gender difference at 67.9 inches ;.001 Gender by Height Interaction: Additional change in predicted value of weight for change in either gender or height Difference in slope for height for females vs. males Because Female = 1, it modifies the slope for height for females (here the height slope is less positive than for females than for males) 4.731(SE not given) PSYC 943: Lecture 1 40
41 Model 5: By Gender Regression Lines Model 5 does not assume identical regression slopes for both genders Because was significantly different from zero, the data supports different slopes for the genders Predicted Weight for Females: Predicted Weight for Males: PSYC 943: Lecture 1 41


42 Model 5: Predicted Value Regression Lines PSYC 943: Lecture 1 42
43 Comparing Across Models Typically, the empty model and model #5 would be the only models run The trick is to describe the impact of all and each of the predictors typically using variance accounted for (explained) All predictors: Baseline: empty model #1; 3, Comparison: model #5; All predictors (gender, height, interaction)explained, % of variance in weight,. hall of fame worthy PSYC 943: Lecture 1 43
44 Comparing Across Models The total effect of height (main effect and interaction): Baseline: model #3 (gender only); Comparison: model #5 (all predictors); Height explained.. remaining after gender. 98.4% of variance in weight 98.4% of the % = 9.2% left after gender True variance accounted for is 98.4%*9.2% = 9.1% The total effect of gender (main effect and interaction): Baseline: model #2a (height only); 1, Comparison: model #5 (all predictors); Gender explained,..,. remaining after height 99.6% of variance in weight 99.6% of the % = 38.3% left after height True variance accounted for is 99.6%*38.3% = 38.1% PSYC 943: Lecture 1 44
 However, the analysis only called for the residuals to be normally")

45 About Weight The distribution of weight was bimodal (shown in the beginning of the class) However, the analysis only called for the residuals to be normally distributed not the actual data This is the same as saying the conditional distribution of the data given the predictors must be normal Residual: PSYC 943: Lecture 1 45
46 CONCLUDING REMARKS PSYC 943: Lecture 1 46
47 Wrapping Up The general linear model forms the basis for many multivariate statistical techniques Certain features of the model change, but many of the same interpretations remain Over the next two weeks, we will more thoroughly unpack the varying terms of the GLM Model parameters (intercepts, main effects, and interactions) and their interpretations We will continue to use these terms in more advanced models throughout the rest of the semester Extra practice for linear model terms The trick of linear models is to construct one model that answers all of your research questions PSYC 943: Lecture 1 47
Course Introduction and Overview Descriptive Statistics Conceptualizations of Variance Review of the General Linear Model
 Course Introduction and Overview Descriptive Statistics Conceptualizations of Variance Review of the General Linear Model EPSY 905: Multivariate Analysis Lecture 1 20 January 2016 EPSY 905: Lecture 1 -
Review of the General Linear Model
 Review of the General Linear Model EPSY 905: Multivariate Analysis Online Lecture #2 Learning Objectives Types of distributions: Ø Conditional distributions The General Linear Model Ø Regression Ø Analysis
A Re-Introduction to General Linear Models (GLM)
") A Re-Introduction to General Linear Models (GLM) Today s Class: You do know the GLM Estimation (where the numbers in the output come from): From least squares to restricted maximum likelihood (REML) Reviewing
A Re-Introduction to General Linear Models (GLM) Today s Class: You do know the GLM Estimation (where the numbers in the output come from): From least squares to restricted maximum likelihood (REML) Reviewing
A Re-Introduction to General Linear Models
 A Re-Introduction to General Linear Models Today s Class: Big picture overview Why we are using restricted maximum likelihood within MIXED instead of least squares within GLM Linear model interpretation
Statistical Distribution Assumptions of General Linear Models
 Statistical Distribution Assumptions of General Linear Models Applied Multilevel Models for Cross Sectional Data Lecture 4 ICPSR Summer Workshop University of Colorado Boulder Lecture 4: Statistical Distributions
Introduction to Matrix Algebra and the Multivariate Normal Distribution
 Introduction to Matrix Algebra and the Multivariate Normal Distribution Introduction to Structural Equation Modeling Lecture #2 January 18, 2012 ERSH 8750: Lecture 2 Motivation for Learning the Multivariate
Simple, Marginal, and Interaction Effects in General Linear Models: Part 1
 Simple, Marginal, and Interaction Effects in General Linear Models: Part 1 PSYC 943 (930): Fundamentals of Multivariate Modeling Lecture 2: August 24, 2012 PSYC 943: Lecture 2 Today s Class Centering and
Repeated Measures ANOVA Multivariate ANOVA and Their Relationship to Linear Mixed Models
 Repeated Measures ANOVA Multivariate ANOVA and Their Relationship to Linear Mixed Models EPSY 905: Multivariate Analysis Spring 2016 Lecture #12 April 20, 2016 EPSY 905: RM ANOVA, MANOVA, and Mixed Models
Interactions among Continuous Predictors
 Interactions among Continuous Predictors Today s Class: Simple main effects within two-way interactions Conquering TEST/ESTIMATE/LINCOM statements Regions of significance Three-way interactions (and beyond
Simple, Marginal, and Interaction Effects in General Linear Models
 Simple, Marginal, and Interaction Effects in General Linear Models PRE 905: Multivariate Analysis Lecture 3 Today s Class Centering and Coding Predictors Interpreting Parameters in the Model for the Means
Multilevel Models in Matrix Form. Lecture 7 July 27, 2011 Advanced Multivariate Statistical Methods ICPSR Summer Session #2
 Multilevel Models in Matrix Form Lecture 7 July 27, 2011 Advanced Multivariate Statistical Methods ICPSR Summer Session #2 Today s Lecture Linear models from a matrix perspective An example of how to do
An Introduction to Mplus and Path Analysis
 An Introduction to Mplus and Path Analysis PSYC 943: Fundamentals of Multivariate Modeling Lecture 10: October 30, 2013 PSYC 943: Lecture 10 Today s Lecture Path analysis starting with multivariate regression
Time-Invariant Predictors in Longitudinal Models
 Time-Invariant Predictors in Longitudinal Models Today s Class (or 3): Summary of steps in building unconditional models for time What happens to missing predictors Effects of time-invariant predictors
STA441: Spring Multiple Regression. This slide show is a free open source document. See the last slide for copyright information.
 STA441: Spring 2018 Multiple Regression This slide show is a free open source document. See the last slide for copyright information. 1 Least Squares Plane 2 Statistical MODEL There are p-1 explanatory
A Introduction to Matrix Algebra and the Multivariate Normal Distribution
 A Introduction to Matrix Algebra and the Multivariate Normal Distribution PRE 905: Multivariate Analysis Spring 2014 Lecture 6 PRE 905: Lecture 7 Matrix Algebra and the MVN Distribution Today s Class An
EPSY 905: Fundamentals of Multivariate Modeling Online Lecture #7
 Introduction to Generalized Univariate Models: Models for Binary Outcomes EPSY 905: Fundamentals of Multivariate Modeling Online Lecture #7 EPSY 905: Intro to Generalized In This Lecture A short review
An Introduction to Path Analysis
 An Introduction to Path Analysis PRE 905: Multivariate Analysis Lecture 10: April 15, 2014 PRE 905: Lecture 10 Path Analysis Today s Lecture Path analysis starting with multivariate regression then arriving
An Introduction to Multilevel Models. PSYC 943 (930): Fundamentals of Multivariate Modeling Lecture 25: December 7, 2012
: Fundamentals of Multivariate Modeling Lecture 25: December 7, 2012") An Introduction to Multilevel Models PSYC 943 (930): Fundamentals of Multivariate Modeling Lecture 25: December 7, 2012 Today s Class Concepts in Longitudinal Modeling Between-Person vs. +Within-Person
An Introduction to Multilevel Models PSYC 943 (930): Fundamentals of Multivariate Modeling Lecture 25: December 7, 2012 Today s Class Concepts in Longitudinal Modeling Between-Person vs. +Within-Person
Time-Invariant Predictors in Longitudinal Models
 Time-Invariant Predictors in Longitudinal Models Today s Topics: What happens to missing predictors Effects of time-invariant predictors Fixed vs. systematically varying vs. random effects Model building
Review of CLDP 944: Multilevel Models for Longitudinal Data
 Review of CLDP 944: Multilevel Models for Longitudinal Data Topics: Review of general MLM concepts and terminology Model comparisons and significance testing Fixed and random effects of time Significance
Generalized Models: Part 1
 Generalized Models: Part 1 Topics: Introduction to generalized models Introduction to maximum likelihood estimation Models for binary outcomes Models for proportion outcomes Models for categorical outcomes
Path Analysis. PRE 906: Structural Equation Modeling Lecture #5 February 18, PRE 906, SEM: Lecture 5 - Path Analysis
 Path Analysis PRE 906: Structural Equation Modeling Lecture #5 February 18, 2015 PRE 906, SEM: Lecture 5 - Path Analysis Key Questions for Today s Lecture What distinguishes path models from multivariate
Class Introduction and Overview; Review of ANOVA, Regression, and Psychological Measurement
 Class Introduction and Overview; Review of ANOVA, Regression, and Psychological Measurement Introduction to Structural Equation Modeling Lecture #1 January 11, 2012 ERSH 8750: Lecture 1 Today s Class Introduction
Review of Multiple Regression
 Ronald H. Heck 1 Let s begin with a little review of multiple regression this week. Linear models [e.g., correlation, t-tests, analysis of variance (ANOVA), multiple regression, path analysis, multivariate
Ron Heck, Fall Week 3: Notes Building a Two-Level Model
 Ron Heck, Fall 2011 1 EDEP 768E: Seminar on Multilevel Modeling rev. 9/6/2011@11:27pm Week 3: Notes Building a Two-Level Model We will build a model to explain student math achievement using student-level
Univariate Normal Distribution; GLM with the Univariate Normal; Least Squares Estimation
 Univariate Normal Distribution; GLM with the Univariate Normal; Least Squares Estimation PRE 905: Multivariate Analysis Spring 2014 Lecture 4 Today s Class The building blocks: The basics of mathematical
Generalized Linear Models for Non-Normal Data
 Generalized Linear Models for Non-Normal Data Today s Class: 3 parts of a generalized model Models for binary outcomes Complications for generalized multivariate or multilevel models SPLH 861: Lecture
Introduction to Within-Person Analysis and RM ANOVA
 Introduction to Within-Person Analysis and RM ANOVA Today s Class: From between-person to within-person ANOVAs for longitudinal data Variance model comparisons using 2 LL CLP 944: Lecture 3 1 The Two Sides
Maximum Likelihood Estimation; Robust Maximum Likelihood; Missing Data with Maximum Likelihood
 Maximum Likelihood Estimation; Robust Maximum Likelihood; Missing Data with Maximum Likelihood PRE 906: Structural Equation Modeling Lecture #3 February 4, 2015 PRE 906, SEM: Estimation Today s Class An
Introduction to Generalized Models
 Introduction to Generalized Models Today s topics: The big picture of generalized models Review of maximum likelihood estimation Models for binary outcomes Models for proportion outcomes Models for categorical
Hierarchical Generalized Linear Models. ERSH 8990 REMS Seminar on HLM Last Lecture!
 Hierarchical Generalized Linear Models ERSH 8990 REMS Seminar on HLM Last Lecture! Hierarchical Generalized Linear Models Introduction to generalized models Models for binary outcomes Interpreting parameter
Time-Invariant Predictors in Longitudinal Models
 Time-Invariant Predictors in Longitudinal Models Topics: What happens to missing predictors Effects of time-invariant predictors Fixed vs. systematically varying vs. random effects Model building strategies
36-309/749 Experimental Design for Behavioral and Social Sciences. Dec 1, 2015 Lecture 11: Mixed Models (HLMs)
") 36-309/749 Experimental Design for Behavioral and Social Sciences Dec 1, 2015 Lecture 11: Mixed Models (HLMs) Independent Errors Assumption An error is the deviation of an individual observed outcome (DV)
36-309/749 Experimental Design for Behavioral and Social Sciences Dec 1, 2015 Lecture 11: Mixed Models (HLMs) Independent Errors Assumption An error is the deviation of an individual observed outcome (DV)
Can you tell the relationship between students SAT scores and their college grades?
 Correlation One Challenge Can you tell the relationship between students SAT scores and their college grades? A: The higher SAT scores are, the better GPA may be. B: The higher SAT scores are, the lower
Correlation. A statistics method to measure the relationship between two variables. Three characteristics
 Correlation Correlation A statistics method to measure the relationship between two variables Three characteristics Direction of the relationship Form of the relationship Strength/Consistency Direction
Time-Invariant Predictors in Longitudinal Models
 Time-Invariant Predictors in Longitudinal Models Topics: Summary of building unconditional models for time Missing predictors in MLM Effects of time-invariant predictors Fixed, systematically varying,
Example. Multiple Regression. Review of ANOVA & Simple Regression /749 Experimental Design for Behavioral and Social Sciences
 36-309/749 Experimental Design for Behavioral and Social Sciences Sep. 29, 2015 Lecture 5: Multiple Regression Review of ANOVA & Simple Regression Both Quantitative outcome Independent, Gaussian errors
Final Exam - Solutions
 Ecn 102 - Analysis of Economic Data University of California - Davis March 19, 2010 Instructor: John Parman Final Exam - Solutions You have until 5:30pm to complete this exam. Please remember to put your
psyc3010 lecture 2 factorial between-ps ANOVA I: omnibus tests
 psyc3010 lecture 2 factorial between-ps ANOVA I: omnibus tests last lecture: introduction to factorial designs next lecture: factorial between-ps ANOVA II: (effect sizes and follow-up tests) 1 general
Profile Analysis Multivariate Regression
 Lecture 8 October 12, 2005 Analysis Lecture #8-10/12/2005 Slide 1 of 68 Today s Lecture Profile analysis Today s Lecture Schedule : regression review multiple regression is due Thursday, October 27th,
Comparing IRT with Other Models
 Comparing IRT with Other Models Lecture #14 ICPSR Item Response Theory Workshop Lecture #14: 1of 45 Lecture Overview The final set of slides will describe a parallel between IRT and another commonly used
Exploratory Factor Analysis and Principal Component Analysis
 Exploratory Factor Analysis and Principal Component Analysis Today s Topics: What are EFA and PCA for? Planning a factor analytic study Analysis steps: Extraction methods How many factors Rotation and
Longitudinal Data Analysis of Health Outcomes
 Longitudinal Data Analysis of Health Outcomes Longitudinal Data Analysis Workshop Running Example: Days 2 and 3 University of Georgia: Institute for Interdisciplinary Research in Education and Human Development
Univariate Normal Distribution; GLM with the Univariate Normal; Least Squares Estimation
 Univariate Normal Distribution; GLM with the Univariate Normal; Least Squares Estimation EPSY 905: Multivariate Analysis Spring 2016 Lecture 3: February 10, 2016 Today s Class The building blocks: The
Time Invariant Predictors in Longitudinal Models
 Time Invariant Predictors in Longitudinal Models Longitudinal Data Analysis Workshop Section 9 University of Georgia: Institute for Interdisciplinary Research in Education and Human Development Section
Binary Logistic Regression
 The coefficients of the multiple regression model are estimated using sample data with k independent variables Estimated (or predicted) value of Y Estimated intercept Estimated slope coefficients Ŷ = b
Experimental Design and Data Analysis for Biologists
 Experimental Design and Data Analysis for Biologists Gerry P. Quinn Monash University Michael J. Keough University of Melbourne CAMBRIDGE UNIVERSITY PRESS Contents Preface page xv I I Introduction 1 1.1
8/04/2011. last lecture: correlation and regression next lecture: standard MR & hierarchical MR (MR = multiple regression)
") psyc3010 lecture 7 analysis of covariance (ANCOVA) last lecture: correlation and regression next lecture: standard MR & hierarchical MR (MR = multiple regression) 1 announcements quiz 2 correlation and
psyc3010 lecture 7 analysis of covariance (ANCOVA) last lecture: correlation and regression next lecture: standard MR & hierarchical MR (MR = multiple regression) 1 announcements quiz 2 correlation and
Subject CS1 Actuarial Statistics 1 Core Principles
 Institute of Actuaries of India Subject CS1 Actuarial Statistics 1 Core Principles For 2019 Examinations Aim The aim of the Actuarial Statistics 1 subject is to provide a grounding in mathematical and
Review of Unconditional Multilevel Models for Longitudinal Data
 Review of Unconditional Multilevel Models for Longitudinal Data Topics: Course (and MLM) overview Concepts in longitudinal multilevel modeling Model comparisons and significance testing Describing within-person
Data Analysis as a Decision Making Process
 Data Analysis as a Decision Making Process I. Levels of Measurement A. NOIR - Nominal Categories with names - Ordinal Categories with names and a logical order - Intervals Numerical Scale with logically
One-Way ANOVA. Some examples of when ANOVA would be appropriate include:
 One-Way ANOVA 1. Purpose Analysis of variance (ANOVA) is used when one wishes to determine whether two or more groups (e.g., classes A, B, and C) differ on some outcome of interest (e.g., an achievement
Describing Change over Time: Adding Linear Trends
 Describing Change over Time: Adding Linear Trends Longitudinal Data Analysis Workshop Section 7 University of Georgia: Institute for Interdisciplinary Research in Education and Human Development Section
ANCOVA. ANCOVA allows the inclusion of a 3rd source of variation into the F-formula (called the covariate) and changes the F-formula
 and changes the F-formula") ANCOVA Workings of ANOVA & ANCOVA ANCOVA, Semi-Partial correlations, statistical control Using model plotting to think about ANCOVA & Statistical control You know how ANOVA works the total variation among
ANCOVA Workings of ANOVA & ANCOVA ANCOVA, Semi-Partial correlations, statistical control Using model plotting to think about ANCOVA & Statistical control You know how ANOVA works the total variation among
Acknowledgements. Outline. Marie Diener-West. ICTR Leadership / Team INTRODUCTION TO CLINICAL RESEARCH. Introduction to Linear Regression
 INTRODUCTION TO CLINICAL RESEARCH Introduction to Linear Regression Karen Bandeen-Roche, Ph.D. July 17, 2012 Acknowledgements Marie Diener-West Rick Thompson ICTR Leadership / Team JHU Intro to Clinical
Model Assumptions; Predicting Heterogeneity of Variance
 Model Assumptions; Predicting Heterogeneity of Variance Today s topics: Model assumptions Normality Constant variance Predicting heterogeneity of variance CLP 945: Lecture 6 1 Checking for Violations of
Model Estimation Example
 Ronald H. Heck 1 EDEP 606: Multivariate Methods (S2013) April 7, 2013 Model Estimation Example As we have moved through the course this semester, we have encountered the concept of model estimation. Discussions
Designing Multilevel Models Using SPSS 11.5 Mixed Model. John Painter, Ph.D.
 Designing Multilevel Models Using SPSS 11.5 Mixed Model John Painter, Ph.D. Jordan Institute for Families School of Social Work University of North Carolina at Chapel Hill 1 Creating Multilevel Models
Introduction to Random Effects of Time and Model Estimation
 Introduction to Random Effects of Time and Model Estimation Today s Class: The Big Picture Multilevel model notation Fixed vs. random effects of time Random intercept vs. random slope models How MLM =
Course Review. Kin 304W Week 14: April 9, 2013
 Course Review Kin 304W Week 14: April 9, 2013 1 Today s Outline Format of Kin 304W Final Exam Course Review Hand back marked Project Part II 2 Kin 304W Final Exam Saturday, Thursday, April 18, 3:30-6:30
Review of Multilevel Models for Longitudinal Data
 Review of Multilevel Models for Longitudinal Data Topics: Concepts in longitudinal multilevel modeling Describing within-person fluctuation using ACS models Describing within-person change using random
Longitudinal Modeling with Logistic Regression
 Newsom 1 Longitudinal Modeling with Logistic Regression Longitudinal designs involve repeated measurements of the same individuals over time There are two general classes of analyses that correspond to
STA441: Spring Multiple Regression. More than one explanatory variable at the same time
 STA441: Spring 2016 Multiple Regression More than one explanatory variable at the same time This slide show is a free open source document. See the last slide for copyright information. One Explanatory
LECTURE 6. Introduction to Econometrics. Hypothesis testing & Goodness of fit
 LECTURE 6 Introduction to Econometrics Hypothesis testing & Goodness of fit October 25, 2016 1 / 23 ON TODAY S LECTURE We will explain how multiple hypotheses are tested in a regression model We will define
Power Analysis. Ben Kite KU CRMDA 2015 Summer Methodology Institute
 Power Analysis Ben Kite KU CRMDA 2015 Summer Methodology Institute Created by Terrence D. Jorgensen, 2014 Recall Hypothesis Testing? Null Hypothesis Significance Testing (NHST) is the most common application
Describing Within-Person Fluctuation over Time using Alternative Covariance Structures
 Describing Within-Person Fluctuation over Time using Alternative Covariance Structures Today s Class: The Big Picture ACS models using the R matrix only Introducing the G, Z, and V matrices ACS models
Contents. Acknowledgments. xix
 Table of Preface Acknowledgments page xv xix 1 Introduction 1 The Role of the Computer in Data Analysis 1 Statistics: Descriptive and Inferential 2 Variables and Constants 3 The Measurement of Variables
WU Weiterbildung. Linear Mixed Models
 Linear Mixed Effects Models WU Weiterbildung SLIDE 1 Outline 1 Estimation: ML vs. REML 2 Special Models On Two Levels Mixed ANOVA Or Random ANOVA Random Intercept Model Random Coefficients Model Intercept-and-Slopes-as-Outcomes
Class Notes: Week 8. Probit versus Logit Link Functions and Count Data
 Ronald Heck Class Notes: Week 8 1 Class Notes: Week 8 Probit versus Logit Link Functions and Count Data This week we ll take up a couple of issues. The first is working with a probit link function. While
Inferences for Regression
 Inferences for Regression An Example: Body Fat and Waist Size Looking at the relationship between % body fat and waist size (in inches). Here is a scatterplot of our data set: Remembering Regression In
Ron Heck, Fall Week 8: Introducing Generalized Linear Models: Logistic Regression 1 (Replaces prior revision dated October 20, 2011)
") Ron Heck, Fall 2011 1 EDEP 768E: Seminar in Multilevel Modeling rev. January 3, 2012 (see footnote) Week 8: Introducing Generalized Linear Models: Logistic Regression 1 (Replaces prior revision dated October
Ron Heck, Fall 2011 1 EDEP 768E: Seminar in Multilevel Modeling rev. January 3, 2012 (see footnote) Week 8: Introducing Generalized Linear Models: Logistic Regression 1 (Replaces prior revision dated October
Interactions among Categorical Predictors
 Interactions among Categorical Predictors Today s Class: Reviewing significance tests Manual contrasts for categorical predictors Program-created contrasts for categorical predictors SPLH 861: Lecture
Machine Learning Linear Regression. Prof. Matteo Matteucci
 Machine Learning Linear Regression Prof. Matteo Matteucci Outline 2 o Simple Linear Regression Model Least Squares Fit Measures of Fit Inference in Regression o Multi Variate Regession Model Least Squares
Statistics Boot Camp. Dr. Stephanie Lane Institute for Defense Analyses DATAWorks 2018
 Statistics Boot Camp Dr. Stephanie Lane Institute for Defense Analyses DATAWorks 2018 March 21, 2018 Outline of boot camp Summarizing and simplifying data Point and interval estimation Foundations of statistical
where Female = 0 for males, = 1 for females Age is measured in years (22, 23, ) GPA is measured in units on a four-point scale (0, 1.22, 3.45, etc.
 GPA is measured in units on a four-point scale (0, 1.22, 3.45, etc.") Notes on regression analysis 1. Basics in regression analysis key concepts (actual implementation is more complicated) A. Collect data B. Plot data on graph, draw a line through the middle of the scatter
Notes on regression analysis 1. Basics in regression analysis key concepts (actual implementation is more complicated) A. Collect data B. Plot data on graph, draw a line through the middle of the scatter
Hypothesis testing, part 2. With some material from Howard Seltman, Blase Ur, Bilge Mutlu, Vibha Sazawal
 Hypothesis testing, part 2 With some material from Howard Seltman, Blase Ur, Bilge Mutlu, Vibha Sazawal 1 CATEGORICAL IV, NUMERIC DV 2 Independent samples, one IV # Conditions Normal/Parametric Non-parametric
Simple Linear Regression: One Qualitative IV
 Simple Linear Regression: One Qualitative IV 1. Purpose As noted before regression is used both to explain and predict variation in DVs, and adding to the equation categorical variables extends regression
Final Exam - Solutions
 Ecn 102 - Analysis of Economic Data University of California - Davis March 17, 2010 Instructor: John Parman Final Exam - Solutions You have until 12:30pm to complete this exam. Please remember to put your
Regression With a Categorical Independent Variable
 Regression With a Independent Variable Lecture 10 November 5, 2008 ERSH 8320 Lecture #10-11/5/2008 Slide 1 of 54 Today s Lecture Today s Lecture Chapter 11: Regression with a single categorical independent
Review of Statistics 101
 Review of Statistics 101 We review some important themes from the course 1. Introduction Statistics- Set of methods for collecting/analyzing data (the art and science of learning from data). Provides methods
Draft Proof - Do not copy, post, or distribute. Chapter Learning Objectives REGRESSION AND CORRELATION THE SCATTER DIAGRAM
 1 REGRESSION AND CORRELATION As we learned in Chapter 9 ( Bivariate Tables ), the differential access to the Internet is real and persistent. Celeste Campos-Castillo s (015) research confirmed the impact
Chapter 4 Regression with Categorical Predictor Variables Page 1. Overview of regression with categorical predictors
 Chapter 4 Regression with Categorical Predictor Variables Page. Overview of regression with categorical predictors 4-. Dummy coding 4-3 4-5 A. Karpinski Regression with Categorical Predictor Variables.
REVIEW 8/2/2017 陈芳华东师大英语系
 REVIEW Hypothesis testing starts with a null hypothesis and a null distribution. We compare what we have to the null distribution, if the result is too extreme to belong to the null distribution (p
Introduction to Bayesian Statistics and Markov Chain Monte Carlo Estimation. EPSY 905: Multivariate Analysis Spring 2016 Lecture #10: April 6, 2016
 Introduction to Bayesian Statistics and Markov Chain Monte Carlo Estimation EPSY 905: Multivariate Analysis Spring 2016 Lecture #10: April 6, 2016 EPSY 905: Intro to Bayesian and MCMC Today s Class An
16.400/453J Human Factors Engineering. Design of Experiments II
 J Human Factors Engineering Design of Experiments II Review Experiment Design and Descriptive Statistics Research question, independent and dependent variables, histograms, box plots, etc. Inferential
Overview. Overview. Overview. Specific Examples. General Examples. Bivariate Regression & Correlation
 Bivariate Regression & Correlation Overview The Scatter Diagram Two Examples: Education & Prestige Correlation Coefficient Bivariate Linear Regression Line SPSS Output Interpretation Covariance ou already
Multiple Linear Regression II. Lecture 8. Overview. Readings
 Multiple Linear Regression II Lecture 8 Image source:https://commons.wikimedia.org/wiki/file:autobunnskr%c3%a4iz-ro-a201.jpg Survey Research & Design in Psychology James Neill, 2016 Creative Commons Attribution
Multiple Linear Regression II. Lecture 8. Overview. Readings. Summary of MLR I. Summary of MLR I. Summary of MLR I
 Multiple Linear Regression II Lecture 8 Image source:https://commons.wikimedia.org/wiki/file:autobunnskr%c3%a4iz-ro-a201.jpg Survey Research & Design in Psychology James Neill, 2016 Creative Commons Attribution
STAT 501 EXAM I NAME Spring 1999
 STAT 501 EXAM I NAME Spring 1999 Instructions: You may use only your calculator and the attached tables and formula sheet. You can detach the tables and formula sheet from the rest of this exam. Show your
Introducing Generalized Linear Models: Logistic Regression
 Ron Heck, Summer 2012 Seminars 1 Multilevel Regression Models and Their Applications Seminar Introducing Generalized Linear Models: Logistic Regression The generalized linear model (GLM) represents and
Panel Data. March 2, () Applied Economoetrics: Topic 6 March 2, / 43
 Applied Economoetrics: Topic 6 March 2, / 43") Panel Data March 2, 212 () Applied Economoetrics: Topic March 2, 212 1 / 43 Overview Many economic applications involve panel data. Panel data has both cross-sectional and time series aspects. Regression
Panel Data March 2, 212 () Applied Economoetrics: Topic March 2, 212 1 / 43 Overview Many economic applications involve panel data. Panel data has both cross-sectional and time series aspects. Regression
AP Final Review II Exploring Data (20% 30%)
") AP Final Review II Exploring Data (20% 30%) Quantitative vs Categorical Variables Quantitative variables are numerical values for which arithmetic operations such as means make sense. It is usually a measure
AP Final Review II Exploring Data (20% 30%) Quantitative vs Categorical Variables Quantitative variables are numerical values for which arithmetic operations such as means make sense. It is usually a measure
Exploratory Factor Analysis and Principal Component Analysis
 Exploratory Factor Analysis and Principal Component Analysis Today s Topics: What are EFA and PCA for? Planning a factor analytic study Analysis steps: Extraction methods How many factors Rotation and
FREC 608 Guided Exercise 9
 FREC 608 Guided Eercise 9 Problem. Model of Average Annual Precipitation An article in Geography (July 980) used regression to predict average annual rainfall levels in California. Data on the following
MIXED MODELS FOR REPEATED (LONGITUDINAL) DATA PART 2 DAVID C. HOWELL 4/1/2010
 DATA PART 2 DAVID C. HOWELL 4/1/2010") MIXED MODELS FOR REPEATED (LONGITUDINAL) DATA PART 2 DAVID C. HOWELL 4/1/2010 Part 1 of this document can be found at http://www.uvm.edu/~dhowell/methods/supplements/mixed Models for Repeated Measures1.pdf
MIXED MODELS FOR REPEATED (LONGITUDINAL) DATA PART 2 DAVID C. HOWELL 4/1/2010 Part 1 of this document can be found at http://www.uvm.edu/~dhowell/methods/supplements/mixed Models for Repeated Measures1.pdf
Measurement Invariance (MI) in CFA and Differential Item Functioning (DIF) in IRT/IFA
 in CFA and Differential Item Functioning (DIF) in IRT/IFA") Topics: Measurement Invariance (MI) in CFA and Differential Item Functioning (DIF) in IRT/IFA What are MI and DIF? Testing measurement invariance in CFA Testing differential item functioning in IRT/IFA
Topics: Measurement Invariance (MI) in CFA and Differential Item Functioning (DIF) in IRT/IFA What are MI and DIF? Testing measurement invariance in CFA Testing differential item functioning in IRT/IFA
Uni- and Bivariate Power
 Uni- and Bivariate Power Copyright 2002, 2014, J. Toby Mordkoff Note that the relationship between risk and power is unidirectional. Power depends on risk, but risk is completely independent of power.
Regression With a Categorical Independent Variable: Mean Comparisons
 Regression With a Categorical Independent Variable: Mean Lecture 16 March 29, 2005 Applied Regression Analysis Lecture #16-3/29/2005 Slide 1 of 43 Today s Lecture comparisons among means. Today s Lecture
Regression: Main Ideas Setting: Quantitative outcome with a quantitative explanatory variable. Example, cont.
 TCELL 9/4/205 36-309/749 Experimental Design for Behavioral and Social Sciences Simple Regression Example Male black wheatear birds carry stones to the nest as a form of sexual display. Soler et al. wanted
Practical Biostatistics
 Practical Biostatistics Clinical Epidemiology, Biostatistics and Bioinformatics AMC Multivariable regression Day 5 Recap Describing association: Correlation Parametric technique: Pearson (PMCC) Non-parametric: