Difference-in-Difference estimator. Presented at Summer School 2015 by Ziyodullo Parpiev, PhD June 9, 2015 Tashkent
|
|
|
- Andrew Carter
- 5 years ago
- Views:
Transcription
1 Difference-in-Difference estimator Presented at Summer School 2015 by Ziyodullo Parpiev, PhD June 9, 2015 Tashkent
2 Today s Class Non-experimental Methods: Difference-in-differences Understanding how it works How to test the assumptions Some problems and pitfalls
3 Why are experiments good? Treatment is random so it s independent of other characteristics This independence allows us to develop an implied counterfactual Thus even though we don t observe E[Y 0 T=1] we can use E[Y 0 T=0] as the counterfactual for the treatment group
4 What if we don t have an experiment Would like to find a group that is exactly like the treatment group but didn t get the treatment Hard to do because Lots of unobservables Data is limited Selection into treatment
5 Background Information Water supplied to households by competing private companies Sometimes different companies supplied households in same street In south London two main companies: Lambeth Company (water supply from Thames Ditton, 22 miles upstream) Southwark and Vauxhall Company (water supply from Thames)
6 In 1853/54 cholera outbreak Death Rates per people by water company Lambeth 10 Southwark and Vauxhall 150 Might be water but perhaps other factors Snow compared death rates in 1849 epidemic Lambeth 150 Southwark and Vauxhall 125 In 1852 Lambeth Company had changed supply from Hungerford Bridge
7 The effect of clean water on cholera death rates /5 4 Difference Lambeth Vauxhall and Southwark Counterfactual 2: Control group time difference. Assume this would have been true for treatment group Difference Counterfactual 1: Pre-Experiment difference between treatment and control assume this difference is fixed over time
8 This is basic idea of D-i-D Have already seen idea of using differences to estimate causal effects Treatment/control groups in experimental data We need a counterfactual because we don t observe the outcome of the treatment group when they weren t treated (i.e. (Y 0 T=1)) Often would like to find treatment and control group who can be assumed to be similar in every way except receipt of treatment
9 A Weaker Assumption is.. Assume that, in absence of treatment, difference between treatment and control group is constant over time With this assumption can use observations on treatment and control group pre- and post-treatment to estimate causal effect Idea Difference pre-treatment is normal difference Difference pre-treatment is normal difference + causal effect Difference-in-difference is causal effect
10 A Graphical Representation A Treatment y C counterfactual B Control Pre- A B = Standard differences estimator C B = Counterfactual normal difference A C = Difference-in-Difference Estimate Post- Time
11 Assumption of the D-in-D estimate D-in-D estimate assumes trends in outcome variables the same for treatment and control groups Fixed difference over time This is not testable because we never observe the counterfactual Is this reasonable? With two periods can t do anything With more periods can see if control and treatment groups trend together
12 Some Notation Define: μ it = E(y it ) Where i=0 is control group, i=1 is treatment Where t=0 is pre-period, t=1 is post-period Standard differences estimate of causal effect is estimate of: μ 11 μ 01 Differences-in-Differences estimate of causal effect is estimate of: (μ 11 μ 01 ) (μ 10 μ 00 )
13 How to estimate? Can write D-in-D estimate as: (μ 11 μ 10 ) (μ 01 μ 00 ) Before-After difference for treatment Before-After difference for control group group This is simply the difference in the change of treatment and control groups so can estimate as: y = β ( X ) i i + ε i
14 Can we do this? This is simply differences estimator applied to the difference To implement this need to have repeat observations on the same individuals May not have this individuals observed pre- and posttreatment may be different
15 In this case can estimate. y X T X T = β + β + β + β * + ε it 0 1 i 2 t 3 i t it Main effect of Treatment group (in before period because T=0) Main effect of the After period (for control group because X=0)
16 D-in-D estimate D-in-D estimate is estimate of β 3 why is this? p p p p lim lim lim lim ˆ ˆ ˆ ˆ = β µ 0 00 = β µ µ = β µ µ = ( ) ( ) β µ µ µ µ
17 A Comparison of the Two Methods Where have repeated observations could use both methods Will give same parameter estimates But will give different standard errors levels version will assume residuals are independent unlikely to be a good assumption Can deal with this by clustering by group (imposes a covariance structure within the clustering variable)
18 Recap: Assumptions for Diff-in-Diff Additive structure of effects. We are imposing a linear model where the group or time specific effects only enter additively. No spillover effects The treatment group received the treatment and the control group did not Parallel time trends: there are fixed differences over time. If there are differences that vary over time then our second difference will still include a time effect.
19 Issue 1: Other Regressors Can put in other regressors just as usual think about way in which they enter the estimating equation E.g. if level of W affects level of y then should include ΔW in differences version Conditional comparisons might be useful if you think some groups may be more comparable or have different trends than others
20 Issue 2: Differential Trends in Treatment and Control Groups Key assumption underlying validity of D-in-D estimate is that differences between treatment and control group would have remained constant in absence of treatment Can never test this With only two periods can get no idea of plausibility But can with more than two periods
21 An Example: Vertical Relationships and Competition in Retail Gasoline Markets, by Justine Hastings, American Economic Review, 2004 Interested in effect of vertical integration on retail petrol prices Investigates take-over in CA of independent Thrifty chain of petrol stations by ARCO (more integrated) Treatment Group: petrol stations < 1mi from Thrifty Control group: petrol stations > 1mi from Thrifty Lots of reasons why these groups might be different so D-in-D approach seems a good idea
22 This picture contains relevant information Can see D-in-D estimate of +5c per gallon Also can see trends before and after change very similar D-in-D assumption valid
23 Issue 3: Ashenfelter s Dip `pre-program dip', for participants Related to the idea of mean reversion: individuals experience some idiosyncratic shock May enter program when things are especially bad Would have improved anyway (reversion to the mean) Another issue may be if your treatment is selected by participants then only the worst off individuals elect the treatment not comparable to general effect of policy
24 Another Example Interested in effect of government-sponsored training (MDTA) on earnings Treatment group are those who received training in 1964 Control group are random sample of population as a whole
25 Earnings for period Log Mean Annual Earnings year Comparison Group Trainees
26 Things to Note.. Earnings for trainees very low in 1964 as training not working in that year should ignore this year Simple D-in-D approach would compare earnings in 1965 with 1963 But earnings of trainees in 1963 seem to show a dip so D-in-D assumption probably not valid Probably because those who enter training are those who had a bad shock (e.g. job loss)
27 Differences-in-Differences: Summary A very useful and widespread approach Validity does depend on assumption that trends would have been the same in absence of treatment Often need more than 2 periods to test: Pre-treatment trends for treatment and control to see if fixed differences assumption is plausible or not See if there s an Ashenfelter Dip
28 Issues Economic effects of minimum wages and evidence on minimum wages and employment The controversy on conventional wisdom versus micro based revisionist approach
29 Economic Effects of Minimum Wages Effect on employment/unemployment has been central issue in debate about economic effects of minimum wages. Standard textbook model of labour demand produces one of the clearest predictions in labour economics - minimum wages price workers out of jobs by forcing employers up their labour demand curve.
30 Standard Textbook Model
31 Standard Textbook Model Basic model rests upon several assumptions: complete coverage; homogeneous labour; competitive labour market; short run and long run impact the same. Clear prediction: the minimum wage increase results in reduced employment - the proportional reduction in employment (lne m - lne 0 ) equals the proportionate wage increase (lnw m - lnw 0 ) times the elasticity of demand η. Can develop more sophisticated models, but with assumption of perfect competition produce same qualitative predictions.
32 Two Sector Model Basic model can be generalised in various directions. One example is to move to a two sector model - covered/non-covered, set E0 = 1, W0 = 1. Demand for workers in the covered sector depends on the minimum wage, whereas demand in the uncovered sector depends upon the market wage. Minimum wage elasticity of employment = cηεlnwm / [1 - c + εlnwm] where c = proportion in covered sector, ε = elasticity of labour supply. If c = 1, ε = standard one sector competitive model, η Example: c = 0.7, lnwm = 0.6, ε = 0.3, η = -1 employment effect =
33 Implications Only pertinent question is how negative is the negative effect on employment? Minimum wage hurts the people it sets out to help by pricing them out of work even more the case since low skill people more likely to be low paid
34 Evidence Early empirical work conventional wisdom. largely supportive of basic model Usually based on aggregate time series studies of US employment/unemployment rates and minimum wages, usually focussing on teenagers Y t = g(mw t, X 1t,...X kt ) + e t where Y t = employment / unemployment to population ratios (usually in logs), X it = aggregate demand and supply variables (teenagers in training programmes, school enrollment, time trend), MW t = minimum wage index (e.g. Kaitz index). Brown, Gilroy, Kohen (1982) Journal of Economic Literature - say consensus reached: minimum wages reduce teenage employment with elasticities in the -0.1 to -0.3 range.
35 Observations on Time Series Evidence: Re-Appraisal 1). US minimum wage fell strongly in real terms in the 1980s Real Minimum Wages in 1999$ Year Real Minimum Wage (1999 Prices)
36 Re-Appraisal (Continued) Extending the samples of teenage employment studies into the 1980s produces much smaller, often statistically insignificant, elasticities below the consensus range (around -0.07) (Card and Krueger, 1995). Minimum wage effects on employment seem small (centring in on zero). Or labour demand curve inelastic so that employment not very sensitive to changes in minimum wages. What is best conceptual way to evaluate economic effect of minimum wage? Before and after micro work more closely approximates the theoretical approaches that talk about labour markets with and without minimum wage floors sometimes referred to as revisionist approach.
37 Methodological Issues in Newer Research Corresponds better to theoretical concepts as adopts before and after approach, with treatment and control groups. If E is employment, T and C denote treatment and controls and 1 and 2 are the before and after treatment periods then an estimate of the impact of treatment is: (E T2 E C2 ) (E T1 E C1 ) or (E T2 E T1 ) (E C2 E C1 ) Most famous piece is Card and Krueger s (1994) New Jersey / Pennsylvania comparison
38 New Jersey/Pennsylvania Comparison (Card and Krueger, 1994) Can be viewed as case study of fast food industry. Surveyed fast food restaurants in New Jersey and Pennsylvania in February-March and November-December In April 1992 the New Jersey minimum wage went up from the federal minimum level of $4.25 to $5.05 but the minimum in Pennsylvania remained at $4.25.
39 Minimum Wages and Employment: A Case Study of the Fast-Food Industry in New Jersey and Pennsylvania David Card and Alan B. Krueger American Economic Review 84(4), September 1994:

40 Question of Interest How do employers in a low-wage labor market respond to an increase in the minimum wage? Approach Compare employment of teenagers in New Jersey and eastern Pennsylvania before and after the increase in the minimum wage in NJ from $4.25 to $5.05 on April 1, Methods of Analysis Difference-in-Differences Regression Analysis

41 Data Phone survey of fast-food restaurants in NJ and eastern Penn (personal interview for 28 stores in wave 2) Wave 1: late Feb. and early Mar Wave 2: Nov. and Dec Restaurants: Burger King, KFC, Wendy s and Roy Rogers 371 restaurants were interviewed in both waves What if employment increased when the MW in NJ increased? Did the increase in MW cause the increase in employment?
42 Correlation does not mean causation. Could be that econ conds improved, which caused E to go up. Difference-in-Differences Approach Premise Economic conditions in NJ and eastern Penn are the same. Compare E change in NJ before and after the MW change, with the E change in eastern Penn in the same time period. If NJ and eastern Penn E grow at the same rate, MW would have had no effect. If E in Penn grew or stayed the same, and E in NJ fell evidence that MW decreases E.
43 Results of Difference-in-Difference Analysis Employment in Typical Fast-Food Restaurants (in FTEs) NJ E Penn Before change After change Difference Difference-in-Differences = 0.6 (-2.1) = 2.7 NJ: Employment increased after MW. E Penn: Employment decreased after MW depressed economy in E Penn and NJ. Despite declining economic conditions, in E Penn (and presumably NJ), employment increased in NJ.
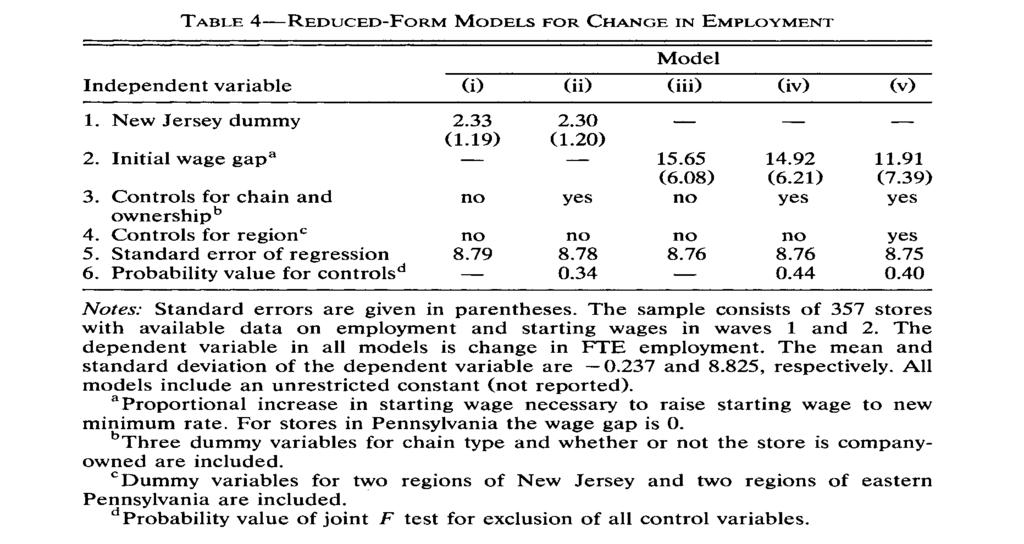
44 Regression Analysis Equation (1a): E = a + bx + cnj E = change in employment from wave 1 to wave 2 at a given restaurant X = set of characteristics of the restaurant NJ = 1 if restaurant is in New Jersey; NJ = 0 if restaurant is in eastern Pennsylvania. If c < 0, E lower for NJ than for Penn restaurants after the MW If c > 0, E higher for NJ If c = 0, no difference in the change in E
45 Equation (1b): E = a + b X + c GAP GAP = 0 for stores in Penn GAP = 0 for stores in NJ with W 1 $5.15 GAP = (5.05 W 1 )/ W 1 for other stores in NJ GAP is the proportional increase in wages needed to meet the new MW. If c < 0, an increase in the required wage hike, results in a negative change in employment. If c > 0, E higher as stores have to pay more to meet the MW requirement. If c = 0, no difference in the change in E for stores that have to increase wages more.
46 Regression Results Equation (1a): E = a + bx + cnj c >0 Equation (1b): E = a + b X + c GAP c >0 Indicates MW is positively associated with E. Results robust across many specification tests. Conclusion April, 1992 rise in the MW did not decrease employment of teens in fast-food restaurants in New Jersey.
47 Why Counter-Intuitive Result? Survey data may not accurately measure actual employment. (Neumark and Wachter (2000) use establishment data with same methodology and find a zero or slightly negative effect.) Fast-food restaurants may not be representative of low-wage employers, e.g., there may be fewer opportunities to substitute capital for labor. Employers may need more time to adjust to minimum wage changes than comparing just before and just after a change.

48 Why Counter-Intuitive Result? Economic health of the fast-food market in E Penn may be an imperfect match for NJ. Adjustment may begin before MW takes effect.
49 Identification of Employment Effects ΔE i = a + bx i + cnj i + e i ΔE i = a + b X i + c GAP i + e i Where GAP = 0 for P stores and NJ stores with W 1i $5.05 and = ( W 1i ) / W 1i for other NJ stores/

50 New Jersey/Pennsylvania Comparison (Continued)
51 Employment Models
52 Card and Krieger (1994) dataset (fastfood.dta) can be obtained here:
Lecture 9. Matthew Osborne
 Lecture 9 Matthew Osborne 22 September 2006 Potential Outcome Model Try to replicate experimental data. Social Experiment: controlled experiment. Caveat: usually very expensive. Natural Experiment: observe
Difference-in-Differences Methods
 Difference-in-Differences Methods Teppei Yamamoto Keio University Introduction to Causal Inference Spring 2016 1 Introduction: A Motivating Example 2 Identification 3 Estimation and Inference 4 Diagnostics
 STOCKHOLM UNIVERSITY Department of Economics Course name: Empirical Methods Course code: EC40 Examiner: Lena Nekby Number of credits: 7,5 credits Date of exam: Friday, June 5, 009 Examination time: 3 hours
PSC 504: Differences-in-differeces estimators
 PSC 504: Differences-in-differeces estimators Matthew Blackwell 3/22/2013 Basic differences-in-differences model Setup e basic idea behind a differences-in-differences model (shorthand: diff-in-diff, DID,
Causality and Experiments
 Causality and Experiments Michael R. Roberts Department of Finance The Wharton School University of Pennsylvania April 13, 2009 Michael R. Roberts Causality and Experiments 1/15 Motivation Introduction
Problem set - Selection and Diff-in-Diff
 Problem set - Selection and Diff-in-Diff 1. You want to model the wage equation for women You consider estimating the model: ln wage = α + β 1 educ + β 2 exper + β 3 exper 2 + ɛ (1) Read the data into
The Generalized Roy Model and Treatment Effects
 The Generalized Roy Model and Treatment Effects Christopher Taber University of Wisconsin November 10, 2016 Introduction From Imbens and Angrist we showed that if one runs IV, we get estimates of the Local
Potential Outcomes Model (POM)
") Potential Outcomes Model (POM) Relationship Between Counterfactual States Causality Empirical Strategies in Labor Economics, Angrist Krueger (1999): The most challenging empirical questions in economics
Potential Outcomes Model (POM) Relationship Between Counterfactual States Causality Empirical Strategies in Labor Economics, Angrist Krueger (1999): The most challenging empirical questions in economics
Empirical approaches in public economics
 Empirical approaches in public economics ECON4624 Empirical Public Economics Fall 2016 Gaute Torsvik Outline for today The canonical problem Basic concepts of causal inference Randomized experiments Non-experimental
Gov 2002: 9. Differences in Differences
 Gov 2002: 9. Differences in Differences Matthew Blackwell October 30, 2015 1 / 40 1. Basic differences-in-differences model 2. Conditional DID 3. Standard error issues 4. Other DID approaches 2 / 40 Where
Quantitative Economics for the Evaluation of the European Policy
 Quantitative Economics for the Evaluation of the European Policy Dipartimento di Economia e Management Irene Brunetti Davide Fiaschi Angela Parenti 1 25th of September, 2017 1 ireneb@ec.unipi.it, davide.fiaschi@unipi.it,
Applied Econometrics (MSc.) Lecture 3 Instrumental Variables
 Lecture 3 Instrumental Variables") Applied Econometrics (MSc.) Lecture 3 Instrumental Variables Estimation - Theory Department of Economics University of Gothenburg December 4, 2014 1/28 Why IV estimation? So far, in OLS, we assumed independence.
Applied Econometrics (MSc.) Lecture 3 Instrumental Variables Estimation - Theory Department of Economics University of Gothenburg December 4, 2014 1/28 Why IV estimation? So far, in OLS, we assumed independence.
Development. ECON 8830 Anant Nyshadham
 Development ECON 8830 Anant Nyshadham Projections & Regressions Linear Projections If we have many potentially related (jointly distributed) variables Outcome of interest Y Explanatory variable of interest
Does Employment Respond to the Minimum Wage?
 Does Employment Respond to the Minimum Wage? A Meta-analysis of Recent Results in the New Minimum Wage Research Dale Belman and Paul Wolfson The Congress finds that the existence, in industries engaged
Introduction to causal identification. Nidhiya Menon IGC Summer School, New Delhi, July 2015
 Introduction to causal identification Nidhiya Menon IGC Summer School, New Delhi, July 2015 Outline 1. Micro-empirical methods 2. Rubin causal model 3. More on Instrumental Variables (IV) Estimating causal
Optimal Insurance of Search Risk
 Optimal Insurance of Search Risk Mikhail Golosov Yale University and NBER Pricila Maziero University of Pennsylvania Guido Menzio University of Pennsylvania and NBER November 2011 Introduction Search and
Econometrics in a nutshell: Variation and Identification Linear Regression Model in STATA. Research Methods. Carlos Noton.
 1/17 Research Methods Carlos Noton Term 2-2012 Outline 2/17 1 Econometrics in a nutshell: Variation and Identification 2 Main Assumptions 3/17 Dependent variable or outcome Y is the result of two forces:
Econometrics of causal inference. Throughout, we consider the simplest case of a linear outcome equation, and homogeneous
 Econometrics of causal inference Throughout, we consider the simplest case of a linear outcome equation, and homogeneous effects: y = βx + ɛ (1) where y is some outcome, x is an explanatory variable, and
Notes on Heterogeneity, Aggregation, and Market Wage Functions: An Empirical Model of Self-Selection in the Labor Market
 Notes on Heterogeneity, Aggregation, and Market Wage Functions: An Empirical Model of Self-Selection in the Labor Market Heckman and Sedlacek, JPE 1985, 93(6), 1077-1125 James Heckman University of Chicago
Recitation Notes 6. Konrad Menzel. October 22, 2006
 Recitation Notes 6 Konrad Menzel October, 006 Random Coefficient Models. Motivation In the empirical literature on education and earnings, the main object of interest is the human capital earnings function
Real Business Cycle Model (RBC)
") Real Business Cycle Model (RBC) Seyed Ali Madanizadeh November 2013 RBC Model Lucas 1980: One of the functions of theoretical economics is to provide fully articulated, artificial economic systems that
Real Business Cycle Model (RBC) Seyed Ali Madanizadeh November 2013 RBC Model Lucas 1980: One of the functions of theoretical economics is to provide fully articulated, artificial economic systems that
 STOCKHOLM UNIVERSITY Department of Economics Course name: Empirical Methods Course code: EC40 Examiner: Per Pettersson-Lidbom Number of creds: 7,5 creds Date of exam: Thursday, January 15, 009 Examination
EMERGING MARKETS - Lecture 2: Methodology refresher
 EMERGING MARKETS - Lecture 2: Methodology refresher Maria Perrotta April 4, 2013 SITE http://www.hhs.se/site/pages/default.aspx My contact: maria.perrotta@hhs.se Aim of this class There are many different
Dynamics and Monetary Policy in a Fair Wage Model of the Business Cycle
 Dynamics and Monetary Policy in a Fair Wage Model of the Business Cycle David de la Croix 1,3 Gregory de Walque 2 Rafael Wouters 2,1 1 dept. of economics, Univ. cath. Louvain 2 National Bank of Belgium
ECON Introductory Econometrics. Lecture 17: Experiments
 ECON4150 - Introductory Econometrics Lecture 17: Experiments Monique de Haan (moniqued@econ.uio.no) Stock and Watson Chapter 13 Lecture outline 2 Why study experiments? The potential outcome framework.
More on Roy Model of Self-Selection
 V. J. Hotz Rev. May 26, 2007 More on Roy Model of Self-Selection Results drawn on Heckman and Sedlacek JPE, 1985 and Heckman and Honoré, Econometrica, 1986. Two-sector model in which: Agents are income
14.74 Lecture 10: The returns to human capital: education
 14.74 Lecture 10: The returns to human capital: education Esther Duflo March 7, 2011 Education is a form of human capital. You invest in it, and you get returns, in the form of higher earnings, etc...
14.44/ Energy Economics, Spring 2006 Problem Set 2
 14.44/14.444 Energy Economics, Spring 2006 Problem Set 2 Due Friday February 23, 2006 in class or Arthur Campbell s mail folder Late problem sets are not accepted This problem set reviews your knowledge
Write your identification number on each paper and cover sheet (the number stated in the upper right hand corner on your exam cover).
.") STOCKHOLM UNIVERSITY Department of Economics Course name: Empirical Methods in Economics 2 Course code: EC2402 Examiner: Peter Skogman Thoursie Number of credits: 7,5 credits (hp) Date of exam: Saturday,
STOCKHOLM UNIVERSITY Department of Economics Course name: Empirical Methods in Economics 2 Course code: EC2402 Examiner: Peter Skogman Thoursie Number of credits: 7,5 credits (hp) Date of exam: Saturday,
Chapter 6: Policy Evaluation Methods: Treatment Effects
 Chapter 6: Policy Evaluation Methods: Treatment Effects Joan Llull Microeconometrics IDEA PhD Program I. Potential Outcomes and Causality A. Potential Outcomes, Selection Bias, and Treatment Effects Consider
Macroeconomics Theory II
 Macroeconomics Theory II Francesco Franco FEUNL February 2011 Francesco Franco Macroeconomics Theory II 1/34 The log-linear plain vanilla RBC and ν(σ n )= ĉ t = Y C ẑt +(1 α) Y C ˆn t + K βc ˆk t 1 + K
CEPA Working Paper No
 CEPA Working Paper No. 15-06 Identification based on Difference-in-Differences Approaches with Multiple Treatments AUTHORS Hans Fricke Stanford University ABSTRACT This paper discusses identification based
Rising Wage Inequality and the Effectiveness of Tuition Subsidy Policies:
 Rising Wage Inequality and the Effectiveness of Tuition Subsidy Policies: Explorations with a Dynamic General Equilibrium Model of Labor Earnings based on Heckman, Lochner and Taber, Review of Economic
PubPol 201. Module 3: International Trade Policy. Class 4 Outline. Class 4 Outline. Class 4 China Shock
 PubPol 201 Module 3: International Trade Policy Class 4 China s growth The The ADH analysis Other sources Class 4 Outline Lecture 4: China 2 China s growth The The ADH analysis Other sources Class 4 Outline
The Dark Corners of the Labor Market
 The Dark Corners of the Labor Market Vincent Sterk Conference on Persistent Output Gaps: Causes and Policy Remedies EABCN / University of Cambridge / INET University College London September 2015 Sterk
Approximation of Functions
 Approximation of Functions Carlos Hurtado Department of Economics University of Illinois at Urbana-Champaign hrtdmrt2@illinois.edu Nov 7th, 217 C. Hurtado (UIUC - Economics) Numerical Methods On the Agenda
Econometrics Homework 4 Solutions
 Econometrics Homework 4 Solutions Question 1 (a) General sources of problem: measurement error in regressors, omitted variables that are correlated to the regressors, and simultaneous equation (reverse
Experiments and Quasi-Experiments
 Experiments and Quasi-Experiments (SW Chapter 13) Outline 1. Potential Outcomes, Causal Effects, and Idealized Experiments 2. Threats to Validity of Experiments 3. Application: The Tennessee STAR Experiment
Explaining Rising Wage Inequality: Explorations With a Dynamic General Equilibrium Model of Labor Earnings with Heterogeneous Agents
 Explaining Rising Wage Inequality: Explorations With a Dynamic General Equilibrium Model of Labor Earnings with Heterogeneous Agents James J. Heckman, Lance Lochner, and Christopher Taber April 22, 2009
Population Aging, Labor Demand, and the Structure of Wages
 Population Aging, Labor Demand, and the Structure of Wages Margarita Sapozhnikov 1 Robert K. Triest 2 1 CRA International 2 Federal Reserve Bank of Boston Assessing the Impact of New England s Demographics
Econometrics (60 points) as the multivariate regression of Y on X 1 and X 2? [6 points]
![Econometrics (60 points) as the multivariate regression of Y on X 1 and X 2? [6 points]](/thumbs/72/66990660.jpg "Econometrics (60 points) as the multivariate regression of Y on X 1 and X 2? [6 points]") Econometrics (60 points) Question 7: Short Answers (30 points) Answer parts 1-6 with a brief explanation. 1. Suppose the model of interest is Y i = 0 + 1 X 1i + 2 X 2i + u i, where E(u X)=0 and E(u 2 X)=
Econometrics (60 points) Question 7: Short Answers (30 points) Answer parts 1-6 with a brief explanation. 1. Suppose the model of interest is Y i = 0 + 1 X 1i + 2 X 2i + u i, where E(u X)=0 and E(u 2 X)=
Online Appendix The Growth of Low Skill Service Jobs and the Polarization of the U.S. Labor Market. By David H. Autor and David Dorn
 Online Appendix The Growth of Low Skill Service Jobs and the Polarization of the U.S. Labor Market By David H. Autor and David Dorn 1 2 THE AMERICAN ECONOMIC REVIEW MONTH YEAR I. Online Appendix Tables
Cross-Country Differences in Productivity: The Role of Allocation and Selection
 Cross-Country Differences in Productivity: The Role of Allocation and Selection Eric Bartelsman, John Haltiwanger & Stefano Scarpetta American Economic Review (2013) Presented by Beatriz González January
Wooldridge, Introductory Econometrics, 3d ed. Chapter 16: Simultaneous equations models. An obvious reason for the endogeneity of explanatory
 Wooldridge, Introductory Econometrics, 3d ed. Chapter 16: Simultaneous equations models An obvious reason for the endogeneity of explanatory variables in a regression model is simultaneity: that is, one
150C Causal Inference
 150C Causal Inference Difference in Differences Jonathan Mummolo Stanford Selection on Unobservables Problem Often there are reasons to believe that treated and untreated units differ in unobservable characteristics
Treatment Effects. Christopher Taber. September 6, Department of Economics University of Wisconsin-Madison
 Treatment Effects Christopher Taber Department of Economics University of Wisconsin-Madison September 6, 2017 Notation First a word on notation I like to use i subscripts on random variables to be clear
Florian Hoffmann. September - December Vancouver School of Economics University of British Columbia
 Lecture Notes on Graduate Labor Economics Section 1a: The Neoclassical Model of Labor Supply - Static Formulation Copyright: Florian Hoffmann Please do not Circulate Florian Hoffmann Vancouver School of
Introduction to Econometrics
 Introduction to Econometrics STAT-S-301 Experiments and Quasi-Experiments (2016/2017) Lecturer: Yves Dominicy Teaching Assistant: Elise Petit 1 Why study experiments? Ideal randomized controlled experiments
Addressing Analysis Issues REGRESSION-DISCONTINUITY (RD) DESIGN
 DESIGN") Addressing Analysis Issues REGRESSION-DISCONTINUITY (RD) DESIGN Overview Assumptions of RD Causal estimand of interest Discuss common analysis issues In the afternoon, you will have the opportunity to
Addressing Analysis Issues REGRESSION-DISCONTINUITY (RD) DESIGN Overview Assumptions of RD Causal estimand of interest Discuss common analysis issues In the afternoon, you will have the opportunity to
Heterogeneity and Causality: Unit Heterogeneity and Design Sensitivity in Observational Studies. Paul R. Rosenbaum, University of Pennsylvania
 Heterogeneity and Causality: Unit Heterogeneity and Design Sensitivity in Observational Studies Paul R. Rosenbaum, University of Pennsylvania References [1] Rosenbaum, P. R. (2005) Heterogeneity and causality:
Mortenson Pissarides Model
 Mortenson Pissarides Model Prof. Lutz Hendricks Econ720 November 22, 2017 1 / 47 Mortenson / Pissarides Model Search models are popular in many contexts: labor markets, monetary theory, etc. They are distinguished
Recitation Notes 5. Konrad Menzel. October 13, 2006
 ecitation otes 5 Konrad Menzel October 13, 2006 1 Instrumental Variables (continued) 11 Omitted Variables and the Wald Estimator Consider a Wald estimator for the Angrist (1991) approach to estimating
The challenge of globalization for Finland and its regions: The new economic geography perspective
 The challenge of globalization for Finland and its regions: The new economic geography perspective Prepared within the framework of study Finland in the Global Economy, Prime Minister s Office, Helsinki
RBC Model with Indivisible Labor. Advanced Macroeconomic Theory
 RBC Model with Indivisible Labor Advanced Macroeconomic Theory 1 Last Class What are business cycles? Using HP- lter to decompose data into trend and cyclical components Business cycle facts Standard RBC
Economics 2450A: Public Economics Section 8: Optimal Minimum Wage and Introduction to Capital Taxation
 Economics 2450A: Public Economics Section 8: Optimal Minimum Wage and Introduction to Capital Taxation Matteo Paradisi November 1, 2016 In this Section we develop a theoretical analysis of optimal minimum
Closed economy macro dynamics: AD-AS model and RBC model.
 Closed economy macro dynamics: AD-AS model and RBC model. Ragnar Nymoen Department of Economics, UiO 22 September 2009 Lecture notes on closed economy macro dynamics AD-AS model Inflation targeting regime.
Treatment Effects with Normal Disturbances in sampleselection Package
 Treatment Effects with Normal Disturbances in sampleselection Package Ott Toomet University of Washington December 7, 017 1 The Problem Recent decades have seen a surge in interest for evidence-based policy-making.
Incentives and Nutrition for Rotten Kids: Intrahousehold Food Allocation in the Philippines
 Incentives and Nutrition for Rotten Kids: Intrahousehold Food Allocation in the Philippines Pierre Dubois and Ethan Ligon presented by Rachel Heath November 3, 2006 Introduction Outline Introduction Modification
Appendix A: Topline questionnaire
 Appendix A: Topline questionnaire 2016 RACIAL ATTITUDES IN AMERICA III FINAL TOPLINE FEBRUARY 29-MAY 8, 2016 NOTE: ALL NUMBERS ARE PERCENTAGES. THE PERCENTAGES LESS THAN 0.5% ARE REPLACED BY AN ASTERISK
LECTURE 2: SIMPLE REGRESSION I
 LECTURE 2: SIMPLE REGRESSION I 2 Introducing Simple Regression Introducing Simple Regression 3 simple regression = regression with 2 variables y dependent variable explained variable response variable
1 Impact Evaluation: Randomized Controlled Trial (RCT)
") Introductory Applied Econometrics EEP/IAS 118 Fall 2013 Daley Kutzman Section #12 11-20-13 Warm-Up Consider the two panel data regressions below, where i indexes individuals and t indexes time in months:
Introductory Applied Econometrics EEP/IAS 118 Fall 2013 Daley Kutzman Section #12 11-20-13 Warm-Up Consider the two panel data regressions below, where i indexes individuals and t indexes time in months:
Toulouse School of Economics, Macroeconomics II Franck Portier. Homework 1. Problem I An AD-AS Model
 Toulouse School of Economics, 2009-2010 Macroeconomics II Franck Portier Homework 1 Problem I An AD-AS Model Let us consider an economy with three agents (a firm, a household and a government) and four
14.461: Technological Change, Lecture 4 Competition and Innovation
 14.461: Technological Change, Lecture 4 Competition and Innovation Daron Acemoglu MIT September 19, 2011. Daron Acemoglu (MIT) Competition and Innovation September 19, 2011. 1 / 51 Competition and Innovation
Population and Employment Forecast
 Population and Employment Forecast How Do We Get the Numbers? Thurston Regional Planning Council Technical Brief Updated July 2012 We plan for forecast growth in Population and Employment, but where do
Rockefeller College University at Albany
 Rockefeller College University at Albany PAD 705 Handout: Simultaneous quations and Two-Stage Least Squares So far, we have studied examples where the causal relationship is quite clear: the value of the
The returns to schooling, ability bias, and regression
 The returns to schooling, ability bias, and regression Jörn-Steffen Pischke LSE October 4, 2016 Pischke (LSE) Griliches 1977 October 4, 2016 1 / 44 Counterfactual outcomes Scholing for individual i is
Applied Microeconometrics (L5): Panel Data-Basics
: Panel Data-Basics") Applied Microeconometrics (L5): Panel Data-Basics Nicholas Giannakopoulos University of Patras Department of Economics ngias@upatras.gr November 10, 2015 Nicholas Giannakopoulos (UPatras) MSc Applied Economics
Applied Microeconometrics (L5): Panel Data-Basics Nicholas Giannakopoulos University of Patras Department of Economics ngias@upatras.gr November 10, 2015 Nicholas Giannakopoulos (UPatras) MSc Applied Economics
Lecture 11 Roy model, MTE, PRTE
 Lecture 11 Roy model, MTE, PRTE Economics 2123 George Washington University Instructor: Prof. Ben Williams Roy Model Motivation The standard textbook example of simultaneity is a supply and demand system
Controlling for Time Invariant Heterogeneity
 Controlling for Time Invariant Heterogeneity Yona Rubinstein July 2016 Yona Rubinstein (LSE) Controlling for Time Invariant Heterogeneity 07/16 1 / 19 Observables and Unobservables Confounding Factors
1. Money in the utility function (start)
") Monetary Economics: Macro Aspects, 1/3 2012 Henrik Jensen Department of Economics University of Copenhagen 1. Money in the utility function (start) a. The basic money-in-the-utility function model b. Optimal
Monetary Economics: Macro Aspects, 1/3 2012 Henrik Jensen Department of Economics University of Copenhagen 1. Money in the utility function (start) a. The basic money-in-the-utility function model b. Optimal
Causal Inference with Big Data Sets
 Causal Inference with Big Data Sets Marcelo Coca Perraillon University of Colorado AMC November 2016 1 / 1 Outlone Outline Big data Causal inference in economics and statistics Regression discontinuity
The Making Of A Great Contraction. With A Liquidity Trap And A Jobless Recovery. Columbia University
 The Making Of A Great Contraction With A Liquidity Trap And A Jobless Recovery Stephanie Schmitt-Grohé Martín Uribe Columbia University November 5, 2013 A jobless recovery is a situation in which: Output
A time series plot: a variable Y t on the vertical axis is plotted against time on the horizontal axis
 TIME AS A REGRESSOR A time series plot: a variable Y t on the vertical axis is plotted against time on the horizontal axis Many economic variables increase or decrease with time A linear trend relationship
11/11/2016. Energy Impacts Research Coordination Network >>>
 Energy Impacts Research Coordination Network >>> www.energyimpacts.org Synergies and Innovations in Coordinating Energy Impacts Research: The Case of Shale Development Impacts November 10, 2016, 1:30 2:30
Lecture 4: Linear panel models
 Lecture 4: Linear panel models Luc Behaghel PSE February 2009 Luc Behaghel (PSE) Lecture 4 February 2009 1 / 47 Introduction Panel = repeated observations of the same individuals (e.g., rms, workers, countries)
Basic econometrics. Tutorial 3. Dipl.Kfm. Johannes Metzler
 Basic econometrics Tutorial 3 Dipl.Kfm. Introduction Some of you were asking about material to revise/prepare econometrics fundamentals. First of all, be aware that I will not be too technical, only as
General Equilibrium and Welfare
 and Welfare Lectures 2 and 3, ECON 4240 Spring 2017 University of Oslo 24.01.2017 and 31.01.2017 1/37 Outline General equilibrium: look at many markets at the same time. Here all prices determined in the
Regression Discontinuity Designs.
 Regression Discontinuity Designs. Department of Economics and Management Irene Brunetti ireneb@ec.unipi.it 31/10/2017 I. Brunetti Labour Economics in an European Perspective 31/10/2017 1 / 36 Introduction
Planning for Economic and Job Growth
 Planning for Economic and Job Growth Mayors Innovation Project Winter 2012 Meeting January 21, 2012 Mary Kay Leonard Initiative for a Competitive Inner City AGENDA The Evolving Model for Urban Economic
Modelling Czech and Slovak labour markets: A DSGE model with labour frictions
 Modelling Czech and Slovak labour markets: A DSGE model with labour frictions Daniel Němec Faculty of Economics and Administrations Masaryk University Brno, Czech Republic nemecd@econ.muni.cz ESF MU (Brno)
Econ 2148, fall 2017 Instrumental variables I, origins and binary treatment case
 Econ 2148, fall 2017 Instrumental variables I, origins and binary treatment case Maximilian Kasy Department of Economics, Harvard University 1 / 40 Agenda instrumental variables part I Origins of instrumental
(a) Write down the Hamilton-Jacobi-Bellman (HJB) Equation in the dynamic programming
 Write down the Hamilton-Jacobi-Bellman (HJB) Equation in the dynamic programming") 1. Government Purchases and Endogenous Growth Consider the following endogenous growth model with government purchases (G) in continuous time. Government purchases enhance production, and the production
1. Government Purchases and Endogenous Growth Consider the following endogenous growth model with government purchases (G) in continuous time. Government purchases enhance production, and the production
MA Macroeconomics 3. Introducing the IS-MP-PC Model
 MA Macroeconomics 3. Introducing the IS-MP-PC Model Karl Whelan School of Economics, UCD Autumn 2014 Karl Whelan (UCD) Introducing the IS-MP-PC Model Autumn 2014 1 / 38 Beyond IS-LM We have reviewed the
R E SEARCH HIGHLIGHTS
 Canada Research Chair in Urban Change and Adaptation R E SEARCH HIGHLIGHTS Research Highlight No.8 November 2006 THE IMPACT OF ECONOMIC RESTRUCTURING ON INNER CITY WINNIPEG Introduction This research highlight
Properties of estimator Functional Form. Econometrics. Lecture 8. Nathaniel Higgins JHU. Nathaniel Higgins Lecture 8
 Econometrics Lecture 8 Nathaniel Higgins JHU Homework Next class: GDP, population, temperature, energy, and mortality data together by Nov. 9 (next class) If you have questions / need help, let Rob or
14.461: Technological Change, Lecture 4 Technology and the Labor Market
 14.461: Technological Change, Lecture 4 Technology and the Labor Market Daron Acemoglu MIT September 20, 2016. Daron Acemoglu (MIT) Technology and the Labor Market September 20, 2016. 1 / 51 Technology
Using regression to study economic relationships is called econometrics. econo = of or pertaining to the economy. metrics = measurement
 EconS 450 Forecasting part 3 Forecasting with Regression Using regression to study economic relationships is called econometrics econo = of or pertaining to the economy metrics = measurement Econometrics
Next week Professor Saez will discuss. This week John and I will
 Next Week's Topic Income Inequality and Tax Policy Next week Professor Saez will discuss Atkinson, Anthony, Thomas Piketty and Emmanuel Saez, Top Incomes in the Long Run of History, Alvaredo, Facundo,
An example to start off with
 Impact Evaluation Technical Track Session IV Instrumental Variables Christel Vermeersch Human Development Human Network Development Network Middle East and North Africa Region World Bank Institute Spanish
Chapter 9. Natural Resources and Economic Growth. Instructor: Dmytro Hryshko
 Chapter 9. Natural Resources and Economic Growth Instructor: Dmytro Hryshko Motivation We want to understand growth in the presence of the earth's nite supply of arable land and nonrenewable natural resources
Global Value Chain Participation and Current Account Imbalances
 Global Value Chain Participation and Current Account Imbalances Johannes Brumm University of Zurich Georgios Georgiadis European Central Bank Johannes Gräb European Central Bank Fabian Trottner Princeton
Simple Regression Model. January 24, 2011
 Simple Regression Model January 24, 2011 Outline Descriptive Analysis Causal Estimation Forecasting Regression Model We are actually going to derive the linear regression model in 3 very different ways
MA Macroeconomics 4. Analysing the IS-MP-PC Model
 MA Macroeconomics 4. Analysing the IS-MP-PC Model Karl Whelan School of Economics, UCD Autumn 2014 Karl Whelan (UCD) Analysing the IS-MP-PC Model Autumn 2014 1 / 28 Part I Inflation Expectations Karl Whelan
Lecture 8. Roy Model, IV with essential heterogeneity, MTE
 Lecture 8. Roy Model, IV with essential heterogeneity, MTE Economics 2123 George Washington University Instructor: Prof. Ben Williams Heterogeneity When we talk about heterogeneity, usually we mean heterogeneity
14.461: Technological Change, Lecture 3 Competition, Policy and Technological Progress
 14.461: Technological Change, Lecture 3 Competition, Policy and Technological Progress Daron Acemoglu MIT September 15, 2016. Daron Acemoglu (MIT) Competition, Policy and Innovation September 15, 2016.
Internal vs. external validity. External validity. This section is based on Stock and Watson s Chapter 9.
 Section 7 Model Assessment This section is based on Stock and Watson s Chapter 9. Internal vs. external validity Internal validity refers to whether the analysis is valid for the population and sample
Data Matrix User Guide
 Data Matrix User Guide 1. Introduction The 2017 Data Matrix is designed to support the 2017 iteration of the Regional Skills Assessments (RSAs) in Scotland. The RSAs align with the Regional Outcome Agreement
The Design of a University System
 The Design of a University System Gianni De Fraja University of Leicester, Università di Roma Tor Vergata and CEPR Paola Valbonesi Università di Padova Public Economics UK 27 May 2011 Abstract This paper
Assessing the Employment Agglomeration and Social Accessibility Impacts of High Speed Rail in Eastern Australia: Sydney-Canberra-Melbourne Corridor
 Assessing the Employment Agglomeration and Social Accessibility Impacts of High Speed Rail in Eastern Australia: Sydney-Canberra-Melbourne Corridor Professor David A. Hensher FASSA Founding Director Institute
Gov 2002: 4. Observational Studies and Confounding
 Gov 2002: 4. Observational Studies and Confounding Matthew Blackwell September 10, 2015 Where are we? Where are we going? Last two weeks: randomized experiments. From here on: observational studies. What