Does Employment Respond to the Minimum Wage?
|
|
|
- Harvey Berry
- 5 years ago
- Views:
Transcription
1 Does Employment Respond to the Minimum Wage? A Meta-analysis of Recent Results in the New Minimum Wage Research Dale Belman and Paul Wolfson
2 The Congress finds that the existence, in industries engaged in commerce or in the production of goods for commerce, of labor conditions detrimental to the maintenance of the minimum standard of living necessary for health, efficiency, and general well-being of workers. -preamble, Fair Labor Standards Act (1937)
3
4 Recent Work Summary of effects of the MW for subpopulations: Who Does the Minimum Wage Effect? Women, single women, teens, low education, low wage industries, low wages and low income families Updating and improving meta-analysis of employment effects. Estimating the effect of the MW on family income Interesting if disconcerting differences between data sets.
5 New Minimum Wage Research Last 2 decades of research Inspired by 1991 conference at Cornell Most famous study - Card & Krueger (1994) fast food employment in New Jersey & Pennsylvania More heterogeneous than earlier research Data sources Data structures Econometric techniques Measurement of Variables Groups & Sectors studied Issues studied
6 Meta-Regression As A Means of Reconciling Estimates Collect point estimates and standard errors from studies Estimate a regression model in which the point estimates of prior studies are the dependent variable. In simplest form: Effect Effect u b u k k 0 k b 0 is the average effect across estimates (articles)
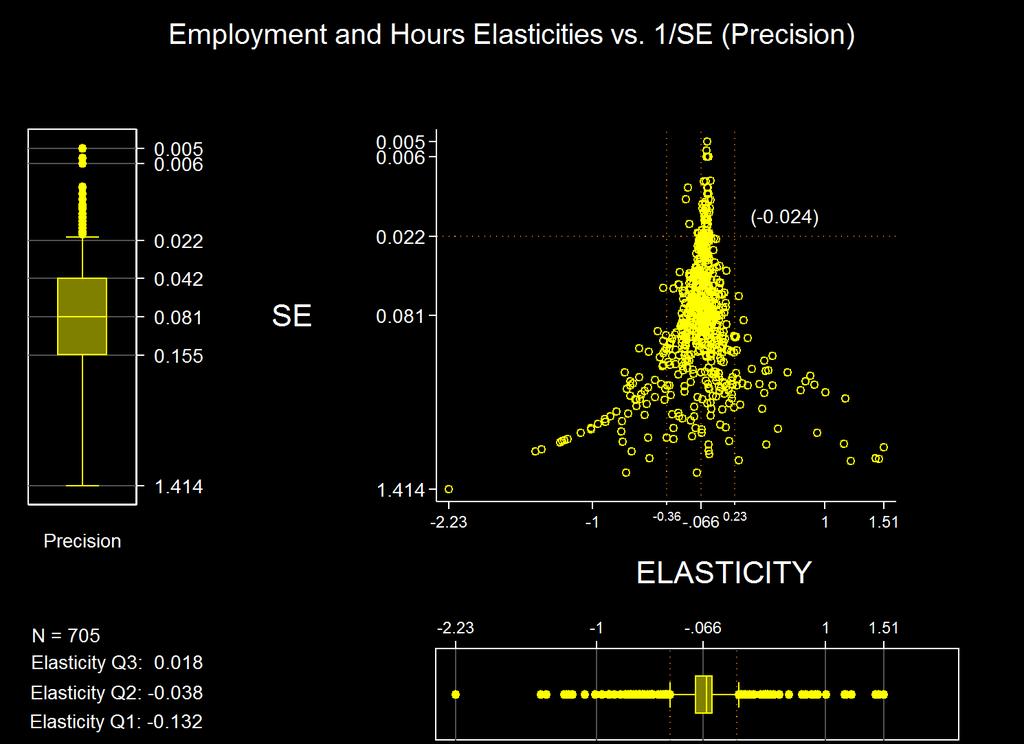
7 Our Data Begin with 57 studies of U.S. data since the AER 2000 exchange between Neumark & Wascher and Card & Krueger Focus has been: is there a statistically significant effect? Not all studies report results in standard units Able to gather (elasticity, SE) pairs from 34 studies From these, 705 observations Ranging from 1 observation to 100+ per study
8
9 Metaregression (Stanley & Doucouliagos 2012 ) 3 issues to consider before estimating a reliable mean effect size Heteroscedasticity Sample selection bias Heterogeneity
10 Heteroscedasticity Effect Effect u b u k k 0 k u ~ N 0, se k 2 k
11 Sample Selection Bias Desire for statistically significant result Desired outcome Sign Size asymmetric or truncated distribution How well do different world views co-exist? Economic Statistical

12
13 Heterogeneity Dependence among estimates from same study Study design Dataset / Data sources Period covered Other Factors
14 Solutions - Heteroscedasticity Effect b u, u ~ N 0, se k 0 k k k 2 Weight each observation by se k 2
15 Solutions Sample Selection Bias (1) Canonical Heckman Correction Prob(Selected Z) = Φ(Zγ) Y = Xβ + u, u E(Y X & Selected) = Xβ + (σ u ρ)λ(zγ) λ(zγ) inverse mills ratio σ u ρ: estimated coefficient on IMR 2 ~ N 0, u ρ correlation between u and error term of selection equation
16 Solutions Sample Selection Bias (2) Meta-analysis Only selected observations observed at all! Cannot estimate IMR However, se k is an estimate of σ u,k Include it in Metaregression Assume constancy of ρλ Effect b b se u k 0 1 k k Assume ρλ ~ se k 2 Effect b b se u k 0 1 k k
17 Solutions - Heterogeneity After correcting for heteroscedasticity, the error terms should each have equal variance Cochrane s Q test Effectk b0 uk Estimate tk vk, vk sek sek sek SSR ~ 2 K 1 under the null (homogeneity) If reject, incorporate other explanatory variables into the equation
18 Results (First Cut) Heteroscedasticity & Sample Selection 2 elasticity k b0 b1 sek uk elasticity b b se u b se p b se p WLS estimates SEs calculated by clustering within studies k 0 1 k k Cochran s Q=2269: for the, p < 0.001
19 MRA - Procedure General to Specific (p-value target 0.5) Explanatory variables (General) Targets Geographic Reach Employment Measure Data Frequency, Source, Type, Date Other Breusch-Pagan for study effects strongly indicated 1 st : Effects x precision 2 nd : Effects Hausman test (RE vs. FE) problematic, so FEs
20 Point MetaEstimates WLS: elasticity Coef. Clustered Std. Err. t precision INTERACTED WITH precision (1/se) quasi_exp Female NoHS teen Pd_Annual Pd_Monthly Y Y Y
21 Linear Combinations of Interest WLS: elasticity Coef. Std. Err. t Teens Teens, Quasi-Experiment Female Female, Quasi-Experiment No HS No HS, Quasi-Experiment
22 Conclusions Work in Progress- results are provisional Strong evidence of publication bias Most apparently due to reluctance to publish statistically insignificant results MRA has allowed for elasticity estimates purged of publication bias Teens: effect is small but not so small as in other recent work Restaurants: no distinct effect detectable, thus
23 Some Additional Observations Research on the minimum wage is the only research in economics in which we care about elasticities of -0.1 Given the regular movement in and out of employment by low wage workers, we are more likely to be in a world in which individuals realize the tradeoff between wages and employment implied by the small negative elasticity.
Graduate Econometrics Lecture 4: Heteroskedasticity
 Graduate Econometrics Lecture 4: Heteroskedasticity Department of Economics University of Gothenburg November 30, 2014 1/43 and Autocorrelation Consequences for OLS Estimator Begin from the linear model
Lecture 9. Matthew Osborne
 Lecture 9 Matthew Osborne 22 September 2006 Potential Outcome Model Try to replicate experimental data. Social Experiment: controlled experiment. Caveat: usually very expensive. Natural Experiment: observe
Please discuss each of the 3 problems on a separate sheet of paper, not just on a separate page!
 Econometrics - Exam May 11, 2011 1 Exam Please discuss each of the 3 problems on a separate sheet of paper, not just on a separate page! Problem 1: (15 points) A researcher has data for the year 2000 from
Difference-in-Difference estimator. Presented at Summer School 2015 by Ziyodullo Parpiev, PhD June 9, 2015 Tashkent
 Difference-in-Difference estimator Presented at Summer School 2015 by Ziyodullo Parpiev, PhD June 9, 2015 Tashkent Today s Class Non-experimental Methods: Difference-in-differences Understanding how it
Problem set - Selection and Diff-in-Diff
 Problem set - Selection and Diff-in-Diff 1. You want to model the wage equation for women You consider estimating the model: ln wage = α + β 1 educ + β 2 exper + β 3 exper 2 + ɛ (1) Read the data into
Lecture 4: Heteroskedasticity
 Lecture 4: Heteroskedasticity Econometric Methods Warsaw School of Economics (4) Heteroskedasticity 1 / 24 Outline 1 What is heteroskedasticity? 2 Testing for heteroskedasticity White Goldfeld-Quandt Breusch-Pagan
Econometrics of causal inference. Throughout, we consider the simplest case of a linear outcome equation, and homogeneous
 Econometrics of causal inference Throughout, we consider the simplest case of a linear outcome equation, and homogeneous effects: y = βx + ɛ (1) where y is some outcome, x is an explanatory variable, and
Answer all questions from part I. Answer two question from part II.a, and one question from part II.b.
 B203: Quantitative Methods Answer all questions from part I. Answer two question from part II.a, and one question from part II.b. Part I: Compulsory Questions. Answer all questions. Each question carries
Lab 11 - Heteroskedasticity
 Lab 11 - Heteroskedasticity Spring 2017 Contents 1 Introduction 2 2 Heteroskedasticity 2 3 Addressing heteroskedasticity in Stata 3 4 Testing for heteroskedasticity 4 5 A simple example 5 1 1 Introduction
Econometrics. Week 8. Fall Institute of Economic Studies Faculty of Social Sciences Charles University in Prague
 Econometrics Week 8 Institute of Economic Studies Faculty of Social Sciences Charles University in Prague Fall 2012 1 / 25 Recommended Reading For the today Instrumental Variables Estimation and Two Stage
Regression #8: Loose Ends
 Regression #8: Loose Ends Econ 671 Purdue University Justin L. Tobias (Purdue) Regression #8 1 / 30 In this lecture we investigate a variety of topics that you are probably familiar with, but need to touch
Intermediate Econometrics
 Intermediate Econometrics Heteroskedasticity Text: Wooldridge, 8 July 17, 2011 Heteroskedasticity Assumption of homoskedasticity, Var(u i x i1,..., x ik ) = E(u 2 i x i1,..., x ik ) = σ 2. That is, the
Fixed Effects Models for Panel Data. December 1, 2014
 Fixed Effects Models for Panel Data December 1, 2014 Notation Use the same setup as before, with the linear model Y it = X it β + c i + ɛ it (1) where X it is a 1 K + 1 vector of independent variables.
Problem Set #5-Key Sonoma State University Dr. Cuellar Economics 317- Introduction to Econometrics
 Problem Set #5-Key Sonoma State University Dr. Cuellar Economics 317- Introduction to Econometrics C1.1 Use the data set Wage1.dta to answer the following questions. Estimate regression equation wage =
Econometrics Homework 1
 Econometrics Homework Due Date: March, 24. by This problem set includes questions for Lecture -4 covered before midterm exam. Question Let z be a random column vector of size 3 : z = @ (a) Write out z
Making sense of Econometrics: Basics
 Making sense of Econometrics: Basics Lecture 4: Qualitative influences and Heteroskedasticity Egypt Scholars Economic Society November 1, 2014 Assignment & feedback enter classroom at http://b.socrative.com/login/student/
Applied Microeconometrics (L5): Panel Data-Basics
: Panel Data-Basics") Applied Microeconometrics (L5): Panel Data-Basics Nicholas Giannakopoulos University of Patras Department of Economics ngias@upatras.gr November 10, 2015 Nicholas Giannakopoulos (UPatras) MSc Applied Economics
Applied Microeconometrics (L5): Panel Data-Basics Nicholas Giannakopoulos University of Patras Department of Economics ngias@upatras.gr November 10, 2015 Nicholas Giannakopoulos (UPatras) MSc Applied Economics
Econometrics Homework 4 Solutions
 Econometrics Homework 4 Solutions Question 1 (a) General sources of problem: measurement error in regressors, omitted variables that are correlated to the regressors, and simultaneous equation (reverse
Basic econometrics. Tutorial 3. Dipl.Kfm. Johannes Metzler
 Basic econometrics Tutorial 3 Dipl.Kfm. Introduction Some of you were asking about material to revise/prepare econometrics fundamentals. First of all, be aware that I will not be too technical, only as
Variance Decomposition in Regression James M. Murray, Ph.D. University of Wisconsin - La Crosse Updated: October 04, 2017
 Variance Decomposition in Regression James M. Murray, Ph.D. University of Wisconsin - La Crosse Updated: October 04, 2017 PDF file location: http://www.murraylax.org/rtutorials/regression_anovatable.pdf
Week 11 Heteroskedasticity and Autocorrelation
 Week 11 Heteroskedasticity and Autocorrelation İnsan TUNALI Econ 511 Econometrics I Koç University 27 November 2018 Lecture outline 1. OLS and assumptions on V(ε) 2. Violations of V(ε) σ 2 I: 1. Heteroskedasticity
Variance Decomposition and Goodness of Fit
 Variance Decomposition and Goodness of Fit 1. Example: Monthly Earnings and Years of Education In this tutorial, we will focus on an example that explores the relationship between total monthly earnings
Recent Advances in the Field of Trade Theory and Policy Analysis Using Micro-Level Data
 Recent Advances in the Field of Trade Theory and Policy Analysis Using Micro-Level Data July 2012 Bangkok, Thailand Cosimo Beverelli (World Trade Organization) 1 Content a) Classical regression model b)
Econometrics - 30C00200
 Econometrics - 30C00200 Lecture 11: Heteroskedasticity Antti Saastamoinen VATT Institute for Economic Research Fall 2015 30C00200 Lecture 11: Heteroskedasticity 12.10.2015 Aalto University School of Business
Labour Supply Responses and the Extensive Margin: The US, UK and France
 Labour Supply Responses and the Extensive Margin: The US, UK and France Richard Blundell Antoine Bozio Guy Laroque UCL and IFS IFS INSEE-CREST, UCL and IFS January 2011 Blundell, Bozio and Laroque ( )
Difference-in-Differences Methods
 Difference-in-Differences Methods Teppei Yamamoto Keio University Introduction to Causal Inference Spring 2016 1 Introduction: A Motivating Example 2 Identification 3 Estimation and Inference 4 Diagnostics
Econometrics I KS. Module 2: Multivariate Linear Regression. Alexander Ahammer. This version: April 16, 2018
 Econometrics I KS Module 2: Multivariate Linear Regression Alexander Ahammer Department of Economics Johannes Kepler University of Linz This version: April 16, 2018 Alexander Ahammer (JKU) Module 2: Multivariate
Exploring County Truck Freight. By : Henry Myers
 Exploring County Truck Freight Transportation data By : Henry Myers Part 1 is focused on explaining the spatial econometrics and statistics used Part 2 explains the economic production function Part 3
Warwick Economics Summer School Topics in Microeconometrics Instrumental Variables Estimation
 Warwick Economics Summer School Topics in Microeconometrics Instrumental Variables Estimation Michele Aquaro University of Warwick This version: July 21, 2016 1 / 31 Reading material Textbook: Introductory
Inference for Regression Inference about the Regression Model and Using the Regression Line, with Details. Section 10.1, 2, 3
 Inference for Regression Inference about the Regression Model and Using the Regression Line, with Details Section 10.1, 2, 3 Basic components of regression setup Target of inference: linear dependency
Gibbs Sampling in Latent Variable Models #1
 Gibbs Sampling in Latent Variable Models #1 Econ 690 Purdue University Outline 1 Data augmentation 2 Probit Model Probit Application A Panel Probit Panel Probit 3 The Tobit Model Example: Female Labor
4 Instrumental Variables Single endogenous variable One continuous instrument. 2
 Econ 495 - Econometric Review 1 Contents 4 Instrumental Variables 2 4.1 Single endogenous variable One continuous instrument. 2 4.2 Single endogenous variable more than one continuous instrument..........................
Formulary Applied Econometrics
 Department of Economics Formulary Applied Econometrics c c Seminar of Statistics University of Fribourg Formulary Applied Econometrics 1 Rescaling With y = cy we have: ˆβ = cˆβ With x = Cx we have: ˆβ
Econometrics Master in Business and Quantitative Methods
 Econometrics Master in Business and Quantitative Methods Helena Veiga Universidad Carlos III de Madrid This chapter deals with truncation and censoring. Truncation occurs when the sample data are drawn
Truncation and Censoring
 Truncation and Censoring Laura Magazzini laura.magazzini@univr.it Laura Magazzini (@univr.it) Truncation and Censoring 1 / 35 Truncation and censoring Truncation: sample data are drawn from a subset of
Problem Set 10: Panel Data
 Problem Set 10: Panel Data 1. Read in the data set, e11panel1.dta from the course website. This contains data on a sample or 1252 men and women who were asked about their hourly wage in two years, 2005
Solutions to Odd-Numbered End-of-Chapter Exercises: Chapter 8
 Introduction to Econometrics (3 rd Updated Edition) by James H. Stock and Mark W. Watson Solutions to Odd-Numbered End-of-Chapter Exercises: Chapter 8 (This version August 7, 04) Stock/Watson - Introduction
Course Econometrics I
 Course Econometrics I 4. Heteroskedasticity Martin Halla Johannes Kepler University of Linz Department of Economics Last update: May 6, 2014 Martin Halla CS Econometrics I 4 1/31 Our agenda for today Consequences
ECO220Y Simple Regression: Testing the Slope
 ECO220Y Simple Regression: Testing the Slope Readings: Chapter 18 (Sections 18.3-18.5) Winter 2012 Lecture 19 (Winter 2012) Simple Regression Lecture 19 1 / 32 Simple Regression Model y i = β 0 + β 1 x
INTRODUCTION TO BASIC LINEAR REGRESSION MODEL
 INTRODUCTION TO BASIC LINEAR REGRESSION MODEL 13 September 2011 Yogyakarta, Indonesia Cosimo Beverelli (World Trade Organization) 1 LINEAR REGRESSION MODEL In general, regression models estimate the effect
Introduction to Econometrics (4 th Edition) Solutions to Odd-Numbered End-of-Chapter Exercises: Chapter 8
 Solutions to Odd-Numbered End-of-Chapter Exercises: Chapter 8") Introduction to Econometrics (4 th Edition) by James H. Stock and Mark W. Watson Solutions to Odd-Numbered End-of-Chapter Exercises: Chapter 8 (This version September 14, 2018) Stock/Watson - Introduction
Introduction to Econometrics (4 th Edition) by James H. Stock and Mark W. Watson Solutions to Odd-Numbered End-of-Chapter Exercises: Chapter 8 (This version September 14, 2018) Stock/Watson - Introduction
4 Instrumental Variables Single endogenous variable One continuous instrument. 2
 Econ 495 - Econometric Review 1 Contents 4 Instrumental Variables 2 4.1 Single endogenous variable One continuous instrument. 2 4.2 Single endogenous variable more than one continuous instrument..........................
1. The shoe size of five randomly selected men in the class is 7, 7.5, 6, 6.5 the shoe size of 4 randomly selected women is 6, 5.
 Economics 3 Introduction to Econometrics Winter 2004 Professor Dobkin Name Final Exam (Sample) You must answer all the questions. The exam is closed book and closed notes you may use calculators. You must
1 Linear Regression Analysis The Mincer Wage Equation Data Econometric Model Estimation... 11
 Econ 495 - Econometric Review 1 Contents 1 Linear Regression Analysis 4 1.1 The Mincer Wage Equation................. 4 1.2 Data............................. 6 1.3 Econometric Model.....................
A Meta-Analysis of the Urban Wage Premium
 A Meta-Analysis of the Urban Wage Premium Ayoung Kim Dept. of Agricultural Economics, Purdue University kim1426@purdue.edu November 21, 2014 SHaPE seminar 2014 November 21, 2014 1 / 16 Urban Wage Premium
In order to carry out a study on employees wages, a company collects information from its 500 employees 1 as follows:
 INTRODUCTORY ECONOMETRICS Dpt of Econometrics & Statistics (EA3) University of the Basque Country UPV/EHU OCW Self Evaluation answers Time: 21/2 hours SURNAME: NAME: ID#: Specific competences to be evaluated
Econometrics of Panel Data
 Econometrics of Panel Data Jakub Mućk Meeting # 1 Jakub Mućk Econometrics of Panel Data Meeting # 1 1 / 31 Outline 1 Course outline 2 Panel data Advantages of Panel Data Limitations of Panel Data 3 Pooled
leebounds: Lee s (2009) treatment effects bounds for non-random sample selection for Stata
 treatment effects bounds for non-random sample selection for Stata") leebounds: Lee s (2009) treatment effects bounds for non-random sample selection for Stata Harald Tauchmann (RWI & CINCH) Rheinisch-Westfälisches Institut für Wirtschaftsforschung (RWI) & CINCH Health
leebounds: Lee s (2009) treatment effects bounds for non-random sample selection for Stata Harald Tauchmann (RWI & CINCH) Rheinisch-Westfälisches Institut für Wirtschaftsforschung (RWI) & CINCH Health
Statistical Inference with Regression Analysis
 Introductory Applied Econometrics EEP/IAS 118 Spring 2015 Steven Buck Lecture #13 Statistical Inference with Regression Analysis Next we turn to calculating confidence intervals and hypothesis testing
Treatment Effects with Normal Disturbances in sampleselection Package
 Treatment Effects with Normal Disturbances in sampleselection Package Ott Toomet University of Washington December 7, 017 1 The Problem Recent decades have seen a surge in interest for evidence-based policy-making.
Mediation Analysis: OLS vs. SUR vs. 3SLS Note by Hubert Gatignon July 7, 2013, updated November 15, 2013
 Mediation Analysis: OLS vs. SUR vs. 3SLS Note by Hubert Gatignon July 7, 2013, updated November 15, 2013 In Chap. 11 of Statistical Analysis of Management Data (Gatignon, 2014), tests of mediation are
Recent Advances in the Field of Trade Theory and Policy Analysis Using Micro-Level Data
 Recent Advances in the Field of Trade Theory and Policy Analysis Using Micro-Level Data July 2012 Bangkok, Thailand Cosimo Beverelli (World Trade Organization) 1 Content a) Censoring and truncation b)
Econometrics. Week 4. Fall Institute of Economic Studies Faculty of Social Sciences Charles University in Prague
 Econometrics Week 4 Institute of Economic Studies Faculty of Social Sciences Charles University in Prague Fall 2012 1 / 23 Recommended Reading For the today Serial correlation and heteroskedasticity in
Econometrics II Censoring & Truncation. May 5, 2011
 Econometrics II Censoring & Truncation Måns Söderbom May 5, 2011 1 Censored and Truncated Models Recall that a corner solution is an actual economic outcome, e.g. zero expenditure on health by a household
Florian Hoffmann. September - December Vancouver School of Economics University of British Columbia
 Lecture Notes on Graduate Labor Economics Section 1a: The Neoclassical Model of Labor Supply - Static Formulation Copyright: Florian Hoffmann Please do not Circulate Florian Hoffmann Vancouver School of
Hypothesis testing Goodness of fit Multicollinearity Prediction. Applied Statistics. Lecturer: Serena Arima
 Applied Statistics Lecturer: Serena Arima Hypothesis testing for the linear model Under the Gauss-Markov assumptions and the normality of the error terms, we saw that β N(β, σ 2 (X X ) 1 ) and hence s
Fixed and Random Effects Models: Vartanian, SW 683
 : Vartanian, SW 683 Fixed and random effects models See: http://teaching.sociology.ul.ie/dcw/confront/node45.html When you have repeated observations per individual this is a problem and an advantage:
Fortin Econ Econometric Review 1. 1 Panel Data Methods Fixed Effects Dummy Variables Regression... 7
 Fortin Econ 495 - Econometric Review 1 Contents 1 Panel Data Methods 2 1.1 Fixed Effects......................... 2 1.1.1 Dummy Variables Regression............ 7 1.1.2 First Differencing Methods.............
2.1. Consider the following production function, known in the literature as the transcendental production function (TPF).
.") CHAPTER Functional Forms of Regression Models.1. Consider the following production function, known in the literature as the transcendental production function (TPF). Q i B 1 L B i K i B 3 e B L B K 4 i
CHAPTER Functional Forms of Regression Models.1. Consider the following production function, known in the literature as the transcendental production function (TPF). Q i B 1 L B i K i B 3 e B L B K 4 i
 STOCKHOLM UNIVERSITY Department of Economics Course name: Empirical Methods Course code: EC40 Examiner: Lena Nekby Number of credits: 7,5 credits Date of exam: Friday, June 5, 009 Examination time: 3 hours
Introductory Econometrics
 Introductory Econometrics Violation of basic assumptions Heteroskedasticity Barbara Pertold-Gebicka CERGE-EI 16 November 010 OLS assumptions 1. Disturbances are random variables drawn from a normal distribution.
ECON 482 / WH Hong Binary or Dummy Variables 1. Qualitative Information
 1. Qualitative Information Qualitative Information Up to now, we assume that all the variables has quantitative meaning. But often in empirical work, we must incorporate qualitative factor into regression
Lab 3: Two levels Poisson models (taken from Multilevel and Longitudinal Modeling Using Stata, p )
") Lab 3: Two levels Poisson models (taken from Multilevel and Longitudinal Modeling Using Stata, p. 376-390) BIO656 2009 Goal: To see if a major health-care reform which took place in 1997 in Germany was
Lab 3: Two levels Poisson models (taken from Multilevel and Longitudinal Modeling Using Stata, p. 376-390) BIO656 2009 Goal: To see if a major health-care reform which took place in 1997 in Germany was
Introduction to statistical modeling
 Introduction to statistical modeling Illustrated with XLSTAT Jean Paul Maalouf webinar@xlstat.com linkedin.com/in/jean-paul-maalouf November 30, 2016 www.xlstat.com 1 PLAN XLSTAT: who are we? Statistics:
1 The basics of panel data
 Introductory Applied Econometrics EEP/IAS 118 Spring 2015 Related materials: Steven Buck Notes to accompany fixed effects material 4-16-14 ˆ Wooldridge 5e, Ch. 1.3: The Structure of Economic Data ˆ Wooldridge
Lab 10 - Binary Variables
 Lab 10 - Binary Variables Spring 2017 Contents 1 Introduction 1 2 SLR on a Dummy 2 3 MLR with binary independent variables 3 3.1 MLR with a Dummy: different intercepts, same slope................. 4 3.2
Causality and Experiments
 Causality and Experiments Michael R. Roberts Department of Finance The Wharton School University of Pennsylvania April 13, 2009 Michael R. Roberts Causality and Experiments 1/15 Motivation Introduction
Problem Set #3-Key. wage Coef. Std. Err. t P> t [95% Conf. Interval]
![Problem Set #3-Key. wage Coef. Std. Err. t P> t [95% Conf. Interval]](/thumbs/84/90891969.jpg "Problem Set #3-Key. wage Coef. Std. Err. t P> t [95% Conf. Interval]") Problem Set #3-Key Sonoma State University Economics 317- Introduction to Econometrics Dr. Cuellar 1. Use the data set Wage1.dta to answer the following questions. a. For the regression model Wage i =
Problem Set #3-Key Sonoma State University Economics 317- Introduction to Econometrics Dr. Cuellar 1. Use the data set Wage1.dta to answer the following questions. a. For the regression model Wage i =
Multiple Regression Analysis. Part III. Multiple Regression Analysis
 Part III Multiple Regression Analysis As of Sep 26, 2017 1 Multiple Regression Analysis Estimation Matrix form Goodness-of-Fit R-square Adjusted R-square Expected values of the OLS estimators Irrelevant
Dynamic Panel Data Models
 June 23, 2010 Contents Motivation 1 Motivation 2 Basic set-up Problem Solution 3 4 5 Literature Motivation Many economic issues are dynamic by nature and use the panel data structure to understand adjustment.
(a) Briefly discuss the advantage of using panel data in this situation rather than pure crosssections
 Briefly discuss the advantage of using panel data in this situation rather than pure crosssections") Answer Key Fixed Effect and First Difference Models 1. See discussion in class.. David Neumark and William Wascher published a study in 199 of the effect of minimum wages on teenage employment using a
Answer Key Fixed Effect and First Difference Models 1. See discussion in class.. David Neumark and William Wascher published a study in 199 of the effect of minimum wages on teenage employment using a
Econometrics Homework 4 Solutions
 Econometrics Homework 4 Solutions Computer Question (Optional, no need to hand in) (a) c i may capture some state-specific factor that contributes to higher or low rate of accident or fatality. For example,
Syllabus for Entrance Exam Class XI Session PCM
 PCM Jumbled Sentences Transformation of Sentences / Editing Science: Unit I: Chemical Substances - Nature and Behaviour Chemical reactions Acids, bases and salts Metals and non metals Carbon compounds
point estimates, standard errors, testing, and inference for nonlinear combinations
 Title xtreg postestimation Postestimation tools for xtreg Description The following postestimation commands are of special interest after xtreg: command description xttest0 Breusch and Pagan LM test for
Lecture 4: Linear panel models
 Lecture 4: Linear panel models Luc Behaghel PSE February 2009 Luc Behaghel (PSE) Lecture 4 February 2009 1 / 47 Introduction Panel = repeated observations of the same individuals (e.g., rms, workers, countries)
University of California at Berkeley Fall Introductory Applied Econometrics Final examination. Scores add up to 125 points
 EEP 118 / IAS 118 Elisabeth Sadoulet and Kelly Jones University of California at Berkeley Fall 2008 Introductory Applied Econometrics Final examination Scores add up to 125 points Your name: SID: 1 1.
ECON Introductory Econometrics. Lecture 16: Instrumental variables
 ECON4150 - Introductory Econometrics Lecture 16: Instrumental variables Monique de Haan (moniqued@econ.uio.no) Stock and Watson Chapter 12 Lecture outline 2 OLS assumptions and when they are violated Instrumental
ECON2228 Notes 7. Christopher F Baum. Boston College Economics. cfb (BC Econ) ECON2228 Notes / 41
 ECON2228 Notes / 41") ECON2228 Notes 7 Christopher F Baum Boston College Economics 2014 2015 cfb (BC Econ) ECON2228 Notes 6 2014 2015 1 / 41 Chapter 8: Heteroskedasticity In laying out the standard regression model, we made
ECON2228 Notes 7 Christopher F Baum Boston College Economics 2014 2015 cfb (BC Econ) ECON2228 Notes 6 2014 2015 1 / 41 Chapter 8: Heteroskedasticity In laying out the standard regression model, we made
Lecture #8 & #9 Multiple regression
 Lecture #8 & #9 Multiple regression Starting point: Y = f(x 1, X 2,, X k, u) Outcome variable of interest (movie ticket price) a function of several variables. Observables and unobservables. One or more
1 Independent Practice: Hypothesis tests for one parameter:
 1 Independent Practice: Hypothesis tests for one parameter: Data from the Indian DHS survey from 2006 includes a measure of autonomy of the women surveyed (a scale from 0-10, 10 being the most autonomous)
REGRESSION RECAP. Josh Angrist. MIT (Fall 2014)
") REGRESSION RECAP Josh Angrist MIT 14.387 (Fall 2014) Regression: What You Need to Know We spend our lives running regressions (I should say: "regressions run me"). And yet this basic empirical tool is
REGRESSION RECAP Josh Angrist MIT 14.387 (Fall 2014) Regression: What You Need to Know We spend our lives running regressions (I should say: "regressions run me"). And yet this basic empirical tool is
An explanation of Two Stage Least Squares
 Introduction Introduction to Econometrics An explanation of Two Stage Least Squares When we get an endogenous variable we know that OLS estimator will be inconsistent. In addition OLS regressors will also
Econometrics Multiple Regression Analysis: Heteroskedasticity
 Econometrics Multiple Regression Analysis: João Valle e Azevedo Faculdade de Economia Universidade Nova de Lisboa Spring Semester João Valle e Azevedo (FEUNL) Econometrics Lisbon, April 2011 1 / 19 Properties
More on Roy Model of Self-Selection
 V. J. Hotz Rev. May 26, 2007 More on Roy Model of Self-Selection Results drawn on Heckman and Sedlacek JPE, 1985 and Heckman and Honoré, Econometrica, 1986. Two-sector model in which: Agents are income
LECTURE 10. Introduction to Econometrics. Multicollinearity & Heteroskedasticity
 LECTURE 10 Introduction to Econometrics Multicollinearity & Heteroskedasticity November 22, 2016 1 / 23 ON PREVIOUS LECTURES We discussed the specification of a regression equation Specification consists
Empirical approaches in public economics
 Empirical approaches in public economics ECON4624 Empirical Public Economics Fall 2016 Gaute Torsvik Outline for today The canonical problem Basic concepts of causal inference Randomized experiments Non-experimental
Functional Form. Econometrics. ADEi.
 Functional Form Econometrics. ADEi. 1. Introduction We have employed the linear function in our model specification. Why? It is simple and has good mathematical properties. It could be reasonable approximation,
Economics 326 Methods of Empirical Research in Economics. Lecture 14: Hypothesis testing in the multiple regression model, Part 2
 Economics 326 Methods of Empirical Research in Economics Lecture 14: Hypothesis testing in the multiple regression model, Part 2 Vadim Marmer University of British Columbia May 5, 2010 Multiple restrictions
Dr. Allen Back. Sep. 23, 2016
 Dr. Allen Back Sep. 23, 2016 Look at All the Data Graphically A Famous Example: The Challenger Tragedy Look at All the Data Graphically A Famous Example: The Challenger Tragedy Type of Data Looked at the
Econometrics in a nutshell: Variation and Identification Linear Regression Model in STATA. Research Methods. Carlos Noton.
 1/17 Research Methods Carlos Noton Term 2-2012 Outline 2/17 1 Econometrics in a nutshell: Variation and Identification 2 Main Assumptions 3/17 Dependent variable or outcome Y is the result of two forces:
Lab 07 Introduction to Econometrics
 Lab 07 Introduction to Econometrics Learning outcomes for this lab: Introduce the different typologies of data and the econometric models that can be used Understand the rationale behind econometrics Understand
Applied Quantitative Methods II
 Applied Quantitative Methods II Lecture 10: Panel Data Klára Kaĺıšková Klára Kaĺıšková AQM II - Lecture 10 VŠE, SS 2016/17 1 / 38 Outline 1 Introduction 2 Pooled OLS 3 First differences 4 Fixed effects
The Changing Nature of Gender Selection into Employment: Europe over the Great Recession
 The Changing Nature of Gender Selection into Employment: Europe over the Great Recession Juan J. Dolado 1 Cecilia Garcia-Peñalosa 2 Linas Tarasonis 2 1 European University Institute 2 Aix-Marseille School
ECON Introductory Econometrics. Lecture 13: Internal and external validity
 ECON4150 - Introductory Econometrics Lecture 13: Internal and external validity Monique de Haan (moniqued@econ.uio.no) Stock and Watson Chapter 9 Lecture outline 2 Definitions of internal and external
Making sense of Econometrics: Basics
 Making sense of Econometrics: Basics Lecture 7: Multicollinearity Egypt Scholars Economic Society November 22, 2014 Assignment & feedback Multicollinearity enter classroom at room name c28efb78 http://b.socrative.com/login/student/
Exercices for Applied Econometrics A
 QEM F. Gardes-C. Starzec-M.A. Diaye Exercices for Applied Econometrics A I. Exercice: The panel of households expenditures in Poland, for years 1997 to 2000, gives the following statistics for the whole
Kausalanalyse. Analysemöglichkeiten von Paneldaten
 Kausalanalyse Analysemöglichkeiten von Paneldaten Warum geht es in den folgenden Sitzungen? Sitzung Thema Paneldaten Einführung 1 2 3 4 5 6 7 8 9 10 11 12 13 14 09.04.2008 16.04.2008 23.04.2008 30.04.2008
Econometrics I Lecture 7: Dummy Variables
 Econometrics I Lecture 7: Dummy Variables Mohammad Vesal Graduate School of Management and Economics Sharif University of Technology 44716 Fall 1397 1 / 27 Introduction Dummy variable: d i is a dummy variable
2) For a normal distribution, the skewness and kurtosis measures are as follows: A) 1.96 and 4 B) 1 and 2 C) 0 and 3 D) 0 and 0
 For a normal distribution, the skewness and kurtosis measures are as follows: A) 1.96 and 4 B) 1 and 2 C) 0 and 3 D) 0 and 0") Introduction to Econometrics Midterm April 26, 2011 Name Student ID MULTIPLE CHOICE. Choose the one alternative that best completes the statement or answers the question. (5,000 credit for each correct
Introduction to Econometrics Midterm April 26, 2011 Name Student ID MULTIPLE CHOICE. Choose the one alternative that best completes the statement or answers the question. (5,000 credit for each correct
Chapter Course notes. Experiments and Quasi-Experiments. Michael Ash CPPA. Main point of experiments: convincing test of how X affects Y.
 Experiments and Quasi-Experiments Chapter 11.3 11.8 Michael Ash CPPA Experiments p.1/20 Course notes Main point of experiments: convincing test of how X affects Y. Experiments p.2/20 The D-i-D estimator