Dr. Allen Back. Sep. 23, 2016
|
|
|
- Benjamin Miles
- 5 years ago
- Views:
Transcription
1 Dr. Allen Back Sep. 23, 2016
2 Look at All the Data Graphically A Famous Example: The Challenger Tragedy

3 Look at All the Data Graphically A Famous Example: The Challenger Tragedy Type of Data Looked at the Night Before: Conclusion: Failures at all temperatures so Temp not the issue.
4 Look at All the Data Graphically A Famous Example: The Challenger Tragedy What Wasn t Looked At: Conclusion: Clear Pattern of Failures More Likely at Low Temp.
5 Given: paired data (x 1, y 1 ),..., (x n, y n )
6 Given: paired data (x 1, y 1 ),..., (x n, y n ) Scatterplot: Plot x horizontally, y vertically.
7 Given: paired data (x 1, y 1 ),..., (x n, y n ) If one variable is potentially explanatory for the response of the other, choose the explanatory variable as x.
8 Given: paired data (x 1, y 1 ),..., (x n, y n ) is what we care about. If we know the x value of a point, does it tell us something about the likely y value?
9 Given: paired data (x 1, y 1 ),..., (x n, y n ) is what we care about. If we know the x value of a point, does it tell us something about the likely y value? (a number) and regression (a line) are just techniques to study association.
10 Given: paired data (x 1, y 1 ),..., (x n, y n ) Principal Aspects of : Direction: Strength: Form:
11 Given: paired data (x 1, y 1 ),..., (x n, y n ) Principal Aspects of : Direction: positive or negative Strength: Form:
12 Given: paired data (x 1, y 1 ),..., (x n, y n ) Principal Aspects of : Direction: positive or negative Strength: Form: Negative means as x increases, y generally decreases.
13 Given: paired data (x 1, y 1 ),..., (x n, y n ) Principal Aspects of : Direction: Strength: strong, moderate, or weak Form:
14 Given: paired data (x 1, y 1 ),..., (x n, y n ) Principal Aspects of : Direction: Strength: Form: linear, curved, or clustered
15 Example b
16 Example b My call: Direction: positive Strength: moderate Form: curved

17 Example b using Data Desk
18 Example c
19 Example c My call: Direction: negative Strength: strong Form: linear
20 Example d
21 Example d My call: Direction: negative Strength: moderate Form: (perhaps some outliers)

22 Example d using Data Desk
23 Example e
24 Example e My call: Direction: positive Strength: strong Form: linear
25 Example f
26 Example f My call: Direction: negative Strength: weak Form: curved, maybe an outlier
27 Properties r = 1 ( n 1 Σ xi x s x ) ( ) yi ȳ s y (Without the s x and s y, this would be the statistics (i.e. data related) version of the covariance of two random variables which was briefly mentioned in chapter 16 of your textbook.)
28 Properties r = 1 ( n 1 Σ xi x s x ) ( ) yi ȳ s y Positive association means as x increases, so does y generally. (And similarly when x decreases.)
29 Properties r = 1 ( n 1 Σ xi x s x ) ( ) yi ȳ s y Positive association means as x increases, so does y generally. (And similarly when x decreases.) So for pos. association, most terms in the sum are either (+) (+) or ( ) ( ).
30 Properties r = 1 ( n 1 Σ xi x s x ) ( ) yi ȳ Positive association means as x increases, so does y generally. (And similarly when x decreases.) So for pos. association, most terms in the sum are either (+) (+) or ( ) ( ). Thus with pos. association, r tends to be positive. s y
31 Properties r = 1 ( n 1 Σ xi x s x ) ( ) yi ȳ s y pos r pos. association neg. r neg. association
32 Properties r = 1 ( n 1 Σ xi x s x ) ( ) yi ȳ s y 1 <= r <= 1 (= ±1 only for perfect linear association)
33 Properties r = 1 ( n 1 Σ xi x s x ) ( ) yi ȳ s y 1 <= r <= 1 (= ±1 only for perfect linear association)
34 Properties r = 1 ( n 1 Σ xi x s x ) ( ) yi ȳ s y 1 <= r <= 1 (= ±1 only for perfect linear association) To see = ±1 for perfect linear association y = β 1 x + β 0 means s y = β 1 s x and ȳ = β 1 x + β 0.
35 Properties r = 1 ( n 1 Σ xi x s x ) ( ) yi ȳ To see = ±1 for perfect linear association y = β 1 x + β 0 means s y = β 1 s x and ȳ = β 1 x + β 0. r = 1 ( ) ( ) n 1 Σ xi x yi ȳ s x s y = 1 ( ) ( ) n 1 Σ xi x xi x β 1 = 1 n 1 Σ s x ( xi x s x ) 2 β 1 β 1 s y β 1 s x = β 1 β 1 where the last line used the definition of the variance.
36 Properties r = 1 ( n 1 Σ xi x s x ) ( ) yi ȳ If you ve studied vectors, the fact 1 <= r <= 1 comes from the same mathematics which explains why s y cos θ = v w v w has right hand side between 1 and +1.
37 Properties r = 1 ( n 1 Σ xi x s x ) ( ) yi ȳ s y r is unchanged if x and y are exchanged.
38 Properties r = 1 ( n 1 Σ xi x s x ) ( ) yi ȳ s y invariant under rescaling
39 Properties r = 1 ( n 1 Σ xi x s x ) ( ) yi ȳ s y Curved association and r=0 are consistent!
40 Properties r = 1 ( n 1 Σ xi x s x ) ( ) yi ȳ Curved association and r=0 are consistent! Five points along y = x 2. ( x = 0 and ȳ = 2.) s y x y (x-0) (y-2) (x-0)(y-2)
41 Properties r = 1 ( n 1 Σ xi x s x ) ( ) yi ȳ Curved association and r=0 are consistent! Five points along y = x 2. ( x = 0 and ȳ = 2.) s y x y (x-0) (y-2) (x-0)(y-2) r is exactly zero even though the association is very strong.
42 Properties r = 1 ( n 1 Σ xi x s x ) ( ) yi ȳ s y r is strongly affected by outliers.
43 Properties r = 1 ( n 1 Σ xi x s x ) ( ) yi ȳ s y r is strongly affected by outliers.
44 Properties r = 1 ( n 1 Σ xi x s x ) ( ) yi ȳ This shows the effect of a single outlier. (All 10 points but the last fit y = 2x + 3.) s y x y
45 Properties r = 1 ( n 1 Σ xi x s x ) ( ) yi ȳ This shows the effect of a single outlier. (All 10 points but the last fit y = 2x + 3.) s y ɛ
46 Properties r = 1 ( n 1 Σ xi x s x ) ( ) yi ȳ s y samples from independent RV s r 0
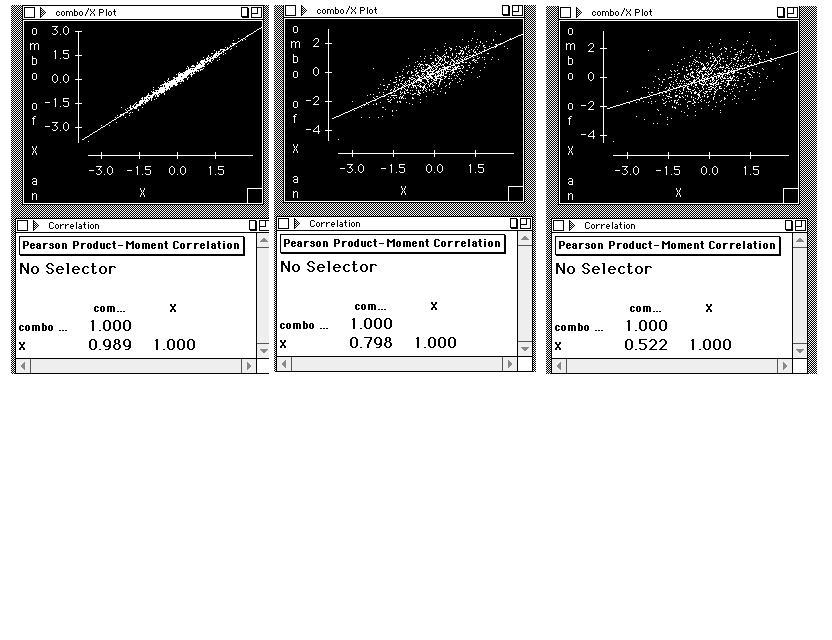
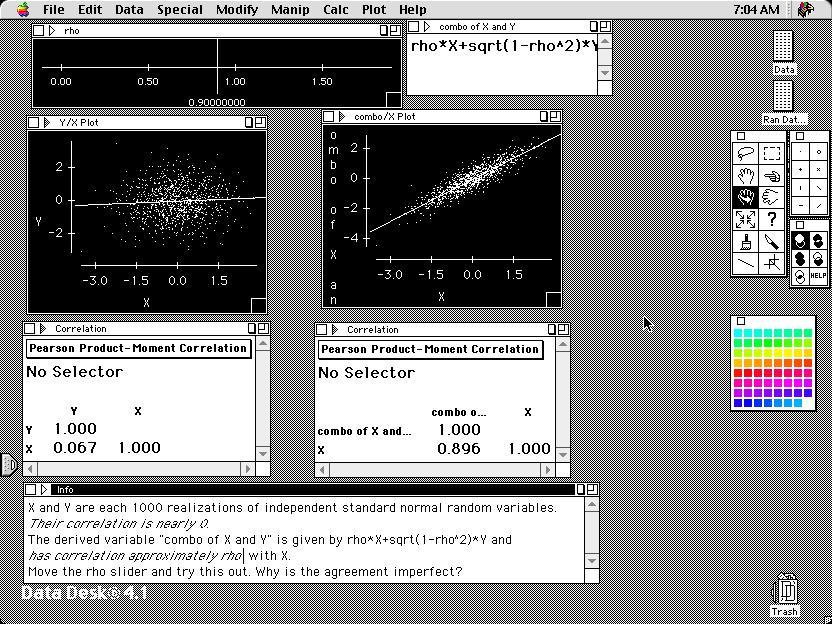
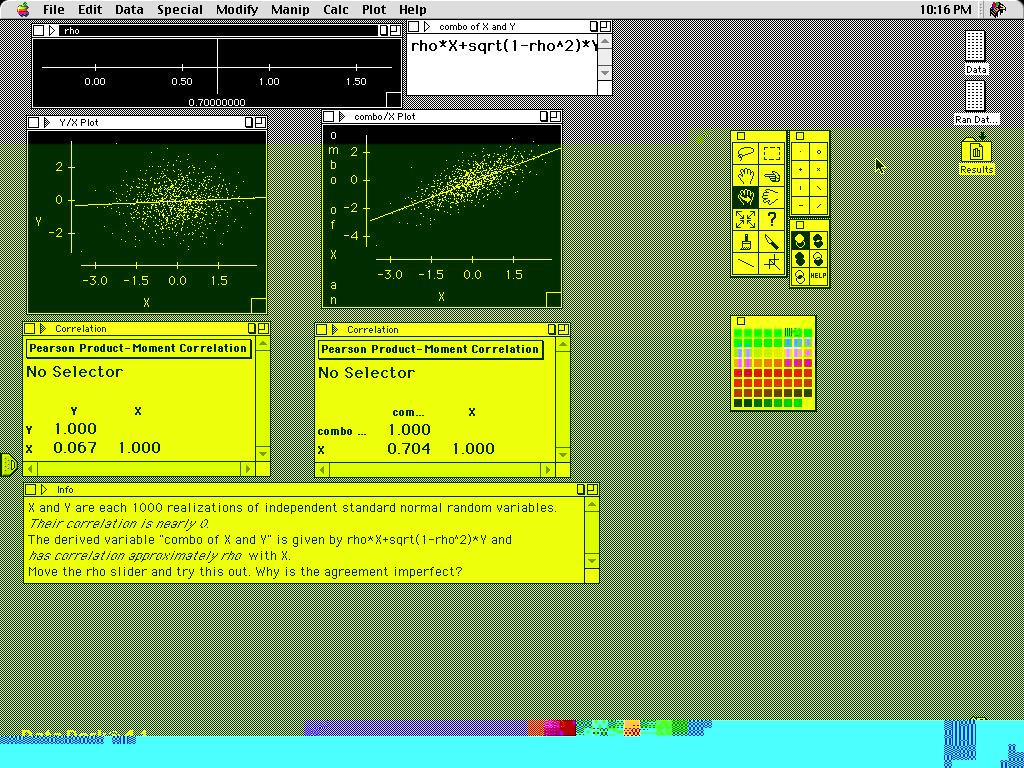
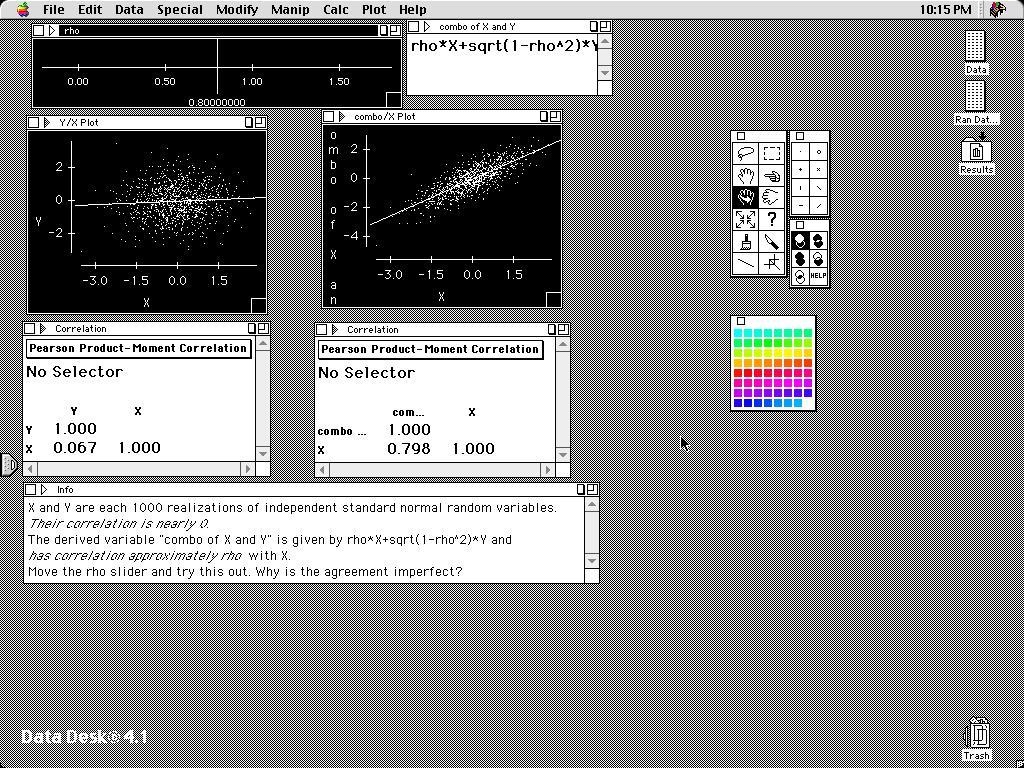
47 Properties r = 1 ( n 1 Σ xi x s x ) ( ) yi ȳ s y X,Y indep std normal RV s ; set Y = ρx + 1 ρ 2 Y. Then (X, Y ) will tend to generate data with r ρ. (e.g. ρ =.99 (1 ρ => 2 ) ρ =.14!)
48
49 X,Y indep std normal RV s ; set Y = ρx + 1 ρ 2 Y. Then (X, Y ) will tend to generate data with r ρ.
50 X,Y indep std normal RV s ; set Y = ρx + 1 ρ 2 Y. Then (X, Y ) will tend to generate data with r ρ. 1 ρ 2 Or Y = X + ρ Y with the coefficient of Y interpreted as the magnitude of the deviation from perfect association.
51 X,Y indep std normal RV s ; set Y = ρx + 1 ρ 2 Y. Then (X, Y ) will tend to generate data with r ρ. 1 ρ 2 Or Y = X + ρ Y with the coefficient of Y interpreted as the magnitude of the deviation from perfect association. 1 ρ 2 ρ ρ
52
53
54
55
56
57
58
Math 1710 Class 20. V2u. Last Time. Graphs and Association. Correlation. Regression. Association, Correlation, Regression Dr. Back. Oct.
 ,, Dr. Back Oct. 14, 2009 Son s Heights from Their Fathers Galton s Original 1886 Data If you know a father s height, what can you say about his son s? Son s Heights from Their Fathers Galton s Original
Lecture 16 - Correlation and Regression
 Lecture 16 - Correlation and Regression Statistics 102 Colin Rundel April 1, 2013 Modeling numerical variables Modeling numerical variables So far we have worked with single numerical and categorical variables,
MATH 1070 Introductory Statistics Lecture notes Relationships: Correlation and Simple Regression
 MATH 1070 Introductory Statistics Lecture notes Relationships: Correlation and Simple Regression Objectives: 1. Learn the concepts of independent and dependent variables 2. Learn the concept of a scatterplot
Linear Regression and Correlation. February 11, 2009
 Linear Regression and Correlation February 11, 2009 The Big Ideas To understand a set of data, start with a graph or graphs. The Big Ideas To understand a set of data, start with a graph or graphs. If
Chapter 6: Exploring Data: Relationships Lesson Plan
 Chapter 6: Exploring Data: Relationships Lesson Plan For All Practical Purposes Displaying Relationships: Scatterplots Mathematical Literacy in Today s World, 9th ed. Making Predictions: Regression Line
Simple Linear Regression for the MPG Data
 Simple Linear Regression for the MPG Data 2000 2500 3000 3500 15 20 25 30 35 40 45 Wgt MPG What do we do with the data? y i = MPG of i th car x i = Weight of i th car i =1,...,n n = Sample Size Exploratory
Lecture 3. The Population Variance. The population variance, denoted σ 2, is the sum. of the squared deviations about the population
 Lecture 5 1 Lecture 3 The Population Variance The population variance, denoted σ 2, is the sum of the squared deviations about the population mean divided by the number of observations in the population,
The Simple Regression Model. Part II. The Simple Regression Model
 Part II The Simple Regression Model As of Sep 22, 2015 Definition 1 The Simple Regression Model Definition Estimation of the model, OLS OLS Statistics Algebraic properties Goodness-of-Fit, the R-square
9. Linear Regression and Correlation
 9. Linear Regression and Correlation Data: y a quantitative response variable x a quantitative explanatory variable (Chap. 8: Recall that both variables were categorical) For example, y = annual income,
Applied Regression. Applied Regression. Chapter 2 Simple Linear Regression. Hongcheng Li. April, 6, 2013
 Applied Regression Chapter 2 Simple Linear Regression Hongcheng Li April, 6, 2013 Outline 1 Introduction of simple linear regression 2 Scatter plot 3 Simple linear regression model 4 Test of Hypothesis
Scatterplots and Correlation
 Scatterplots and Correlation Al Nosedal University of Toronto Summer 2017 Al Nosedal University of Toronto Scatterplots and Correlation Summer 2017 1 / 65 My momma always said: Life was like a box of chocolates.
Scatter plot of data from the study. Linear Regression
 1 2 Linear Regression Scatter plot of data from the study. Consider a study to relate birthweight to the estriol level of pregnant women. The data is below. i Weight (g / 100) i Weight (g / 100) 1 7 25
Chapter 7. Scatterplots, Association, and Correlation
 Chapter 7 Scatterplots, Association, and Correlation Bin Zou (bzou@ualberta.ca) STAT 141 University of Alberta Winter 2015 1 / 29 Objective In this chapter, we study relationships! Instead, we investigate
Introduction and Single Predictor Regression. Correlation
 Introduction and Single Predictor Regression Dr. J. Kyle Roberts Southern Methodist University Simmons School of Education and Human Development Department of Teaching and Learning Correlation A correlation
A company recorded the commuting distance in miles and number of absences in days for a group of its employees over the course of a year.
 Paired Data(bivariate data) and Scatterplots: When data consists of pairs of values, it s sometimes useful to plot them as points called a scatterplot. A company recorded the commuting distance in miles
Simple Linear Regression
 Simple Linear Regression ST 430/514 Recall: A regression model describes how a dependent variable (or response) Y is affected, on average, by one or more independent variables (or factors, or covariates)
Scatterplots. STAT22000 Autumn 2013 Lecture 4. What to Look in a Scatter Plot? Form of an Association
 Scatterplots STAT22000 Autumn 2013 Lecture 4 Yibi Huang October 7, 2013 21 Scatterplots 22 Correlation (x 1, y 1 ) (x 2, y 2 ) (x 3, y 3 ) (x n, y n ) A scatter plot shows the relationship between two
Scatter plot of data from the study. Linear Regression
 1 2 Linear Regression Scatter plot of data from the study. Consider a study to relate birthweight to the estriol level of pregnant women. The data is below. i Weight (g / 100) i Weight (g / 100) 1 7 25
Regression and correlation. Correlation & Regression, I. Regression & correlation. Regression vs. correlation. Involve bivariate, paired data, X & Y
 Regression and correlation Correlation & Regression, I 9.07 4/1/004 Involve bivariate, paired data, X & Y Height & weight measured for the same individual IQ & exam scores for each individual Height of
Describing Bivariate Relationships
 Describing Bivariate Relationships Bivariate Relationships What is Bivariate data? When exploring/describing a bivariate (x,y) relationship: Determine the Explanatory and Response variables Plot the data
Covariance and Correlation
 Covariance and Correlation ST 370 The probability distribution of a random variable gives complete information about its behavior, but its mean and variance are useful summaries. Similarly, the joint probability
HOLLOMAN S AP STATISTICS BVD CHAPTER 08, PAGE 1 OF 11. Figure 1 - Variation in the Response Variable
 Chapter 08: Linear Regression There are lots of ways to model the relationships between variables. It is important that you not think that what we do is the way. There are many paths to the summit We are
Weighted Least Squares
 Weighted Least Squares The standard linear model assumes that Var(ε i ) = σ 2 for i = 1,..., n. As we have seen, however, there are instances where Var(Y X = x i ) = Var(ε i ) = σ2 w i. Here w 1,..., w
5.1 Bivariate Relationships
 Chapter 5 Summarizing Bivariate Data Source: TPS 5.1 Bivariate Relationships What is Bivariate data? When exploring/describing a bivariate (x,y) relationship: Determine the Explanatory and Response variables
Lecture 18: Simple Linear Regression
 Lecture 18: Simple Linear Regression BIOS 553 Department of Biostatistics University of Michigan Fall 2004 The Correlation Coefficient: r The correlation coefficient (r) is a number that measures the strength
Correlation 1. December 4, HMS, 2017, v1.1
 Correlation 1 December 4, 2017 1 HMS, 2017, v1.1 Chapter References Diez: Chapter 7 Navidi, Chapter 7 I don t expect you to learn the proofs what will follow. Chapter References 2 Correlation The sample
THE PEARSON CORRELATION COEFFICIENT
 CORRELATION Two variables are said to have a relation if knowing the value of one variable gives you information about the likely value of the second variable this is known as a bivariate relation There
ECON3150/4150 Spring 2015
 ECON3150/4150 Spring 2015 Lecture 3&4 - The linear regression model Siv-Elisabeth Skjelbred University of Oslo January 29, 2015 1 / 67 Chapter 4 in S&W Section 17.1 in S&W (extended OLS assumptions) 2
Correlation. A statistics method to measure the relationship between two variables. Three characteristics
 Correlation Correlation A statistics method to measure the relationship between two variables Three characteristics Direction of the relationship Form of the relationship Strength/Consistency Direction
SLR output RLS. Refer to slr (code) on the Lecture Page of the class website.
 on the Lecture Page of the class website.") SLR output RLS Refer to slr (code) on the Lecture Page of the class website. Old Faithful at Yellowstone National Park, WY: Simple Linear Regression (SLR) Analysis SLR analysis explores the linear association
SLR output RLS Refer to slr (code) on the Lecture Page of the class website. Old Faithful at Yellowstone National Park, WY: Simple Linear Regression (SLR) Analysis SLR analysis explores the linear association
Chapter 14. Linear least squares
 Serik Sagitov, Chalmers and GU, March 5, 2018 Chapter 14 Linear least squares 1 Simple linear regression model A linear model for the random response Y = Y (x) to an independent variable X = x For a given
Lecture 11: Simple Linear Regression
 Lecture 11: Simple Linear Regression Readings: Sections 3.1-3.3, 11.1-11.3 Apr 17, 2009 In linear regression, we examine the association between two quantitative variables. Number of beers that you drink
Business Statistics. Lecture 9: Simple Regression
 Business Statistics Lecture 9: Simple Regression 1 On to Model Building! Up to now, class was about descriptive and inferential statistics Numerical and graphical summaries of data Confidence intervals
Data Analysis 1 LINEAR REGRESSION. Chapter 03
 Data Analysis 1 LINEAR REGRESSION Chapter 03 Data Analysis 2 Outline The Linear Regression Model Least Squares Fit Measures of Fit Inference in Regression Other Considerations in Regression Model Qualitative
Announcements. Lecture 10: Relationship between Measurement Variables. Poverty vs. HS graduate rate. Response vs. explanatory
 Announcements Announcements Lecture : Relationship between Measurement Variables Statistics Colin Rundel February, 20 In class Quiz #2 at the end of class Midterm #1 on Friday, in class review Wednesday
ECON 450 Development Economics
 ECON 450 Development Economics Statistics Background University of Illinois at Urbana-Champaign Summer 2017 Outline 1 Introduction 2 3 4 5 Introduction Regression analysis is one of the most important
Regression Analysis. Regression: Methodology for studying the relationship among two or more variables
 Regression Analysis Regression: Methodology for studying the relationship among two or more variables Two major aims: Determine an appropriate model for the relationship between the variables Predict the
Can you tell the relationship between students SAT scores and their college grades?
 Correlation One Challenge Can you tell the relationship between students SAT scores and their college grades? A: The higher SAT scores are, the better GPA may be. B: The higher SAT scores are, the lower
Ph.D. Qualifying Exam Friday Saturday, January 6 7, 2017
 Ph.D. Qualifying Exam Friday Saturday, January 6 7, 2017 Put your solution to each problem on a separate sheet of paper. Problem 1. (5106) Let X 1, X 2,, X n be a sequence of i.i.d. observations from a
Scatterplots and Correlations
 Scatterplots and Correlations Section 4.1 1 New Definitions Explanatory Variable: (independent, x variable): attempts to explain observed outcome. Response Variable: (dependent, y variable): measures outcome
Section 3: Simple Linear Regression
 Section 3: Simple Linear Regression Carlos M. Carvalho The University of Texas at Austin McCombs School of Business http://faculty.mccombs.utexas.edu/carlos.carvalho/teaching/ 1 Regression: General Introduction
STAT 4385 Topic 03: Simple Linear Regression
 STAT 4385 Topic 03: Simple Linear Regression Xiaogang Su, Ph.D. Department of Mathematical Science University of Texas at El Paso xsu@utep.edu Spring, 2017 Outline The Set-Up Exploratory Data Analysis
Correlation Analysis
 Simple Regression Correlation Analysis Correlation analysis is used to measure strength of the association (linear relationship) between two variables Correlation is only concerned with strength of the
The Simple Linear Regression Model
 The Simple Linear Regression Model Lesson 3 Ryan Safner 1 1 Department of Economics Hood College ECON 480 - Econometrics Fall 2017 Ryan Safner (Hood College) ECON 480 - Lesson 3 Fall 2017 1 / 77 Bivariate
Section Least Squares Regression
 Section 2.3 - Least Squares Regression Statistics 104 Autumn 2004 Copyright c 2004 by Mark E. Irwin Regression Correlation gives us a strength of a linear relationship is, but it doesn t tell us what it
Inference for Regression Inference about the Regression Model and Using the Regression Line, with Details. Section 10.1, 2, 3
 Inference for Regression Inference about the Regression Model and Using the Regression Line, with Details Section 10.1, 2, 3 Basic components of regression setup Target of inference: linear dependency
MODELING. Simple Linear Regression. Want More Stats??? Crickets and Temperature. Crickets and Temperature 4/16/2015. Linear Model
 STAT 250 Dr. Kari Lock Morgan Simple Linear Regression SECTION 2.6 Least squares line Interpreting coefficients Cautions Want More Stats??? If you have enjoyed learning how to analyze data, and want to
Unit 6 - Simple linear regression
 Sta 101: Data Analysis and Statistical Inference Dr. Çetinkaya-Rundel Unit 6 - Simple linear regression LO 1. Define the explanatory variable as the independent variable (predictor), and the response variable
Weighted Least Squares
 Weighted Least Squares The standard linear model assumes that Var(ε i ) = σ 2 for i = 1,..., n. As we have seen, however, there are instances where Var(Y X = x i ) = Var(ε i ) = σ2 w i. Here w 1,..., w
18 Bivariate normal distribution I
 8 Bivariate normal distribution I 8 Example Imagine firing arrows at a target Hopefully they will fall close to the target centre As we fire more arrows we find a high density near the centre and fewer
STA 302 H1F / 1001 HF Fall 2007 Test 1 October 24, 2007
 STA 302 H1F / 1001 HF Fall 2007 Test 1 October 24, 2007 LAST NAME: SOLUTIONS FIRST NAME: STUDENT NUMBER: ENROLLED IN: (circle one) STA 302 STA 1001 INSTRUCTIONS: Time: 90 minutes Aids allowed: calculator.
401 Review. 6. Power analysis for one/two-sample hypothesis tests and for correlation analysis.
 401 Review Major topics of the course 1. Univariate analysis 2. Bivariate analysis 3. Simple linear regression 4. Linear algebra 5. Multiple regression analysis Major analysis methods 1. Graphical analysis
Simple Linear Regression
 Simple Linear Regression In simple linear regression we are concerned about the relationship between two variables, X and Y. There are two components to such a relationship. 1. The strength of the relationship.
7.0 Lesson Plan. Regression. Residuals
 7.0 Lesson Plan Regression Residuals 1 7.1 More About Regression Recall the regression assumptions: 1. Each point (X i, Y i ) in the scatterplot satisfies: Y i = ax i + b + ɛ i where the ɛ i have a normal
Second Midterm Exam Name: Solutions March 19, 2014
 Math 3080 1. Treibergs σιι Second Midterm Exam Name: Solutions March 19, 2014 (1. The article Withdrawl Strength of Threaded Nails, in Journal of Structural Engineering, 2001, describes an experiment to
Lecture notes on Regression & SAS example demonstration
 Regression & Correlation (p. 215) When two variables are measured on a single experimental unit, the resulting data are called bivariate data. You can describe each variable individually, and you can also
STATISTICS Relationships between variables: Correlation
 STATISTICS 16 Relationships between variables: Correlation The gentleman pictured above is Sir Francis Galton. Galton invented the statistical concept of correlation and the use of the regression line.
Unit 6 - Introduction to linear regression
 Unit 6 - Introduction to linear regression Suggested reading: OpenIntro Statistics, Chapter 7 Suggested exercises: Part 1 - Relationship between two numerical variables: 7.7, 7.9, 7.11, 7.13, 7.15, 7.25,
Chapter 7. Linear Regression (Pt. 1) 7.1 Introduction. 7.2 The Least-Squares Regression Line
 7.1 Introduction. 7.2 The Least-Squares Regression Line") Chapter 7 Linear Regression (Pt. 1) 7.1 Introduction Recall that r, the correlation coefficient, measures the linear association between two quantitative variables. Linear regression is the method of fitting
Chapter 7 Linear Regression (Pt. 1) 7.1 Introduction Recall that r, the correlation coefficient, measures the linear association between two quantitative variables. Linear regression is the method of fitting
The regression model with one stochastic regressor (part II)
") The regression model with one stochastic regressor (part II) 3150/4150 Lecture 7 Ragnar Nymoen 6 Feb 2012 We will finish Lecture topic 4: The regression model with stochastic regressor We will first look
The regression model with one stochastic regressor (part II) 3150/4150 Lecture 7 Ragnar Nymoen 6 Feb 2012 We will finish Lecture topic 4: The regression model with stochastic regressor We will first look
Bivariate Relationships Between Variables
 Bivariate Relationships Between Variables BUS 735: Business Decision Making and Research 1 Goals Specific goals: Detect relationships between variables. Be able to prescribe appropriate statistical methods
Statistical View of Least Squares
 May 23, 2006 Purpose of Regression Some Examples Least Squares Purpose of Regression Purpose of Regression Some Examples Least Squares Suppose we have two variables x and y Purpose of Regression Some Examples
Homework 2: Simple Linear Regression
 STAT 4385 Applied Regression Analysis Homework : Simple Linear Regression (Simple Linear Regression) Thirty (n = 30) College graduates who have recently entered the job market. For each student, the CGPA
STAT Regression Methods
 STAT 501 - Regression Methods Unit 9 Examples Example 1: Quake Data Let y t = the annual number of worldwide earthquakes with magnitude greater than 7 on the Richter scale for n = 99 years. Figure 1 gives
K. Model Diagnostics. residuals ˆɛ ij = Y ij ˆµ i N = Y ij Ȳ i semi-studentized residuals ω ij = ˆɛ ij. studentized deleted residuals ɛ ij =
 K. Model Diagnostics We ve already seen how to check model assumptions prior to fitting a one-way ANOVA. Diagnostics carried out after model fitting by using residuals are more informative for assessing
Chapter 5 Friday, May 21st
 Chapter 5 Friday, May 21 st Overview In this Chapter we will see three different methods we can use to describe a relationship between two quantitative variables. These methods are: Scatterplot Correlation
Basics of Experimental Design. Review of Statistics. Basic Study. Experimental Design. When an Experiment is Not Possible. Studying Relations
 Basics of Experimental Design Review of Statistics And Experimental Design Scientists study relation between variables In the context of experiments these variables are called independent and dependent
Y i = η + ɛ i, i = 1,...,n.
 Nonparametric tests If data do not come from a normal population (and if the sample is not large), we cannot use a t-test. One useful approach to creating test statistics is through the use of rank statistics.
Regression Analysis II
 Regression Analysis II Measures of Goodness of fit Two measures of Goodness of fit Measure of the absolute fit of the sample points to the sample regression line Standard error of the estimate An index
11 Correlation and Regression
 Chapter 11 Correlation and Regression August 21, 2017 1 11 Correlation and Regression When comparing two variables, sometimes one variable (the explanatory variable) can be used to help predict the value
Sociology 6Z03 Review I
 Sociology 6Z03 Review I John Fox McMaster University Fall 2016 John Fox (McMaster University) Sociology 6Z03 Review I Fall 2016 1 / 19 Outline: Review I Introduction Displaying Distributions Describing
Interactions. Interactions. Lectures 1 & 2. Linear Relationships. y = a + bx. Slope. Intercept
 Interactions Lectures 1 & Regression Sometimes two variables appear related: > smoking and lung cancers > height and weight > years of education and income > engine size and gas mileage > GMAT scores and
Variance. Standard deviation VAR = = value. Unbiased SD = SD = 10/23/2011. Functional Connectivity Correlation and Regression.
 10/3/011 Functional Connectivity Correlation and Regression Variance VAR = Standard deviation Standard deviation SD = Unbiased SD = 1 10/3/011 Standard error Confidence interval SE = CI = = t value for
MATH 1150 Chapter 2 Notation and Terminology
 MATH 1150 Chapter 2 Notation and Terminology Categorical Data The following is a dataset for 30 randomly selected adults in the U.S., showing the values of two categorical variables: whether or not the
Bios 6648: Design & conduct of clinical research
 Bios 6648: Design & conduct of clinical research Section 2 - Formulating the scientific and statistical design designs 2.5(b) Binary 2.5(c) Skewed baseline (a) Time-to-event (revisited) (b) Binary (revisited)
1. How can you tell if there is serial correlation? 2. AR to model serial correlation. 3. Ignoring serial correlation. 4. GLS. 5. Projects.
 1. How can you tell if there is serial correlation? 2. AR to model serial correlation. 3. Ignoring serial correlation. 4. GLS. 5. Projects. 1) Identifying serial correlation. Plot Y t versus Y t 1. See
Simple Linear Regression Analysis
 LINEAR REGRESSION ANALYSIS MODULE II Lecture - 6 Simple Linear Regression Analysis Dr. Shalabh Department of Mathematics and Statistics Indian Institute of Technology Kanpur Prediction of values of study
A Significance Test for the Lasso
 A Significance Test for the Lasso Lockhart R, Taylor J, Tibshirani R, and Tibshirani R Ashley Petersen May 14, 2013 1 Last time Problem: Many clinical covariates which are important to a certain medical
Announcements. Unit 6: Simple Linear Regression Lecture : Introduction to SLR. Poverty vs. HS graduate rate. Modeling numerical variables
 Announcements Announcements Unit : Simple Linear Regression Lecture : Introduction to SLR Statistics 1 Mine Çetinkaya-Rundel April 2, 2013 Statistics 1 (Mine Çetinkaya-Rundel) U - L1: Introduction to SLR
Regression - Modeling a response
 Regression - Modeling a response We often wish to construct a model to Explain the association between two or more variables Predict the outcome of a variable given values of other variables. Regression
Variance reduction. Michel Bierlaire. Transport and Mobility Laboratory. Variance reduction p. 1/18
 Variance reduction p. 1/18 Variance reduction Michel Bierlaire michel.bierlaire@epfl.ch Transport and Mobility Laboratory Variance reduction p. 2/18 Example Use simulation to compute I = 1 0 e x dx We
Chapter 16. Simple Linear Regression and dcorrelation
 Chapter 16 Simple Linear Regression and dcorrelation 16.1 Regression Analysis Our problem objective is to analyze the relationship between interval variables; regression analysis is the first tool we will
STA 218: Statistics for Management
 Al Nosedal. University of Toronto. Fall 2017 My momma always said: Life was like a box of chocolates. You never know what you re gonna get. Forrest Gump. Problem How much do people with a bachelor s degree
PS2: Two Variable Statistics
 PS2: Two Variable Statistics LT2: Measuring Correlation and Line of best fit by eye. LT3: Linear regression LT4: The χ 2 test of independence. 1 Pearson's Correlation Coefficient In examinations you are
Bivariate Data Summary
 Bivariate Data Summary Bivariate data data that examines the relationship between two variables What individuals to the data describe? What are the variables and how are they measured Are the variables
A Short Course in Basic Statistics
 A Short Course in Basic Statistics Ian Schindler November 5, 2017 Creative commons license share and share alike BY: C 1 Descriptive Statistics 1.1 Presenting statistical data Definition 1 A statistical
Looking at Data Relationships. 2.1 Scatterplots W. H. Freeman and Company
 Looking at Data Relationships 2.1 Scatterplots 2012 W. H. Freeman and Company Here, we have two quantitative variables for each of 16 students. 1) How many beers they drank, and 2) Their blood alcohol
Exam Empirical Methods VU University Amsterdam, Faculty of Exact Sciences h, February 12, 2015
 Exam Empirical Methods VU University Amsterdam, Faculty of Exact Sciences 18.30 21.15h, February 12, 2015 Question 1 is on this page. Always motivate your answers. Write your answers in English. Only the
Inferences for Regression
 Inferences for Regression An Example: Body Fat and Waist Size Looking at the relationship between % body fat and waist size (in inches). Here is a scatterplot of our data set: Remembering Regression In
Business Statistics. Lecture 10: Correlation and Linear Regression
 Business Statistics Lecture 10: Correlation and Linear Regression Scatterplot A scatterplot shows the relationship between two quantitative variables measured on the same individuals. It displays the Form
Density Temp vs Ratio. temp
 Temp Ratio Density 0.00 0.02 0.04 0.06 0.08 0.10 0.12 Density 0.0 0.2 0.4 0.6 0.8 1.0 1. (a) 170 175 180 185 temp 1.0 1.5 2.0 2.5 3.0 ratio The histogram shows that the temperature measures have two peaks,
L21: Chapter 12: Linear regression
 L21: Chapter 12: Linear regression Department of Statistics, University of South Carolina Stat 205: Elementary Statistics for the Biological and Life Sciences 1 / 37 So far... 12.1 Introduction One sample
Statistiek II. John Nerbonne. March 17, Dept of Information Science incl. important reworkings by Harmut Fitz
 Dept of Information Science j.nerbonne@rug.nl incl. important reworkings by Harmut Fitz March 17, 2015 Review: regression compares result on two distinct tests, e.g., geographic and phonetic distance of
Multivariate Statistical Analysis
 Multivariate Statistical Analysis Fall 2011 C. L. Williams, Ph.D. Lecture 3 for Applied Multivariate Analysis Outline 1 Reprise-Vectors, vector lengths and the angle between them 2 3 Partial correlation
IES 612/STA 4-573/STA Winter 2008 Week 1--IES 612-STA STA doc
 IES 612/STA 4-573/STA 4-576 Winter 2008 Week 1--IES 612-STA 4-573-STA 4-576.doc Review Notes: [OL] = Ott & Longnecker Statistical Methods and Data Analysis, 5 th edition. [Handouts based on notes prepared
Basic Probability Reference Sheet
 February 27, 2001 Basic Probability Reference Sheet 17.846, 2001 This is intended to be used in addition to, not as a substitute for, a textbook. X is a random variable. This means that X is a variable
1 A Review of Correlation and Regression
 1 A Review of Correlation and Regression SW, Chapter 12 Suppose we select n = 10 persons from the population of college seniors who plan to take the MCAT exam. Each takes the test, is coached, and then
BNAD 276 Lecture 10 Simple Linear Regression Model
 1 / 27 BNAD 276 Lecture 10 Simple Linear Regression Model Phuong Ho May 30, 2017 2 / 27 Outline 1 Introduction 2 3 / 27 Outline 1 Introduction 2 4 / 27 Simple Linear Regression Model Managerial decisions
REVIEW 8/2/2017 陈芳华东师大英语系
 REVIEW Hypothesis testing starts with a null hypothesis and a null distribution. We compare what we have to the null distribution, if the result is too extreme to belong to the null distribution (p
STAT5044: Regression and Anova. Inyoung Kim
 STAT5044: Regression and Anova Inyoung Kim 2 / 47 Outline 1 Regression 2 Simple Linear regression 3 Basic concepts in regression 4 How to estimate unknown parameters 5 Properties of Least Squares Estimators: