Go to Faculty/marleen/Boulder2012/Moderating_cov Copy all files to your own directory
|
|
|
- Imogen Day
- 5 years ago
- Views:
Transcription
1 Go to Faculty/marleen/Boulder01/Moderating_cov Copy all files to your own directory Go to Faculty/sanja/Boulder01/Moderating_covariances _IQ_SES Copy all files to your own directory
2 Moderating covariances Marleen de Moor & Sanja Franić Boulder Twin Workshop March 8, 01
3 Heterogeneity Multigroup models (Tuesday) Is the magnitude of genetic influences on ADHD the same in boys and girls? Do different genetic factors influence ADHD in boys and girls? Multiple Group Models Sex differences: MZM, DZM, MZF, DZF, DOS Cohorts differences: MZyoung, DZyoung, MZold, DZold
4 Heterogeneity Moderation models (Today) Some variables have many categories: Socioeconomic status (5 levels) Some variables are continuous: Age Parenting Grouping these variables into high/low categories loses a lot of information
5 Gene-Environment Interaction GxE: Genetic control of sensitivity to the environment Environmental control of gene expression Examples: Does the heritability of IQ depend on SES? Does the heritability of ADHD depends on age?
6 Gene-Environment Correlation rge: Genetic control of exposure to the environment Environmental control of gene frequency Examples: Active rge: Children with high IQ read more books Passive rge: Parents of children with high IQ take their children more often to the library Reactive rge: Children with ADHD are treated differently by their parents

7 GxE: moderation models Twin Research 00

8 Application Turkheimer et al. 003
9 Application
10 Practical Replicate findings of Turkheimer et al. Sample of 5-yr old twins from Netherlands Twin Register Phenotype: FSIQ Environmental/moderator variable:ses
11 Definition variables in OpenMx General definition: Definition variables are variables that may vary per pair/subject and that are not dependent variables In OpenMx: The specific value of the def var for a specific pair/individual is read into an mxmatrix in OpenMx when analyzing the data of that particular pair/individual
12 Definition variables in OpenMx Common uses: 1. As main effects on the means (e.g. age and sex). To model changes in variance components as function of some variable (e.g., age, SES, etc)
13 Cautionary note about definition variables Def var should not be missing if dependent is not missing Def var should not have the same missing value as dependent variable (e.g., use -.00 for def var, for dep var)
14 Definition variables as main effects General model with age and sex as main effects: y i = + 1 (age i ) + (sex i ) + i Where: y i is the observed score of individual i is the intercept or grand mean 1 is the regression weight of age age i is the age of individual i is the deviation of females (if sex is coded 0= male; 1=female) sex i is the sex of individual i i is the residual that is not explained by the definition variables (and can be decomposed further into ACE etc)
15 Standard ACE model A C E A C E a c e a c e m m 1 Twin 1 Twin 1
16 Standard ACE model + Main effect on Means A C E A C E a c e a c e m+ β M M1 m+β M M 1 Twin 1 Twin 1
17 Means vector Standard ACE model m m Covariance matrix a Za c c e a c e
18 Allowing for a main effect of X Means vector Covariance matrix i M i X m X m 1 M e c a c Za e c a
19 Allowing for a main effect of X m X m X M 1 i M i OpenMx intercept <- mxmatrix( type="full", nrow=1, ncol=nv, free=true, values=.1, label="interc", name="int" ) PathM <- mxmatrix( type="full", nrow=1, ncol=1, free=t, values=.6, label=c("m11"), name="m" ) mod <- mxmatrix( type="full", nrow=1, ncol=1, free=false, labels=c("ses"), name="d") wmod <- mxalgebra( expression= m %*% D, name="dr") meang <- mxalgebra( expression= cbind((int + DR),(int + DR)), name="expmeang") int m ses int m * ses int m* ses
20 Definition variables in OpenMx Common uses: 1. As main effects on the means (e.g. age and sex). To model changes in variance components as function of some variable (e.g., age, SES, etc)
21 Standard ACE model + Effect on Means A C E A C E a c e a c e m+ β M M1 1 Twin 1 Twin m+ β M M 1
22 Standard ACE model + Effect on Means and a path A C E A C E a+ X M 1 c e a+ X M c e m+ β M M1 1 m+ β M M Twin 1 Twin 1
23 Standard ACE model + Effect on Means and a/c/e paths A C E A C E a+ X M 1 c+ Y M 1 e+ Z M 1 a+ X M c+ Y M e+ Z M m+ M M1 1 Twin 1 Twin m+ M M 1
24 A C E A C E a+ X M 1 c+ Y M 1 e+ Z M 1 a+ X M c+ Y M e+ Z M m+ M M1 1 Twin 1 Twin m+ M M 1 Effect on means: Main effects To account for gene-environment correlation Effect on a/c/e path loadings: Moderation effects To model gene-environment interaction (and environment-environment interaction)
25 Classic Twin Model: Var (P) = a + c + e 1.0 (MZ) /.5 (DZ) 1.0 A1 C1 E1 A C a c e a c e E P Tw1 P Tw Moderation Model: Var (P) = (a + β X M) + (c + β Y M) + (e + β Z M) A C E A C E c+ Y M 1 c+ Y M a+ X M 1 a+ e+ Z M X M 1 e+ Z M m+ M M1 m+ M M Twin 1 Twin 1 1 Note: Variances of the latent factors are constrained to 1
26 Expected variance Var (P) = (a + β X M) + (c + β Y M) + (e + β Z M) Where M is the value of the moderator and Significance of β X indicates genetic moderation Significance of β Y indicates common environmental moderation Significance of β Z indicates unique environmental moderation A C E A C E a+ X M 1 c+ Y M 1 e+ Z M 1 a+ X M c+ Y M e+ Z M m+ M M1 1 m+ M M Twin 1 Twin 1
27 Expected MZ / DZ covariances Cov(P 1,P ) MZ = (a + β X M) + (c + β Y M) Cov(P 1,P ) DZ = 0.5*(a + β X M) + (c + β Y M) 1/.5 1 A C E A C E a+ X M 1 c+ Y M 1 e+ Z M 1 a+ X M c+ Y M e+ Z M m+ M M1 1 Twin 1 Twin m+ M M 1
28 Expected MZ covariance matrix nv<-1 # Matrices to store a, c, and e Path Coefficients patha <- mxmatrix( type="full", nrow=nv, ncol=nv, free=true, values=.6, label="a11", name="a" ) pathc <- mxmatrix( type="full", nrow=nv, ncol=nv, free=true, values=.6, label="c11", name="c" ) pathe <- mxmatrix( type="full", nrow=nv, ncol=nv, free=true, values=.6, label="e11", name="e" # Matrices to store the moderated a, c, and e Path Coefficients modpatha <- mxmatrix( type='full', nrow=nv, ncol=nv, free=true, values=.6, label="am11", name="am" ) modpathc <- mxmatrix( type='full', nrow=nv, ncol=nv, free=true, values=.6, label="cm11", name="cm" ) modpathe <- mxmatrix( type='full', nrow=nv, ncol=nv, free=true, values=.6, label="em11", name="em" ) # Matrix for the moderator variable mod <- mxmatrix( type="full", nrow=1, ncol=1, free=false, labels=c("ses"), name="d") # Matrices to compute the moderated A, C, and E variance components covamod <- mxalgebra( expression=(a+ D%*%aM) %*% t(a+ D%*%aM), name="a" ) covcmod <- mxalgebra( expression=(c+ D%*%cM) %*% t(c+ D%*%cM), name="c" ) covemod <- mxalgebra( expression=(e+ D%*%eM) %*% t(e+ D%*%eM), name="e" ) # Algebra for the expected mean vector and expected variance/covariance matrices and in MZ and DZ covmz <- mxalgebra( expression= rbind ( cbind(a+c+e, A+C), cbind(a+c, A+C+E)), name="expcovmz" ) OpenMx OpenMx ) ( ) ( ) ( ) ( ) ( ) ( ) ( ) ( ) ( ) ( M e M c M a M c M a M c M a M e M c M a Z Y X Y X Y X Z Y X
29 Expected MZ covariance matrix OpenMx nv<-1 # Matrices to store a, c, and e Path Coefficients patha <- mxmatrix( type="full", nrow=nv, ncol=nv, free=true, values=.6, label="a11", name="a" ) pathc <- mxmatrix( type="full", nrow=nv, ncol=nv, free=true, values=.6, label="c11", name="c" ) pathe <- mxmatrix( type="full", nrow=nv, ncol=nv, free=true, values=.6, label="e11", name="e" ) # Matrices to store the moderated a, c, and e Path Coefficients modpatha <- mxmatrix( type='full', nrow=nv, ncol=nv, free=true, values=.6, label="am11", name="am" ) modpathc <- mxmatrix( type='full', nrow=nv, ncol=nv, free=true, values=.6, label="cm11", name="cm" ) modpathe <- mxmatrix( type='full', nrow=nv, ncol=nv, free=true, values=.6, label="em11", name="em" ) a a11 am am11 c c11 cm cm11 e e11 em em11
30 Expected MZ covariance matrix OpenMx nv<-1 # Matrix for the moderator variable mod <- mxmatrix( type="full", nrow=1, ncol=1, free=false, labels=c("ses"), name="d") # Matrices to compute the moderated A, C, and E variance components covamod <- mxalgebra( expression=(a+ D%*%aM) %*% t(a+ D%*%aM), name="a" ) covcmod <- mxalgebra( expression=(c+ D%*%cM) %*% t(c+ D%*%cM), name="c" ) covemod <- mxalgebra( expression=(e+ D%*%eM) %*% t(e+ D%*%eM), name="e" ) D ses a a11 am am11 A a11 am11 c c11 cm cm11 C c11 cm11 e e11 em em11 E e11 em11
31 Expected MZ covariance matrix OpenMx nv<-1 # Algebra for expected variance/covariance matrix and expected mean vector in MZ mxalgebra( expression= rbind ( cbind(a+c+e, A+C), cbind(a+c, A+C+E)), name="expcovmz" ), A C E a11 am11 c11 cm11 e11 em11 expcovmz a11 am11 c11 cm11 e11 em11 a11 am11 c11 cm11 a11 am11 c11 sescm11 a11 am11 c11 cm11 e11 em11 ( a X M ) ( c Y M ) ( e Z M ) ( a X M ) ( c Y M ) ( a M ) ( a M ) X X ( c M ) ( c M ) Y Y ( e M ) Z
32 Expected DZ covariance matrix ( a X M ) ( c Y M ) ( e Z M ) 0.5( a X M ) ( c Y M ) 0.5( a M ) ( a M ) X X ( c M ) Y ( c M ) Y ( e M ) Z OpenMx nv<-1 # Matrices to store a, c, and e Path Coefficients patha <- mxmatrix( type="full", nrow=nv, ncol=nv, free=true, values=.6, label="a11", name="a" ) pathc <- mxmatrix( type="full", nrow=nv, ncol=nv, free=true, values=.6, label="c11", name="c" ) pathe <- mxmatrix( type="full", nrow=nv, ncol=nv, free=true, values=.6, label="e11", name="e" # Matrices to store the moderated a, c, and e Path Coefficients modpatha <- mxmatrix( type='full', nrow=nv, ncol=nv, free=true, values=.6, label="am11", name="am" ) modpathc <- mxmatrix( type='full', nrow=nv, ncol=nv, free=true, values=.6, label="cm11", name="cm" ) modpathe <- mxmatrix( type='full', nrow=nv, ncol=nv, free=true, values=.6, label="em11", name="em" ) # Matrix for the moderator variable mod <- mxmatrix( type="full", nrow=1, ncol=1, free=false, labels=c("ses"), name="d") # Matrices to compute the moderated A, C, and E variance components covamod <- mxalgebra( expression=(a+ D%*%aM) %*% t(a+ D%*%aM), name="a" ) covcmod <- mxalgebra( expression=(c+ D%*%cM) %*% t(c+ D%*%cM), name="c" ) covemod <- mxalgebra( expression=(e+ D%*%eM) %*% t(e+ D%*%eM), name="e" ) # Algebra for the expected mean vector and expected variance/covariance matrices and in MZ and DZ covmz <- mxalgebra( expression= rbind ( cbind(a+c+e, 0.5%x%A+C), cbind(0.5%x%a+c, A+C+E)), name="expcovdz" )
33 Expected DZ covariance matrix OpenMx nv<-1 # Algebra for the expected mean vector and expected variance/covariance matrices and in MZ and DZ covmz <- mxalgebra( expression= rbind ( cbind(a+c+e, 0.5%x%A+C), cbind(0.5%x%a+c, A+C+E)), name="expcovdz" ) A C E a11 am11 c11 cm11 e11 em11 expcovdz a11 am11 c11 cm11 e11 em11 0.5* a11 am11 c11 cm11 0.5* a11 am11 c11 sescm11 a11 am11 c11 cm11 e11 em11 ( a X M ) ( c Y M ) ( e Z M ) 0.5( a X M ) ( c Y M ) 0.5( a M ) ( a M ) X X ( c M ) Y ( c M ) Y ( e M ) Z
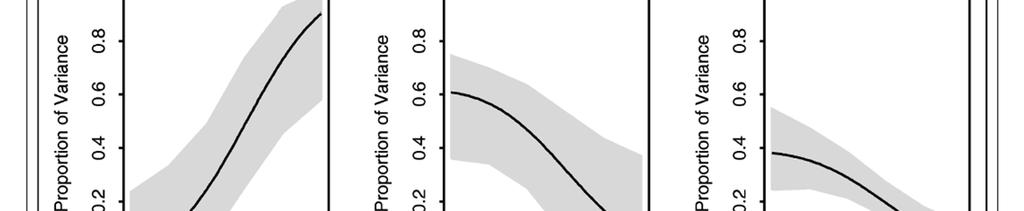
34 Making plots Linear effect of SES on path loadings Non-linear effect of SES on unstandardized variance components Non-linear effect of SES on standardized variance components
35 Example Turkheimer study Moderation of unstandardized variance components: FSIQ Moderation of standardized variance components: FSIQ
36 Calculate it yourself, or plot it in R! Moderation of the additive genetic VC: From OpenMx: a=0.5 ; am=-0. Range moderator: - to 1.5 SES (a+ses*am) (a+ses*am) - (0.5+(-*-0.)) (0.5+(-1.5*-0.)) (0.5+(*-0.)) 0.01 VC M
37 Path model vs. OpenMx matrices A C E A C E a+ X M 1 c+ Y M 1 e+ Z M 1 a+ X M c+ Y M e+ Z M a+ Ses %*% am a+ Ses %*% am e+ Ses %*% em e+ Ses %*% em c+ Ses %*% cm c+ Ses %*% cm 1 m+ M M1 Twin 1 Twin m+ M M 1 int + Ses%*%m int +Ses%*%m
38 More advanced models Nonlinear moderation GxE for categorical data GxE in the context of rge
39 Nonlinear moderation A C E e + β Z M a + β X M c + β y M +β +β X M +β Y M Z M Add quadratic terms See Purcell β M M T
40 GxE for categorical data Continuous data Moderation of means and variances Ordinal data Moderation of thresholds and variances See Medland et al. 009
41 GxE in the context of rge If there is a correlation between the moderator (environment) of interest and the outcome, and you find a GxE effect, it s not clear if: The environment is moderating the effects of genes Or: Trait-influencing genes are simply more likely to be present in that environment
42 Ways to deal with rge Limit study to moderators that aren t correlated with outcome Pro: easy Con: not very satisfying Moderator in means model will remove from the covariance genetic effects shared by trait and moderator Pro: Any interaction detected will be moderation of the trait specific genetic effects Con: Will fail to detect GxE interaction if the moderated genetic component is shared by the outcome and moderator Explicitly model rge using a bivariate framework
43 Bivariate model A S A U β XS indicates moderation of shared genetic effects a M a S + β XS M a U + β XU M β XU indicates moderation of unique genetic effects on trait of interest See Johnson, 007 M T NOTE: this model is not informative for family-level variables (e.g., ses, parenting, etc)
44 Practical Replicate findings from Turkheimer et al. with twin data from NTR Phenotype: FSIQ Moderator: SES Data: 05 MZ and 5 DZ twin pairs 5 years old
Continuously moderated effects of A,C, and E in the twin design
 Continuously moderated effects of A,C, and E in the twin design Conor V Dolan & Michel Nivard Boulder Twin Workshop March, 208 Standard AE model s 2 A or.5s 2 A A E A E s 2 A s 2 E s 2 A s 2 E m pheno
Continuously moderated effects of A,C, and E in the twin design
 Continuously moderated effects of A,C, and E in the twin design Conor V Dolan & Sanja Franić Boulder Twin Workshop March 8, 2016 Includes slides by Sophie van der Sluis & Marleen de Moor 1977 Acta Genet
Ordinal data Analysis: Liability Threshold Models
 Ordinal data Analysis: Liability Threshold Models Frühling Rijsdijk SGDP Centre, Institute of Psychiatry, King s College London Ordinal data Measuring instrument discriminates between two or a few ordered
Introduction to Multivariate Genetic Analysis. Meike Bartels, Hermine Maes, Elizabeth Prom-Wormley and Michel Nivard
 Introduction to Multivariate Genetic nalysis Meike Bartels, Hermine Maes, Elizabeth Prom-Wormley and Michel Nivard im and Rationale im: to examine the source of factors that make traits correlate or co-vary
Sex-limitation Models
 Sex-limitation Models Meike Bartels (Brad, Sarah, Hermine, Ben, Elizabeth, and most of the rest of the faculty that has contributed bits and pieces to various versions of this talk) COPY FILES FROM: Faculty/meike/2016/heterogeneity
Variance Component Models for Quantitative Traits. Biostatistics 666
 Variance Component Models for Quantitative Traits Biostatistics 666 Today Analysis of quantitative traits Modeling covariance for pairs of individuals estimating heritability Extending the model beyond
Multivariate Analysis. Hermine Maes TC19 March 2006
 Multivariate Analysis Hermine Maes TC9 March 2006 Files to Copy to your Computer Faculty/hmaes/tc9/maes/multivariate *.rec *.dat *.mx Multivariate.ppt Multivariate Questions I Bivariate Analysis: What
Categorical and Zero Inflated Growth Models
 Categorical and Zero Inflated Growth Models Alan C. Acock* Summer, 2009 *Alan C. Acock, Department of Human Development and Family Sciences, Oregon State University, Corvallis OR 97331 (alan.acock@oregonstate.edu).
Biometrical Genetics
 Biometrical Genetics 2016 International Workshop on Statistical Genetic Methods for Human Complex Traits Boulder, CO. Lindon Eaves, VIPBG, Richmond VA. March 2016 Biometrical Genetics How do genes contribute
A Note on the Parameterization of Purcell s G 3 E Model for Ordinal and Binary Data
 Behav Genet (2009) 39:220 229 DOI 10.1007/s10519-008-9247-7 BRIEF COMMUNICATION A Note on the Parameterization of Purcell s G 3 E Model for Ordinal and Binary Data Sarah E. Medland Æ Michael C. Neale Æ
Biometrical Genetics. Lindon Eaves, VIPBG Richmond. Boulder CO, 2012
 Biometrical Genetics Lindon Eaves, VIPBG Richmond Boulder CO, 2012 Biometrical Genetics How do genes contribute to statistics (e.g. means, variances,skewness, kurtosis)? Some Literature: Jinks JL, Fulker
Assignment 1. SEM 2: Structural Equation Modeling
 Assignment 1 SEM 2: Structural Equation Modeling 2 Please hand in a.pdf file containing your report and a.r containing your codes or screenshots of every Jasp analysis. The deadline of this assignment
Correction for Ascertainment
 Correction for Ascertainment Michael C. Neale International Workshop on Methodology for Genetic Studies of Twins and Families Boulder CO 2004 Virginia Institute for Psychiatric and Behavioral Genetics
Combining SEM & GREML in OpenMx. Rob Kirkpatrick 3/11/16
 Combining SEM & GREML in OpenMx Rob Kirkpatrick 3/11/16 1 Overview I. Introduction. II. mxgreml Design. III. mxgreml Implementation. IV. Applications. V. Miscellany. 2 G V A A 1 1 F E 1 VA 1 2 3 Y₁ Y₂
Latent random variables
 Latent random variables Imagine that you have collected egg size data on a fish called Austrolebias elongatus, and the graph of egg size on body size of the mother looks as follows: Egg size (Area) 4.6
Variance Components: Phenotypic, Environmental and Genetic
 Variance Components: Phenotypic, Environmental and Genetic You should keep in mind that the Simplified Model for Polygenic Traits presented above is very simplified. In many cases, polygenic or quantitative
The concept of breeding value. Gene251/351 Lecture 5
 The concept of breeding value Gene251/351 Lecture 5 Key terms Estimated breeding value (EB) Heritability Contemporary groups Reading: No prescribed reading from Simm s book. Revision: Quantitative traits
3/10/03 Gregory Carey Cholesky Problems - 1. Cholesky Problems
 3/10/03 Gregory Carey Cholesky Problems - 1 Cholesky Problems Gregory Carey Department of Psychology and Institute for Behavioral Genetics University of Colorado Boulder CO 80309-0345 Email: gregory.carey@colorado.edu
Genetic simplex model in the classical twin design. Conor Dolan & Sanja Franic. Boulder Workshop 2016
 Genetic simplex model in the classical twin design Conor Dolan & Sanja Franic Boulder Workshop 206 boulder 206 dolan & franic simplex model Two general approaches to longitudinal modeling (not mutually
Notes on Twin Models
 Notes on Twin Models Rodrigo Pinto University of Chicago HCEO Seminar April 19, 2014 This draft, April 19, 2014 8:17am Rodrigo Pinto Gene-environment Interaction and Causality, April 19, 2014 8:17am 1
Citation for published version (APA): Jak, S. (2013). Cluster bias: Testing measurement invariance in multilevel data
: Jak, S. (2013). Cluster bias: Testing measurement invariance in multilevel data") UvA-DARE (Digital Academic Repository) Cluster bias: Testing measurement invariance in multilevel data Jak, S. Link to publication Citation for published version (APA): Jak, S. (2013). Cluster bias: Testing
UvA-DARE (Digital Academic Repository) Cluster bias: Testing measurement invariance in multilevel data Jak, S. Link to publication Citation for published version (APA): Jak, S. (2013). Cluster bias: Testing
Supplementary File 3: Tutorial for ASReml-R. Tutorial 1 (ASReml-R) - Estimating the heritability of birth weight
 - Estimating the heritability of birth weight") Supplementary File 3: Tutorial for ASReml-R Tutorial 1 (ASReml-R) - Estimating the heritability of birth weight This tutorial will demonstrate how to run a univariate animal model using the software ASReml
Supplementary File 3: Tutorial for ASReml-R Tutorial 1 (ASReml-R) - Estimating the heritability of birth weight This tutorial will demonstrate how to run a univariate animal model using the software ASReml
Gene± environment interaction is likely to be a common and
 Variance Components Models for Gene Environment Interaction in Twin Analysis Shaun Purcell Social, Genetic and Developmental Psychiatry Research Centre, Institute of Psychiatry, King s College, London,
Practical Biostatistics
 Practical Biostatistics Clinical Epidemiology, Biostatistics and Bioinformatics AMC Multivariable regression Day 5 Recap Describing association: Correlation Parametric technique: Pearson (PMCC) Non-parametric:
Partitioning Genetic Variance
 PSYC 510: Partitioning Genetic Variance (09/17/03) 1 Partitioning Genetic Variance Here, mathematical models are developed for the computation of different types of genetic variance. Several substantive
Models with multiple random effects: Repeated Measures and Maternal effects
 Models with multiple random effects: Repeated Measures and Maternal effects 1 Often there are several vectors of random effects Repeatability models Multiple measures Common family effects Cleaning up
Research Design: Topic 18 Hierarchical Linear Modeling (Measures within Persons) 2010 R.C. Gardner, Ph.d.
 2010 R.C. Gardner, Ph.d.") Research Design: Topic 8 Hierarchical Linear Modeling (Measures within Persons) R.C. Gardner, Ph.d. General Rationale, Purpose, and Applications Linear Growth Models HLM can also be used with repeated
Research Design: Topic 8 Hierarchical Linear Modeling (Measures within Persons) R.C. Gardner, Ph.d. General Rationale, Purpose, and Applications Linear Growth Models HLM can also be used with repeated
Model building & assumptions. Matt Keller, Sarah Medland, Hermine Maes TC21 March 2008
 Model building & assumptions Matt Keller, Sarah Medland, Hermine Maes TC2 March 2008 cknowledgments John Jinks David Fulker Robert Cloninger John DeFries Lindon aves Nick Martin Dorret Boomsma Michael
The Cholesky Approach: A Cautionary Note
 Behavior Genetics, Vol. 26, No. 1, 1996 The Cholesky Approach: A Cautionary Note John C. Loehlin I Received 18 Jan. 1995--Final 27 July 1995 Attention is called to a common misinterpretation of a bivariate
Multiple random effects. Often there are several vectors of random effects. Covariance structure
 Models with multiple random effects: Repeated Measures and Maternal effects Bruce Walsh lecture notes SISG -Mixed Model Course version 8 June 01 Multiple random effects y = X! + Za + Wu + e y is a n x
UNIVERSITY OF TORONTO. Faculty of Arts and Science APRIL 2010 EXAMINATIONS STA 303 H1S / STA 1002 HS. Duration - 3 hours. Aids Allowed: Calculator
 UNIVERSITY OF TORONTO Faculty of Arts and Science APRIL 2010 EXAMINATIONS STA 303 H1S / STA 1002 HS Duration - 3 hours Aids Allowed: Calculator LAST NAME: FIRST NAME: STUDENT NUMBER: There are 27 pages
SEM Day 3 Lab Exercises SPIDA 2007 Dave Flora
 SEM Day 3 Lab Exercises SPIDA 2007 Dave Flora 1 Today we will see how to estimate SEM conditional latent trajectory models and interpret output using both SAS and LISREL. Exercise 1 Using SAS PROC CALIS,
Identify the scale of measurement most appropriate for each of the following variables. (Use A = nominal, B = ordinal, C = interval, D = ratio.
 Answers to Items from Problem Set 1 Item 1 Identify the scale of measurement most appropriate for each of the following variables. (Use A = nominal, B = ordinal, C = interval, D = ratio.) a. response latency
Quantitative characters - exercises
 Quantitative characters - exercises 1. a) Calculate the genetic covariance between half sibs, expressed in the ij notation (Cockerham's notation), when up to loci are considered. b) Calculate the genetic
Ron Heck, Fall Week 3: Notes Building a Two-Level Model
 Ron Heck, Fall 2011 1 EDEP 768E: Seminar on Multilevel Modeling rev. 9/6/2011@11:27pm Week 3: Notes Building a Two-Level Model We will build a model to explain student math achievement using student-level
Dyadic Data Analysis. Richard Gonzalez University of Michigan. September 9, 2010
 Dyadic Data Analysis Richard Gonzalez University of Michigan September 9, 2010 Dyadic Component 1. Psychological rationale for homogeneity and interdependence 2. Statistical framework that incorporates
One-Way ANOVA. Some examples of when ANOVA would be appropriate include:
 One-Way ANOVA 1. Purpose Analysis of variance (ANOVA) is used when one wishes to determine whether two or more groups (e.g., classes A, B, and C) differ on some outcome of interest (e.g., an achievement
NIH Public Access Author Manuscript Behav Genet. Author manuscript; available in PMC 2009 October 6.
 NIH Public Access Author Manuscript Published in final edited form as: Behav Genet. 008 May ; 38(3): 301 315. doi:10.1007/s10519-008-9193-4. Specification, testing, and interpretation of gene-by-measuredenvironment
Phenotypic factor analysis
 1 Phenotypic factor analysis Conor V. Dolan & Michel Nivard VU, Amsterdam Boulder Workshop - March 2018 2 Phenotypic factor analysis A statistical technique to investigate the dimensionality of correlated
Weighted Least Squares
 Weighted Least Squares The standard linear model assumes that Var(ε i ) = σ 2 for i = 1,..., n. As we have seen, however, there are instances where Var(Y X = x i ) = Var(ε i ) = σ2 w i. Here w 1,..., w
Multiple Group Analysis. Structural Equation Models. Interactions in SEMs. Multiple Group Analysis
 Multiple Group Analysis Structural Equation Models Multiple Group Analysis Klaus Kähler Holst kkho@biostat.ku.dk Esben Budtz-Jørgensen ebj@biostat.ku.dk Department of Biostatistics, University of Copenhagen
Measurement Invariance (MI) in CFA and Differential Item Functioning (DIF) in IRT/IFA
 in CFA and Differential Item Functioning (DIF) in IRT/IFA") Topics: Measurement Invariance (MI) in CFA and Differential Item Functioning (DIF) in IRT/IFA What are MI and DIF? Testing measurement invariance in CFA Testing differential item functioning in IRT/IFA
Topics: Measurement Invariance (MI) in CFA and Differential Item Functioning (DIF) in IRT/IFA What are MI and DIF? Testing measurement invariance in CFA Testing differential item functioning in IRT/IFA
Step 2: Select Analyze, Mixed Models, and Linear.
 Example 1a. 20 employees were given a mood questionnaire on Monday, Wednesday and again on Friday. The data will be first be analyzed using a Covariance Pattern model. Step 1: Copy Example1.sav data file
Multiple Group CFA Invariance Example (data from Brown Chapter 7) using MLR Mplus 7.4: Major Depression Criteria across Men and Women (n = 345 each)
 using MLR Mplus 7.4: Major Depression Criteria across Men and Women (n = 345 each)") Multiple Group CFA Invariance Example (data from Brown Chapter 7) using MLR Mplus 7.4: Major Depression Criteria across Men and Women (n = 345 each) 9 items rated by clinicians on a scale of 0 to 8 (0
Multiple Group CFA Invariance Example (data from Brown Chapter 7) using MLR Mplus 7.4: Major Depression Criteria across Men and Women (n = 345 each) 9 items rated by clinicians on a scale of 0 to 8 (0
Time-Invariant Predictors in Longitudinal Models
 Time-Invariant Predictors in Longitudinal Models Today s Topics: What happens to missing predictors Effects of time-invariant predictors Fixed vs. systematically varying vs. random effects Model building
Proportional Variance Explained by QLT and Statistical Power. Proportional Variance Explained by QTL and Statistical Power
 Proportional Variance Explained by QTL and Statistical Power Partitioning the Genetic Variance We previously focused on obtaining variance components of a quantitative trait to determine the proportion
The Regression Tool. Yona Rubinstein. July Yona Rubinstein (LSE) The Regression Tool 07/16 1 / 35
 The Regression Tool 07/16 1 / 35") The Regression Tool Yona Rubinstein July 2016 Yona Rubinstein (LSE) The Regression Tool 07/16 1 / 35 Regressions Regression analysis is one of the most commonly used statistical techniques in social and
The Regression Tool Yona Rubinstein July 2016 Yona Rubinstein (LSE) The Regression Tool 07/16 1 / 35 Regressions Regression analysis is one of the most commonly used statistical techniques in social and
Lecture 2: Genetic Association Testing with Quantitative Traits. Summer Institute in Statistical Genetics 2017
 Lecture 2: Genetic Association Testing with Quantitative Traits Instructors: Timothy Thornton and Michael Wu Summer Institute in Statistical Genetics 2017 1 / 29 Introduction to Quantitative Trait Mapping
Categorical Predictor Variables
 Categorical Predictor Variables We often wish to use categorical (or qualitative) variables as covariates in a regression model. For binary variables (taking on only 2 values, e.g. sex), it is relatively
Univariate Linkage in Mx. Boulder, TC 18, March 2005 Posthuma, Maes, Neale
 Univariate Linkage in Mx Boulder, TC 18, March 2005 Posthuma, Maes, Neale VC analysis of Linkage Incorporating IBD Coefficients Covariance might differ according to sharing at a particular locus. Sharing
Investigating Models with Two or Three Categories
 Ronald H. Heck and Lynn N. Tabata 1 Investigating Models with Two or Three Categories For the past few weeks we have been working with discriminant analysis. Let s now see what the same sort of model might
NELS 88. Latent Response Variable Formulation Versus Probability Curve Formulation
 NELS 88 Table 2.3 Adjusted odds ratios of eighth-grade students in 988 performing below basic levels of reading and mathematics in 988 and dropping out of school, 988 to 990, by basic demographics Variable
Introduction to R, Part I
 Introduction to R, Part I Basic math, variables, and variable types Tim Frasier Copyright Tim Frasier This work is licensed under the Creative Commons Attribution 4.0 International license. Click here
Course Introduction and Overview Descriptive Statistics Conceptualizations of Variance Review of the General Linear Model
 Course Introduction and Overview Descriptive Statistics Conceptualizations of Variance Review of the General Linear Model PSYC 943 (930): Fundamentals of Multivariate Modeling Lecture 1: August 22, 2012
DNA polymorphisms such as SNP and familial effects (additive genetic, common environment) to
 to") 1 1 1 1 1 1 1 1 0 SUPPLEMENTARY MATERIALS, B. BIVARIATE PEDIGREE-BASED ASSOCIATION ANALYSIS Introduction We propose here a statistical method of bivariate genetic analysis, designed to evaluate contribution
1 1 1 1 1 1 1 1 0 SUPPLEMENTARY MATERIALS, B. BIVARIATE PEDIGREE-BASED ASSOCIATION ANALYSIS Introduction We propose here a statistical method of bivariate genetic analysis, designed to evaluate contribution
Dr. Junchao Xia Center of Biophysics and Computational Biology. Fall /8/2016 1/38
 BIO5312 Biostatistics Lecture 11: Multisample Hypothesis Testing II Dr. Junchao Xia Center of Biophysics and Computational Biology Fall 2016 11/8/2016 1/38 Outline In this lecture, we will continue to
Resemblance among relatives
 Resemblance among relatives Introduction Just as individuals may differ from one another in phenotype because they have different genotypes, because they developed in different environments, or both, relatives
Copyright 2013 The Guilford Press
 This is a chapter excerpt from Guilford Publications. Longitudinal Structural Equation Modeling, by Todd D. Little. Copyright 2013. Purchase this book now: www.guilford.com/p/little 7 Multiple-Group Models
Thursday Morning. Growth Modelling in Mplus. Using a set of repeated continuous measures of bodyweight
 Thursday Morning Growth Modelling in Mplus Using a set of repeated continuous measures of bodyweight 1 Growth modelling Continuous Data Mplus model syntax refresher ALSPAC Confirmatory Factor Analysis
How to run the RI CLPM with Mplus By Ellen Hamaker March 21, 2018
 How to run the RI CLPM with Mplus By Ellen Hamaker March 21, 2018 The random intercept cross lagged panel model (RI CLPM) as proposed by Hamaker, Kuiper and Grasman (2015, Psychological Methods) is a model
Describing Change over Time: Adding Linear Trends
 Describing Change over Time: Adding Linear Trends Longitudinal Data Analysis Workshop Section 7 University of Georgia: Institute for Interdisciplinary Research in Education and Human Development Section
Review. Number of variables. Standard Scores. Anecdotal / Clinical. Bivariate relationships. Ch. 3: Correlation & Linear Regression
 Ch. 3: Correlation & Relationships between variables Scatterplots Exercise Correlation Race / DNA Review Why numbers? Distribution & Graphs : Histogram Central Tendency Mean (SD) The Central Limit Theorem
Dynamics in Social Networks and Causality
 Web Science & Technologies University of Koblenz Landau, Germany Dynamics in Social Networks and Causality JProf. Dr. University Koblenz Landau GESIS Leibniz Institute for the Social Sciences Last Time:
Review of the General Linear Model
 Review of the General Linear Model EPSY 905: Multivariate Analysis Online Lecture #2 Learning Objectives Types of distributions: Ø Conditional distributions The General Linear Model Ø Regression Ø Analysis
Bayesian Nonparametric Meta-Analysis Model George Karabatsos University of Illinois-Chicago (UIC)
") Bayesian Nonparametric Meta-Analysis Model George Karabatsos University of Illinois-Chicago (UIC) Collaborators: Elizabeth Talbott, UIC. Stephen Walker, UT-Austin. August 9, 5, 4:5-4:45pm JSM 5 Meeting,
Bayesian Nonparametric Meta-Analysis Model George Karabatsos University of Illinois-Chicago (UIC) Collaborators: Elizabeth Talbott, UIC. Stephen Walker, UT-Austin. August 9, 5, 4:5-4:45pm JSM 5 Meeting,
INTRODUCTION TO ANIMAL BREEDING. Lecture Nr 3. The genetic evaluation (for a single trait) The Estimated Breeding Values (EBV) The accuracy of EBVs
 The Estimated Breeding Values (EBV) The accuracy of EBVs") INTRODUCTION TO ANIMAL BREEDING Lecture Nr 3 The genetic evaluation (for a single trait) The Estimated Breeding Values (EBV) The accuracy of EBVs Etienne Verrier INA Paris-Grignon, Animal Sciences Department
INTRODUCTION TO ANIMAL BREEDING Lecture Nr 3 The genetic evaluation (for a single trait) The Estimated Breeding Values (EBV) The accuracy of EBVs Etienne Verrier INA Paris-Grignon, Animal Sciences Department
2.1 Linear regression with matrices
 21 Linear regression with matrices The values of the independent variables are united into the matrix X (design matrix), the values of the outcome and the coefficient are represented by the vectors Y and
... x. Variance NORMAL DISTRIBUTIONS OF PHENOTYPES. Mice. Fruit Flies CHARACTERIZING A NORMAL DISTRIBUTION MEAN VARIANCE
 NORMAL DISTRIBUTIONS OF PHENOTYPES Mice Fruit Flies In:Introduction to Quantitative Genetics Falconer & Mackay 1996 CHARACTERIZING A NORMAL DISTRIBUTION MEAN VARIANCE Mean and variance are two quantities
Generalized Linear Models for Non-Normal Data
 Generalized Linear Models for Non-Normal Data Today s Class: 3 parts of a generalized model Models for binary outcomes Complications for generalized multivariate or multilevel models SPLH 861: Lecture
Path Analysis. PRE 906: Structural Equation Modeling Lecture #5 February 18, PRE 906, SEM: Lecture 5 - Path Analysis
 Path Analysis PRE 906: Structural Equation Modeling Lecture #5 February 18, 2015 PRE 906, SEM: Lecture 5 - Path Analysis Key Questions for Today s Lecture What distinguishes path models from multivariate
Descriptive Statistics Class Practice [133 marks]
![Descriptive Statistics Class Practice [133 marks]](/thumbs/86/93966613.jpg "Descriptive Statistics Class Practice [133 marks]") Descriptive Statistics Class Practice [133 marks] The weekly wages (in dollars) of 80 employees are displayed in the cumulative frequency curve below. 1a. (i) (ii) Write down the median weekly wage. Find
Descriptive Statistics Class Practice [133 marks] The weekly wages (in dollars) of 80 employees are displayed in the cumulative frequency curve below. 1a. (i) (ii) Write down the median weekly wage. Find
Specifying Latent Curve and Other Growth Models Using Mplus. (Revised )
") Ronald H. Heck 1 University of Hawai i at Mānoa Handout #20 Specifying Latent Curve and Other Growth Models Using Mplus (Revised 12-1-2014) The SEM approach offers a contrasting framework for use in analyzing
Ronald H. Heck 1 University of Hawai i at Mānoa Handout #20 Specifying Latent Curve and Other Growth Models Using Mplus (Revised 12-1-2014) The SEM approach offers a contrasting framework for use in analyzing
Moderation 調節 = 交互作用
 Moderation 調節 = 交互作用 Kit-Tai Hau 侯傑泰 JianFang Chang 常建芳 The Chinese University of Hong Kong Based on Marsh, H. W., Hau, K. T., Wen, Z., Nagengast, B., & Morin, A. J. S. (in press). Moderation. In Little,
Impact of Using Reduced Rank Random Regression Test-Day Model on Genetic Evaluation
 Impact of Using Reduced Rank Random Regression Test-Day on Genetic Evaluation H. Leclerc 1, I. Nagy 2 and V. Ducrocq 2 1 Institut de l Elevage, Département Génétique, Bât 211, 78 352 Jouy-en-Josas, France
Fall Homework Chapter 4
 Fall 18 1 Homework Chapter 4 1) Starting values do not need to be theoretically driven (unless you do not have data) 2) The final results should not depend on starting values 3) Starting values can be
Unbelievably fast estimation of multilevel structural equation models
 Intro Relational Simulation Appendix References Unbelievably fast estimation of multilevel structural equation models Joshua N. Pritikin Department of Psychology University of Virginia Spring 2016 Joshua
Lecture 9. Short-Term Selection Response: Breeder s equation. Bruce Walsh lecture notes Synbreed course version 3 July 2013
 Lecture 9 Short-Term Selection Response: Breeder s equation Bruce Walsh lecture notes Synbreed course version 3 July 2013 1 Response to Selection Selection can change the distribution of phenotypes, and
Marginal effects and extending the Blinder-Oaxaca. decomposition to nonlinear models. Tamás Bartus
 Presentation at the 2th UK Stata Users Group meeting London, -2 Septermber 26 Marginal effects and extending the Blinder-Oaxaca decomposition to nonlinear models Tamás Bartus Institute of Sociology and
Legend: S spotted Genotypes: P1 SS & ss F1 Ss ss plain F2 (with ratio) 1SS :2 WSs: 1ss. Legend W white White bull 1 Ww red cows ww ww red
 1SS :2 WSs: 1ss. Legend W white White bull 1 Ww red cows ww ww red") On my honor, this is my work GENETICS 310 EXAM 1 June 8, 2018 I. Following are 3 sets of data collected from crosses: 1. Spotted by Plain gave all spotted in the F1 and 9 spotted and 3 plain in the F2.
On my honor, this is my work GENETICS 310 EXAM 1 June 8, 2018 I. Following are 3 sets of data collected from crosses: 1. Spotted by Plain gave all spotted in the F1 and 9 spotted and 3 plain in the F2.
Time-Invariant Predictors in Longitudinal Models
 Time-Invariant Predictors in Longitudinal Models Today s Class (or 3): Summary of steps in building unconditional models for time What happens to missing predictors Effects of time-invariant predictors
about nature-nurture and why we should care about them
 Three new puzzles about nature-nurture debates and why we should care about them peter.taylor@umb.edu www.faculty.umb.edu/pjt Heritability e.g. Heritability of IQ is 80 % meaning? Heritability e.g. Heritability
Course Introduction and Overview Descriptive Statistics Conceptualizations of Variance Review of the General Linear Model
 Course Introduction and Overview Descriptive Statistics Conceptualizations of Variance Review of the General Linear Model EPSY 905: Multivariate Analysis Lecture 1 20 January 2016 EPSY 905: Lecture 1 -
An Introduction to Mplus and Path Analysis
 An Introduction to Mplus and Path Analysis PSYC 943: Fundamentals of Multivariate Modeling Lecture 10: October 30, 2013 PSYC 943: Lecture 10 Today s Lecture Path analysis starting with multivariate regression
Online Appendix for Sterba, S.K. (2013). Understanding linkages among mixture models. Multivariate Behavioral Research, 48,
. Understanding linkages among mixture models. Multivariate Behavioral Research, 48,") Online Appendix for, S.K. (2013). Understanding linkages among mixture models. Multivariate Behavioral Research, 48, 775-815. Table of Contents. I. Full presentation of parallel-process groups-based trajectory
Online Appendix for, S.K. (2013). Understanding linkages among mixture models. Multivariate Behavioral Research, 48, 775-815. Table of Contents. I. Full presentation of parallel-process groups-based trajectory
CHI SQUARE ANALYSIS 8/18/2011 HYPOTHESIS TESTS SO FAR PARAMETRIC VS. NON-PARAMETRIC
 CHI SQUARE ANALYSIS I N T R O D U C T I O N T O N O N - P A R A M E T R I C A N A L Y S E S HYPOTHESIS TESTS SO FAR We ve discussed One-sample t-test Dependent Sample t-tests Independent Samples t-tests
CHAPTER 9 EXAMPLES: MULTILEVEL MODELING WITH COMPLEX SURVEY DATA
 Examples: Multilevel Modeling With Complex Survey Data CHAPTER 9 EXAMPLES: MULTILEVEL MODELING WITH COMPLEX SURVEY DATA Complex survey data refers to data obtained by stratification, cluster sampling and/or
In Class Review Exercises Vartanian: SW 540
 In Class Review Exercises Vartanian: SW 540 1. Given the following output from an OLS model looking at income, what is the slope and intercept for those who are black and those who are not black? b SE
Mixed Models for Longitudinal Ordinal and Nominal Outcomes
 Mixed Models for Longitudinal Ordinal and Nominal Outcomes Don Hedeker Department of Public Health Sciences Biological Sciences Division University of Chicago hedeker@uchicago.edu Hedeker, D. (2008). Multilevel
Lecture 12: Effect modification, and confounding in logistic regression
 Lecture 12: Effect modification, and confounding in logistic regression Ani Manichaikul amanicha@jhsph.edu 4 May 2007 Today Categorical predictor create dummy variables just like for linear regression
Which of these best predicts the outcome of the changes illustrated in the diagrams?
 1. The diagrams below show two different scenarios for a pair of homologous chromosomes, known as a tetrad, undergoing a change where segments of DNA switch on parts of the chromosomes. In each scenario,
Comparing IRT with Other Models
 Comparing IRT with Other Models Lecture #14 ICPSR Item Response Theory Workshop Lecture #14: 1of 45 Lecture Overview The final set of slides will describe a parallel between IRT and another commonly used
Computationally Efficient Estimation of Multilevel High-Dimensional Latent Variable Models
 Computationally Efficient Estimation of Multilevel High-Dimensional Latent Variable Models Tihomir Asparouhov 1, Bengt Muthen 2 Muthen & Muthen 1 UCLA 2 Abstract Multilevel analysis often leads to modeling
Selection on Correlated Characters (notes only)
") Selection on Correlated Characters (notes only) The breeder s equation is best suited for plant and animal breeding where specific traits can be selected. In natural populations selection is rarely directed
Selection on Correlated Characters (notes only) The breeder s equation is best suited for plant and animal breeding where specific traits can be selected. In natural populations selection is rarely directed
Review of Multiple Regression
 Ronald H. Heck 1 Let s begin with a little review of multiple regression this week. Linear models [e.g., correlation, t-tests, analysis of variance (ANOVA), multiple regression, path analysis, multivariate
Quantitative Trait Variation
 Quantitative Trait Variation 1 Variation in phenotype In addition to understanding genetic variation within at-risk systems, phenotype variation is also important. reproductive fitness traits related to
Testing Main Effects and Interactions in Latent Curve Analysis
 Psychological Methods 2004, Vol. 9, No. 2, 220 237 Copyright 2004 by the American Psychological Association 1082-989X/04/$12.00 DOI: 10.1037/1082-989X.9.2.220 Testing Main Effects and Interactions in Latent
RESMA course Introduction to LISREL. Harry Ganzeboom RESMA Data Analysis & Report #4 February
 RESMA course Introduction to LISREL Harry Ganzeboom RESMA Data Analysis & Report #4 February 17 2009 LISREL SEM: Simultaneous [Structural] Equations Model: A system of linear equations ( causal model )
An Introduction to Path Analysis
 An Introduction to Path Analysis PRE 905: Multivariate Analysis Lecture 10: April 15, 2014 PRE 905: Lecture 10 Path Analysis Today s Lecture Path analysis starting with multivariate regression then arriving
REVIEW 8/2/2017 陈芳华东师大英语系
 REVIEW Hypothesis testing starts with a null hypothesis and a null distribution. We compare what we have to the null distribution, if the result is too extreme to belong to the null distribution (p
Logistic regression: Why we often can do what we think we can do. Maarten Buis 19 th UK Stata Users Group meeting, 10 Sept. 2015
 Logistic regression: Why we often can do what we think we can do Maarten Buis 19 th UK Stata Users Group meeting, 10 Sept. 2015 1 Introduction Introduction - In 2010 Carina Mood published an overview article