Laboratory Geomechanical Strength Testing of DGR-1 & DGR-2 Core
|
|
|
- Jane Burns
- 6 years ago
- Views:
Transcription

1 Technical Report Title: Document ID: Authors: Laboratory Geomechanical Strength Testing of DGR-1 & DGR-2 Core TR-7-3 B. Gorski, T. Anderson and T. Conlon CANMET Mining and Mineral Sciences Laboratories, Natural Resources Canada Revision: 3 Date: February 3, 29 DGR Site Characterization Document Intera Engineering Project 6-219
2 Intera Engineering DGR Site Characterization Document Title: Document ID: Laboratory Geomechanical Strength Testing of DGR-1 & DGR-2 Core TR-7-3 Revision Number: 3 Date: February 3, 29 Author(s): Technical Review: QA Review: B. Gorski, T. Anderson and B. Conlon CANMET Mining and Mineral Sciences Laboratories Natural Resources Canada Dougal McCreath, Kenneth Raven, Tom Lam (OPG) John Avis Approved by: Kenneth Raven Document Revision History Revision Effective Date Description of Changes October 3, 27 Initial Release 1 November 9, 27 Additions to Table A-8, Appendix D and Table F-4 reflecting supplementary direct shear testing of 3 Cobourg Fm samples Addition of Section 7 on Data Quality and Use 2 April 15, 28 3 February 3, 29 Conversion from Technical Memorandum to Technical Report Formation depths and Tables F-1 to F-4 adjusted to conform with results of November 28 core workshop February 3, 29 ii
3 TABLE OF CONTENTS 1 INTRODUCTION STANDARD OPERATING PROCEDURES SPECIMENS TEST APPARATUS AND PROCEDURES Zero Pressure Velocity Tests Uniaxial Compression Strength Tests Acoustic Emission (AE) Tests Brazilian Tensile Strength Tests Direct Shear Strength Tests ANALYSIS OF DATA Zero Pressure Velocity Tests Uniaxial Compression Strength Tests Acoustic Emission (AE) Tests Brazilian Tensile Strength Tests Direct Shear Strength Tests RESULTS AND CONCLUSIONS DATA QUALITY AND USE DISCLAIMER REFERENCES... 9 LIST OF APPENDICES APPENDIX A Data and Calculation Tables Tables: A-1. Dimensions and densities of DGR-1 uniaxial specimens...12 A-2. Dimensions and densities of DGR-2 uniaxial specimens...13 A-3. Dynamic elastic constants of DGR-1 specimens...14 A-4. Dynamic elastic constants of DGR-2 specimens...15 A-5. Static elastic constants of DGR-1 specimens...16 A-6. Static elastic constants of DGR-2 specimens...17 A-7. Brazilian test data for DGR-2 specimens...18 A-8. Shear test data for DGR-2 specimens...19 February 3, 29 iii
4 APPENDIX B Stress-Strain Curves of Uniaxial Tests Figures: B-1. Specimen DGR-1, 27.3 m...22 B-2. Specimen DGR-1, m...22 B-3. Specimen DGR-1, 7.84 m...23 B-4. Specimen DGR-1, m...24 B-5. Specimen DGR-1, m...25 B-6. Specimen DGR-1, m...26 B-7. Specimen DGR-1, m...27 B-8. Specimen DGR-1, m...28 B-9. Specimen DGR-1, m...29 B-1. Specimen DGR-1, m...3 B-11. Specimen DGR-1, m...31 B-12. Specimen DGR-1, m...32 B-13. Specimen DGR-1, m...33 B-14. Specimen DGR-1, m...34 B-15. Specimen DGR-1, m...35 B-16. Specimen DGR-1, m...36 B-17. Specimen DGR-1, m...37 B-18. Specimen DGR-2, m...38 B-19. Specimen DGR-2, m...39 B-2. Specimen DGR-2, m...4 B-21. Specimen DGR-2, m...41 B-22. Specimen DGR-2, m...42 B-23. Specimen DGR-2, m...43 B-24. Specimen DGR-2, m...44 B-25. Specimen DGR-2, m...45 B-26. Specimen DGR-2, m...46 B-27. Specimen DGR-2, 66.5 m...47 B-28. Specimen DGR-2, m...48 B-29. Specimen DGR-2, m...49 B-3. Specimen DGR-2, m...5 B-31. Specimen DGR-2, m...51 B-32. Specimen DGR-2, m...52 B-33. Specimen DGR-2, m...53 B-34. Specimen DGR-2, m...54 B-35. Specimen DGR-2, m...55 B-36. Specimen DGR-2, m...56 B-37. Specimen DGR-2, m...57 B-38. Specimen DGR-2, m...58 B-39. Specimen DGR-2, m...59 B-4. Specimen DGR-2, m...6 B-41. Specimen DGR-2, m...61 B-42. Specimen DGR-2, m...62 B-43. Specimen DGR-2, m...63 B-44. Specimen DGR-2, m...64 B-45. Specimen DGR-2, m...65 B-46. Specimen DGR-2, m...66 B-47. Specimen DGR-2, m...67 APPENDIX C Failed Uniaxial Specimens and AE Source Locations Figures: C-1. Specimen DGR-1, 27.3 m...69 C-2. Specimen DGR-1, m...7 C-3. Specimen DGR-1, 7.84 m...71 February 3, 29 iv
5 C-4. Specimen DGR-1, m...72 C-5. Specimen DGR-1, m...73 C-6. Specimen DGR-1, m...74 C-7. Specimen DGR-1, m...75 C-8. Specimen DGR-1, m...76 C-9. Specimen DGR-1, m...77 C-1. Specimen DGR-1, m...78 C-11. Specimen DGR-1, m...79 C-12. Specimen DGR-1, m...8 C-13. Specimen DGR-1, m...81 C-14. Specimen DGR-1, m...82 C-15. Specimen DGR-1, m...83 C-16. Specimen DGR-1, m...84 C-17. Specimen DGR-1, m...85 C-18. Specimen DGR-2, m...86 C-19. Specimen DGR-2, m...87 C-2. Specimen DGR-2, m...88 C-21. Specimen DGR-2, m...89 C-22. Specimen DGR-2, m...9 C-23. Specimen DGR-2, m...91 C-24. Specimen DGR-2, m...92 C-25. Specimen DGR-2, m...93 C-26. Specimen DGR-2, m...94 C-27. Specimen DGR-2, 66.5 m...95 C-28. Specimen DGR-2, m...96 C-29. Specimen DGR-2, m...97 C-3. Specimen DGR-2, m...98 C-31. Specimen DGR-2, m...99 C-32. Specimen DGR-2, m...1 C-33. Specimen DGR-2, m...11 C-34. Specimen DGR-2, m...12 C-35. Specimen DGR-2, m...13 C-36. Specimen DGR-2, m...14 C-37. Specimen DGR-2, m...15 C-38. Specimen DGR-2, m...16 C-39. Specimen DGR-2, m...17 C-4. Specimen DGR-2, m...18 C-41. Specimen DGR-2, m...19 C-42. Specimen DGR-2, m...11 C-43. Specimen DGR-2, m C-44. Specimen DGR-2, m C-45. Specimen DGR-2, m C-46. Specimen DGR-2, m C-47. Specimen DGR-2, m APPENDIX D Plots of Shear Stress vs. Displacement and Shear Stress vs. Normal Stress Figures: D-1. Specimen DGR-2, m D-2. Specimen DGR-2, m D-3. Specimen DGR-2, m D-4. Specimen DGR-2, 692. m...12 D-5. Specimen DGR-2, m D-6. Specimen DGR-2, m D-7. Specimen DGR-2, m D-8. Specimen DGR-2, m D-9. Specimen DGR-2, m February 3, 29 v
6 D-1. Specimen DGR-2, m D-11. Specimen DGR-2, 684. m APPENDIX E Failed Brazilian Specimens Figure: E-1. Tested Brazilian Specimens APPENDIX F Geological Descriptions and Geological Formation of Intera DGR Specimens Tables: F-1. Geological formations and descriptions of DGR-1 uniaxial specimens F-2. Geological formations and descriptions of DGR-2 uniaxial specimens F-3. Geological formations and descriptions of DGR-2 Brazilian specimens F-4. Geological formations and descriptions of DGR-2 shear specimens February 3, 29 vi
7 1 Introduction Ontario Power Generation (OPG) is proposing to construct a Low and Intermediate Level Radioactive Waste Deep Geologic Repository (DGR). The proposal calls for the DGR to be located at a depth of about 66 m within the sedimentary bedrock beneath the Bruce site near Kincardine, Ontario. OPG has retained Intera Engineering Ltd., Ottawa, Ontario to develop and implement a DGR Site Characterisation Plan (SCP). Phase 1 of the SCP represents the initial geoscientific investigation undertaken to confirm the suitability of the Bruce site. The Bruce site overburden is underlain by near flat lying Palaeozoic age dolostone, shale and limestone sedimentary rock to an estimated depth of about 86 m where Precambrian granite basement is encountered. Natural Resources Canada (NRCan) through the CANMET Mining and Mineral Sciences Laboratories (CANMET-MMSL) was contracted by Intera to provide laboratory geomechanical services. The objective of this contracted work was to conduct mechanical tests on shale, limestone and dolostone rock core originating from boreholes DGR-1 and DGR-2. Uniaxial compression tests comprised the bulk of the testing program. Supplemental Brazilian and shear tests were included during the program. This report describes the test apparatus and procedures and presents the results of the testing program. Work described in this Technical Report (TR) was completed in accordance with Intera Test Plan TP-7-4 Geomechanical Lab Testing of DGR-1 & DGR-2 Core (Intera Engineering Ltd., 27a), prepared following the general requirements of the DGR Project Quality Plan (Intera Engineering Ltd., 27b). 2 Standard Operating Procedures The test program was carried out at the CANMET-MMSL s Rock Mechanics test facility located in Bells Corners. The Rock Mechanics test facility is managed by the Ground Control Program. The test facility is an ISO 1725 (International Standards Organization) accredited testing laboratory. Standard Operating Procedures (SOPs) that form part of the facility s accredited test procedures were selected for this project. The Standard Operating Procedures used for this test program were: SOP-T 21 SOP-T 211 SOP-T 213 SOP-T 214 SOP-T 2112 SOP-T 2113 SOP-T 2121(draft) Specimen Preparation, Standardization and Dimensional Tolerance Verification, Installing Bonded Resistance Strain Gauges, Compressional P-Wave Velocity Test, Brazilian Tensile Strength Test, Uniaxial Compressive Strength Test with Servo Computer Control Press, Uniaxial Elastic Moduli and Poisson s Ratio Test with Servo Computer Control Press, and Direct Shear Test with Constant Normal Load. 3 Specimens The 75 mm diameter specimens originated from boreholes DGR-1 and DGR-2. The total number of specimens received and tested comprised: 47 uniaxial compressive strength tests; 2 Brazilian strength tests; and 11 shear strength tests. The procedure for the preparation of a cylindrical specimen conforms to the ASTM D4543 standard (ASTM D4543, 27) and CANMET-MMSL SOP-T 21. The wet specimens were jacketed with heat-shrink tubing prior to sample preparation, to minimize the loss or gain of water. The end surfaces of specimens were ground flat to within.25 mm, parallel to each other to within.25 mm, and perpendicular to the longitudinal axis of the specimen to within.25 degrees as determined using a gauge plate and dial gauge. February 3, 29 1
8 Specimen lengths were determined to the nearest.25 mm by averaging the length measured at four points 9 degrees to each other. Specimen diameters were measured to the nearest.25 mm by averaging three measurements taken at the upper, middle and lower sections of the specimens. The average diameter was used for calculating the cross-sectional area. The volumes of the specimens were calculated from the average length and diameter measurements. The weights of the specimens were determined to the nearest.1 g and the densities of the specimens were computed to the nearest.1 Mg/m 3. The borehole, depth, dimensions and bulk density of each tested specimen, are listed in Tables A-1, A-2, A-7 and A-8. Strain gauges were applied on the uniaxial test specimens for the measurement of deformations. The gauge lengths were at least ten times the largest grain in the specimens. Two diametrically opposed axial strain gauges were bonded at mid height of the specimens and were connected in series to form a single active gauge. Similarly, two diametrically opposed circumferential strain gauges were mounted at 9 degrees to the axial gauges. Wet specimens required that gauges be installed with three applications of adhesives and coating. A segment of the heat-shrink tubing was first removed from the gauge area. The area was then dried and the adhesive was applied to fill surface irregularities and seal pores. The gauging area was then abraded to remove extra glue on the rock surface, and the strain gauge was installed. After lead attachment, a thick coat was applied on and completely covered the gauge and solder joints for moisture protection. During the curing of the adhesives and coating, the specimens were covered by wet paper and stored in an environmental chamber to minimize the loss of moisture from the specimen. The procedure to apply strain gauges to a specimen conformed to SOP-T 211 and ASTM E1237 standard (ASTM E1237, 23). 4 Test Apparatus and Procedures 4.1 Zero Pressure Velocity Tests Zero pressure P-wave and S-wave velocities were measured for all the uniaxial specimens prior to testing. The testing apparatus comprised a pulse generator, power amplifier, pulsing and sensing heads (transmitter and receiver) and oscilloscope. The P-wave and S-wave velocities were measured in accordance with SOP-T213, and ASTM standard D 2845, (ASTM D2845, 25). 4.2 Uniaxial Compression Strength Tests Uniaxial compressive strength tests were conducted in a computer controlled, servo-hydraulic compression machine, consisting of a 2.22 MN rated load cell, load frame, hydraulic power supply, digital controller and test software. Three linear variable differential transformers (LVDTs) were arrayed around the specimen at 12 degree intervals for the measurement of axial deformations. A circumferential extensometer was used to measure specimen circumferential deformation. The uniaxial test specimens were loaded in stress control to imminent failure at a rate of.75 MPa/s (ASTM D712, 27). Uniaxial data were scanned every second and stored digitally in engineering units. Time, load, axial strain and diametric strain were recorded during uniaxial tests. After testing, the specimens were photographed. 4.3 Acoustic Emission (AE) Tests Acoustic emission tests were incorporated into the uniaxial compression tests. The AE system consisted of 12 transducer channels, 16 bit, 1 MHz, 4 db preamplification, 6 db gain, high and low pass filters and source location software. February 3, 29 2
9 Two outer arrays of 3 piezoelectric transducers each were attached to the surface of the specimens. Arrays for DGR-1 specimens were located 2 centimetres in from the ends of the specimen. Arrays for DGR-2 specimens were located in 1/3rd the length of the specimens. The transducers were spaced 12 degrees from each other for each array. The bottom array 1 consisted of transducers 1, 2 and 3 and the upper array 2 consisted of transducers 4, 5 and 6. The transducers were numbered clockwise looking down the specimen. Specimen references to top, bottom and down refer to the specimen orientation as retrieved from the borehole. Transducer 1 was orientated over the black line scribed on the specimen by Intera personnel. Transducer 4 on array 2 was rotated 6 degrees clockwise away from transducer 1 on array 1. Acoustic emissions were recorded before, during and after each uniaxial compressive strength test. Time, counts, magnitudes and other data were recorded for each event. The reader is referred to the research paper by Durrheim and Labrie (24) where the acoustic system is explained in detail. 4.4 Brazilian Tensile Strength Tests Test specimens were circular disks with a thickness-to-diameter ratio of.5 to.75. The tests were performed using a servo-hydraulic rock mechanics test system. The specimens were loaded in stress control to imminent failure. The specimens were photographed after testing. The test procedure conformed to SOP-T214 and the ASTM Standard D3967 (ASTM D3967, 25). 4.5 Direct Shear Strength Tests The procedure for the direct shear test conformed to the Standard Operating Test Procedure SOP-T 2121(draft), and ASTM Standard D567 (ASTM D567, 26). The direct shear test machine comprised a shear box, base plate, steel table with two columns and an adjustable crossbar above the table, hydraulic control system, hydraulic ram, spherical seat, electric motor, two load cells, three linear variable differential transformers (LVDTs) and a personal computer. The shear box consisted of two halves of a split box made of cast steel. The lower box was free to move on a roller system along four steel rails that are bolted to the base plate. The lower box was pushed forward and pulled backward by means of a screw jack, equipped with a load cell and driven by a variable speed electric motor. The upper box was stationary in the lateral direction, but was allowed to move in the vertical direction. The reader is referred to the research paper by Lau (22) where the shear test apparatus is explained in detail. The specimen was encapsulated in the upper box first. The specimen was then locked in a vise when positioned in the box to ensure that the interface lay in a horizontal position and was 3 to 5 mm above the mold surface. Hydrostone was used as the encapsulating material. The upper box with the specimen set in the hydrostone was then weighed. The upper box was then placed on top of the lower box and the specimen was encapsulated in the lower box. The normal load cell and spherical seat were place between the upper shear box and the hydraulic ram under the adjustable crossbar. One LVDT was mounted in a horizontal position at the end of the lower shear box and two LVDTs were mounted in a vertical position on top of the upper box for the measurement of shear and normal displacements. The direct shear test was controlled by computer software. A predetermined normal load was first applied on the sample by means of the hydraulic ram and the hydraulic control system. The weight of the normal load system (load cell, spherical seat and the upper box with specimen set in hydrostone) was used in determining the normal load. The shear test was performed by sliding the lower box under the stationary upper box at a shear displacement rate of approximately.38 mm/min to a maximum stroke of 1 mm. The normal and shear loads were measured with load cells, and the normal and shear displacements were measured with LVDTs. During testing, analog signals from the load cells and LVDTs were scanned every two seconds. The signals were converted to engineering units and stored in the computer. The computer also provided real time stressdisplacement plots throughout the test for monitoring purposes. Photographs of the sheared surfaces were February 3, 29 3
10 taken. The test was repeated for the same specimen three additional times at increasing increments of normal load. 5 Analysis of Data 5.1 Zero Pressure Velocity Tests The P-wave (compressive and S-wave (shear) velocities were determined by dividing the specimen length by the wave travel time through the specimen. The dynamic properties were then calculated using the following equations: Dynamic Young s Modulus E d V = ρ 2 s 2 2 ( 3V 4V ) V p 2 p V 2 s s (1) where: E d = dynamic Young s modulus V s = shear wave velocity V p = compressive wave velocity ρ = density Dynamic Shear Modulus G = ρ (2) 2 d V s where: G d = dynamic shear modulus V s = shear wave velocity ρ = density Poisson s Ratio (based on velocity data) 2 2 Vp 2V s ν d = (3) ( V V ) p s where: ν d = Poisson s Ratio V s = shear wave velocity V p = compressive wave velocity The velocity measurements and calculated dynamic properties are contained in Tables A-3 and A Uniaxial Compression Strength Tests Data obtained from the uniaxial compression tests included the axial stress (σ), the axial strain (ε a ) and the circumferential strain (ε c ) Strains are calculated using both bonded gauges and extensometers. Stress and strain were calculated as follows: February 3, 29 4
11 Axial Stress P σ = (4) A where: σ = uniaxial stress P = applied axial load A = initial specimen cross-sectional area Axial Strain Δl ε = (5) a l where: ε a = axial strain Δl = change in length of specimen l = initial length of specimen Circumferential Strain Δd ε = (6) c d where: ε c = circumferential strain Δd = change in circumference of specimen d = initial circumference of specimen ε = ε + 2ε (7) v a c where: ε v = volumetric strain ε a = axial strain ε c = circumferential strain Ultimate uniaxial compressive strength σ c, tangent Young s modulus of elasticity E, (calculated at.4 σ c ) and the Poisson's Ratio v, were established in each uniaxial compressive test case (ASTM D712, 27) using load cell, extensometer, LVDT and strain gauge data. These values were calculated as follows: Ultimate Uniaxial Compressive Strength = P c c A σ (8) where: σ c = ultimate uniaxial compressive strength P = axial load at failure A = initial specimen cross-sectional area February 3, 29 5
12 Young s Modulus of Elasticity σ ε 4 E = (9) 4 where: E = tangent Young s Modulus at 4% of peak strength σ 4 = tangent stress at 4% of peak strength ε 4 = tangent strain at 4% of peak strength Poisson s Ratio E E axial ν = (1) lateral where: ν = Poisson s Ratio E axial = slope of axial stress-strain curve at 4% of peak strength E lateral = slope of lateral stress-strain curve at 4% of peak strength The ultimate uniaxial compressive strength, peak strain, Young s Modulus and Poisson s Ratio values are contained in Tables A-5 and A-6. Specimen stress-strain curves are contained in Appendix B. Two graphs are shown for each specimen except trial run specimens from 27.3 m and m in DGR-1. The upper graph displays curves determined from bonded strain gauge data. The bottom graph displays stress-strain data calculated using extensometers. Crack damage stress σ cd, is the stress level where the ε v -ε a curve reaches a maximum and starts to reverse in direction, indicating dilation due to the formation and growth of unstable cracks. Progressive fracturing failure process starts above σ cd leading to the failure of the rock. Crack damage stress and crack initiation stress levels are contained in Tables A-5 and A-6. Volumetric strain and crack volumetric strain curves are displayed in Appendix B. Appendix C contains photographs of the failed specimens. Crack initiation stress σ ci, is the stress level where the σ-ε a and ε dv -ε a curves start to deviate from linear elastic behaviour, indicating the development and growth of stable cracks. The crack volumetric strain ε dv is the difference between the volumetric strain ε v observed in the test and the elastic volumetric strain ε ev calculated by assuming ideal linear elastic behaviour throughout the test. The value of σ ci, was derived from the plot of the ε dv -ε a curve. Crack ε dv = ε ε (11) v ev where: ε dv = crack volumetric strain ε v = volumetric strain ε ev = elastic volumetric strain February 3, 29 6
13 5.3 Acoustic Emission (AE) Tests Acoustic Emission (AE) tests provided a non-destructive analysis of micro-crack formation, orientations and mechanisms and their effect on the mechanics of a test specimen. Coalescence of micro-cracks into macrocracks cause major damage to a specimen and eventually leads to failure. AE are sound waves emitted by micro-cracks as they are created or move. Sound waves propagated through the specimen and were recorded continuously during the uniaxial compressive test. Cumulative counts were recorded from the 6 AE channels during uniaxial testing. AE counts showed the amount of fracturing that occurred in the specimen. The cumulative hits for the six channels were summed and are plotted as hits versus stress on the figures contained in Appendix B. The source locations of AE events are shown displayed three-dimensionally (3D), adjacent to the photograph of the actual failed specimen in Appendix C. The 3D graph and the photograph are displayed vertically as per the test configuration. AE transducer locations are shown in green and the source locations are shown in red. AE source locations delineated regions of damage. Micro-crack distributions, mapped in 3D through time, describe damage accumulation, crack coalescence and macro-fracture propagation. 5.4 Brazilian Tensile Strength Tests The tensile strengths of the specimens were calculated as follows: Brazilian Tensile Strength 2P σ t = (12) πdt where: σ t = Brazilian Tensile Strength P = load at failure D = diameter of the specimen t = thickness of the specimen The specimen, diameter, thickness, density, Brazilian tensile strength, and the orientation of the axis of loading with respect to the failure mode are contained in Table A-7. A photograph of the failed specimens is contained in Appendix E. 5.5 Direct Shear Strength Tests Direct shear tests were conducted on eleven specimens comprising intact and non-intact shear surfaces. Each specimen was tested at four increasing increments of normal stresses between.6 and 2.4 MPa. Test results in the form of plots of shear stress versus shear displacement and shear stress versus normal stress are presented in Appendix D. The direct shear test was performed by applying a shear load on the specimen under a constant normal load and measuring the normal and shear displacements. The stress values were calculated by dividing the loads by the nominal areas (initial cross-sectional areas) of the interfaces (Equations 13 and 14). The test procedure made no provision for the measurement of pore pressures. The stress values determined before shearing were expressed in terms of total stress. After shearing, the shear plane provided a drainage path for dissipation of pore pressures, and the stress values were expressed in terms of effective stress. February 3, 29 7
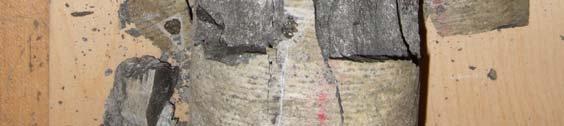
14 P n σ n = (13) A P s τ = (14) A where: σ n = normal stress τ = shear stress P n = normal load P s = shear load A = nominal area Strength values measured in the direct shear test included peak shear strength and residual strength. The strength values were measured from the stress-displacement plots obtained from the shear tests (see Appendix D). Due to the scattering of data in those plots, polynomial curve fitting was performed on stress and displacement data, employing a linear, quadratic or cubic equation. Table A-8 presents the strength values obtained from the shear tests. Graphs of peak shear strength and residual strength versus normal stress were plotted from the results for all test samples (Figures D-1 to D-8). The residual strength can be seen to increase steadily with normal stress in most of the tests. 6 Results and Conclusions This report has described the apparatus and procedures used to conduct various mechanical and dynamic property tests on rock units originating from sedimentary bedrock underlying the Bruce site. Information on specimen geological description and formation was provided by Intera Engineering Limited and is contained in Appendix F. The laboratory testing program was conducted during the interim of February to August of 27. Forty-seven uniaxials, twenty Brazilians and eight shear tests were completed. The following conclusions can be made. The Uniaxial Compressive strengths separate the rock units into different strength categories according to ASTM guide D5878 (ASTM D5878, 25), from weakest to strongest as follows: brecciated dolostone weak (5-25 MPa) dolomitic shale medium strong (25-5 MPa) shale medium strong (25-5 MPa) shale with limestone layers medium strong (25-5 MPa) limestone with shale layers medium strong (25-5 MPa) dolostone strong (5-1 MPa) argillaceous limestone very strong (1-25 MPa) crystalline dolostone very strong (1-25 MPa) Young s modulus and Poisson s ratio values were consistent with the strength determinations. Inspection of stress-strain curves contained in Appendix B confirms that many specimens failed due to the existence of planes of weakness as evidenced by abrupt shifts in the curves. AE curves of cumulative hits increase and coincide with the stress-strain curve shifts. The extent of weakness planes is seen first-hand by inspection of photographs of the failed specimen contained in Appendix C. Failure modes of the Brazilian specimens were greatly influenced by the presence of shale layers and anisotropy with bedding planes perpendicular to the axis of the core. The failures modes logged in Table A-7 confirm that February 3, 29 8
15 not many of the specimens failed by classical diametral planes, but by the combination of diametral planes and slabbing. The photograph in Appendix E provides a pictorial presentation of the failure modes of the tested specimens. The majority of shear tests were conducted as residual strength shear tests on open joints or planes of weakness. Test values of direct shear and residual shear strengths with the applied normal stresses are shown in Table A-8. In the majority of tests, residual shear strength increased with increasing application of normal stress. Appendix D contains graphs of shear and residual shear stress versus displacement for each of the eight specimens for each increment of applied normal stress. Appendix D also contains graphs of residual shear stress versus normal stress for each tested specimen. Linear fitting of the residual versus normal stress data was employed and is displayed in the graphs. 7 Data Quality and Use Data on geomechanical strength properties of DGR-1 and DGR-2 core described in this Technical Report are based on testing conducted in accordance with established and well defined ASTM testing procedures. The results presented in this Technical Report are suitable for assessing the geomechanical strength properties of bedrock formations intersected by DGR-1 and DGR-2, and the development of descriptive geomechanical models of the Bruce DGR site. 8 Disclaimer Any determination and/or reference made in this report with respect to any specific commercial product, process or service by trade name, trademark, manufacturer or otherwise shall be considered to be opinion; CANMET- MMSL makes no, and does not intend to make any, representations or implied warranties of merchantability or fitness for a particular purpose nor is it intended to endorse, recommend or favour any specific commercial product, process or service. The views and opinions of authors expressed herein do not necessarily state or reflect those of CANMET-MMSL and may not be used for advertising or product endorsement purposes. 9 References Durrheim, R.J., and Labrie, D., 24. Data-Driven Simulation of the Rock Mass response to Mining (Part 1): Laboratory Experimentation using Nepean Sandstone Models ; South African Inst. of Min. and Met; 2nd Int. Seminar on Deep and High Stress Mining Johannesburg, South Africa: pp Intera Engineering Ltd., 27a. Test Plan for Geomechanical Lab Testing of DGR-1 & DGR-2 Core, Revision 2, June 22, Ottawa. Intera Engineering Ltd., 27b. Project Quality Plan, DGR Site Characterization, Revision 3, January 17, Ottawa. Lau, J.S.O., 22. A laboratory Testing Program to Investigate the Mechanisms Leading to Debonding at Concrete-Rock Interfaces ; JSO Lau Consulting Services Inc.; Ottawa, Canada: 51p.. ASTM D2845, 25. Standard Test Method for Laboratory Determination of Pulse Velocities and Ultrasonic Constants of Rock ; Annual Book of ASTM Standards, Vol ASTM D3967, 25. Standard Test Method for the Splitting Tensile Strength of Intact Rock Core Specimens ; Annual Book of ASTM Standards, Vol ASTM D4543, 27. Standard Practice for Preparing Rock Core as Cylindrical Test Specimens and Verifying February 3, 29 9
16 Conformance to Dimensional and Shape Tolerances ; Annual Book of ASTM Standards, Vol ASTM D567, 26. Standard Test Method for Performing Laboratory Direct Shear Strength Tests of Rock Specimens under Constant Normal Force ; Annual Book of ASTM Standards, Vol ASTM D5878, 25. Standard Guides for Using Rock-Mass Classification Systems for Engineering Purposes ; Annual Book of ASTM Standards, Vol ASTM D712, 27. Standard Test Method for Compressive Strength and Elastic Moduli of Intact Rock Core Specimens under Varying States of Stress and Temperatures ; Annual Book of ASTM Standards, Vol ASTM E1237, 23. Standard Guide for Installing Bonded Resistance Strain ; Annual Book of ASTM Standards, Vol February 3, 29 1
17 APPENDIX A Data and Calculation Tables February 3, 29 11
18 Table A-1. Dimensions and densities of DGR-1 uniaxial specimens Test Depth Length Diameter Mass Density (No) (m) (mm) (mm) (g) (Mg/m³) February 3, 29 12
19 Table A-2. Dimensions and densities of DGR-2 uniaxial specimens Test Depth Length Diameter Mass Density (No) (m) (mm) (mm) (g) (Mg/m³) February 3, 29 13
20 Table A-3. Dynamic elastic constants of DGR-1 specimens Test Depth Length P-Wave Time P-Wave Velocity S-Wave Time S-Wave Velocity E Shear Modulus Poisson's Ratio (No) (m) (mm) (μs) (km/s) (μs) (km/s) (GPa) (GPa) (ν) February 3, 29 14
21 Table A-4. Dynamic elastic constants of DGR-2 specimens Test Depth Length P-Wave Time P-Wave Velocity S-Wave Time S-Wave Velocity E Shear Modulus Poisson's Ratio (No) (m) (mm) (μs ) (km/s) ( μs ) (km/s) (GPa) (GPa) (ν) February 3, 29 15
22 Table A-5. Static elastic constants of DGR-1 specimens Specimen Transducers Bonded Gauges Ultimate Uniaxial Test Depth Strength Peak Crack Crack Crack Poisson's Peak Poisson's E Damage Initiation E Damage Strain Ratio Strain Ratio Stress Stress Stress Crack Initiation Stress (No) (m) (MPa) (%) (GPa) (v) (σ s =Mpa) (σ d =MPa) (%) (GPa) (v) (σ s =MPa) (σ d =MPa) n/a n/a n/a n/a n/a n/a n/a n/a n/a n/a n/a n/a n/a n/a n/a n/a n/a n/a n/a n/a n/a n/a n/a n/a n/a n/a n/a n/a n/a February 3, 29 16
23 Table A-6. Static elastic constants of DGR-2 specimens Specimen Transducers Bonded Gauges Ultimate Uniaxial Test Depth Strength Peak Crack Crack Crack Poisson's Peak Poisson's E Damage Initiation E Damage Strain Ratio Strain Ratio Stress Stress Stress Crack Initiation Stress (No) (m) (MPa) (%) (GPa) (v) (σ s =MPa) (σ d =MPa) (%) (GPa) (v) (σ s =MPa) (σ d =MPa) n/a n/a n/a n/a n/a n/a n/a n/a n/a n/a n/a n/a n/a n/a n/a n/a n/a n/a n/a n/a n/a n/a n/a n/a n/a n/a n/a n/a n/a n/a n/a.9 n/a n/a n/a n/a n/a n/a February 3, 29 17
24 Table A-7. Brazilian test data for DGR-2 specimens Test Depth Diameter Thickness X-area Volume Mass Density Failure *Failure Load Tensile Strength (No.) (m) (mm) (mm) (cm²) (cm³) (g) (Mg/m³) Mode (N) (MPa) * Failure Modes: 1 Diametral 2 Slabbing 3 Combination of 1 and 2 February 3, 29 18
25 Table A-8. Shear test data for DGR-2 specimens Test Depth Diameter Length Mass Density Peak Shear Stress Residual Shear Stress Normal Stress (No.) (m) (mm) (mm) (g) (Mg/m³) (MPa) (MPa) (MPa) <-intact-> <-intact-> <-intact-> February 3, 29 19
26 Table A-8. Shear test data for DGR-2 specimens continued Test Depth Diameter Length Mass Density Peak Shear Stress Residual Shear Stress Normal Stress (No.) (m) (mm) (mm) (g) (Mg/m³) (MPa) (MPa) (MPa) <-intact-> <-intact-> <-intact-> February 3, 29 2
27 APPENDIX B Stress-Strain Curves of Uniaxial Tests February 3, 29 21
28 Deviation Transducer Strain (x1 6 ) Figure B-1 Specimen DGR-1, 27.3 m Deviation Transducer Strain (x1 6 ) Figure B-2 Specimen DGR-1, m February 3, 29 22
29 Deviation Gauge Strain (x1 6 ) Deviation Transducer Strain (x1 6 ) Figure B-3 Specimen DGR-1, 7.84 m February 3, 29 23
30 Deviation Gauge Strain (x1 6 ) Deviation Transducer Strain (x1 6 ) Figure B-4 Specimen DGR-1, m February 3, 29 24
31 Deviation Gauge Strain (x1 6 ) Deviation Transducer Strain (x1 6 ) Figure B-5 Specimen DGR-1, m February 3, 29 25
32 Deviation Gauge Strain (x1 6 ) Deviation Transducer Strain (x1 6 ) Figure B-6 Specimen DGR-1, m February 3, 29 26
33 Deviation Gauge Strain (x1 6 ) Deviation Transducer Strain (x1 6 ) Figure B-7 Specimen DGR-1, m February 3, 29 27
34 Deviation Gauge Strain (x1 6 ) Deviation Transducer Strain (x1 6 ) Figure B-8 Specimen DGR-1, m February 3, 29 28
35 3 2 1 Deviation Gauge Strain (x1 6 ) Deviation Transducer Strain (x1 6 ) Figure B-9 Specimen DGR-1, m February 3, 29 29
36 Deviation Gauge Strain (x1 6 ) Deviation Transducer Strain (x1 6 ) Figure B-1 Specimen DGR-1, m February 3, 29 3
37 Deviation Gauge Strain (x1 6 ) Deviation Transducer Strain (x1 6 ) Figure B-11 Specimen DGR-1, m February 3, 29 31
38 Deviation Gauge Strain (x1 6 ) Deviation Transducer Strain (x1 6 ) Figure B-12 Specimen DGR-1, m February 3, 29 32
39 Deviation Gauge Strain (x1 6 ) Deviation Transducer Strain (x1 6 ) Figure B-13 Specimen DGR-1, m February 3, 29 33
40 Deviation Gauge Strain (x1 6 ) Deviation Transducer Strain (x1 6 ) Figure B-14 Specimen DGR-1, m February 3, 29 34
41 Deviation Gauge Strain (x1 6 ) Deviation Transducer Strain (x1 6 ) Figure B-15 Specimen DGR-1, m February 3, 29 35
42 Deviation Gauge Strain (x1 6 ) Deviation Transducer Strain (x1 6 ) Figure B-16 Specimen DGR-1, m February 3, 29 36
43 Deviation Gauge Strain (x1 6 ) Deviation Transducer Strain (x1 6 ) Figure B-17 Specimen DGR-1, m February 3, 29 37
44 Deviation Gauge Strain (x1 6 ) Deviation Transducer Strain (x1 6 ) Figure B-18 Specimen DGR-2, m February 3, 29 38
45 Deviation Gauge Strain (x1 6 ) Deviation Transducer Strain (x1 6 ) Figure B-19 Specimen DGR-2, m February 3, 29 39
46 Deviation Gauge Strain (x1 6 ) Deviation Transducer Strain (x1 6 ) Figure B-2 Specimen DGR-2, m February 3, 29 4
47 Deviation Gauge Strain (x1 6 ) Deviation Transducer Strain (x1 6 ) Figure B-21 Specimen DGR-2, m February 3, 29 41
48 Deviation Gauge Strain (x1 6 ) Deviation Transducer Strain (x1 6 ) Figure B-22 Specimen DGR-2, m February 3, 29 42
49 Deviation Gauge Strain (x1 6 ) Deviation Transducer Strain (x1 6 ) Figure B-23 Specimen DGR-2, m February 3, 29 43
50 Deviation Gauge Strain (x1 6 ) Deviation Transducer Strain (x1 6 ) Figure B-24 Specimen DGR-2, m February 3, 29 44
51 Deviation Gauge Strain (x1 6 ) Deviation Transducer Strain (x1 6 ) Figure B-25 Specimen DGR-2, m February 3, 29 45
52 Deviation Gauge Strain (x1 6 ) Deviation Transducer Strain (x1 6 ) Figure B-26 Specimen DGR-2, m February 3, 29 46
53 Deviation Gauge Strain (x1 6 ) Deviation Transducer Strain (x1 6 ) Figure B-27 Specimen DGR-2, 66.5 m February 3, 29 47
54 Deviation Gauges Strain (x1 6 ) Deviation Transducer Strain (x1 6 ) Figure B-28 Specimen DGR-2, m February 3, 29 48
55 Deviation Gauge Strain (x1 6 ) Deviation Transducer Strain (x1 6 ) Figure B-29 Specimen DGR-2, m February 3, 29 49
56 Deviation Gauge Strain (x1 6 ) Deviation Transducer Strain (x1 6 ) Figure B-3 Specimen DGR-2, m February 3, 29 5
57 Deviation Gauge Strain (x1 6 ) Deviation Transducer Strain (x1 6 ) Figure B-31 Specimen DGR-2, m February 3, 29 51
58 Deviation Gauge Strain (x1 6 ) Deviation Transducer Strain (x1 6 ) Figure B-32 Specimen DGR-2, m February 3, 29 52
59 Deviation Gauge Strain (x1 6 ) Deviation Transducer Strain (x1 6 ) Figure B-33 Specimen DGR-2, m February 3, 29 53
60 Deviation Gauge Strain (x1 6 ) Deviation Transducer Strain (x1 6 ) Figure B-34 Specimen DGR-2, m February 3, 29 54
61 Deviation Gauge Strain (x1 6 ) Deviation Transducer Strain (x1 6 ) Figure B-35 Specimen DGR-2, m February 3, 29 55
62 Deviation Gauge Strain (x1 6 ) Deviation Transducer Strain (x1 6 ) Figure B-36 Specimen DGR-2, m February 3, 29 56
63 Deviation Gauge Strain (x1 6 ) Deviation Transducer Strain (x1 6 ) Figure B-37 Specimen DGR-2, m February 3, 29 57
64 Deviation Gauge Strain (x1 6 ) Deviation Transducer Strain (x1 6 ) Figure B-38 Specimen DGR-2, m February 3, 29 58
65 Deviation Gauge Strain (x1 6 ) Deviation Transducer Strain (x1 6 ) Figure B-39 Specimen DGR-2, m February 3, 29 59
66 Deviation Gauge Strain (x1 6 ) Deviation Transducer Strain (x1 6 ) Figure B-4 Specimen DGR-2, m February 3, 29 6
67 Deviation Gauge Strain (x1 6 ) Deviation Transducer Strain (x1 6 ) Figure B-41 Specimen DGR-2, m February 3, 29 61
68 Deviation Gauge Strain (x1 6 ) Deviation Transducer Strain (x1 6 ) Figure B-42 Specimen DGR-2, m February 3, 29 62
69 Deviation Gauge Strain (x1 6 ) Deviation Transducer Strain (x1 6 ) Figure B-43 Specimen DGR-2, m February 3, 29 63
70 Deviation Gauge Strain (x1 6 ) Deviation Transducer train (x1 6 ) Figure B-44 Specimen DGR-2, m February 3, 29 64
71 Deviation Gauge Strain (x1 6 ) Deviation Transducer Strain (x1 6 ) Figure B-45 Specimen DGR-2, m February 3, 29 65
72 3 2 1 Deviation Gauge Strain (x1 6 ) Deviation Transducer Strain (x1 6 ) Figure B-46 Specimen DGR-2, m February 3, 29 66
73 Deviation Gauge Strain (x1 6 ) Deviation Transducer Strain (x1 6 ) Figure B-47 Specimen DGR-2, m February 3, 29 67
74 APPENDIX C Failed Uniaxial Specimens and AE Source Locations February 3, 29 68


75 Figure C-1 Specimen DGR-1, 27.3 m February 3, 29 69


76 Figure C-2 Specimen DGR-1, m February 3, 29 7


77 Figure C-3 Specimen DGR-1, 7.84 m February 3, 29 71


78 Figure C-4 Specimen DGR-1, m February 3, 29 72


79 Figure C-5 Specimen DGR-1, m February 3, 29 73


80 Figure C-6 Specimen DGR-1, m February 3, 29 74


81 Figure C-7 Specimen DGR-1, m February 3, 29 75
82 Figure C-8 Specimen DGR-1, m February 3, 29 76


83 Figure C-9 Specimen DGR-1, m February 3, 29 77


84 Figure C-1 Specimen DGR-1, m February 3, 29 78


85 Figure C-11 Specimen DGR-1, m February 3, 29 79


86 Figure C-12 Specimen DGR-1, m February 3, 29 8


87 Figure C-13 Specimen DGR-1, m February 3, 29 81


88 Figure C-14 Specimen DGR-1, m February 3, 29 82


89 Figure C-15 Specimen DGR-1, m February 3, 29 83


90 Figure C-16 Specimen DGR-1, m February 3, 29 84


91 Figure C-17 Specimen DGR-1, m February 3, 29 85


92 Figure C-18 Specimen DGR-2, m February 3, 29 86


93 Figure C-19 Specimen DGR-2, m February 3, 29 87


94 Figure C-2 Specimen DGR-2, m February 3, 29 88


95 Figure C-21 Specimen DGR-2, m February 3, 29 89


96 Figure C-22 Specimen DGR-2, m February 3, 29 9


97 Figure C-23 Specimen DGR-2, m February 3, 29 91


98 Figure C-24 Specimen DGR-2, m February 3, 29 92


99 Figure C-25 Specimen DGR-2, m February 3, 29 93


100 Figure C-26 Specimen DGR-2, m February 3, 29 94


101 Figure C-27 Specimen DGR-2, 66.5 m February 3, 29 95


102 Figure C-28 Specimen DGR-2, m February 3, 29 96


103 Figure C-29 Specimen DGR-2, m February 3, 29 97


104 Figure C-3 Specimen DGR-2, m February 3, 29 98


105 Figure C-31 Specimen DGR-2, m February 3, 29 99


106 Figure C-32 Specimen DGR-2, m February 3, 29 1


107 Figure C-33 Specimen DGR-2, m February 3, 29 11


108 Figure C-34 Specimen DGR-2, m February 3, 29 12


109 Figure C-35 Specimen DGR-2, m February 3, 29 13


110 Figure C-36 Specimen DGR-2, m February 3, 29 14


111 Figure C-37 Specimen DGR-2, m February 3, 29 15


112 Figure C-38 Specimen DGR-2, m February 3, 29 16


113 Figure C-39 Specimen DGR-2, m February 3, 29 17


114 Figure C-4 Specimen DGR-2, m February 3, 29 18


115 Figure C-41 Specimen DGR-2, m February 3, 29 19


116 Figure C-42 Specimen DGR-2, m February 3, 29 11


117 Figure C-43 Specimen DGR-2, m February 3,


118 Figure C-44 Specimen DGR-2, m February 3,


119 Figure C-45 Specimen DGR-2, m February 3,


120 Figure C-46 Specimen DGR-2, m February 3,


121 Figure C-47 Specimen DGR-2, m February 3,
Supplementary Uniaxial Compressive Strength Testing of DGR-3 and DGR-4 Core
 Technical Report Title: Document ID: Authors: Supplementary Uniaxial Compressive Strength Testing of DGR-3 and DGR-4 Core TR-08-39 B. Gorski, T. Anderson and D. Rodgers CANMET Mining and Mineral Sciences
Long-Term Strength Degradation Testing of DGR-3 and DGR-4 Core
 Technical Report Title: Document ID: Authors: Long-Term Strength Degradation Testing of DGR-3 and DGR-4 Core TR-08-36 B. Gorski, T. Anderson and B. Conlon CANMET Mining and Mineral Sciences Laboratories,
Laboratory Geomechanical Strength Testing of DGR-2 to DGR-6 Core
 Technical Report Title: Document ID: Authors: Laboratory Geomechanical Strength Testing of DGR-2 to DGR-6 Core TR-9-7 B. Gorski, D. Rodgers and B. Conlon CANMET Mining and Mineral Sciences Laboratories,
Module 5: Failure Criteria of Rock and Rock masses. Contents Hydrostatic compression Deviatoric compression
 FAILURE CRITERIA OF ROCK AND ROCK MASSES Contents 5.1 Failure in rocks 5.1.1 Hydrostatic compression 5.1.2 Deviatoric compression 5.1.3 Effect of confining pressure 5.2 Failure modes in rocks 5.3 Complete
1.103 CIVIL ENGINEERING MATERIALS LABORATORY (1-2-3) Dr. J.T. Germaine Spring 2004 LABORATORY ASSIGNMENT NUMBER 6
 Dr. J.T. Germaine Spring 2004 LABORATORY ASSIGNMENT NUMBER 6") 1.103 CIVIL ENGINEERING MATERIALS LABORATORY (1-2-3) Dr. J.T. Germaine MIT Spring 2004 LABORATORY ASSIGNMENT NUMBER 6 COMPRESSION TESTING AND ANISOTROPY OF WOOD Purpose: Reading: During this laboratory
1.103 CIVIL ENGINEERING MATERIALS LABORATORY (1-2-3) Dr. J.T. Germaine MIT Spring 2004 LABORATORY ASSIGNMENT NUMBER 6 COMPRESSION TESTING AND ANISOTROPY OF WOOD Purpose: Reading: During this laboratory
Samantha Ramirez, MSE. Stress. The intensity of the internal force acting on a specific plane (area) passing through a point. F 2
 passing through a point. F 2") Samantha Ramirez, MSE Stress The intensity of the internal force acting on a specific plane (area) passing through a point. Δ ΔA Δ z Δ 1 2 ΔA Δ x Δ y ΔA is an infinitesimal size area with a uniform force
Samantha Ramirez, MSE Stress The intensity of the internal force acting on a specific plane (area) passing through a point. Δ ΔA Δ z Δ 1 2 ΔA Δ x Δ y ΔA is an infinitesimal size area with a uniform force
Experimental study of mechanical and thermal damage in crystalline hard rock
 Experimental study of mechanical and thermal damage in crystalline hard rock Mohammad Keshavarz Réunion Technique du CFMR - Thèses en Mécanique des Roches December, 3 nd 2009 1 Overview Introduction Characterization
DOWN-HOLE SEISMIC SURVEY AND VERTICAL ELECTRIC SOUNDINGS RABASKA PROJECT, LÉVIS, QUÉBEC. Presented to :
 DOWN-HOLE SEISMIC SURVEY AND VERTICAL ELECTRIC SOUNDINGS RABASKA PROJECT, LÉVIS, QUÉBEC Presented to : TERRATECH 455, René-Lévesque Blvd. West Montreal, Québec HZ 1Z3 Presented by : GEOPHYSICS GPR INTERNATIONAL
Project PAJ2 Dynamic Performance of Adhesively Bonded Joints. Report No. 3 August Proposed Draft for the Revision of ISO
 NPL Report CMMT(A)81 Project PAJ2 Dynamic Performance of Adhesively Bonded Joints Report No. 3 August 1997 Proposed Draft for the Revision of ISO 11003-2 Adhesives - Determination of Shear Behaviour of
MEMORANDUM SUBJECT: CERTIFICATE IN ROCK MECHANICS PAPER 1 : THEORY SUBJECT CODE: COMRMC MODERATOR: H YILMAZ EXAMINATION DATE: OCTOBER 2017 TIME:
 MEMORANDUM SUBJECT: CERTIFICATE IN ROCK MECHANICS PAPER 1 : THEORY EXAMINER: WM BESTER SUBJECT CODE: COMRMC EXAMINATION DATE: OCTOBER 2017 TIME: MODERATOR: H YILMAZ TOTAL MARKS: [100] PASS MARK: (60%)
Laboratory Triaxial and Permeability Tests on Tournemire Shale and Cobourg Limestone (Contract : R413.8) FINAL REPORT
 FINAL REPORT") RSP-413.8 Laboratory Triaxial and Permeability Tests on Tournemire Shale and Cobourg Limestone (Contract 87055-14-0209: R413.8) FINAL REPORT M.H.B. Nasseri, Ph.D and R.P. Young, Ph.D University of Toronto
RSP-413.8 Laboratory Triaxial and Permeability Tests on Tournemire Shale and Cobourg Limestone (Contract 87055-14-0209: R413.8) FINAL REPORT M.H.B. Nasseri, Ph.D and R.P. Young, Ph.D University of Toronto
Task 1 - Material Testing of Bionax Pipe and Joints
 Task 1 - Material Testing of Bionax Pipe and Joints Submitted to: Jeff Phillips Western Regional Engineer IPEX Management, Inc. 20460 Duncan Way Langley, BC, Canada V3A 7A3 Ph: 604-534-8631 Fax: 604-534-7616
Geomechanical Characterization of a Montney Equivalent Outcrop
 Is (MPa) Geomechanical Characterization of a Montney Equivalent Outcrop Scott H McKean, Mason MacKay, Dr. Jeffrey Priest University of Calgary Summary A variety of geomechanical tests (point load strength,
CTC 460 kcmil ACCC Conductor Stress Strain Tests
 CTC 46 kcmil ACCC Conductor Stress Strain Tests NEETRAC Project Number: 8-45 March, 28 Requested by: Doug Pilling CTC Principal Investigator: Paul Springer, PE Reviewed by: Graham Price CTC 46 kcmil Conductor
Evaluation of in-plane orthotropic elastic constants of paper and paperboard
 Evaluation of in-plane orthotropic elastic constants of paper and paperboard T. Yokoyama and K. Nakai Department of Mechanical Engineering, Okayama University of Science - Ridai-cho, Okayama 7-5, Japan
DETERMINING THE STRESS PATTERN IN THE HH RAILROAD TIES DUE TO DYNAMIC LOADS 1
 PERIODICA POLYTECHNICA SER. CIV. ENG. VOL. 46, NO. 1, PP. 125 148 (2002) DETERMINING THE STRESS PATTERN IN THE HH RAILROAD TIES DUE TO DYNAMIC LOADS 1 Nándor LIEGNER Department of Highway and Railway Engineering
Field Geomechanical Testing of DGR-1 and DGR-2 Core. Steve Gaines & Sean Sterling
 Technical Report Title: Field Geomechanical Testing of DGR-1 and DGR-2 Core Document ID: Authors: TR-07-07 Steve Gaines & Sean Sterling Revision: 1 Date: February 13, 2009 DGR Site Characterization Document
Rock Material. Chapter 3 ROCK MATERIAL HOMOGENEITY AND INHOMOGENEITY CLASSIFICATION OF ROCK MATERIAL
 Chapter 3 Rock Material In all things of nature there is something of the marvelous. Aristotle ROCK MATERIAL The term rock material refers to the intact rock within the framework of discontinuities. In
Rock Mechanics Laboratory Tests for Petroleum Applications. Rob Marsden Reservoir Geomechanics Advisor Gatwick
 Rock Mechanics Laboratory Tests for Petroleum Applications Rob Marsden Reservoir Geomechanics Advisor Gatwick Summary A wide range of well established and proven laboratory tests are available for petroleum
In-situ Experiments on Excavation Disturbance in JNC s Geoscientific Research Programme
 In-situ Experiments on Excavation Disturbance in JNC s Geoscientific Research Programme H. Matsui, K. Sugihara and T. Sato Japan Nuclear Cycle Development Institute, Japan Summary The HLW disposal program
Numerical modeling of standard rock mechanics laboratory tests using a finite/discrete element approach
 Numerical modeling of standard rock mechanics laboratory tests using a finite/discrete element approach S. Stefanizzi GEODATA SpA, Turin, Italy G. Barla Department of Structural and Geotechnical Engineering,
SHEAR STRENGTH OF SOIL UNCONFINED COMPRESSION TEST
 SHEAR STRENGTH OF SOIL DEFINITION The shear strength of the soil mass is the internal resistance per unit area that the soil mass can offer to resist failure and sliding along any plane inside it. INTRODUCTION
Effect of intermediate principal stresses on compressive strength of Phra Wihan sandstone
 Rock Mechanics, Fuenkajorn & Phien-wej (eds) 211. ISBN 978 974 533 636 Effect of intermediate principal stresses on compressive strength of Phra Wihan sandstone T. Pobwandee & K. Fuenkajorn Geomechanics
NORMAL STRESS. The simplest form of stress is normal stress/direct stress, which is the stress perpendicular to the surface on which it acts.
 NORMAL STRESS The simplest form of stress is normal stress/direct stress, which is the stress perpendicular to the surface on which it acts. σ = force/area = P/A where σ = the normal stress P = the centric
ME 243. Mechanics of Solids
 ME 243 Mechanics of Solids Lecture 2: Stress and Strain Ahmad Shahedi Shakil Lecturer, Dept. of Mechanical Engg, BUET E-mail: sshakil@me.buet.ac.bd, shakil6791@gmail.com Website: teacher.buet.ac.bd/sshakil
The University of Melbourne Engineering Mechanics
 The University of Melbourne 436-291 Engineering Mechanics Tutorial Four Poisson s Ratio and Axial Loading Part A (Introductory) 1. (Problem 9-22 from Hibbeler - Statics and Mechanics of Materials) A short
Exercise: concepts from chapter 8
 Reading: Fundamentals of Structural Geology, Ch 8 1) The following exercises explore elementary concepts associated with a linear elastic material that is isotropic and homogeneous with respect to elastic
Experiment Two (2) Torsional testing of Circular Shafts
 Torsional testing of Circular Shafts") Experiment Two (2) Torsional testing of Circular Shafts Introduction: Torsion occurs when any shaft is subjected to a torque. This is true whether the shaft is rotating (such as drive shafts on engines,
Experiment Two (2) Torsional testing of Circular Shafts Introduction: Torsion occurs when any shaft is subjected to a torque. This is true whether the shaft is rotating (such as drive shafts on engines,
ATTEMPT TO MEASURE VELOCITY AT LOW FREQUENCY BY MODIFIED TRI-AXIAL DESTRUCTIVE INSTRUMENT
 SCA2010-40 1/6 ATTEMPT TO MEASURE VELOCITY AT LOW FREQUENCY BY MODIFIED TRI-AXIAL DESTRUCTIVE INSTRUMENT Fumio Kono, Shigenobu Onozuka, Satoshi Izumotani and Naoyuki Shimoda Japan Oil, Gas and Metals National
Standard Test Method for Determination of the Point Load Strength Index of Rock 1
 Designation: D 5731 95 AMERICAN SOCIETY FOR TESTING AND MATERIALS 100 Barr Harbor Dr., West Conshohocken, PA 19428 Reprinted from the Annual Book of ASTM Standards. Copyright ASTM Standard Test Method
STRAIN GAUGES YEDITEPE UNIVERSITY DEPARTMENT OF MECHANICAL ENGINEERING
 STRAIN GAUGES YEDITEPE UNIVERSITY DEPARTMENT OF MECHANICAL ENGINEERING 1 YEDITEPE UNIVERSITY ENGINEERING FACULTY MECHANICAL ENGINEERING LABORATORY 1. Objective: Strain Gauges Know how the change in resistance
Hardened Concrete. Lecture No. 16
 Hardened Concrete Lecture No. 16 Fatigue strength of concrete Modulus of elasticity, Creep Shrinkage of concrete Stress-Strain Plot of Concrete At stress below 30% of ultimate strength, the transition
A comprehensive investigation of crack damage anisotropy in Cobourg limestone and its effect on the failure envelope
 A comprehensive investigation of crack damage anisotropy in Cobourg limestone and its effect on the failure envelope E. Ghazvinian, M. Perras, C. Langford & M. Diederichs GeoEngineering Centre, Queen s
CIVE 2700: Civil Engineering Materials Fall Lab 2: Concrete. Ayebabomo Dambo
 CIVE 2700: Civil Engineering Materials Fall 2017 Lab 2: Concrete Ayebabomo Dambo Lab Date: 7th November, 2017 CARLETON UNIVERSITY ABSTRACT Concrete is a versatile construction material used in bridges,
Mechanical properties 1 Elastic behaviour of materials
 MME131: Lecture 13 Mechanical properties 1 Elastic behaviour of materials A. K. M. B. Rashid Professor, Department of MME BUET, Dhaka Today s Topics Deformation of material under the action of a mechanical
DEM simulation of fracture process of inherently anisotropic rock under Brazilian test condition
 Title DEM simulation of fracture process of inherently anisotropic rock under Brazilian test condition Author(s) Kwok, CY; Duan, K Citation The 49th US Rock Mechanics / Geomechanics Symposium, San Francisco,
QUANTITATIVE DAMAGE ESTIMATION OF CONCRETE CORE BASED ON AE RATE PROCESS ANALYSIS
 QUANTITATIVE DAMAGE ESTIMATION OF CONCRETE CORE BASED ON AE RATE PROCESS ANALYSIS MASAYASU OHTSU and TETSUYA SUZUKI 1 Kumamoto University, Kumamoto 860-8555, Japan 2 Nippon Suiko Consultants Co., Kumamoto
LECTURE NO. 4-5 INTRODUCTION ULTRASONIC * PULSE VELOCITY METHODS
 LECTURE NO. 4-5 ULTRASONIC * PULSE VELOCITY METHODS Objectives: To introduce the UPV methods To briefly explain the theory of pulse propagation through concrete To explain equipments, procedures, calibrations,
DEVELOPMENT OF DROP WEIGHT IMPACT TEST MACHINE
 CHAPTER-8 DEVELOPMENT OF DROP WEIGHT IMPACT TEST MACHINE 8.1 Introduction The behavior of materials is different when they are subjected to dynamic loading [9]. The testing of materials under dynamic conditions
APPLICATION OF 1D HYDROMECHANICAL COUPLING IN TOUGH2 TO A DEEP GEOLOGICAL REPOSITORY GLACIATION SCENARIO
 PROCEEDINGS, TOUGH Symposium 2015 Lawrence Berkeley National Laboratory, Berkeley, California, September 28-30, 2015 APPLICATION OF 1D HYDROMECHANICAL COUPLING IN TOUGH2 TO A DEEP GEOLOGICAL REPOSITORY
Soil strength. the strength depends on the applied stress. water pressures are required
 Soil Strength Soil strength u Soils are essentially frictional materials the strength depends on the applied stress u Strength is controlled by effective stresses water pressures are required u Soil strength
DAMAGE CHARACTERIZATION OF COAL MEASURE ROCKS UNDER UNIAXIAL COMPRESSION
 DAMAGE CHARACTERIZATION OF COAL MEASURE ROCKS UNDER UNIAXIAL COMPRESSION and Michael Alber Engineering Geology Group Ruhr University Bochum, Germany ABSTRACT The identification of burst-prone rock layers
1. A pure shear deformation is shown. The volume is unchanged. What is the strain tensor.
 Elasticity Homework Problems 2014 Section 1. The Strain Tensor. 1. A pure shear deformation is shown. The volume is unchanged. What is the strain tensor. 2. Given a steel bar compressed with a deformation
OP-023. INTERPRETATION OF INSTRUMENTED TEST PILE RESULT
 INTERPRETATION OF INSTRUMENTED TEST PILE RESULT Page 1 of 9 WORK INSTRUCTIONS FOR ENGINEERS GSJ Compiled by : Checked by KYW : LSS Approved by : OP-23. INTERPRETATION OF INSTRUMENTED TEST PILE RESULT INTERPRETATION
DEVELOPMENT OF AUTOMATIC CONTROL OF MULTI-STAGE TRIAXIAL TESTS AT THE UNIVERSITY OF MISKOLC
 Geosciences and Engineering, Vol. 2, No. 3 (2013), pp. 37 43. DEVELOPMENT OF AUTOMATIC CONTROL OF MULTI-STAGE TRIAXIAL TESTS AT THE UNIVERSITY OF MISKOLC BALÁZS CSUHANICS ÁKOS DEBRECZENI Institute of Mining
MECE 3321 MECHANICS OF SOLIDS CHAPTER 3
 MECE 3321 MECHANICS OF SOLIDS CHAPTER 3 Samantha Ramirez TENSION AND COMPRESSION TESTS Tension and compression tests are used primarily to determine the relationship between σ avg and ε avg in any material.
Acquisition of Complete Acoustic Emission Amplitude Records during Rock Fracture Experiments
 Acquisition of Complete Acoustic Emission Amplitude Records during Rock Fracture Experiments S.D. Goodfellow 1, J.W. Flynn 2, J.M. Reyes-Montes 2, M.H.B. Nasseri 1 and R.P. Young 1 1 Department of Civil
Part 7. Nonlinearity
 Part 7 Nonlinearity Linear System Superposition, Convolution re ( ) re ( ) = r 1 1 = r re ( 1 + e) = r1 + r e excitation r = r() e response In the time domain: t rt () = et () ht () = e( τ) ht ( τ) dτ
COMPARING LABORATORY AND FIELD DURABILITY TESTING OF STONE Accelerated Weathering Testing of Stone
 COMPARING LABORATORY AND FIELD DURABILITY TESTING OF STONE Accelerated Weathering Testing of Stone B. WONNEBERGER AND S. A. BORTZ Wiss, Janney, Elstner Associates, Inc., Northbrook, Illinois, USA 60062
Module 9 : Foundation on rocks. Content
 FOUNDATION ON ROCKS Content 9.1 INTRODUCTION 9.2 FOUNDATION TYPES ON ROCKS 9.3 BEARING CAPCITY- SHALLOW FOUNDATION 9.3.1 Ultimate bearing capacity 9.3.2 Safe bearing pressure 9.3.3 Estimation of bearing
Mechanical Response of a Composite Steel, Concrete- Filled Pile
 Mechanical Response of a Composite Steel, Concrete- Filled Pile Joseph Labuz, Principal Investigator Department of Civil, Environmental, and Geo- Engineering University of Minnesota June 2018 Research
[5] Stress and Strain
![[5] Stress and Strain](/thumbs/95/123344550.jpg "[5] Stress and Strain") [5] Stress and Strain Page 1 of 34 [5] Stress and Strain [5.1] Internal Stress of Solids [5.2] Design of Simple Connections (will not be covered in class) [5.3] Deformation and Strain [5.4] Hooke s Law
[5] Stress and Strain Page 1 of 34 [5] Stress and Strain [5.1] Internal Stress of Solids [5.2] Design of Simple Connections (will not be covered in class) [5.3] Deformation and Strain [5.4] Hooke s Law
20. Rheology & Linear Elasticity
 I Main Topics A Rheology: Macroscopic deformation behavior B Linear elasticity for homogeneous isotropic materials 10/29/18 GG303 1 Viscous (fluid) Behavior http://manoa.hawaii.edu/graduate/content/slide-lava
Stress-Strain Behavior
 Stress-Strain Behavior 6.3 A specimen of aluminum having a rectangular cross section 10 mm 1.7 mm (0.4 in. 0.5 in.) is pulled in tension with 35,500 N (8000 lb f ) force, producing only elastic deformation.
CONCRETE TECHNOLOGY LABORATORY
 CONCRETE TECHNOLOGY LABORATORY DEPARTMENT OF CIVIL ENGINEERING CHULALONGKORN UNIVERSITY Tested by... ID No.... Date... Graded by... TEST No. C-7 NON-DESTRUCTIVE TEST OF HARDENED CONCRETE Part A Pulse Velocity
Pullout Tests of Geogrids Embedded in Non-cohesive Soil
 Archives of Hydro-Engineering and Environmental Mechanics Vol. 51 (2004), No. 2, pp. 135 147 Pullout Tests of Geogrids Embedded in Non-cohesive Soil Angelika Duszyńska, Adam F. Bolt Gdansk University of
Standard Test Method for In Situ Determination of Direct Shear Strength of Rock Discontinuities 1
 Designation: D 4554 90 (Reapproved 1995) AMERICAN SOCIETY FOR TESTING AND MATERIALS 100 Barr Harbor Dr., West Conshohocken, PA 19428 Reprinted from the Annual Book of ASTM Standards. Copyright ASTM Standard
NOTICE CONCERNING COPYRIGHT RESTRICTIONS
 NOTICE CONCERNING COPYRIGHT RESTRICTIONS This document may contain copyrighted materials. These materials have been made available for use in research, teaching, and private study, but may not be used
N = Shear stress / Shear strain
 UNIT - I 1. What is meant by factor of safety? [A/M-15] It is the ratio between ultimate stress to the working stress. Factor of safety = Ultimate stress Permissible stress 2. Define Resilience. [A/M-15]
STANDARD SAMPLE. Reduced section " Diameter. Diameter. 2" Gauge length. Radius
 MATERIAL PROPERTIES TENSILE MEASUREMENT F l l 0 A 0 F STANDARD SAMPLE Reduced section 2 " 1 4 0.505" Diameter 3 4 " Diameter 2" Gauge length 3 8 " Radius TYPICAL APPARATUS Load cell Extensometer Specimen
RELATIONSHIP BETWEEN RADIAL COMPRESSIVE MODULUS OF ELASTICITY AND SHEAR MODULUS OF WOOD Jen Y. Liu Research Engineer
 RELATIONSHIP BETWEEN RADIAL COMPRESSIVE MODULUS OF ELASTICITY AND SHEAR MODULUS OF WOOD Jen Y. Liu Research Engineer and Robert J. Ross Supervisory Research Engineer USDA Forest Service Forest Products
EMA 3702 Mechanics & Materials Science (Mechanics of Materials) Chapter 2 Stress & Strain - Axial Loading
 Chapter 2 Stress & Strain - Axial Loading") MA 3702 Mechanics & Materials Science (Mechanics of Materials) Chapter 2 Stress & Strain - Axial Loading MA 3702 Mechanics & Materials Science Zhe Cheng (2018) 2 Stress & Strain - Axial Loading Statics
MA 3702 Mechanics & Materials Science (Mechanics of Materials) Chapter 2 Stress & Strain - Axial Loading MA 3702 Mechanics & Materials Science Zhe Cheng (2018) 2 Stress & Strain - Axial Loading Statics
Unit I Stress and Strain
 Unit I Stress and Strain Stress and strain at a point Tension, Compression, Shear Stress Hooke s Law Relationship among elastic constants Stress Strain Diagram for Mild Steel, TOR steel, Concrete Ultimate
Module III - Macro-mechanics of Lamina. Lecture 23. Macro-Mechanics of Lamina
 Module III - Macro-mechanics of Lamina Lecture 23 Macro-Mechanics of Lamina For better understanding of the macromechanics of lamina, the knowledge of the material properties in essential. Therefore, the
PREDICTION OF OUT-OF-PLANE FAILURE MODES IN CFRP
 PREDICTION OF OUT-OF-PLANE FAILURE MODES IN CFRP R. R. Pinto 1, P. P. Camanho 2 1 INEGI - Instituto de Engenharia Mecanica e Gestao Industrial, Rua Dr. Roberto Frias, 4200-465, Porto, Portugal 2 DEMec,
**********************************************************************
 Department of Civil and Environmental Engineering School of Mining and Petroleum Engineering 3-33 Markin/CNRL Natural Resources Engineering Facility www.engineering.ualberta.ca/civil Tel: 780.492.4235
ME 2570 MECHANICS OF MATERIALS
 ME 2570 MECHANICS OF MATERIALS Chapter III. Mechanical Properties of Materials 1 Tension and Compression Test The strength of a material depends on its ability to sustain a load without undue deformation
NDE of wood-based composites with longitudinal stress waves
 NDE of wood-based composites with longitudinal stress waves Robert J. Ross Roy F. Pellerin Abstract The research presented in this paper reveals that stress wave nondestructive testing techniques can be
Temperature Dependent Mechanical Properties of Reservoir s Overburden Rocks During SAGD Process
 Temperature Dependent Mechanical Properties of Reservoir s Overburden Rocks During SAGD Process Bo Zhao 1, Shangqi Liu 2, Bo Huang 3, and Yang Liu 4 and Guangqing Zhang *,5 1,5 China University of Petroleum
Oriented Core Logging of DGR-5 and DGR-6. Steve Gaines, Kenneth Raven and Michael Melaney
 Technical Report Title: Document ID: Authors: Oriented Core Logging of DGR-5 and DGR-6 TR-09-09 Steve Gaines, Kenneth Raven and Michael Melaney Revision: 0 Date: April 8, 2011 DGR Site Characterization
Lecture 8 Viscoelasticity and Deformation
 Read: pg 130 168 (rest of Chpt. 4) 1 Poisson s Ratio, µ (pg. 115) Ratio of the strain in the direction perpendicular to the applied force to the strain in the direction of the applied force. For uniaxial
Compilation and Consolidation of Field and Laboratory Data for Hydrogeological Properties
 Technical Report Title: Document ID: Author: Compilation and Consolidation of Field and Laboratory Data for Hydrogeological Properties TR-08-10 Robert Walsh Revision: 1 Date: April 1, 2011 DGR Site Characterization
Brittle Deformation. Earth Structure (2 nd Edition), 2004 W.W. Norton & Co, New York Slide show by Ben van der Pluijm
, 2004 W.W. Norton & Co, New York Slide show by Ben van der Pluijm") Lecture 6 Brittle Deformation Earth Structure (2 nd Edition), 2004 W.W. Norton & Co, New York Slide show by Ben van der Pluijm WW Norton, unless noted otherwise Brittle deformation EarthStructure (2 nd
Lecture 6 Brittle Deformation Earth Structure (2 nd Edition), 2004 W.W. Norton & Co, New York Slide show by Ben van der Pluijm WW Norton, unless noted otherwise Brittle deformation EarthStructure (2 nd
3D simulations of an injection test done into an unsaturated porous and fractured limestone
 3D simulations of an injection test done into an unsaturated porous and fractured limestone A. Thoraval *, Y. Guglielmi, F. Cappa INERIS, Ecole des Mines de Nancy, FRANCE *Corresponding author: Ecole des
The Mine Geostress Testing Methods and Design
 Open Journal of Geology, 2014, 4, 622-626 Published Online December 2014 in SciRes. http://www.scirp.org/journal/ojg http://dx.doi.org/10.4236/ojg.2014.412046 The Mine Geostress Testing Methods and Design
Tensile Stress Acoustic Constants of Unidirectional Graphite/Epoxy Composites
 Tensile Stress Acoustic Constants of Unidirectional Graphite/Epoxy Composites Journal of Reinforced Plastics and Composites, Vol. 9 (March, 1990) pp. 127-133 W. H. PROSSER NASA Langley Research Center
On the study of elastic wave scattering and Rayleigh wave velocity measurement of concrete with steel bar
 NDT&E International 33 (2000) 401 407 www.elsevier.com/locate/ndteint On the study of elastic wave scattering and Rayleigh wave velocity measurement of concrete with steel bar T.-T. Wu*, J.-H. Sun, J.-H.
SIZE EFFECTS IN THE COMPRESSIVE CRUSHING OF HONEYCOMBS
 43rd AIAA/ASME/ASCE/AHS/ASC Structures, Structural Dynamics, and Materials Con 22-25 April 2002, Denver, Colorado SIZE EFFECTS IN THE COMPRESSIVE CRUSHING OF HONEYCOMBS Erik C. Mellquistand Anthony M.
Lecture #2: Split Hopkinson Bar Systems
 Lecture #2: Split Hopkinson Bar Systems by Dirk Mohr ETH Zurich, Department of Mechanical and Process Engineering, Chair of Computational Modeling of Materials in Manufacturing 2015 1 1 1 Uniaxial Compression
AE3610 Experiments in Fluid and Solid Mechanics TRANSIENT MEASUREMENTS OF HOOP STRESSES FOR A THIN-WALL PRESSURE VESSEL
 Objective AE3610 Experiments in Fluid and Solid Mechanics TRANSIENT MEASUREMENTS OF OOP STRESSES FOR A TIN-WA PRESSURE VESSE This experiment will allow you to investigate hoop and axial stress/strain relations
University of Sheffield The development of finite elements for 3D structural analysis in fire
 The development of finite elements for 3D structural analysis in fire Chaoming Yu, I. W. Burgess, Z. Huang, R. J. Plank Department of Civil and Structural Engineering StiFF 05/09/2006 3D composite structures
Mechanical Properties of Materials
 Mechanical Properties of Materials Strains Material Model Stresses Learning objectives Understand the qualitative and quantitative description of mechanical properties of materials. Learn the logic of
FRACTURE REORIENTATION IN HORIZONTAL WELL WITH MULTISTAGE HYDRAULIC FRACTURING
 SPE Workshop OILFIELD GEOMECHANICS Slide 1 FRACTURE REORIENTATION IN HORIZONTAL WELL WITH MULTISTAGE HYDRAULIC FRACTURING A. Pimenov, R. Kanevskaya Ltd. BashNIPIneft March 27-28, 2017 Moscow, Russia Slide
Correlation between Blast Efficiency and Uniaxial Compressive Strength
 International Journal of Engineering and Technology Volume 3 No. 8, August, 213 Correlation between Blast Efficiency and Uniaxial Compressive Strength M. A. Saliu, A. F. Akindoyeni, I. A. Okewale Department
3 Hours/100 Marks Seat No.
 *17304* 17304 14115 3 Hours/100 Marks Seat No. Instructions : (1) All questions are compulsory. (2) Illustrate your answers with neat sketches wherever necessary. (3) Figures to the right indicate full
PETROPHYSICAL STUDIES OF SANDSTONES UNDER TRUE-TRIAXIAL STRESS CONDITIONS
 PETROPHYSICAL STUDIES OF SANDSTONES UNDER TRUE-TRIAXIAL STRESS CONDITIONS M.S. King, S.Al-Harthy * and X.D. Jing **, Centre for Petroleum Studies, Royal School of Mines Imperial College of Science, Technology
Challenges related to standardized detection of crack initiation thresholds for lower-bound or ultra-long-term strength prediction of rock
 Challenges related to standardized detection of crack initiation thresholds for lower-bound or ultra-long-term strength prediction of rock E. Ghazvinian*, M. Diederichs* & J. Archibald *Dept. of Geological
Rock slope failure along non persistent joints insights from fracture mechanics approach
 Rock slope failure along non persistent joints insights from fracture mechanics approach Louis N.Y. Wong PhD(MIT), BSc(HKU) Assistant Professor and Assistant Chair (Academic) Nanyang Technological University,
PERFORMANCE TEST REPORT. Rendered to: VELUX AMERICA, INC. PRODUCT: SUN TUNNEL Domes TYPES: Acrylic and Polycarbonate
 PERFORMANCE TEST REPORT Rendered to: VELUX AMERICA, INC. PRODUCT: SUN TUNNEL Domes TYPES: Acrylic and Polycarbonate Report No.: E3490.01-106-31 Report Date: 07/13/15 Test Record Retention Date: 06/18/19
Estimation of Seismic Damage for Optimum Management of Irrigation Infrastructures in Service Conditions using Elastic Waves Information
 Estimation of Seismic Damage for Optimum Management of Irrigation Infrastructures in Service Conditions using Elastic Waves Information Tetsuya Suzuki Faculty of Agriculture, Niigata University 950-2181,
MECHANICS OF MATERIALS. Prepared by Engr. John Paul Timola
 MECHANICS OF MATERIALS Prepared by Engr. John Paul Timola Mechanics of materials branch of mechanics that studies the internal effects of stress and strain in a solid body. stress is associated with the
Solid Mechanics Chapter 1: Tension, Compression and Shear
 Solid Mechanics Chapter 1: Tension, Compression and Shear Dr. Imran Latif Department of Civil and Environmental Engineering College of Engineering University of Nizwa (UoN) 1 Why do we study Mechanics
The science of elasticity
 The science of elasticity In 1676 Hooke realized that 1.Every kind of solid changes shape when a mechanical force acts on it. 2.It is this change of shape which enables the solid to supply the reaction
CHAPTER 3 EXPERIMENTAL STUDY
 Experimental Study 42 CHAPTER 3 EXPERIMENTAL STUDY 3.1. INTRODUCTION The experimental study that has been carried out in this thesis has two main objectives: 1. Characterise the concrete behaviour in mode
Discrete Element Modelling of a Reinforced Concrete Structure
 Discrete Element Modelling of a Reinforced Concrete Structure S. Hentz, L. Daudeville, F.-V. Donzé Laboratoire Sols, Solides, Structures, Domaine Universitaire, BP 38041 Grenoble Cedex 9 France sebastian.hentz@inpg.fr
A NEW ROCK BOLT CONCEPT FOR UNDERGROUND EXCAVATIONS UNDER HIGH STRESS CONDITIONS
 A NEW ROCK BOLT CONCEPT FOR UNDERGROUND EXCAVATIONS UNDER HIGH STRESS CONDITIONS François Charette 1 and Michel Plouffe 2 1 Atlas Copco MAI, 2 CANMET-MMSL, Natural Resources Canada Abstract This paper
FATIGUE DAMAGE PROGRESSION IN PLASTICS DURING CYCLIC BALL INDENTATION
 FATIGUE DAMAGE PROGRESSION IN PLASTICS DURING CYCLIC BALL INDENTATION AKIO YONEZU, TAKAYASU HIRAKAWA, TAKESHI OGAWA and MIKIO TAKEMOTO Department of Mechanical Engineering, College of Science and Engineering,
Design of a fastener based on negative Poisson's ratio foam adapted from
 1 Design of a fastener based on negative Poisson's ratio foam adapted from Choi, J. B. and Lakes, R. S., "Design of a fastener based on negative Poisson's ratio foam", Cellular Polymers, 10, 205-212 (1991).
Fig. 1. Different locus of failure and crack trajectories observed in mode I testing of adhesively bonded double cantilever beam (DCB) specimens.
 specimens.") a). Cohesive Failure b). Interfacial Failure c). Oscillatory Failure d). Alternating Failure Fig. 1. Different locus of failure and crack trajectories observed in mode I testing of adhesively bonded double
a). Cohesive Failure b). Interfacial Failure c). Oscillatory Failure d). Alternating Failure Fig. 1. Different locus of failure and crack trajectories observed in mode I testing of adhesively bonded double
The Frictional Regime
 The Frictional Regime Processes in Structural Geology & Tectonics Ben van der Pluijm WW Norton+Authors, unless noted otherwise 1/25/2016 10:08 AM We Discuss The Frictional Regime Processes of Brittle Deformation