11/16/2017. Chapter. Copyright 2009 by The McGraw-Hill Companies, Inc. 7-2
|
|
|
- Darleen Malone
- 6 years ago
- Views:
Transcription

.")
1 7 Chapter Continuous Probability Distributions Describing a Continuous Distribution Uniform Continuous Distribution Normal Distribution Normal Approximation to the Binomial Normal Approximation to the Poisson Exponential Distribution Triangular Distribution McGraw-Hill/Irwin Copyright 2009 by The McGraw-Hill Companies, Inc. Continuous Variables Events as Intervals Discrete Variable each value of X has its own probability P(X). Continuous Variable events are intervals and probabilities are areas underneath smooth curves. A single point has no probability
 at each possible value of X over the range of")

2 Describing a Continuous Distribution PDFs and CDFs Probability Density Function (PDF) For a continuous random variable, the PDF is an equation that shows the height of the curve f(x) at each possible value of X over the range of X. 7-3 Describing a Continuous Distribution PDFs and CDFs Continuous PDF s: Denoted f(x) Must be nonnegative Total area under curve = 1 Mean, variance and shape depend on the PDF parameters Reveals the shape of the distribution Normal PDF 7-4 2


3 Describing a Continuous Distribution PDFs and CDFs Continuous CDF s: Denoted F(x) Shows P(X < x), the cumulative proportion of scores Useful for finding probabilities 7-5 Describing a Continuous Distribution Probabilities as Areas Continuous probability functions are smooth curves. Unlike discrete distributions, the area at any single point = 0. The entire area under any PDF must be 1. Mean is the balance point of the distribution

4 Describing a Continuous Distribution Expected Value and Variance 7-7 Uniform Continuous Distribution Characteristics of the Uniform Distribution If X is a random variable that is uniformly distributed between a and b, its PDF has constant height. Denoted U(a,b) Area = base x height = (b-a) x 1/(b-a) =

/( )/(b b-a) 7-10 5")
5 Uniform Continuous Distribution Characteristics of the Uniform Distribution 7-9 Uniform Continuous Distribution Characteristics of the Uniform Distribution The CDF increases linearly to 1. CDF formula is (x-a)/( )/(b b-a)
6 Uniform Continuous Distribution Example: Anesthesia Effectiveness An oral surgeon injects a painkiller prior to extracting a tooth. Given the varying characteristics of patients, the dentist views the time for anesthesia effectiveness as a uniform random variable that takes between 15 minutes and 30 minutes. X is U(15 15,, 30 30)) a = 15 15,, b = 30 30,, find the mean and standard deviation Uniform Continuous Distribution Example: Anesthesia Effectiveness m= a + b = = minutes ))2 = 4.33 minutes (b a)2 = (30 15 s= Find the probability that the anesthetic takes between 20 and 25 minutes. P(c < X < d) = (d (d c)/( )/(b b a) P(20 < X < 25 25)) = ( )/( )/( )) = 5/15 = or % %
. ).")
7 Uniform Continuous Distribution Example: Anesthesia Effectiveness P(20 < X < 25 25)) 7-13 Normal Distribution Characteristics of the Normal Distribution Normal or Gaussian distribution was named for German mathematician Karl Gauss (1777 ( ). ). Defined by two parameters, mand s Denoted N(m, s) Domain is < X < + Almost all area under the normal curve is included in the range m 3s< X < m+ 3s
 reaches a")

8 Normal Distribution Characteristics of the Normal Distribution 7-15 Normal Distribution Characteristics of the Normal Distribution Normal PDF f(x) reaches a maximum at m and has points of inflection at m+ s Bell-shaped curve Figure


9 Normal Distribution Characteristics of the Normal Distribution Normal CDF Figure Normal Distribution Characteristics of the Normal Distribution All normal distributions have the same shape but differ in the axis scales. µ = 42.70mm σ = 0.01mm Diameters of golf balls µ = 70 σ = 10 CPA Exam Scores
10 Normal Distribution What is Normal? A normal random variable should: Be measured on a continuous scale. Possess clear central tendency. Have only one peak (unimodal (unimodal). ). Exhibit tapering tails. Be symmetric about the mean (equal tails) Characteristics of the Standard Normal Since for every value of mand s, there is a different normal distribution, we transform a normal random variable to a standard normal distribution with m= 0 and s= 1 using the formula: z= x m s Denoted N(0,1)
 reaches a maximum at 0")

11 Characteristics of the Standard Normal 7-21 Characteristics of the Standard Normal Standard normal PDF f(x) reaches a maximum at 0 and has points of inflection at +1. Shape is unaffected by the transformation. It is still a bellbellshaped curve. Figure
 is a definite integral of f(z).")
12 Characteristics of the Standard Normal Standard normal CDF Figure Characteristics of the Standard Normal A common scale from -3 to is used. Entire area under the curve is unity. The probability of an event P(z1 < Z < z2) is a definite integral of f(z). However, standard normal tables or Excel functions can be used to find the desired probabilities
: ): Figure 7.12 7-25 Table 7.")
13 Normal Areas from Appendix CC-1 Appendix CC-1 allows you to find the area under the curve from 0 to z. For example, find P(0 < Z < ): ): Figure Table
. ).")
) =.4750.4750 +.4750.4750 =.")
14 Normal Areas from Appendix CC-1 Now find P(Z < ): ): = Normal Areas from Appendix CC-1 Now find P(-1.96 < Z < ). ). Due to symmetry, P(-1.96 < Z) is the same as P(Z < ). ) So, P(-1.96 < Z < )) = =.9500 or 95 95% % of the area under the curve

. For example,.9500 P(Z < 1.96) P(Z < -1.96 96)) P(-1.96 < Z < 1.")
15 Basis for the Empirical Rule Approximately 95 95% % of the area under the curve is between + 2s Approximately % of the area under the curve is between + 3s 68.26% Figure Normal Areas from Appendix CC-2 Appendix CC-2 allows you to find the area under the curve from the left of z (similar to Excel). For example,.9500 P(Z < 1.96) P(Z < )) P(-1.96 < Z < )) Figure

16 Table Normal Areas from Appendices CC-1 or CC-2 Appendices CC-1 and CC-2 yield identical results. Use whichever table is easiest. Finding z for a Given Area Appendices CC-1 and CC-2 be used to find the z-value corresponding to a given probability. For example, what z-value defines the top 1% of a normal distribution? This implies that 49 49% % of the area lies between 0 and z


17 Finding z for a Given Area Look for an area of.4900 in Appendix C-1: Without interpolation, the closest we can get is z = Finding z for a Given Area Some important Normal areas: Table


18 Finding Normal Areas with Excel 7-35 Finding Normal Areas with Excel

19 Finding Normal Areas with Excel 7-37 Finding Normal Areas with Excel
? zjohn = x m = 86 75 = 11/7 = 1.57 7 s So John s score is 1.57 standard deviations about the mean. 7-39 Finding Areas by using Standardized Variables P(X < 86 86)) = P(Z < 1.57 57)) =.9418.")
20 Finding Areas by using Standardized Variables Suppose John took an economics exam and scored 86 points. The class mean was 75 with a standard deviation of 7. What percentile is John in (i.e., find P(X < 86 86)? )? zjohn = x m = = 11/7 = s So John s score is 1.57 standard deviations about the mean Finding Areas by using Standardized Variables P(X < 86 86)) = P(Z < )) = (from Appendix CC-2) So, John is approximately in the 94th percentile Figure
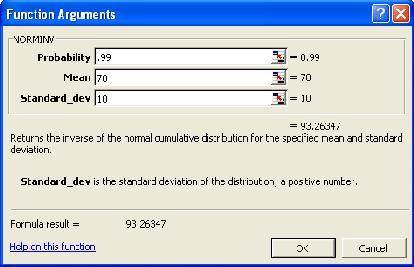
: x = m+ zs Here are some common percentiles 7-41 Using Excel Without Standardizing Excel s NORMDIST and NORMINV function allow you to evaluate areas without standardizing. For example, let m= 2.")
21 Inverse Normal You can manipulate the transformation formula to find the normal percentile values (e.g., 5th, 10th, 25th, etc.): x = m+ zs Here are some common percentiles 7-41 Using Excel Without Standardizing Excel s NORMDIST and NORMINV function allow you to evaluate areas without standardizing. For example, let m= cm and s= cm, what is the probability that a given steel bearing will have a diameter between and cm? cm? In other words, P(2.039 < X < )) Excel only gives left tail areas, so break the formula into two, find P(X < )) and P(X < ), ), then subtract them to find the desired probability:
) =.9773.9773 -.1587 =.8186.8186 or 81 81.")

22 Using Excel Without Standardizing P(X < )) = P(X < )) = P(2.039 < X < )) = = or % 7-43 Normal Approximation to the Binomial When is Approximation Needed? Binomial probabilities are difficult to calculate when n is large. Use a normal approximation to the binomial. As n becomes large, the binomial bars become more continuous and smooth
23 Normal Approximation to the Binomial When is Approximation Needed? Rule of thumb: when np> 10 and n(1-p) > 10,, then it is appropriate to use the normal 10 approximation to the binomial. In this case, the binomial mean and standard deviation will be equal to the normal mand s, respectively. m= np s= np(1-p) 7-45 Normal Approximation to the Binomial Example Coin Flips If we were to flip a coin n = 32 times and p=.50.50,, are the requirements for a normal approximation to the binomial met? Are np> 10 and n(1-p) > 10 10?? np= 32 x = 16 n(1-p) = 32 x (1 ( )) = 16 So, a normal approximation can be used. When translating a discrete scale into a continuous scale, care must be taken about individual points

24 Normal Approximation to the Binomial Example Coin Flips For example, find the probability of more than 17 heads in 32 flips of a fair coin. This can be written as P(X > 18 18). ). However, more than actually falls between 17 and 18 on a discrete scale. Figure Normal Approximation to the Binomial Example Coin Flips Since the cutoff point for more than is halfway between 17 and 18 18,, we add 0.5 to the lower limit and find P(X > ). This addition to X is called the Continuity Correction.. Correction At this point, the problem can be completed as any normal distribution problem
.")
25 Normal Approximation to the Binomial Continuity Correction The table below shows some events and their cutoff point for the normal approximation Normal Approximation to the Poisson When is Approximation Needed? The normal approximation to the Poisson works best when lis large (e.g., when l exceeds the values in Appendix B). Set the normal mand sequal to the Poisson mean and standard deviation. m= l s= l
26 Normal Approximation to the Poisson Example Utility Bills On Wednesday between 10A.M. and noon customer billing inquiries arrive at a mean rate of 42 inquiries per hour at Consumers Energy. What is the probability of receiving more than 50 calls? l= 42 which is too big to use the Poisson table. Use the normal approximation with m= l= 42 s= l = 42 = Normal Approximation to the Poisson Example Utility Bills To find P(X > 50 50)) calls, use the continuitycontinuitycorrected cutoff point halfway between 50 and 51 (i.e., X = ). At this point, the problem can be completed as any normal distribution problem

27 Exponential Distribution Characteristics of the Exponential Distribution If events per unit of time follow a Poisson distribution, the waiting time until the next event follows the Exponential distribution. Waiting time until the next event is a continuous variable Exponential Distribution Characteristics of the Exponential Distribution

28 Exponential Distribution Characteristics of the Exponential Distribution Probability of waiting more than x Probability of waiting less than x 7-55 Exponential Distribution Example Customer Waiting Time Between 2P.M. and 4P.M. on Wednesday, patient insurance inquiries arrive at Blue Choice insurance at a mean rate of 2.2 calls per minute. What is the probability of waiting more than 30 seconds (i.e., 0.50 minutes) for the next call? Set l= 2.2 events/min and x = 0.50 min P(X > )) = e lx = e (2.2)()(00.5) = or % % chance of waiting more than 30 seconds for the next call
. Find the x-value that defines the upper 10 10%. %. 7-58 29")
29 Exponential Distribution Example Customer Waiting Time P(X > 0.50) P(X < 0.50) 7-57 Exponential Distribution Inverse Exponential If the mean arrival rate is 2.2 calls per minute, we want the 90th percentile for waiting time (the top 10 10% % of waiting time). Find the x-value that defines the upper 10 10%. %
. 7-59 Exponential Distribution Inverse Exponential Quartiles for Exponential with l= 2.2 Table 7.")
30 Exponential Distribution Inverse Exponential P(X < x) = or P(X > x) = So, e lx = lx = ln ln(. (.10 10)) = x = //l = //2.2 = min. 90% 90 % of the calls will arrive within minutes (62 (62..8 seconds) Exponential Distribution Inverse Exponential Quartiles for Exponential with l= 2.2 Table
.")
31 Exponential Distribution Mean Time Between Events Exponential waiting times are described as Mean time between events (MTBE) = 1/l 1/MTBE = l= mean events per unit of time In a hospital, if an event is patient arrivals in an ER, and the MTBE is 20 minutes, then l= 1/20 = 0.05 arrivals per minute (or 3/hour) Exponential Distribution Using Excel In Excel, use =EXPONDIST(x =EXPONDIST(x,l,1) to return the leftleft-tail area P(X < x). Relation Between Exponential and Poisson Table


32 Triangular Distribution Characteristics of the Triangular Distribution A simple distribution that can be symmetric or skewed. Ranges from a to b and has a mode or peak at c Denoted T(a,b,c) 7-63 Triangular Distribution Characteristics of the Triangular Distribution Table
 in Excel by summing RAND()+RAND().")
) closely resembles a standard normal distribution N(0 N(0, 1).")
33 Triangular Distribution Special Cases: Symmetric Triangular You can easily generate random triangular data T(0, 1, 2) in Excel by summing RAND()+RAND(). The triangular distribution T( ( ,, 0, )) closely resembles a standard normal distribution N(0 N(0, 1) Continuous Distributions Compared
34 Applied Statistics in Business & Economics End of Chapter
Common ontinuous random variables
 Common ontinuous random variables CE 311S Earlier, we saw a number of distribution families Binomial Negative binomial Hypergeometric Poisson These were useful because they represented common situations:
Applied Statistics and Probability for Engineers. Sixth Edition. Chapter 4 Continuous Random Variables and Probability Distributions.
 Applied Statistics and Probability for Engineers Sixth Edition Douglas C. Montgomery George C. Runger Chapter 4 Continuous Random Variables and Probability Distributions 4 Continuous CHAPTER OUTLINE Random
Chapter 4 Continuous Random Variables and Probability Distributions
 Applied Statistics and Probability for Engineers Sixth Edition Douglas C. Montgomery George C. Runger Chapter 4 Continuous Random Variables and Probability Distributions 4 Continuous CHAPTER OUTLINE 4-1
EXAM. Exam #1. Math 3342 Summer II, July 21, 2000 ANSWERS
 EXAM Exam # Math 3342 Summer II, 2 July 2, 2 ANSWERS i pts. Problem. Consider the following data: 7, 8, 9, 2,, 7, 2, 3. Find the first quartile, the median, and the third quartile. Make a box and whisker
Business Statistics. Chapter 6 Review of Normal Probability Distribution QMIS 220. Dr. Mohammad Zainal
 Department of Quantitative Methods & Information Systems Business Statistics Chapter 6 Review of Normal Probability Distribution QMIS 220 Dr. Mohammad Zainal Chapter Goals After completing this chapter,
Math/Stat 352 Lecture 9. Section 4.5 Normal distribution
 Math/Stat 352 Lecture 9 Section 4.5 Normal distribution 1 Abraham de Moivre, 1667-1754 Pierre-Simon Laplace (1749 1827) A French mathematician, who introduced the Normal distribution in his book The doctrine
MATH 3510: PROBABILITY AND STATS July 1, 2011 FINAL EXAM
 MATH 3510: PROBABILITY AND STATS July 1, 2011 FINAL EXAM YOUR NAME: KEY: Answers in blue Show all your work. Answers out of the blue and without any supporting work may receive no credit even if they are
Discrete and continuous
 Discrete and continuous A curve, or a function, or a range of values of a variable, is discrete if it has gaps in it - it jumps from one value to another. In practice in S2 discrete variables are variables
Random variables. DS GA 1002 Probability and Statistics for Data Science.
 Random variables DS GA 1002 Probability and Statistics for Data Science http://www.cims.nyu.edu/~cfgranda/pages/dsga1002_fall17 Carlos Fernandez-Granda Motivation Random variables model numerical quantities
18.05 Exam 1. Table of normal probabilities: The last page of the exam contains a table of standard normal cdf values.
 Name 18.05 Exam 1 No books or calculators. You may have one 4 6 notecard with any information you like on it. 6 problems, 8 pages Use the back side of each page if you need more space. Simplifying expressions:
Statistics 100A Homework 5 Solutions
 Chapter 5 Statistics 1A Homework 5 Solutions Ryan Rosario 1. Let X be a random variable with probability density function a What is the value of c? fx { c1 x 1 < x < 1 otherwise We know that for fx to
Dr. Junchao Xia Center of Biophysics and Computational Biology. Fall /13/2016 1/33
 BIO5312 Biostatistics Lecture 03: Discrete and Continuous Probability Distributions Dr. Junchao Xia Center of Biophysics and Computational Biology Fall 2016 9/13/2016 1/33 Introduction In this lecture,
Some Continuous Probability Distributions: Part I. Continuous Uniform distribution Normal Distribution. Exponential Distribution
 Some Continuous Probability Distributions: Part I Continuous Uniform distribution Normal Distribution Exponential Distribution 1 Chapter 6: Some Continuous Probability Distributions: 6.1 Continuous Uniform
Probability Distribution
 Economic Risk and Decision Analysis for Oil and Gas Industry CE81.98 School of Engineering and Technology Asian Institute of Technology January Semester Presented by Dr. Thitisak Boonpramote Department
Page Max. Possible Points Total 100
 Math 3215 Exam 2 Summer 2014 Instructor: Sal Barone Name: GT username: 1. No books or notes are allowed. 2. You may use ONLY NON-GRAPHING and NON-PROGRAMABLE scientific calculators. All other electronic
STAT Chapter 5 Continuous Distributions
 STAT 270 - Chapter 5 Continuous Distributions June 27, 2012 Shirin Golchi () STAT270 June 27, 2012 1 / 59 Continuous rv s Definition: X is a continuous rv if it takes values in an interval, i.e., range
Math 151. Rumbos Fall Solutions to Review Problems for Exam 2. Pr(X = 1) = ) = Pr(X = 2) = Pr(X = 3) = p X. (k) =
 = ) = Pr(X = 2) = Pr(X = 3) = p X. (k) =") Math 5. Rumbos Fall 07 Solutions to Review Problems for Exam. A bowl contains 5 chips of the same size and shape. Two chips are red and the other three are blue. Draw three chips from the bowl at random,
Math 5. Rumbos Fall 07 Solutions to Review Problems for Exam. A bowl contains 5 chips of the same size and shape. Two chips are red and the other three are blue. Draw three chips from the bowl at random,
Introduction to Probability and Statistics Twelfth Edition
 Introduction to Probability and Statistics Twelfth Edition Robert J. Beaver Barbara M. Beaver William Mendenhall Presentation designed and written by: Barbara M. Beaver Introduction to Probability and
Unit 4 Probability. Dr Mahmoud Alhussami
 Unit 4 Probability Dr Mahmoud Alhussami Probability Probability theory developed from the study of games of chance like dice and cards. A process like flipping a coin, rolling a die or drawing a card from
The normal distribution Mixed exercise 3
 The normal distribution Mixed exercise 3 ~ N(78, 4 ) a Using the normal CD function, P( 85).459....4 (4 d.p.) b Using the normal CD function, P( 8).6946... The probability that three men, selected at random,
Introduction and Overview STAT 421, SP Course Instructor
 Introduction and Overview STAT 421, SP 212 Prof. Prem K. Goel Mon, Wed, Fri 3:3PM 4:48PM Postle Hall 118 Course Instructor Prof. Goel, Prem E mail: goel.1@osu.edu Office: CH 24C (Cockins Hall) Phone: 614
1 Probability Distributions
 1 Probability Distributions In the chapter about descriptive statistics sample data were discussed, and tools introduced for describing the samples with numbers as well as with graphs. In this chapter
Page 312, Exercise 50
 Millersville University Name Answer Key Department of Mathematics MATH 130, Elements of Statistics I, Homework 4 November 5, 2009 Page 312, Exercise 50 Simulation According to the U.S. National Center
2. Suppose (X, Y ) is a pair of random variables uniformly distributed over the triangle with vertices (0, 0), (2, 0), (2, 1).
 is a pair of random variables uniformly distributed over the triangle with vertices (0, 0), (2, 0), (2, 1).") Name M362K Final Exam Instructions: Show all of your work. You do not have to simplify your answers. No calculators allowed. There is a table of formulae on the last page. 1. Suppose X 1,..., X 1 are independent
Name M362K Final Exam Instructions: Show all of your work. You do not have to simplify your answers. No calculators allowed. There is a table of formulae on the last page. 1. Suppose X 1,..., X 1 are independent
Name: Firas Rassoul-Agha
 Midterm 1 - Math 5010 - Spring 016 Name: Firas Rassoul-Agha Solve the following 4 problems. You have to clearly explain your solution. The answer carries no points. Only the work does. CALCULATORS ARE
Statistical Concepts. Distributions of Data
 Module : Review of Basic Statistical Concepts. Understanding Probability Distributions, Parameters and Statistics A variable that can take on any value in a range is called a continuous variable. Example:
STAT509: Continuous Random Variable
 University of South Carolina September 23, 2014 Continuous Random Variable A continuous random variable is a random variable with an interval (either finite or infinite) of real numbers for its range.
Business Statistics PROBABILITY DISTRIBUTIONS
 Business Statistics PROBABILITY DISTRIBUTIONS CONTENTS Probability distribution functions (discrete) Characteristics of a discrete distribution Example: uniform (discrete) distribution Example: Bernoulli
Chapter 4: Continuous Probability Distributions
 Chapter 4: Continuous Probability Distributions Seungchul Baek Department of Statistics, University of South Carolina STAT 509: Statistics for Engineers 1 / 57 Continuous Random Variable A continuous random
Chapter Learning Objectives. Probability Distributions and Probability Density Functions. Continuous Random Variables
 Chapter 4: Continuous Random Variables and Probability s 4-1 Continuous Random Variables 4-2 Probability s and Probability Density Functions 4-3 Cumulative Functions 4-4 Mean and Variance of a Continuous
Special distributions
 Special distributions August 22, 2017 STAT 101 Class 4 Slide 1 Outline of Topics 1 Motivation 2 Bernoulli and binomial 3 Poisson 4 Uniform 5 Exponential 6 Normal STAT 101 Class 4 Slide 2 What distributions
Some Statistics. V. Lindberg. May 16, 2007
 Some Statistics V. Lindberg May 16, 2007 1 Go here for full details An excellent reference written by physicists with sample programs available is Data Reduction and Error Analysis for the Physical Sciences,
STAT 516 Midterm Exam 2 Friday, March 7, 2008
 STAT 516 Midterm Exam 2 Friday, March 7, 2008 Name Purdue student ID (10 digits) 1. The testing booklet contains 8 questions. 2. Permitted Texas Instruments calculators: BA-35 BA II Plus BA II Plus Professional
Discrete Probability Distributions
 Discrete Probability Distributions Chapter 06 McGraw-Hill/Irwin Copyright 2013 by The McGraw-Hill Companies, Inc. All rights reserved. LEARNING OBJECTIVES LO 6-1 Identify the characteristics of a probability
Lecture 10: Normal RV. Lisa Yan July 18, 2018
 Lecture 10: Normal RV Lisa Yan July 18, 2018 Announcements Midterm next Tuesday Practice midterm, solutions out on website SCPD students: fill out Google form by today Covers up to and including Friday
Normal Distribution and Central Limit Theorem
 Normal Distribution and Central Limit Theorem Josemari Sarasola Statistics for Business Josemari Sarasola Normal Distribution and Central Limit Theorem 1 / 13 The normal distribution is the most applied
IC 102: Data Analysis and Interpretation
 IC 102: Data Analysis and Interpretation Instructor: Guruprasad PJ Dept. Aerospace Engineering Indian Institute of Technology Bombay Powai, Mumbai 400076 Email: pjguru@aero.iitb.ac.in Phone no.: 2576 7142
Continuous-Valued Probability Review
 CS 6323 Continuous-Valued Probability Review Prof. Gregory Provan Department of Computer Science University College Cork 2 Overview Review of discrete distributions Continuous distributions 3 Discrete
Chapter 6 Continuous Probability Distributions
 Continuous Probability Distributions Learning Objectives 1. Understand the difference between how probabilities are computed for discrete and continuous random variables. 2. Know how to compute probability
Chapter 4 - Lecture 3 The Normal Distribution
 Chapter 4 - Lecture 3 The October 28th, 2009 Chapter 4 - Lecture 3 The Standard Chapter 4 - Lecture 3 The Standard Normal distribution is a statistical unicorn It is the most important distribution in
Probability Distributions for Continuous Variables. Probability Distributions for Continuous Variables
 Probability Distributions for Continuous Variables Probability Distributions for Continuous Variables Let X = lake depth at a randomly chosen point on lake surface If we draw the histogram so that the
Chapter 8: Continuous Probability Distributions
 Chapter 8: Continuous Probability Distributions 8.1 Introduction This chapter continued our discussion of probability distributions. It began by describing continuous probability distributions in general,
Statistical Distributions and Uncertainty Analysis. QMRA Institute Patrick Gurian
 Statistical Distributions and Uncertainty Analysis QMRA Institute Patrick Gurian Probability Define a function f(x) probability density distribution function (PDF) Prob [A
Chapter 4: Continuous Random Variable
 Chapter 4: Continuous Random Variable Shiwen Shen University of South Carolina 2017 Summer 1 / 57 Continuous Random Variable A continuous random variable is a random variable with an interval (either finite
S n = x + X 1 + X X n.
 0 Lecture 0 0. Gambler Ruin Problem Let X be a payoff if a coin toss game such that P(X = ) = P(X = ) = /2. Suppose you start with x dollars and play the game n times. Let X,X 2,...,X n be payoffs in each
ECE 302, Final 3:20-5:20pm Mon. May 1, WTHR 160 or WTHR 172.
 ECE 302, Final 3:20-5:20pm Mon. May 1, WTHR 160 or WTHR 172. 1. Enter your name, student ID number, e-mail address, and signature in the space provided on this page, NOW! 2. This is a closed book exam.
Statistical Preliminaries. Stony Brook University CSE545, Fall 2016
 Statistical Preliminaries Stony Brook University CSE545, Fall 2016 Random Variables X: A mapping from Ω to R that describes the question we care about in practice. 2 Random Variables X: A mapping from
Introduction to Statistical Data Analysis Lecture 3: Probability Distributions
 Introduction to Statistical Data Analysis Lecture 3: Probability Distributions James V. Lambers Department of Mathematics The University of Southern Mississippi James V. Lambers Statistical Data Analysis
2014 SM4 Revision Questions Distributions
 2014 SM4 Revision Questions Distributions Normal Q1. Professor Halen has 184 students in his college mathematics class. The scores on the semester exam are normally distributed with a mean of 72.3 and
Question Points Score Total: 76
 Math 447 Test 2 March 17, Spring 216 No books, no notes, only SOA-approved calculators. true/false or fill-in-the-blank question. You must show work, unless the question is a Name: Question Points Score
Part 3: Parametric Models
 Part 3: Parametric Models Matthew Sperrin and Juhyun Park April 3, 2009 1 Introduction Is the coin fair or not? In part one of the course we introduced the idea of separating sampling variation from a
Discrete Probability Distributions
 Discrete Probability Distributions Chapter 6 McGraw-Hill/Irwin Copyright 2012 by The McGraw-Hill Companies, Inc. All rights reserved. LO5 Describe and compute probabilities for a binomial distribution.
Chapter 4: Continuous Random Variables and Probability Distributions
 Chapter 4: and Probability Distributions Walid Sharabati Purdue University February 14, 2014 Professor Sharabati (Purdue University) Spring 2014 (Slide 1 of 37) Chapter Overview Continuous random variables
Chapter 7: Theoretical Probability Distributions Variable - Measured/Categorized characteristic
 BSTT523: Pagano & Gavreau, Chapter 7 1 Chapter 7: Theoretical Probability Distributions Variable - Measured/Categorized characteristic Random Variable (R.V.) X Assumes values (x) by chance Discrete R.V.
Stat 2300 International, Fall 2006 Sample Midterm. Friday, October 20, Your Name: A Number:
 Stat 2300 International, Fall 2006 Sample Midterm Friday, October 20, 2006 Your Name: A Number: The Midterm consists of 35 questions: 20 multiple-choice questions (with exactly 1 correct answer) and 15
Midterm Exam 1 Solution
 EECS 126 Probability and Random Processes University of California, Berkeley: Fall 2015 Kannan Ramchandran September 22, 2015 Midterm Exam 1 Solution Last name First name SID Name of student on your left:
Part 3: Parametric Models
 Part 3: Parametric Models Matthew Sperrin and Juhyun Park August 19, 2008 1 Introduction There are three main objectives to this section: 1. To introduce the concepts of probability and random variables.
functions Poisson distribution Normal distribution Arbitrary functions
 Physics 433: Computational Physics Lecture 6 Random number distributions Generation of random numbers of various distribuition functions Normal distribution Poisson distribution Arbitrary functions Random
Chapter 1: Revie of Calculus and Probability
 Chapter 1: Revie of Calculus and Probability Refer to Text Book: Operations Research: Applications and Algorithms By Wayne L. Winston,Ch. 12 Operations Research: An Introduction By Hamdi Taha, Ch. 12 OR441-Dr.Khalid
IV. The Normal Distribution
 IV. The Normal Distribution The normal distribution (a.k.a., the Gaussian distribution or bell curve ) is the by far the best known random distribution. It s discovery has had such a far-reaching impact
Continuous Random Variables. What continuous random variables are and how to use them. I can give a definition of a continuous random variable.
 Continuous Random Variables Today we are learning... What continuous random variables are and how to use them. I will know if I have been successful if... I can give a definition of a continuous random
Density Curves and the Normal Distributions. Histogram: 10 groups
 Density Curves and the Normal Distributions MATH 2300 Chapter 6 Histogram: 10 groups 1 Histogram: 20 groups Histogram: 40 groups 2 Histogram: 80 groups Histogram: 160 groups 3 Density Curve Density Curves
Exponential, Gamma and Normal Distribuions
 Exponential, Gamma and Normal Distribuions Sections 5.4, 5.5 & 6.5 Cathy Poliak, Ph.D. cathy@math.uh.edu Office in Fleming 11c Department of Mathematics University of Houston Lecture 9-3339 Cathy Poliak,
Chapter 3 Single Random Variables and Probability Distributions (Part 1)
") Chapter 3 Single Random Variables and Probability Distributions (Part 1) Contents What is a Random Variable? Probability Distribution Functions Cumulative Distribution Function Probability Density Function
Chapter 3 Single Random Variables and Probability Distributions (Part 1) Contents What is a Random Variable? Probability Distribution Functions Cumulative Distribution Function Probability Density Function
Test 2 VERSION A STAT 3090 Fall 2017
 Multiple Choice: (Questions 1 20) Answer the following questions on the scantron provided using a #2 pencil. Bubble the response that best answers the question. Each multiple choice correct response is
Relationship between probability set function and random variable - 2 -
 2.0 Random Variables A rat is selected at random from a cage and its sex is determined. The set of possible outcomes is female and male. Thus outcome space is S = {female, male} = {F, M}. If we let X be
Massachusetts Institute of Technology Department of Electrical Engineering & Computer Science 6.041/6.431: Probabilistic Systems Analysis
 6.04/6.43: Probabilistic Systems Analysis Question : Multiple choice questions. CLEARLY circle the best answer for each question below. Each question is worth 4 points each, with no partial credit given.
Probability and Statistics Concepts
 University of Central Florida Computer Science Division COT 5611 - Operating Systems. Spring 014 - dcm Probability and Statistics Concepts Random Variable: a rule that assigns a numerical value to each
BIOSTATISTICS. Lecture 3 Continuous Probability Distributions. dr. Petr Nazarov
 Genomics Research Unit BIOSTATISTICS Lecture 3 Continuous Probability Distributions dr. Petr Nazarov 7-0-015 6-03-015 petr.nazarov@crp-sante.lu Lecture 3. Continuous probability distributions OUTLINE Lecture
STAT 430/510 Probability Lecture 12: Central Limit Theorem and Exponential Distribution
 STAT 430/510 Probability Lecture 12: Central Limit Theorem and Exponential Distribution Pengyuan (Penelope) Wang June 15, 2011 Review Discussed Uniform Distribution and Normal Distribution Normal Approximation
Probability Density Functions and the Normal Distribution. Quantitative Understanding in Biology, 1.2
 Probability Density Functions and the Normal Distribution Quantitative Understanding in Biology, 1.2 1. Discrete Probability Distributions 1.1. The Binomial Distribution Question: You ve decided to flip
4: Probability. Rarely is it possible to make assertions about populations* with complete certainty.
 4: Probability Rarely is it possible to make assertions about populations* with complete certainty. * Statistical populations may be real or hypothetical see Chap 1. 4: Probability 1 Definitions of Probability
Final Exam STAT On a Pareto chart, the frequency should be represented on the A) X-axis B) regression C) Y-axis D) none of the above
 X-axis B) regression C) Y-axis D) none of the above") King Abdul Aziz University Faculty of Sciences Statistics Department Final Exam STAT 0 First Term 49-430 A 40 Name No ID: Section: You have 40 questions in 9 pages. You have 90 minutes to solve the exam.
King Abdul Aziz University Faculty of Sciences Statistics Department Final Exam STAT 0 First Term 49-430 A 40 Name No ID: Section: You have 40 questions in 9 pages. You have 90 minutes to solve the exam.
Continuous random variables
 Continuous random variables A continuous random variable X takes all values in an interval of numbers. The probability distribution of X is described by a density curve. The total area under a density
Probability Density Functions
 Probability Density Functions Probability Density Functions Definition Let X be a continuous rv. Then a probability distribution or probability density function (pdf) of X is a function f (x) such that
STATISTICS 1 REVISION NOTES
 STATISTICS 1 REVISION NOTES Statistical Model Representing and summarising Sample Data Key words: Quantitative Data This is data in NUMERICAL FORM such as shoe size, height etc. Qualitative Data This is
Applied Statistics I
 Applied Statistics I (IMT224β/AMT224β) Department of Mathematics University of Ruhuna A.W.L. Pubudu Thilan Department of Mathematics University of Ruhuna Applied Statistics I(IMT224β/AMT224β) 1/158 Chapter
Chapitre 3. 5: Several Useful Discrete Distributions
 Chapitre 3 5: Several Useful Discrete Distributions 5.3 The random variable x is not a binomial random variable since the balls are selected without replacement. For this reason, the probability p of choosing
Independent Events. Two events are independent if knowing that one occurs does not change the probability of the other occurring
 Independent Events Two events are independent if knowing that one occurs does not change the probability of the other occurring Conditional probability is denoted P(A B), which is defined to be: P(A and
Notes on Continuous Random Variables
 Notes on Continuous Random Variables Continuous random variables are random quantities that are measured on a continuous scale. They can usually take on any value over some interval, which distinguishes
EECS 126 Probability and Random Processes University of California, Berkeley: Fall 2014 Kannan Ramchandran September 23, 2014.
 EECS 126 Probability and Random Processes University of California, Berkeley: Fall 2014 Kannan Ramchandran September 23, 2014 Midterm Exam 1 Last name First name SID Rules. DO NOT open the exam until instructed
Chapter 5. Means and Variances
 1 Chapter 5 Means and Variances Our discussion of probability has taken us from a simple classical view of counting successes relative to total outcomes and has brought us to the idea of a probability
IEOR 3106: Introduction to Operations Research: Stochastic Models. Professor Whitt. SOLUTIONS to Homework Assignment 2
 IEOR 316: Introduction to Operations Research: Stochastic Models Professor Whitt SOLUTIONS to Homework Assignment 2 More Probability Review: In the Ross textbook, Introduction to Probability Models, read
STAT 418: Probability and Stochastic Processes
 STAT 418: Probability and Stochastic Processes Spring 2016; Homework Assignments Latest updated on April 29, 2016 HW1 (Due on Jan. 21) Chapter 1 Problems 1, 8, 9, 10, 11, 18, 19, 26, 28, 30 Theoretical
STAT 414: Introduction to Probability Theory
 STAT 414: Introduction to Probability Theory Spring 2016; Homework Assignments Latest updated on April 29, 2016 HW1 (Due on Jan. 21) Chapter 1 Problems 1, 8, 9, 10, 11, 18, 19, 26, 28, 30 Theoretical Exercises
Counting principles, including permutations and combinations.
 1 Counting principles, including permutations and combinations. The binomial theorem: expansion of a + b n, n ε N. THE PRODUCT RULE If there are m different ways of performing an operation and for each
1 Continuous Probability Distributions
 1 Continuous Probability Distributions 1.1 Normal Distribution Function 1.1.1 Exercise 1 Suppose that the amount of time to assemble a computer is normally distributed with a mean = 50 minutes and a standard
Chapter 2: Random Variables
 ECE54: Stochastic Signals and Systems Fall 28 Lecture 2 - September 3, 28 Dr. Salim El Rouayheb Scribe: Peiwen Tian, Lu Liu, Ghadir Ayache Chapter 2: Random Variables Example. Tossing a fair coin twice:
THE QUEEN S UNIVERSITY OF BELFAST
 THE QUEEN S UNIVERSITY OF BELFAST 0SOR20 Level 2 Examination Statistics and Operational Research 20 Probability and Distribution Theory Wednesday 4 August 2002 2.30 pm 5.30 pm Examiners { Professor R M
Mean/Average Median Mode Range
 Normal Curves Today s Goals Normal curves! Before this we need a basic review of statistical terms. I mean basic as in underlying, not easy. We will learn how to retrieve statistical data from normal curves.
MATH 3670 First Midterm February 17, No books or notes. No cellphone or wireless devices. Write clearly and show your work for every answer.
 No books or notes. No cellphone or wireless devices. Write clearly and show your work for every answer. Name: Question: 1 2 3 4 Total Points: 30 20 20 40 110 Score: 1. The following numbers x i, i = 1,...,
Lecture 14. More discrete random variables
 18.440: Lecture 14 More discrete random variables Scott Sheffield MIT 1 Outline Geometric random variables Negative binomial random variables Problems 2 Outline Geometric random variables Negative binomial
CHAPTER 14 THEORETICAL DISTRIBUTIONS
 CHAPTER 14 THEORETICAL DISTRIBUTIONS THEORETICAL DISTRIBUTIONS LEARNING OBJECTIVES The Students will be introduced in this chapter to the techniques of developing discrete and continuous probability distributions
2. The Standard Normal Distribution can be described as a. N(0,1) b.n(1,0)
 b.n(1,0)") Practice Questions for Exam 1 Questions 1-4 General Questions 1.Find P(Z> 1.48). a. 0.0694 b.0.0808 c.0.9192 d.0.9306 e.none of the above 2. The Standard Normal Distribution can be described as a. N(0,1)
Practice Questions for Exam 1 Questions 1-4 General Questions 1.Find P(Z> 1.48). a. 0.0694 b.0.0808 c.0.9192 d.0.9306 e.none of the above 2. The Standard Normal Distribution can be described as a. N(0,1)
STAT100 Elementary Statistics and Probability
 STAT100 Elementary Statistics and Probability Exam, Monday, August 11, 014 Solution Show all work clearly and in order, and circle your final answers. Justify your answers algebraically whenever possible.
EECS 126 Probability and Random Processes University of California, Berkeley: Spring 2015 Abhay Parekh February 17, 2015.
 EECS 126 Probability and Random Processes University of California, Berkeley: Spring 2015 Abhay Parekh February 17, 2015 Midterm Exam Last name First name SID Rules. You have 80 mins (5:10pm - 6:30pm)
Guidelines for Solving Probability Problems
 Guidelines for Solving Probability Problems CS 1538: Introduction to Simulation 1 Steps for Problem Solving Suggested steps for approaching a problem: 1. Identify the distribution What distribution does
Chapter 3 Discrete Random Variables
 MICHIGAN STATE UNIVERSITY STT 351 SECTION 2 FALL 2008 LECTURE NOTES Chapter 3 Discrete Random Variables Nao Mimoto Contents 1 Random Variables 2 2 Probability Distributions for Discrete Variables 3 3 Expected
Quantitative Methods Chapter 0: Review of Basic Concepts 0.1 Business Applications (II) 0.2 Business Applications (III)
 0.2 Business Applications (III)") Quantitative Methods Chapter 0: Review of Basic Concepts 0.1 Business Applications (II) 0.1.1 Simple Interest 0.2 Business Applications (III) 0.2.1 Expenses Involved in Buying a Car 0.2.2 Expenses Involved
Quantitative Methods Chapter 0: Review of Basic Concepts 0.1 Business Applications (II) 0.1.1 Simple Interest 0.2 Business Applications (III) 0.2.1 Expenses Involved in Buying a Car 0.2.2 Expenses Involved
Distribusi Binomial, Poisson, dan Hipergeometrik
 Distribusi Binomial, Poisson, dan Hipergeometrik CHAPTER TOPICS The Probability of a Discrete Random Variable Covariance and Its Applications in Finance Binomial Distribution Poisson Distribution Hypergeometric